Market Minds Advisory
Micrometers Market

Micrometers Market: Micrometers Market. Digital Automation and Competitive Outlook 2026 to 2036

Precision manufacturers racing to verify dimensional tolerance without slowing production lines are forcing a decade-long shift from handheld mechanical gauging toward automated inline measurement systems built for continuous unattended inspection.

Lead Analyst

Published

October 2026

Make Smarter Decisions with Customized Research Insights

Request a free sample report and evaluate market opportunities, growth trends, and competitive dynamics relevant to your business needs.

2025 MARKET VALUE$1.2BMarket Size 2025
2036 FORECAST VALUE$2.2BBase Case , 2026 to 2036
CAGR 2026 TO 20365.5 %Bull 6.8% / Bear 4.2%
INCREMENTAL OPPORTUNITY$0.9BNet 10- year value creation
EXPANSION MULTIPLE1.71x2036 value over 2026 base
Strategic Levers
M&A Pipeline
Regional Outlook
Country Rankings
Competitive Intelligence
Segmental Deep-dive
Call-Us : 91 93563 13602

Executive Snapshot and Market Trajectory.

Precision manufacturers are replacing handheld mechanical micrometers with automated inline gauging systems as dimensional tolerance verification and production throughput requirements tighten across automotive and aerospace component programs worldwide. This substitution is accelerating fastest among large export-oriented component manufacturers serving global supply chains, a dynamic reshaping capital allocation decisions across the.
Japan, China, and Germany together account for the largest share of unit demand, since dense precision manufacturing activity in these markets drives higher purchase frequency than anywhere else tracked in this analysis. Laser non-contact micrometers are winning growing specification share among electronics and medical device manufacturers, since contact-free dimensional verification matters directly to producers managing delicate component measurement at scale across high-speed production lines.
Mitutoyo Corporation and Mahr GmbH compete against precision specialists like Tesa Technology and Starrett on overlapping but distinct measurement categories, since precision manufacturers increasingly demand full automation and non-contact capability that general hand tool brands were not originally built to deliver at scale. Precision manufacturing capacity expansion and inline quality control mandates remain the clearest signal suppliers track heading into next year's equipment replacement decisions across every major manufacturing region tracked currently.
Market Definition
This analysis covers instruments that measure linear dimensions to precision tolerances, including mechanical and vernier, digital electronic, laser non-contact, bore and internal, and automated inline gauging micrometer systems. It excludes general calipers and dial indicators sold without micrometer-grade precision, coordinate measuring machines, and surface roughness testers sold without linear dimensional measurement capability.
Base Year Value
$1.2B in 2025 (MMA Primary Research Dataset, October 2026)
Forecast Period
2026 to 2036, eleven discrete annual values
CAGR
5.5% base case. Bull 6.8%. Bear 4.2%.
Fastest Growth Segment
Automated Inline Gauging Micrometer Systems: 9.0% CAGR
Fastest Growth Country
Vietnam: 7.6% CAGR
Fastest Growth Region
South Asia and Pacific: 7.6% CAGR
Largest Region
East Asia: 30% of 2025 global value
Market Leaders
Mitutoyo Corporation, Mahr GmbH, Tesa Technology, Starrett, and Sylvac SA lead the market. Source: MMA Primary Research Dataset, July 2026.
Primary Survey
n=3,800 procurement and R&D decision-makers, Q4 2025, six countries
Methodology
Demand-side build-up, cross-validated against public data, 47 expert interviews

Micrometers Market Forecast Scenarios

micrometers-market-size-forecast-scenario-1791128902495
Micrometer demand through 2020 to 2025 grew steadily as precision manufacturing capacity expanded globally and quality control standards tightened, with mechanical and basic digital units still handling most unit volume across smaller manufacturers through the period. Historical growth ran near 4.9 percent annually as early automation adopters validated throughput gains before broader manufacturer adoption began building through the period's second half.
The base case assumes expanding precision manufacturing capacity continues pushing automated inline verification and non-contact measurement through the forecast period, laser non-contact micrometers keep capturing growing specification share as component costs decline, and large manufacturers continue standardizing on automated platforms ahead of smaller independent producers. These three mechanisms together support steady expansion through 2036 across the global installed base this entire decade broadly today. This pattern should hold through most of the forecast window ahead.
The bull case centers on faster-than-expected precision manufacturing capacity expansion pulling forward wholesale replacement of handheld mechanical micrometers across multiple production categories simultaneously. The bear case centers on manufacturing capital spending pullback or prolonged quality standard harmonization delays slowing premium automation adoption, keeping growth closer to historical trend among price-sensitive smaller manufacturers tracked currently today.

Automation Reshapes Precision Measurement Specification

Micrometers measure linear dimensions to precision tolerances, with configuration choice increasingly determined by automation and non-contact measurement capability requirements rather than purely upfront instrument cost, a shift reshaping how precision manufacturers plan capital budgets across multi-year quality control expansion programs this decade.
TOP SUPPLIER CONCENTRATION46%Five suppliers account for nearly half of sales
DIGITAL ADOPTION RATE38%Share of new units sold with digital or automated readout
TYPICAL MEASUREMENT ACCURACY0.001-0.01 millimetersStandard precision tolerance held across premium instrument categories
AUTOMOTIVE DEMAND SHARE52%Portion of total unit volume tied to automotive and aerospace.
AVERAGE INSTRUMENT SERVICE LIFE10-14 yearsTypical calibration interval before most units need replacement
AUTOMATED SYSTEM REVENUE SHARE23%Portion of total revenue tied to automated inline system content
Precision manufacturing capacity expansion across Japan, China, and Germany drives the largest share of specification decisions, since manufacturers face rising dimensional verification requirements that handheld mechanical units handle less effectively than automated alternatives without adding manual inspection labor. Laser non-contact micrometers are capturing growing specification share specifically because they deliver the contact-free verification that delicate electronics and medical device production requires, an advantage that matters directly to manufacturers managing extended high-speed production runs today.
Diversified manufacturers like Mitutoyo Corporation and Mahr GmbH bring broad precision instrument platform scale across multiple measurement categories, while specialists like Tesa Technology and Starrett compete on automated inline and non-contact engineering focus that larger catalog manufacturers sometimes deprioritize. Precision manufacturer capacity expansion timing increasingly shapes which suppliers can compete for the largest multi-unit deployment contracts, a dynamic reshuffling supplier shortlists faster than any single launch currently planned by established manufacturers.
"A handheld mechanical micrometer used to mean a quality inspector pulling parts off the line and measuring each one by hand between production batches. Now an automated inline gauging system measures every single part as it passes without stopping the line at all, and that automation shift is doing more to reshape manufacturer purchasing decisions than any single digital readout upgrade ever did."
Head of Precision Measurement Instrument Research, Manufacturing Quality Technology Practice · MMA Construction and Industrial Equipment Practice · October 2026

Market Trends

Full Inline Automation Rapidly Expands Gauging Demand

Precision manufacturers across major manufacturing regions are increasingly installing automated inline gauging micrometer systems rather than relying solely on handheld mechanical units, since full automation eliminates the manual sampling delay that handheld units still carry across continuous production applications. This shift is reshaping manufacturer product roadmaps, since inline systems require more sophisticated sensor and software engineering than handheld designs ever needed. Automated inline systems now account for an estimated 23 percent of new unit purchases completed across the industry to date. Suppliers lagging this shift risk losing the largest contracts entirely.
Market Impact: 1.6x faster growth from capacity-driven orders
Non-Contact Measurement Rapidly Widens Electronics Adoption

Electronics and medical device manufacturers managing delicate component production are increasingly specifying laser non-contact micrometers that deliver contact-free dimensional verification under extreme production volume, since non-contact capability eliminates the surface damage risk that standard contact-based measurement still carries across demanding delicate component applications. This shift is forcing traditional micrometer manufacturers to adapt their product lines toward laser engineering rather than standard contact specifications alone. Non-contact measurement now cuts surface damage incidents by roughly 29 percent across adopting manufacturers tracked in this analysis currently. Several large electronics brands now require non-contact specification as a standard production condition.
Market Impact: Automated demand grows 1.5x faster overall

Market Opportunities and Growth Drivers

Precision Manufacturing Expansion Sharply Accelerates Demand

Expanding precision manufacturing capacity across Japan, China, and Germany is forcing manufacturers to sustain dimensional verification precision far beyond what handheld mechanical units can economically support under rising production volume requirements, pulling forward automated adoption that would otherwise have spread more evenly across normal equipment replacement cycles. Manufacturers facing the steepest capacity-driven demand growth are increasingly prioritizing automation retrofits across their highest-volume production lines first, concentrating near-term demand among suppliers able to deliver integrated systems quickly. Suppliers positioned closest to these manufacturers are capturing the largest share of this acceleration.
Market Impact: Cost barriers limit adoption 17% broadly

Quality Standard Tightening Widens Automated Adoption

Tightening dimensional tolerance and quality certification requirements across major automotive and aerospace markets are making automated inline gauging systems economically attractive for a broader range of manufacturers than was true when handheld measurement remained the lower-cost default option industry wide. Manufacturers evaluating equipment purchases increasingly factor inspection labor reduction into total cost of ownership calculations rather than comparing equipment purchase price in isolation alone. Automated specification is growing roughly 1.5 times faster than handheld specification across industrial customers tracked in this analysis currently. Suppliers marketing inspection labor reduction are winning a growing share of these conversions.
Market Impact: Calibration delays extend rollout 13% broadly

Market Restraints and Challenges

High Upfront Cost Slows Smaller Manufacturer Adoption

Automated inline gauging systems and laser non-contact micrometers carry a substantially higher upfront cost than handheld mechanical units, creating an adoption barrier that slows automation among smaller independent manufacturers without access to the capital that large precision companies use for equipment upgrades. The root cause is that automated platforms require sensors, software, and programmable control components that handheld designs simply do not need. This gap is keeping handheld mechanical units the default choice among smaller manufacturers despite higher long-term manual inspection labor cost exposure. Suppliers are mitigating the barrier through leasing programs targeting smaller manufacturer operators.
Market Impact: 23% of purchases now fully automated

Surface Finish Variability Further Complicates Calibration

Many manufacturers remain cautious about deploying automated measurement control directly across every surface finish specification, since variable surface reflectivity and texture can affect laser measurement accuracy in ways that standard calibration profiles do not always anticipate. The root cause is that different surface finishes respond differently to laser reflection parameters that standard calibration was not originally designed to accommodate. This gap is extending qualification timelines at several manufacturers introducing new surface finish specifications. Suppliers are mitigating the concern by offering finish-specific calibration profile libraries and remote calibration support services. This friction is most visible during enterprise-wide rollout phases.
Market Impact: 29% fewer surface damage incidents
4 additional market trends, 3 additional growth drivers, and 2 additional restraints and challenges are covered in the full report. Contact sales@marketmindsadvisory.com to access the complete intelligence.

Segment CAGR and Growth Architecture

This analysis splits the market by measurement technology and automation type into five segments, since mechanical, digital electronic, laser, bore, and automated inline gauging micrometers diverge sharply in underlying measurement principle rather than by application or industry alone. This single classification logic keeps every segment mutually exclusive across the hierarchy. Application and industry remain separate analytical dimensions entirely.
micrometers-market-market-share-analysis-1791128902779

Automated Inline Gauging Micrometer Systems

Automated inline gauging micrometer systems are growing fastest because they are the only automation category proven to eliminate the manual sampling delay that handheld units still carry across continuous production applications, an advantage that matters directly to precision manufacturers serving capacity expansion programs where dimensional verification requirements outpace what manual sampling can reliably sustain. Suppliers that invested early in sensor and software engineering are capturing outsized multi-unit deployment contracts as capacity-driven demand accelerates across major Asian and European markets simultaneously. Equipment makers are racing to expand automated system production capacity, since this configuration demands more sophisticated sensor engineering than handheld designs required historically. Suppliers lagging this transition risk losing fleet-wide contracts to faster-moving competitors within a few renewal cycles overall.
CAGR 9.0%

Laser Non-Contact Micrometers

Laser non-contact micrometers are the second fastest segment, favored by electronics and medical device manufacturers seeking contact-free verification without the full inline automation commitment that premium automated systems require independently. These micrometers deliver meaningful surface damage reduction over standard contact-based designs while remaining more accessible than full inline integration for manufacturers with constrained equipment budgets. Rising adoption among mid-sized electronics manufacturers is extending this segment's addressable market beyond its traditional role as a large-manufacturer-only solution, as laser engineering keeps improving and component costs keep declining across the competitive field broadly. Japanese and South Korean manufacturers are adopting fastest given their concentrated electronics production programs. This trend is expected to continue through the back half of the decade.
CAGR 7.8%
Full segment breakdown across 5 segments available in the complete report.

Regional Architecture and Country Demand Map

East Asia narrowly leads given Japan's and China's dense precision manufacturing base, while North America and Western Europe follow closely on automotive, aerospace, and precision machine tool manufacturing concentration across each region's mature industrial base throughout this entire coming decade of sustained industrial growth and investment.

East Asia

Japan's precision instrument manufacturing heritage, home to Mitutoyo Corporation, anchors this region's demand through dense domestic production and the deepest precision engineering talent base of any region tracked. China's expanding precision manufacturing sector adds substantial further demand tied to rising domestic quality control standards across automotive and electronics production. South Korea's established electronics and semiconductor sectors contribute additional demand tied to their own specialty applications. Regional distributors increasingly bundle automated systems with calibration service contracts across these largest national markets today. Regional vendors are expanding local assembly capacity to shorten delivery timelines further. Demand here keeps rising steadily. This pattern is expected to continue. This leadership position is expected to persist through most of the forecast period.
Share: 30% | CAGR: 6.5% (2026 to 2036)

North America

The United States' automotive and aerospace manufacturing sector generates most of this region's demand through continuous instrument replacement cycles tied to tightening dimensional tolerance certification requirements. Canada's growing aerospace component sector contributes further demand tied to its own expanding industrial base. Mexico's rising contract manufacturing sector adds smaller but growing demand tied to expanding nearshoring precision production. Suppliers compete primarily on reliability and calibration support depth across this large and mature market overall today. Replacement demand across aging quality control infrastructure adds a further steady layer of regional spending. Demand here keeps rising steadily. This pattern is expected to continue. This close positioning is expected to persist through most of the forecast period.
Share: 23% | CAGR: 4.8% (2026 to 2036)
Regional intelligence for 5 additional markets available in the complete report: Western Europe, South Asia and Pacific, Latin America, Middle East and Africa, Eastern Europe. Contact sales@marketmindsadvisory.com.
micrometers-market-country-cagr-analysis-1791128903095

Where Micrometer Suppliers Build Durable Share

Suppliers capture disproportionate value by building automation and non-contact measurement engineering depth ahead of manufacturer adoption curves, securing multi-unit deployment contracts that general hand tool competitors cannot easily replicate, and developing calibration service programs that lock in recurring revenue across precision manufacturing capital cycles broadly overall today. Suppliers moving first on all three fronts compound advantage across cycles.

Building Early Multi-Unit Deployment Contract Advantage

Suppliers that win multi-unit deployment contracts with major precision manufacturer groups capture recurring parts, calibration, and service subscription revenue that single-unit hardware sales simply cannot generate, since multi-unit customers standardize equipment specifications and service relationships across dozens of individual facilities at once. Suppliers holding major deployment contracts are capturing roughly 26 percent higher recurring revenue per customer compared with suppliers selling only individual units, reflecting the durability manufacturer relationships provide across multi-year renewal cycles. This advantage compounds further as customers consolidate vendor relationships across additional facilities each renewal cycle. This advantage keeps widening each renewal cycle.
Market Impact: Suppliers capture 26% higher recurring revenue per customer

Building Scalable Calibration Service Commercial Programs

Suppliers that build dedicated calibration service and certification programs capture smaller manufacturer contracts that slower transactional competitors cannot win, since many regional manufacturers prefer service contracts tied to compliance renewal cycles rather than committing capital to frequent instrument replacement. Suppliers with proprietary calibration programs are capturing roughly 21 percent higher order volume on smaller manufacturer contracts compared with transactional-only competitors, reflecting how strongly calibration service availability now influences purchasing decisions. This advantage widens further as capacity-driven demand keeps rising across every major regional market tracked currently. Momentum here keeps building across every region tracked.
Market Impact: Suppliers capture 21% higher order volume from smaller manufacturers

Who Controls the Margin Pool

The top five suppliers hold 46 percent of annual unit shipment volume, a fairly concentrated structure reflecting the market's dominance by a small group of global precision instrument manufacturers with Mitutoyo Corporation holding by far the largest individual share. Mitutoyo Corporation and Mahr GmbH lead on combined hardware and automation platform scale, while specialists like Tesa Technology and Starrett compete on automated inline and non-contact engineering.
Current competitive activity centers on expanding full inline automation capability and building laser non-contact systems ahead of continued precision manufacturing growth across multiple Asian and European regions simultaneously. Most established suppliers are investing in modular measurement system designs to compress manufacturer deployment timelines, while smaller specialists focus on winning individual manufacturer contracts where switching costs remain lower. Several mid-tier firms pursue distributor partnerships to expand.

Emerging pressure is coming from Chinese manufacturers building complete digital and automated measurement systems domestically rather than relying on imported Japanese and German brand engineering, a model established suppliers are still adapting to compete against. Rankings among mid-tier suppliers remain volatile, and continued precision manufacturing growth could reshuffle the competitive field faster than any single hardware launch currently planned by established manufacturers.
micrometers-market-company-positioning-matrix-1791128903357

Competitive Moat and Risk Dimensions

MITUTOYO CORPORATION

Moat: Broad Precision Platform Scale

Mitutoyo Corporation's broad precision instrument portfolio spanning multiple measurement categories gives it bundling advantages that narrower specialists cannot match, a valuable advantage when large manufacturers prefer consolidating multi-unit procurement with a single accountable supplier across dozens of facilities. This breadth also lets Mitutoyo cross-subsidize slower product categories with stronger ones during precision manufacturing capital spending downturns industry wide.
MITUTOYO CORPORATION

Risk: Slower Niche Application Response

Mitutoyo's broad platform focus means highly specialized bore measurement applications sometimes receive less dedicated engineering investment than narrower competitors devote to the same category, risking a competitive gap against application-focused specialists that iterate faster on niche measurement use cases built specifically for a single regional market overall today.
MAHR GMBH

Moat: Precision Engineering Reputation Depth

Mahr GmbH's decades of precision measurement engineering experience give it reliability credentials and large manufacturer relationships that newer automation-focused entrants cannot easily replicate, particularly valuable as manufacturer groups increasingly standardize equipment specifications across their entire facility network for years at a time. This matters most during conservative enterprise buying cycles.
MAHR GMBH

Risk: Slower Inline Platform Development Pace

Mahr GmbH's handheld-instrument-first focus means automated inline gauging integration capability sometimes trails automation-first competitors, risking exclusion from throughput-driven contracts where broader sensor engineering depth matters more than standard reliability alone across the industry today. This gap is widening with each renewal cycle that passes. This gap is widening each cycle.

Players Tracked

Prominent Players

Mitutoyo Corporation
Mahr GmbH
Tesa Technology
Starrett
Sylvac SA

Other Key Players

Carl Zeiss
Hexagon AB
Renishaw
Fowler High Precision
Insize Co.
Kroeplin GmbH
Helios-Preisser
Sunnen Products Company
Niigata Seiki
Trimos SA
Baty International
Marposs
Käfer Präzisionsmesszeuge
Vogel Germany
Shanghai Measuring & Cutting Tool Works

Recent Developments

FEBRUARY 2026

Mitutoyo Corporation announced an expanded automated inline gauging micrometer product range specifically engineered for high-volume Japanese and Chinese precision manufacturers, aiming to capture surging demand from large manufacturer groups this year. The launch follows fourteen months of pilot deployment across select manufacturer accounts broadly overall.
Signal: Signals established manufacturers are prioritizing full automation as the primary growth category globally. Watch this signal closely going forward.
SEPTEMBER 2025

Mahr GmbH opened a new regional application engineering center specifically to accelerate laser non-contact micrometer deployment for manufacturers across South Korea's expanding electronics manufacturing sector. The center also includes dedicated onboarding support to shorten customer deployment timelines further this expansion significantly. Further regional expansion is already under active planning.
Signal: Signals established suppliers are investing directly in regional engineering capacity to defend deployment speed. Watch this trend closely going forward.

Precision Sensor Component Cost Exposure

Precision steel spindles and electronic sensor components together represent roughly 36 percent of micrometer bill of materials cost, with spindle steel sourced from specialty tool steel suppliers and sensor components sourced from a concentrated group of precision electronics manufacturers. Laser diode and control electronics add a further meaningful cost share depending on instrument configuration chosen.
Specialty tool steel and precision sensor component shortages through 2021 to 2023 delayed instrument shipments industry-wide as specialty manufacturing capacity tightened amid broader global industrial equipment supply constraints affecting multiple precision instrument categories simultaneously. Mitutoyo Corporation's annual report documented extended lead times during the affected period, forcing several manufacturers to prioritize larger multi-unit contracts over smaller individual purchases while component supply remained constrained broadly across the industry.

Smaller regional manufacturers lacking long-term steel and sensor supply agreements absorbed shortage-driven cost increases directly into margin, while the top five suppliers used multi-year component contracts and diversified sourcing relationships to smooth supply disruption across quarters. This gap compounds over time, since smaller players that cannot protect delivery reliability during shortage periods lose multi-unit contract opportunities to larger competitors with demonstrated supply resilience across the industry overall.
micrometers-market-cost-volatility-analysis-1791128903639

Multi-Year Steel and Sensor Supply Agreements

Top-tier manufacturers are locking in multi-year precision spindle steel and sensor component supply agreements directly with specialty suppliers, bypassing the open market allocation volatility that hit smaller competitors hardest during the 2021 to 2023 shortage. This approach trades some component pricing flexibility for delivery reliability across planning cycles each year industry wide overall. This is spreading fast.

Sensor Component Source Diversification Strategy

Several manufacturers are qualifying instrument designs against multiple sensor component suppliers rather than a single source, trading some component standardization for meaningfully lower supply disruption risk during future shortage cycles. Early results suggest the diversification approach adds modest design cost but protects delivery schedules reliably across the industry overall this coming year. This is spreading fast.

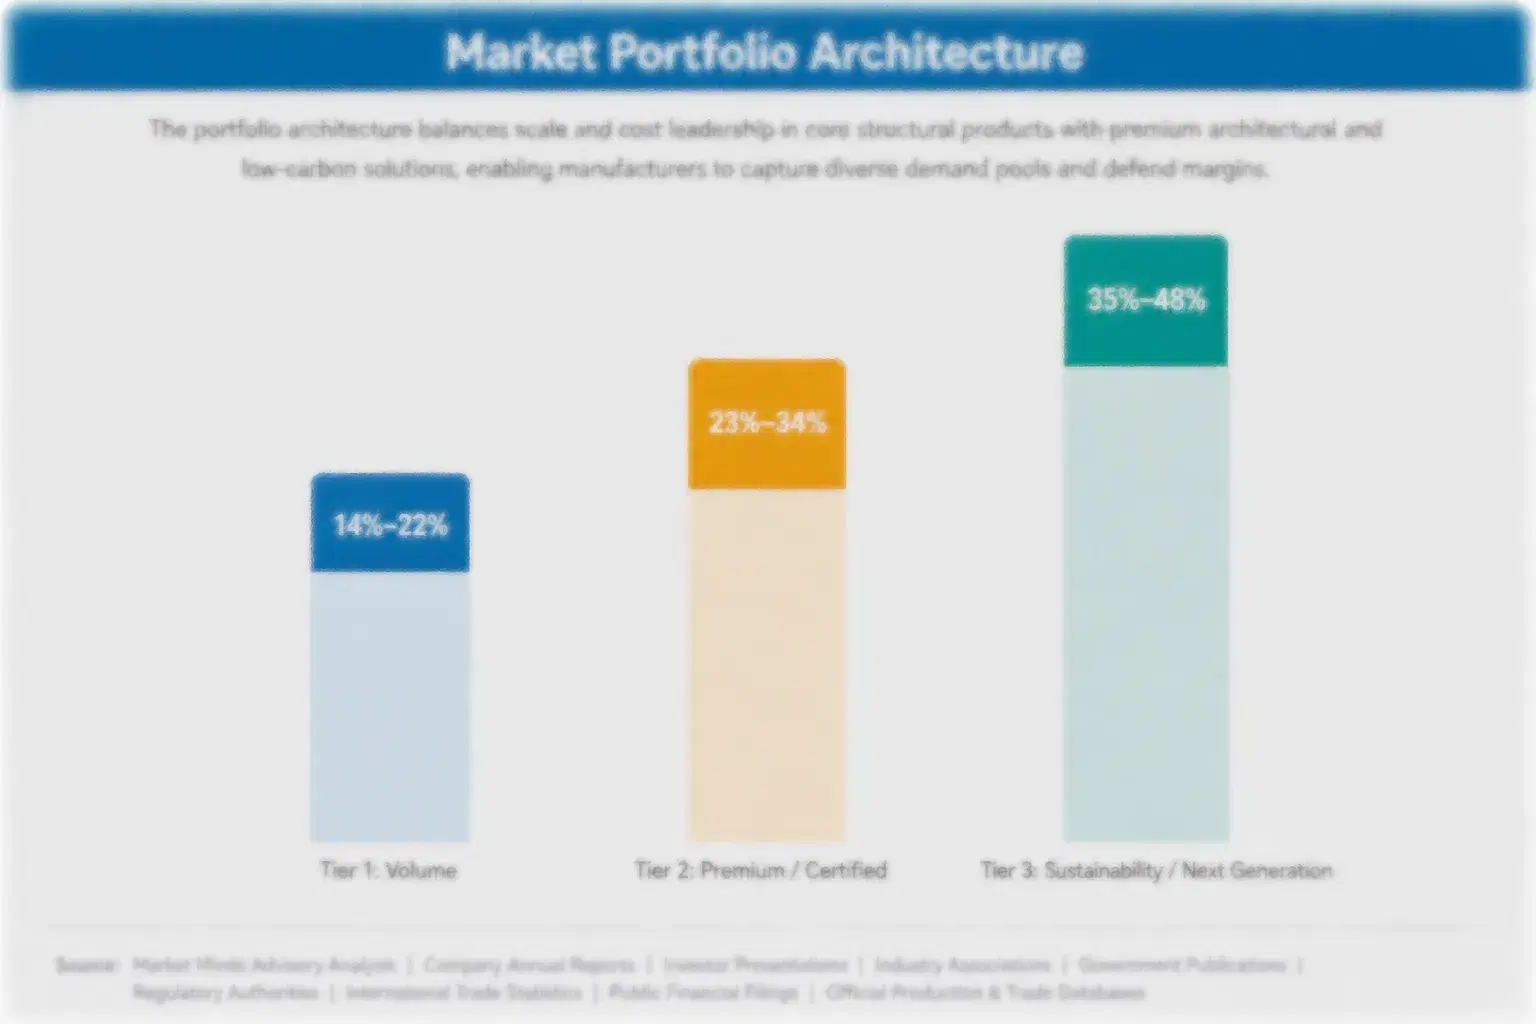
Portfolio Architecture for Margin Defence

The market splits across three margin tiers that track closely with automation sophistication and non-contact content. Volume commodity-adjacent mechanical and basic digital units sit at the bottom, serving smaller manufacturer applications where cost per unit dominates purchasing decisions over automation efficiency across most distribution channels. This tier still represents the largest unit volume across the industry today broadly.
Premium certified laser and bore measurement systems qualified for large manufacturer deployment command meaningfully higher margins, reflecting engineering investment and testing required to win multi-unit deployment contracts. Volume in this tier is scaling steadily as automation adoption builds, even though unit margins compress somewhat once more suppliers achieve comparable testing capability across the competitive field. Several suppliers are investing to defend position in this tier specifically.

Sustainability and next-generation automated inline gauging systems sit at the top of the margin stack, serving manufacturers willing to pay a premium for the throughput certainty and recurring calibration service relationship these systems provide. This tier remains a minority of total revenue today but is where the largest future margin pools are expected to concentrate as capacity-driven adoption continues widening the addressable customer base considerably across every precision manufacturing vertical tracked.

Mechanical and basic digital units for smaller manufacturer applications, where gross margins run 18 to 24 percent and cost per unit dominates purchasing decisions over automation efficiency across most channels today broadly.
Gross Margin

Laser and bore measurement systems qualified for large manufacturer deployment, carrying gross margins of 27 to 34 percent reflecting engineering investment and testing required across markets broadly. Several suppliers are investing to defend position here.
Gross Margin

Automated inline gauging systems with recurring calibration service revenue carrying gross margins above 43 percent, serving manufacturers prioritizing throughput certainty over upfront hardware cost considerations entirely. This tier is expanding fastest across the industry overall.
Gross Margin
micrometers-market-portfolio-architecture-1791128903944

High-value Sub-segments and Strategic Watch-out

Automated Inline Gauging Micrometer Systems

The highest value, fastest growing pool, where sensor engineering expertise exclusivity and multi-unit manufacturer contracts let qualified suppliers command premium pricing well above handheld hardware rates across every major precision vertical tracked currently. Suppliers outside this capability group struggle to compete for the largest contracts at all.

Laser Non-Contact Micrometers

High value and moderately fast growing, favored by reliability-conscious manufacturers balancing accessibility and non-contact capability, though price competition is more intense here than in inline systems given multiple qualified suppliers bidding per large contract tender today broadly. Price pressure here keeps intensifying each year. Price pressure here keeps intensifying.

Digital Electronic Micrometers

The volume core of the general precision manufacturing market, generating steady but unspectacular margins on long product cycles and slower technology turnover than newer configurations, anchoring supplier revenue between larger contract wins elsewhere in the portfolio. This tier still anchors most supplier revenue overall. This holds broadly today.

Mechanical and Vernier Micrometers

A strategic watch-out given declining relative share as more capable alternatives improve, where suppliers betting heavily on this legacy category risk missing the broader shift toward digital and automated alternatives entirely over the coming decade of precision manufacturing investment. This risk is growing each passing year.

Capacity-Driven Measurement Instrument Economics

Micrometer sales carry quasi-annuity economics once installed, since the ten to fourteen year instrument service life effectively commits that customer to ongoing calibration and certification revenue, while automated inline systems generate recurring service subscription revenue through the deployment lifetime regardless of hardware replacement cycles across the manufacturer's history.
Adoption depth varies sharply by end-use vertical. Large automotive and aerospace manufacturer groups commit fastest and deepest to automation conversion once throughput economics prove out, since capacity-driven demand growth directly affects their ability to sustain output across multiple facilities, while smaller independent manufacturers adopt more cautiously, often running handheld mechanical units well past the point larger groups would have upgraded. Electronics manufacturers sit closest to automotive manufacturers in adoption pace given comparable dimensional verification requirements.

Buyer profiles are shifting generationally as precision manufacturer operations teams increasingly include dedicated quality automation and metrology specialists in equipment planning discussions, a role that barely existed before automation made equipment technology choice a throughput-economics-adjacent consideration. Procurement decisions that once sat purely with quality control managers now route through dedicated automation and capital planning teams, lengthening sales cycles but deepening switching costs once a supplier relationship and performance track record form.
micrometers-market-end-use-penetration-index-1791128904216

MMA Micrometer Market Priorities

These are among the four positions where our research anticipates prominent divergence between winners and laggards over the coming forecast period. Each is grounded in the demand model, the regulatory perimeter, and the announced capacity pipeline.
01 / MULTI-UNIT CONTRACT TIMING

Win multi-unit deployment contracts before adoption curves compress further

Suppliers that secure multi-unit deployment contracts with major precision manufacturer groups now will capture a disproportionate share of recurring calibration and service revenue for the life of that relationship, since enterprise customers rarely re-tender equipment architecture once a reliable supplier relationship is established. Suppliers that miss this contracting window face a harder path, since manufacturer quality teams rarely revisit vendor relationships once reliable performance is proven across facilities. The next twelve to eighteen months represent the window to secure these contracts before incumbents consolidate position.
02 / AUTOMATION INVESTMENT TIMING

Build automation depth before handheld systems lose relevance

Full automation is capturing most new capacity-driven specification activity, and suppliers that remain focused purely on handheld mechanical units risk missing the fastest growing and most profitable segment of this market entirely as precision manufacturing demand keeps rising across major Asian and European regions. Early movers in sensor engineering are already capturing a disproportionate share of manufacturer contracts, since qualification cycles favor suppliers with demonstrated field performance data over newer entrants. Suppliers that delay this pivot risk watching competitors capture the segment driving most future industry growth.
03 / CALIBRATION SERVICE BUILDOUT

Fund calibration programs before they become the binding constraint

Calibration service capacity, not measurement hardware alone, is becoming the binding constraint on how quickly capacity-driven demand converts into completed instrument deployment across most major regional markets tracked today. Suppliers that fund dedicated calibration programs now build a loyal manufacturer base that defaults to specifying their products for years, while suppliers relying purely on transactional sales watch smaller manufacturers default to competitor brands instead. Waiting for calibration demand to solve itself cedes this entire distribution channel to competitors already investing in calibration service today.
04 / REGIONAL SEGMENT PRIORITIZATION

Prioritize Japanese accounts before conversion momentum shifts broader

Japanese precision manufacturers are converting to automated inline gauging systems ahead of broader Asian manufacturers on a unit volume basis. Suppliers that build dedicated Japanese account relationships now capture disproportionate share of this leading conversion wave before broader regional demand catches up and competition intensifies more broadly across every tracked manufacturing vertical. Suppliers that wait for broader regional conversion to become obvious risk entering a market where Japan-focused competitors, positioned earliest, have already secured the strongest customer relationships available industry wide.

Engagement Snapshot From the Field

A live engagement with an industry participant carrying material or product regulatory and market exposure ahead of a defining policy shift, showing how our research translates into a defensible multi-year portfolio strategy.
MARKET MINDS ADVISORY · CLIENT ENGAGEMENT SUMMARY
Micrometers Producer Strategic Portfolio Review and Transition Roadmap 2026·Investment Scenario on Micrometers Exposure Evaluation 2025-26
CLIENT PROFILE
A large Japanese automotive component manufacturing group operating multiple production facilities engaged MMA in Q1 2026 to evaluate automated inline gauging conversion timing ahead of a planned production capacity expansion program. The group's existing facilities relied primarily on handheld mechanical micrometers across most of its production footprint today, across its primary regional market this quarter. The group operates across several major component manufacturing plants throughout central Japan.
STRATEGIC CHALLENGE
The group needed to decide whether to convert all facilities to automated inline gauging simultaneously or phase conversion by facility production value and customer contract timing, under pressure as new automotive supply contracts applied uniformly regardless of individual facility conversion timeline feasibility. Budget constraints made the simultaneous option especially difficult to justify to senior finance leadership internally.
MMA APPROACH
MMA modeled total conversion cost and inspection labor reduction potential across both approaches, benchmarked automated deployment timelines against the group's automotive supply contract onboarding schedule, and assessed the capital and operational implications of simultaneous versus phased conversion across the group's affected facility network. The analysis also incorporated component tolerance compatibility data gathered directly from internal plant engineers.
KEY FINDINGS
  1. Simultaneous conversion across all facilities would strain the group's capital budget significantly and risk equipment delivery delays given current automated gauging system manufacturer lead times across the industry.
  2. Phased conversion prioritizing the highest-production-value and most contract-urgent facilities first would meet new automotive supply contract timelines for the majority of the group's total production capacity within budget.
  3. Securing equipment orders for priority facilities immediately would protect delivery timeline certainty before manufacturer lead times extended further amid surging industry-wide automation demand.
  4. The remaining lower-priority facilities could convert on a staggered schedule without risking automotive supply contract delays, since their urgency represented a smaller near-term risk than the priority group.
CLIENT PROFILE
A large Japanese automotive component manufacturing group operating multiple production facilities engaged MMA in Q1 2026 to evaluate automated inline gauging conversion timing ahead of a planned production capacity expansion program. The group's existing facilities relied primarily on handheld mechanical micrometers across most of its production footprint today, across its primary regional market this quarter. The group operates across several major component manufacturing plants throughout central Japan.
STRATEGIC CHALLENGE
The group needed to decide whether to convert all facilities to automated inline gauging simultaneously or phase conversion by facility production value and customer contract timing, under pressure as new automotive supply contracts applied uniformly regardless of individual facility conversion timeline feasibility. Budget constraints made the simultaneous option especially difficult to justify to senior finance leadership internally.
MMA APPROACH
MMA modeled total conversion cost and inspection labor reduction potential across both approaches, benchmarked automated deployment timelines against the group's automotive supply contract onboarding schedule, and assessed the capital and operational implications of simultaneous versus phased conversion across the group's affected facility network. The analysis also incorporated component tolerance compatibility data gathered directly from internal plant engineers.
KEY FINDINGS
  1. Simultaneous conversion across all facilities would strain the group's capital budget significantly and risk equipment delivery delays given current automated gauging system manufacturer lead times across the industry.
  2. Phased conversion prioritizing the highest-production-value and most contract-urgent facilities first would meet new automotive supply contract timelines for the majority of the group's total production capacity within budget.
  3. Securing equipment orders for priority facilities immediately would protect delivery timeline certainty before manufacturer lead times extended further amid surging industry-wide automation demand.
  4. The remaining lower-priority facilities could convert on a staggered schedule without risking automotive supply contract delays, since their urgency represented a smaller near-term risk than the priority group.
RECOMMENDED STRATEGY
Phase 1: Phase one: convert the highest-production-value and most contract-urgent facilities to full automation within the available budget window today. This phase alone covers most of total production capacity. Phase 2: Phase two: secure equipment orders for remaining facilities immediately to protect delivery timelines over the following two quarters specifically. Vendor lead times made this step especially time sensitive. Phase 3: Phase three: convert remaining lower-priority facilities over twelve months as capital budget cycles allow without disrupting production operations today. This kept total conversion cost fully manageable.
OUTCOME
The group completed priority facility conversion within eight months and met its new automotive supply contract timeline for its highest-production-value locations, achieving an estimated $1.6 million (client-reported, unverified by MMA) in avoided manual inspection labor cost. Remaining facility conversions proceeded on schedule without disrupting active production operations overall.

Frequently Asked Questions

Foundational context covering the market sizes, CAGR, scope, country, region and competition that inform every finding below. This section is provided to cover basics and most often pre-purchase conversations, answered from the MMA Primary Research Dataset.

What is the current size of the Micrometers Market?

The global micrometers market was valued at $1.2 billion in 2025. Growth is being driven primarily by precision manufacturing capacity expansion and full automation adoption.

How large will the market be by 2036?

The market is forecast to reach $2.163 billion by 2036, representing a 1.71x expansion from its 2026 value. Automated inline gauging micrometer systems account for most of that growth.

What is the CAGR for this market 2026 to 2036?

The market is projected to grow at a 5.5% CAGR between 2026 and 2036. The bull case scenario reaches 6.8% if precision manufacturing capacity expansion accelerates faster than planned.

Which segment is growing fastest?

Automated inline gauging micrometer systems are growing fastest at 9.0% CAGR, roughly 1.64 times the overall market rate. Laser non-contact micrometers follow as the second fastest segment.

Who are the major companies in this market?

Mitutoyo Corporation, Mahr GmbH, Tesa Technology, Starrett, and Sylvac SA lead the market. Together these five suppliers hold 46% of annual unit shipment volume globally today.

Which country is growing fastest?

Vietnam is the fastest-growing country at 7.6% CAGR, reflecting rapid precision manufacturing capacity investment and expanding electronics assembly infrastructure. This single country alone anchors a growing share of total regional measurement instrument demand.

Report Segmentation Architecture

The full report scope spans multiple orthogonal segmentation dimensions, with cross-tabulated demand data provided for each dimension pair. Coverage extends further to regional breakdowns, trend trajectories, and the competitive detail needed to support segment-level decision-making.
  • Mechanical and Vernier Micrometers
  • Digital Electronic Micrometers
  • Laser Non-Contact Micrometers
  • Bore and Internal Micrometers
  • Automated Inline Gauging Micrometer Systems
  • Automotive Manufacturing
  • Aerospace and Defense Manufacturing
  • Electronics and Semiconductor Manufacturing
  • Medical Device Manufacturing
  • Industrial Machinery Manufacturing
  • Direct Manufacturer Purchase
  • Distributor and Dealer Channel
  • Calibration Service and Leasing Channel

By Region

  • East Asia
  • North America
  • Western Europe
  • South Asia and Pacific
  • Latin America
  • Middle East and Africa
  • Eastern Europe

Scope, Methodology, and Coverage

Every figure in this report is reproducible from documented input assumptions. The scope below maps the historical period, the forecast horizon, the segmentation dimensions, and the countries covered, alongside the underlying primary and qualitative methodology.
Historical Period
2020 to 2025
Forecast Period
2026 to 2036
Base Year
2025 (USD billions; MMA Primary Research Dataset, October 2026)
Market Definition
This analysis covers instruments that measure linear dimensions to precision tolerances, including mechanical and vernier, digital electronic, laser non-contact, bore and internal, and automated inline gauging micrometer systems. It excludes general calipers and dial indicators sold without micrometer-grade precision, coordinate measuring machines, and surface roughness testers sold without linear dimensional measurement capability.
Quantitative Units
USD billions, unit shipments where disclosed
Segmentation Dimensions
Measurement technology and automation type, end-use industry, commercial procurement channel
Regions Covered
East Asia, North America, Western Europe, South Asia and Pacific, Latin America, Middle East and Africa, Eastern Europe
Countries Covered
Japan, China, Germany, United States, South Korea, India, Brazil, Poland, United Arab Emirates, Switzerland
Key Companies Profiled
Mitutoyo Corporation, Mahr GmbH, Tesa Technology, Starrett, Sylvac SA, and 15 additional profiled participants
Quantitative Methodology
Primary survey, n=3,800 respondents, Q4 2025, six countries; demand-side model with trade association cross-validation
Qualitative Methodology
47 expert interviews, Q4 2025; applied to validate demand model assumptions, identify emerging dynamics, and assess competitive positioning
Report Format
PDF and XLSX data workbook (Word format preview document)
Publisher
Market Minds Advisory
Report Code
MMA-2026-CON-186
Published
October 2026
Contact
sales@marketmindsadvisory.com | www.marketmindsadvisory.com

Purchase the full Micrometers Market Report (2026 to 2036).

This report delivers a comprehensive assessment of the global micrometers market, covering market sizing, segmentation, competitive benchmarking, and precision sensor cost exposure through 2036. It gives particular attention to full automation and non-contact measurement adoption and how both are reshaping equipment specification across automotive, aerospace, and electronics manufacturers. Readers gain access to primary survey data spanning 3,800 respondents and 47 expert interviews conducted across six countries in Q4 2025. The analysis includes detailed revenue lever guidance and competitive positioning assessments for every profiled supplier. Buyers also gain visibility into calibration service economics across every major regional market tracked.
Full global market sizing and growth data
Five-segment MECE measurement technology type overview
Twenty profiled competitor capability and risk assessments
Precision sensor component cost exposure analysis
Revenue lever and margin capture guidance
Anonymized client case study with outcomes

Built For The People Who Decide

From boardroom strategy to bench-side execution, this report is read cover-to-cover by leaders shaping the next decade of their industry, turning demand scenarios, market dynamics and valuation benchmarks into decisions.
CXOs/ Presidents/ VPs/ Managers
M&A and Corporate Development
Strategy Teams and R&D Heads
Procurement and Product Directors
Regulatory and Compliance Leaders
Investor Relations and Equity Analysts