Market Minds Advisory
Microfiber Synthetic Leather Market

Microfiber Synthetic Leather Market: Polyurethane Resin Systems, Automotive Qualification and the Solvent Transition, 2026 to 2036

Automotive interior buyers now specify waterborne polyurethane systems that most Chinese impregnation lines were never built to run at volume, and that mismatch is quietly redistributing the industry's qualified capacity.

Lead Analyst

Bilal Shaikh

Published

September 2026

Make Smarter Decisions with Customized Research Insights

Request a free sample report and evaluate market opportunities, growth trends, and competitive dynamics relevant to your business needs.

2025 MARKET VALUE$3.4BMarket Size 2025
2036 FORECAST VALUE$8.1BBase Case , 2026 to 2036
CAGR 2026 TO 20368.2 %Bull 9.5% / Bear 7.0%
INCREMENTAL OPPORTUNITY$4.4BNet 10- year value creation
EXPANSION MULTIPLE2.20x2036 value over 2026 base
Strategic Levers
M&A Pipeline
Regional Outlook
Country Rankings
Competitive Intelligence
Segmental Deep-dive
Call-Us : 91 93563 13602

Executive Snapshot and Market Trajectory

The solvent question has become the commercial question in this industry. Dimethylformamide restrictions across Chinese producing provinces and reformulation commitments from European carmakers have split the field cleanly into producers who can run waterborne polyurethane systems at automotive quality and producers who cannot yet manage it.
Waterborne polyurethane microfiber leather grows at 12.3%, a full 1.50 times the market rate, pulled by automotive interior specifications and by footwear brands facing chemical restrictions in their own supply chain audits. East Asia holds 40% of global value, well above the usual regional band, because Chinese and Japanese producers between them own most of the world's islands-in-the-sea base cloth capacity and the finishing lines that sit behind it.
The top five producers hold 47% of global revenue between them, an unusually concentrated position for a textile-adjacent material, and it reflects just how capital-intensive base cloth production actually is once qualification is counted. Automotive qualification runs 26 months from sample to series award, which locks specifications for the life of a vehicle platform. That timing works powerfully in favour of incumbents and firmly against the newer waterborne specialists now trying to enter.
Market Definition
The market covers microfiber synthetic leather: nonwoven base cloth made from islands-in-the-sea or splittable conjugate microfibre, impregnated with polyurethane and surface-finished into leather-substitute sheet material. It includes waterborne, solvent-free, solvent-based, silicone-modified and bio-based polyol resin systems. It excludes conventional coated fabrics on woven or knitted substrates, PVC leathercloth, bonded leather, mycelium and plant-derived leather alternatives, and finished articles made from any of these materials.
Base Year Value
$3.4B in 2025 (MMA Primary Research Dataset, August 2026)
Forecast Period
2026 to 2036, eleven discrete annual values
CAGR
8.2% base case. Bull 9.5%. Bear 7.0%.
Fastest Growth Segment
Waterborne Polyurethane Microfiber Leather: 12.3% CAGR
Fastest Growth Country
Vietnam: 11.6% CAGR
Fastest Growth Region
South Asia and Pacific: 10.5% CAGR
Largest Region
East Asia: 40% of 2025 global value
Market Leaders
Huafon Microfibre, Kuraray, Toray Industries, Asahi Kasei, Alcantara. Source: MMA Primary Research Dataset, July 2026.
Primary Survey
n=3,800 procurement and R&D decision-makers, Q4 2025, six countries
Methodology
Demand-side build-up, cross-validated against public data, 47 expert interviews

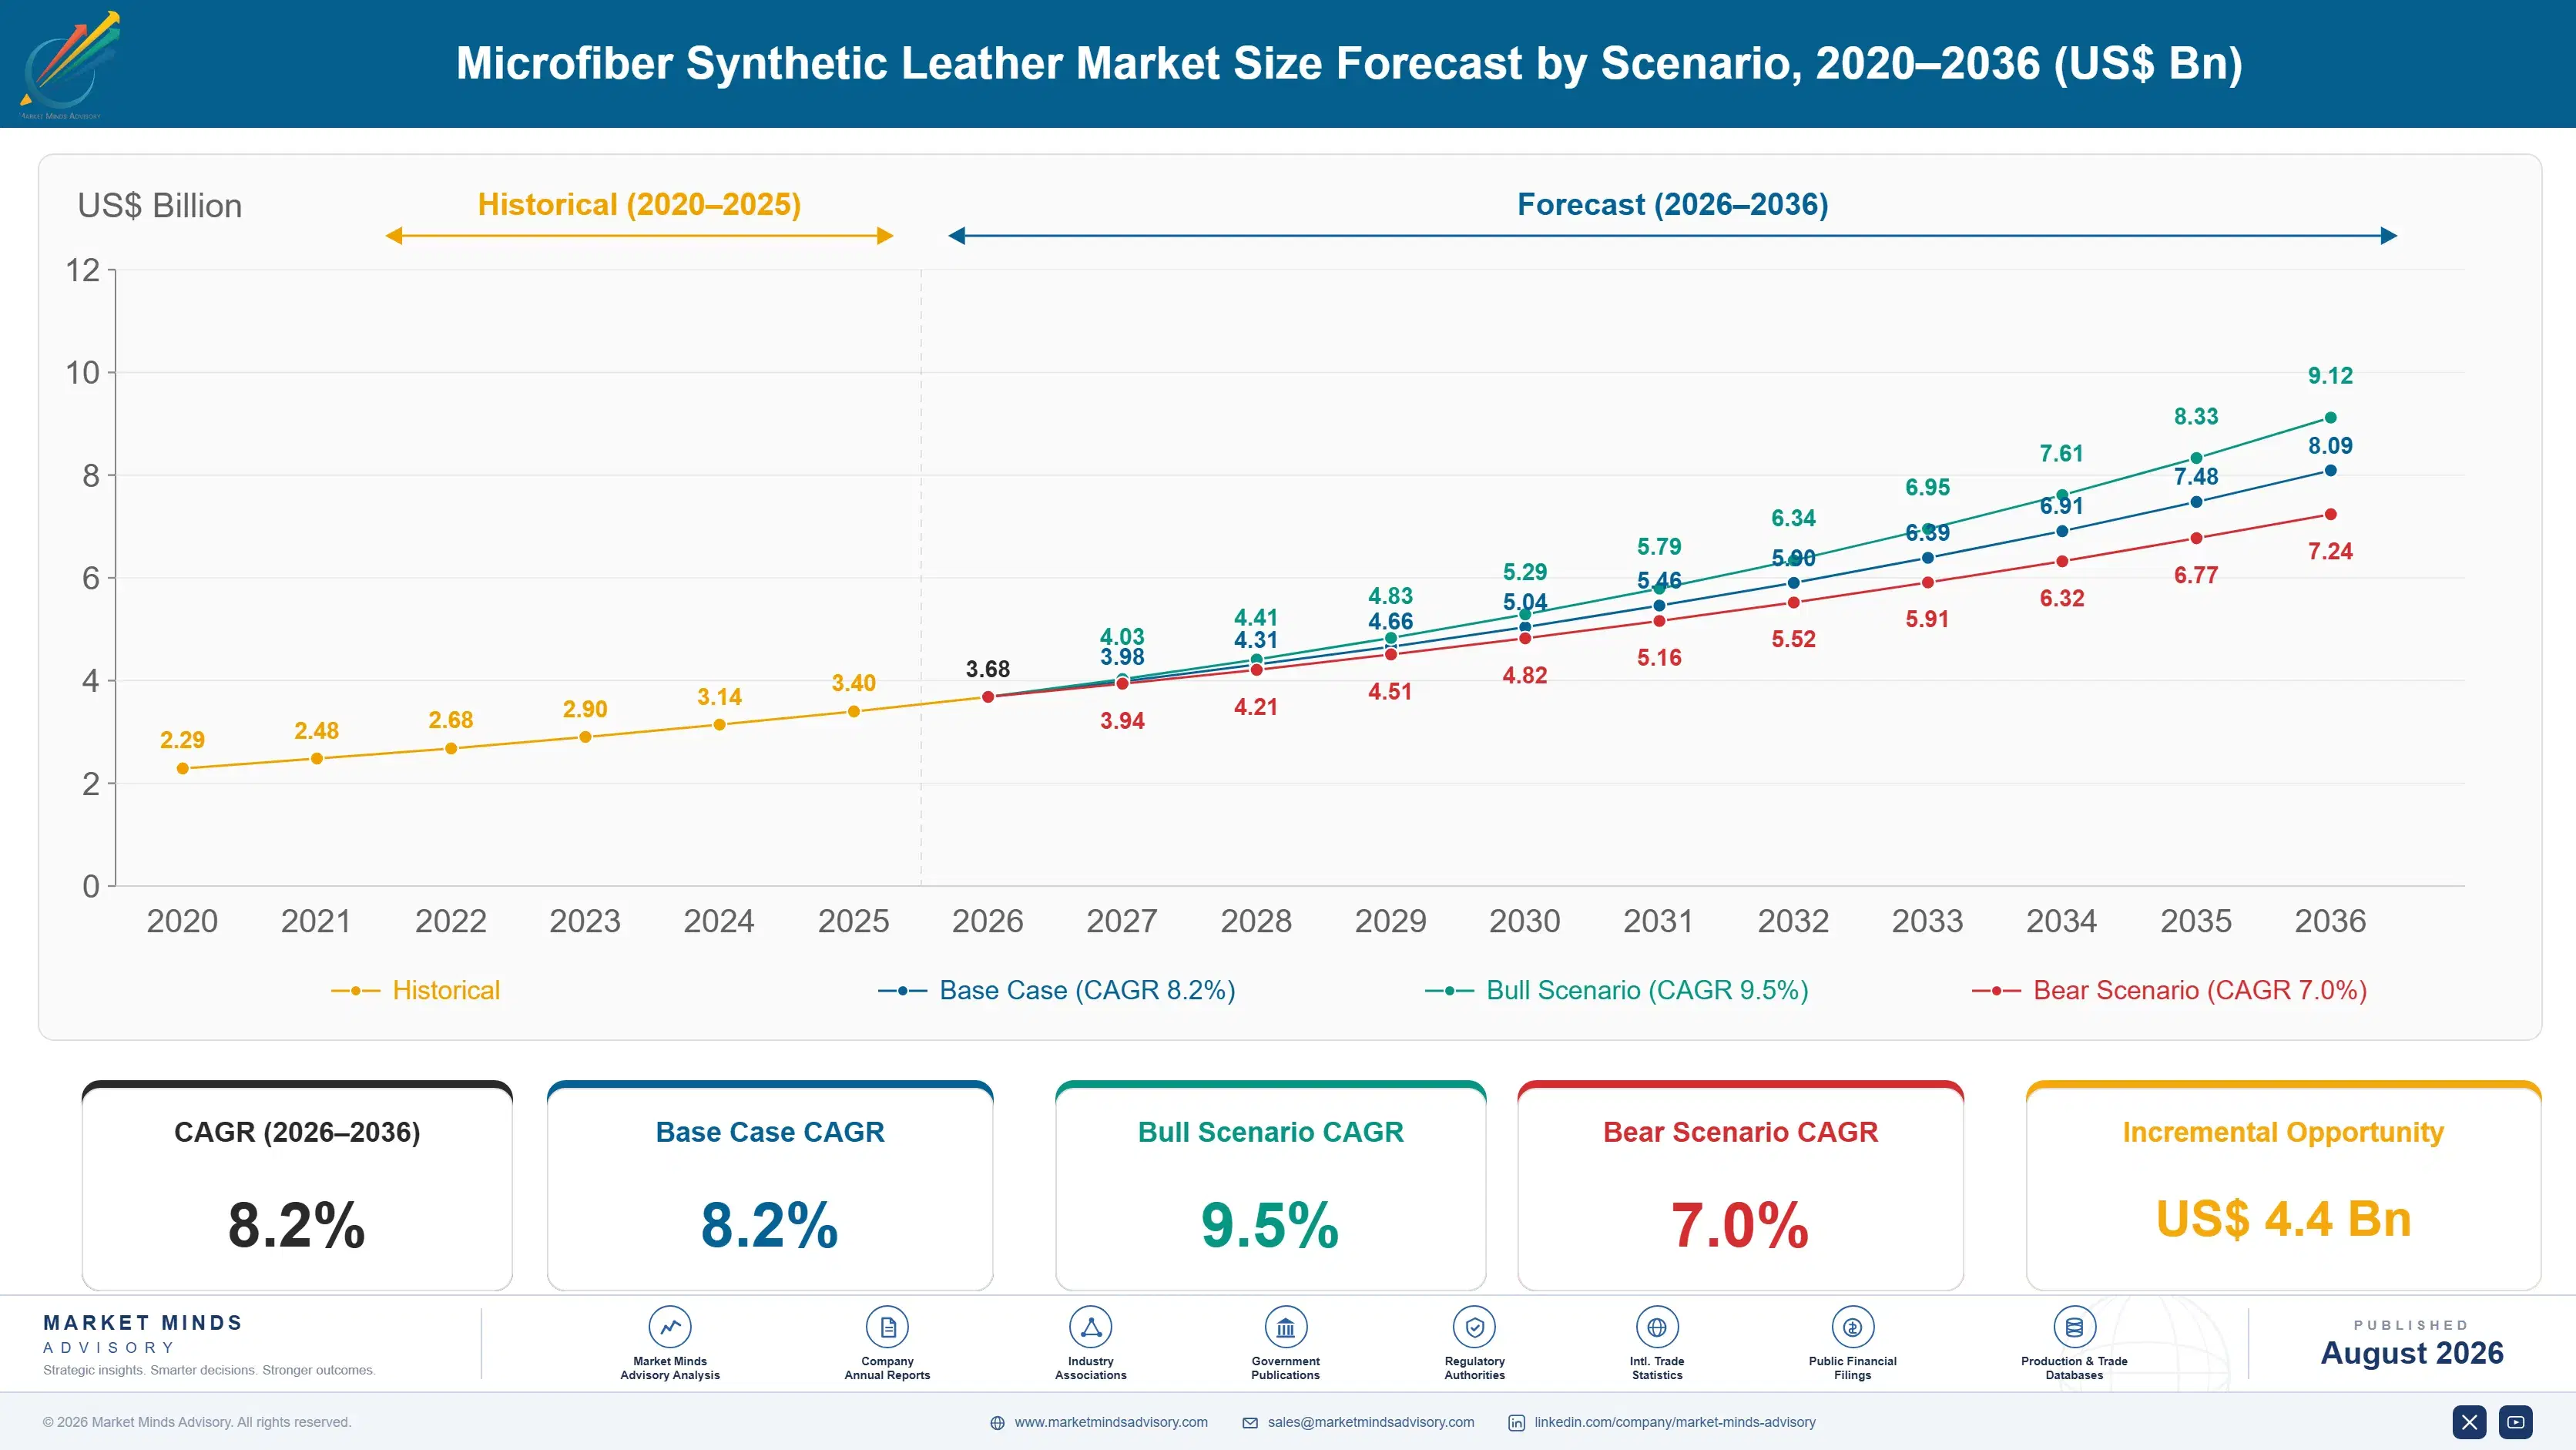
Microfiber Synthetic Leather Market Forecast Scenarios

microfiber-synthetic-leather-market-trends-size-forecast-scenario-1787311373913
Growth ran at 7.0% between 2020 and 2025, and it was a rougher ride than that number suggests. Footwear demand collapsed through 2020, automotive programmes slipped on semiconductor shortages through 2021 and 2022, then both recovered sharply while Chinese producers were simultaneously absorbing tightened solvent emission rules. Capacity added in 2019 sat underused for two years before running short.
The 8.2% base case rests on three mechanisms. First, automotive interior area per vehicle keeps rising as seat, door and instrument panel surfaces move away from both genuine leather and conventional coated fabric. Second, footwear brands are converting athletic uppers to microfiber at a rate that adds meaningful square metre volume each year. Third, resin conversion itself raises realised pricing, since waterborne and solvent-free grades sell at a premium that reflects genuinely scarce qualified capacity.
The bull case at 9.5% assumes European carmakers accelerate animal-free interior commitments across mid-range platforms rather than confining them to premium models. The bear case at 7.0% turns on polyol pricing: a sustained rise in MDI and polyester polyol cost would compress converter margins and slow the resin transition, since waterborne systems carry higher formulation cost before any capacity investment is counted.

Why Base Cloth Capacity Decides Everything Downstream

Microfiber synthetic leather is a two-stage business that most buyers treat as one. The base cloth, a nonwoven of splittable conjugate filament reduced to microfibre by alkali or solvent extraction, is capital-intensive and slow to build. The finishing stage that follows is comparatively cheap and widely available.
TOP FIVE CONCENTRATION47%Combined position of the five largest microfibre leather producers
AVERAGE SELLING PRICE$14.20 per sq metreTypical realised price across automotive and footwear grades
TOP PRODUCING COUNTRY SHARE58%Chinese share of global microfibre base cloth output
CAPACITY UTILISATION71%Average operating rate across installed impregnation and finishing lines
POLYOL INPUT SHARE34% of COGSPolyurethane resin and polyol share of delivered production cost
AUTOMOTIVE QUALIFICATION CYCLE26 monthsMedian time from sample submission to series programme award
That asymmetry explains the industry's structure. Base cloth lines cost between $40 million and $70 million and take roughly three years from decision to qualified output, which is why so few companies own them and why the top five hold 47% of value in a material category that looks superficially fragmented. Finishing houses proliferate around those lines, buying base cloth and selling finished sheet, and they compete hard on price because their capital position gives them nothing else to compete on.
The resin transition is now redrawing that map. Waterborne polyurethane impregnation demands different drying capacity, different line speeds and different coagulation handling than the dimethylformamide process it replaces, so the constraint is not chemistry knowledge but retrofitted equipment. Producers who invested during the 2021 to 2023 window now hold qualified waterborne capacity that automotive buyers are actively competing for, and they are pricing accordingly.
"Everyone in this market talks about sustainability credentials, but what automotive buyers actually purchase is a qualified line that will still be running the same specification in seven years. The green story sells the first order; the qualification record sells every one after that."
Senior Analyst, Advanced Textile Materials Practice · MMA Chemicals and Material

Market Trends

Automotive Interiors Move Toward Animal-Free Surface Specification

European and North American carmakers have committed to animal-free interior options across an expanding share of platforms, and microfiber leather has captured most of that specification because it survives abrasion and light-fastness testing that softer alternatives fail. Roughly 34% of new European vehicle platforms launched in 2025 offered a microfiber interior option, against 12% five years earlier. The material benefits twice over: it displaces genuine leather on ethical grounds and displaces PVC leathercloth on emission and hand-feel grounds. Programme volumes are large and specifications hold for the life of the platform, which suits producers with qualified capacity.
Market Impact: Consumes 900,000 square metres per
Solvent Restriction Rewrites Chinese Production Economics Permanently

Dimethylformamide handling rules tightened materially across Chinese producing provinces from 2021, requiring closed recovery systems and emission abatement that older impregnation lines cannot economically retrofit. Compliance investment runs $8 million to $14 million per line, and several smaller producers have simply closed rather than spend it. The result is capacity rationalisation dressed as environmental policy: national base cloth output has grown while the number of producing companies has fallen. Buyers who once had thirty credible Chinese suppliers now work with fewer than fifteen, and the survivors have priced that improved position into their contracts.
Market Impact: Leaves 6% capacity growth versus de

Market Opportunities and Growth Drivers

Athletic Footwear Conversion Adds Steady Square Metre Volume

Major athletic brands have converted a substantial share of upper material from coated fabric and genuine leather to microfiber, driven by weight, consistency and supply chain chemical restriction lists. A single high-volume running shoe platform can consume 900,000 square metres annually, and brands typically run several such platforms concurrently. Conversion decisions are made centrally and applied across contract manufacturers in Vietnam, Indonesia and China, so a single specification win moves large volume immediately. Restricted substance lists maintained by the brands themselves have become the effective regulation here, tighter in practice than any government requirement in the producing countries.
Market Impact: Delays entry by 26 months

Base Cloth Capacity Additions Lag Committed Downstream Demand

Qualified base cloth capacity is expanding at roughly 6% annually while finished demand grows above 8%, and the gap has tightened availability of automotive-grade material specifically. Building a new line takes about three years including qualification, so the shortfall cannot close quickly. Producers who own base cloth are consequently allocating supply, favouring long-term automotive contracts over spot footwear demand and capturing better pricing on both. Utilisation across installed lines sits at 71% globally, but that average conceals near-full loading on the waterborne-capable lines and considerable idle time on older solvent-based assets.
Market Impact: Rejected by 20% of premium specific

Market Restraints and Challenges

Qualification Timelines Block Entry Into Automotive Programmes

Automotive qualification runs 26 months from first sample to series award, covering abrasion, light-fastness, fogging, odour and dimensional stability testing at both the material and assembled trim level. The root cause is that interior materials sit inside a vehicle homologation package that carmakers will not reopen casually. Commercially this excludes new entrants from the highest-value demand pool for years after their capacity is technically ready. Participants are addressing it through pre-qualification with tier-one trim suppliers rather than carmakers directly, which cuts roughly eight months, and through acquiring already-qualified finishing operations outright.
Market Impact: Reaches 34% of new European platfor

Waterborne Systems Carry Persistent Hand-Feel Compromises

Waterborne polyurethane produces a different pore structure than solvent coagulation, and the resulting material is measurably stiffer in the grades that matter most to premium automotive and luxury footwear buyers. The root cause is physical: water-based coagulation cannot replicate the fine open cell structure that dimethylformamide extraction creates. Roughly 20% of premium specifications still reject waterborne grades on tactile assessment alone. Producers are closing the gap through hybrid systems that use solvent-free rather than waterborne chemistry, and through mechanical softening steps, but neither approach yet matches what the original solvent process delivers.
Market Impact: Costs $14 million per line retrofit
3 additional market trends, 4 additional growth drivers, and 2 additional restraints and challenges are covered in the full report. Contact sales@marketmindsadvisory.com to access the complete intelligence.

Segment CAGR and Growth Architecture

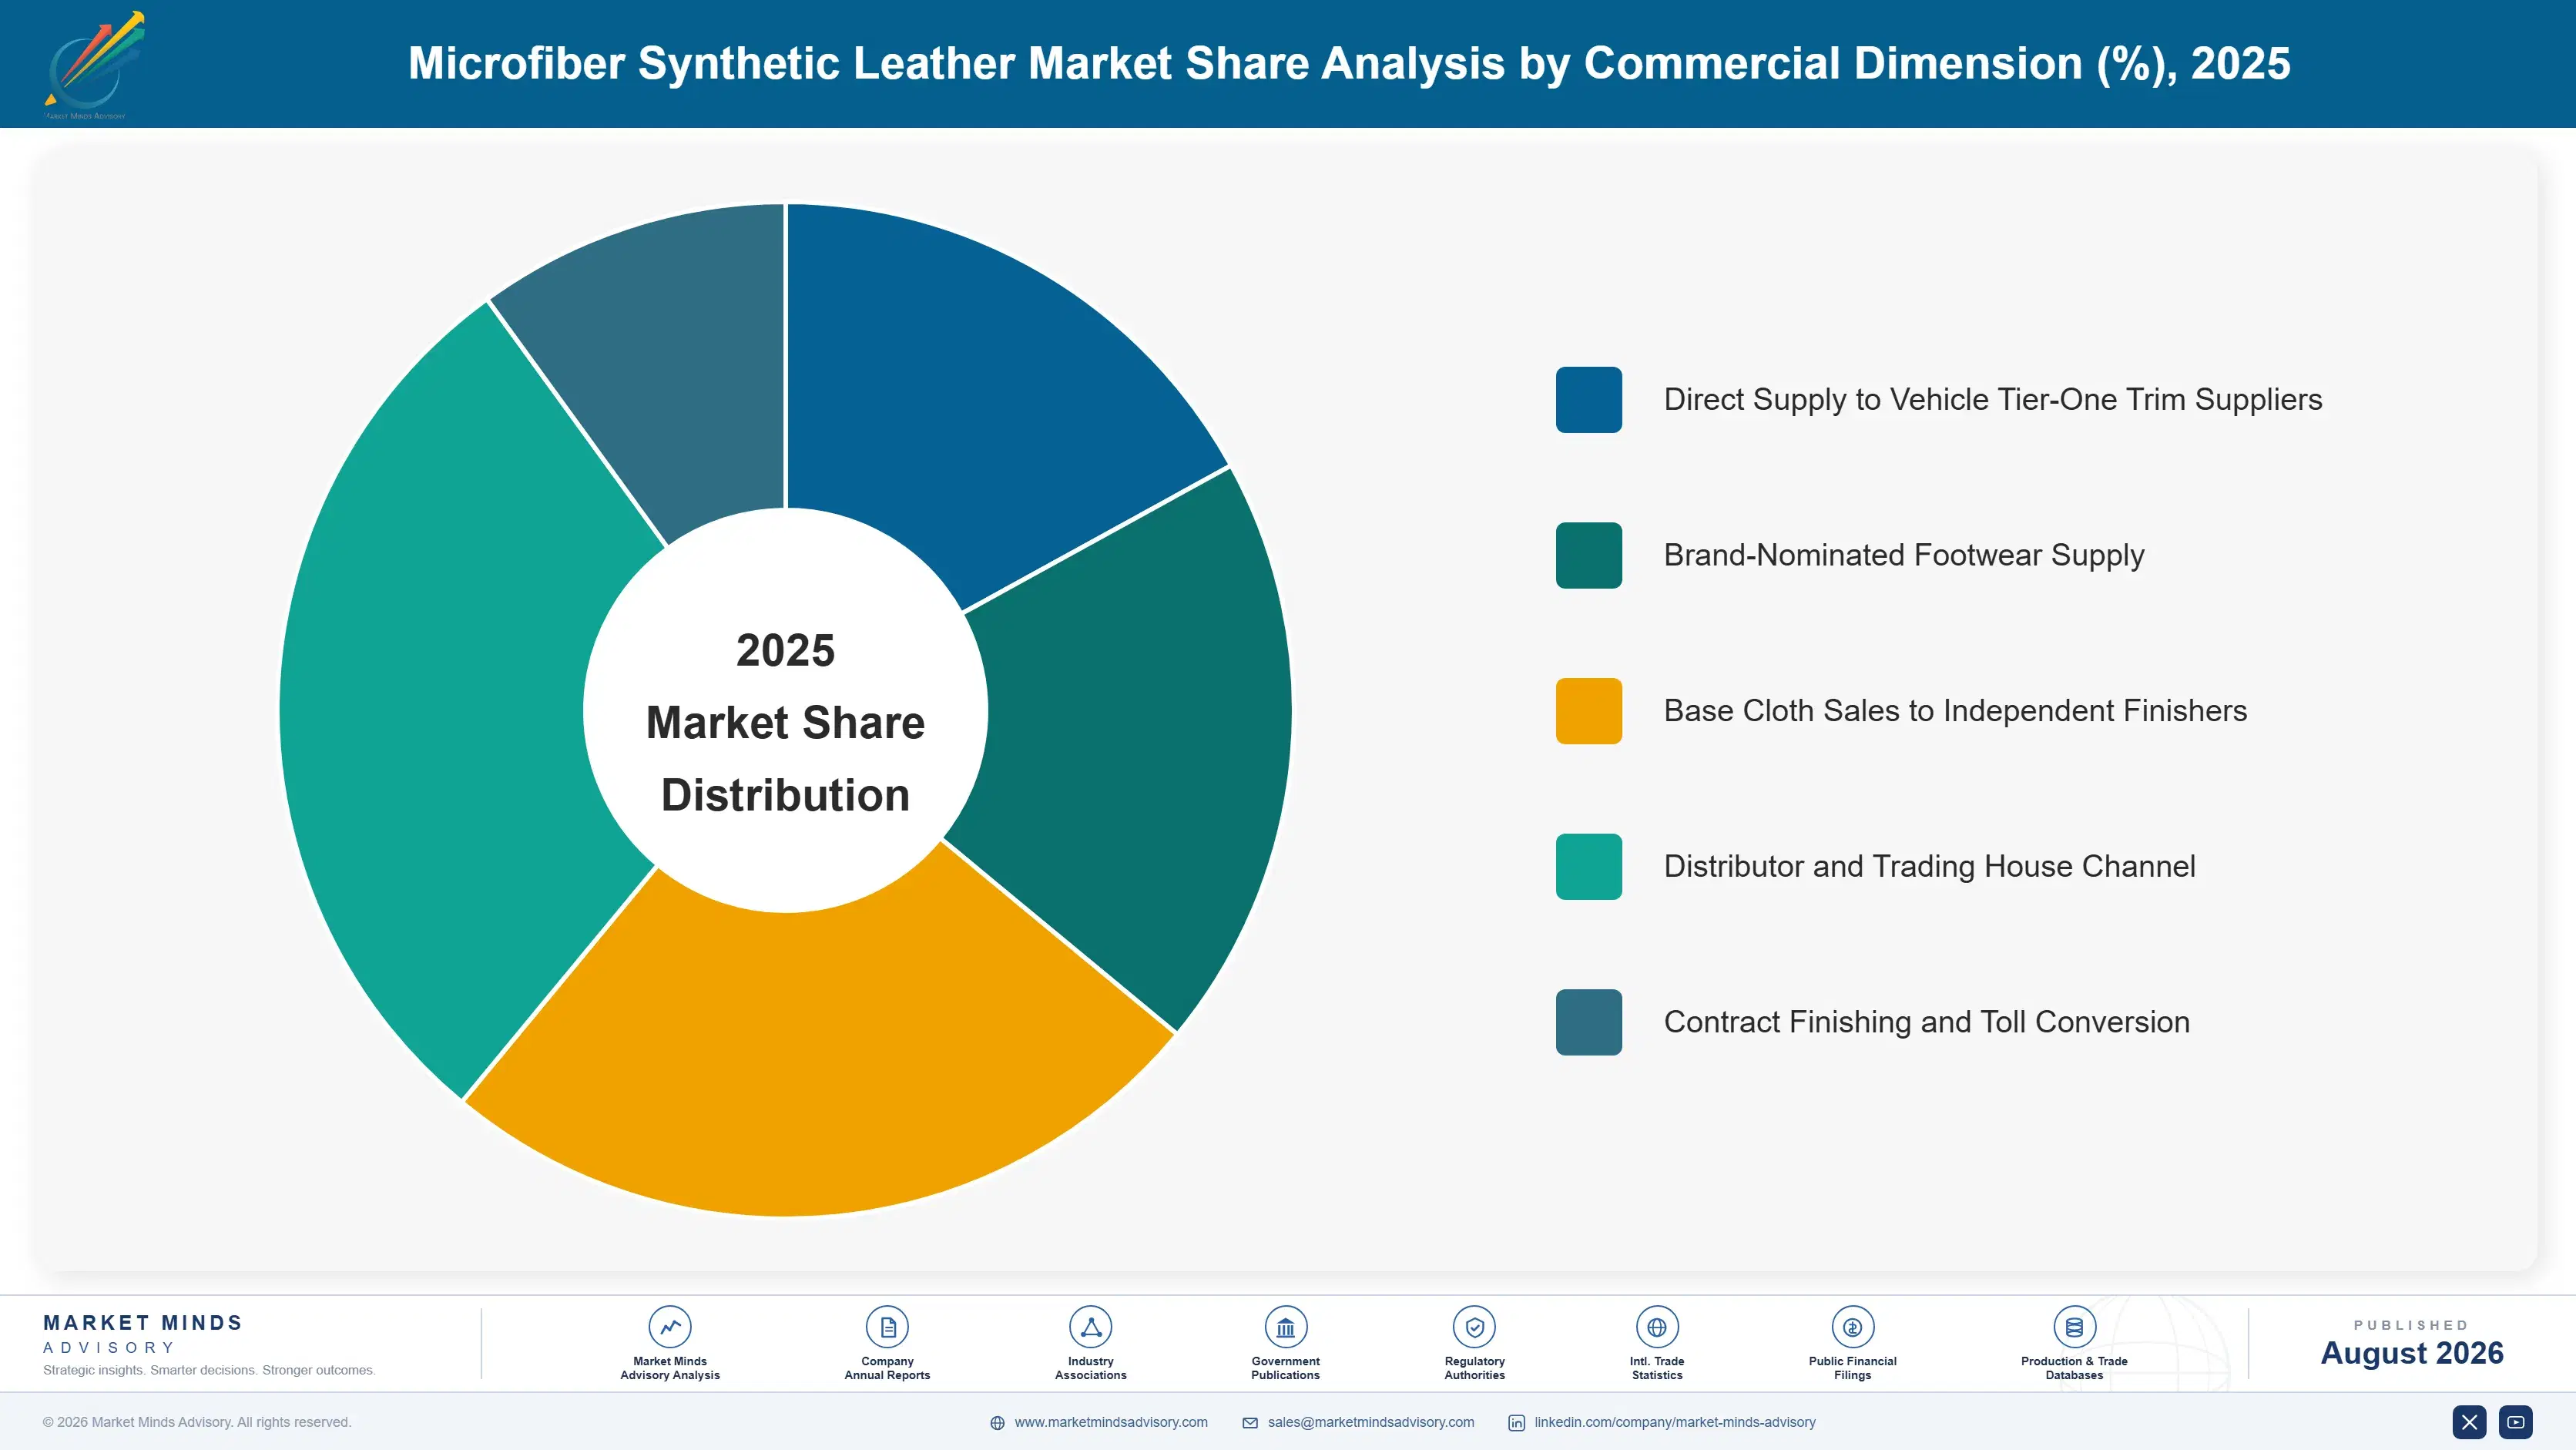
Segmentation follows the polyurethane resin system used to impregnate the base cloth and finish the surface, because that single choice determines the capital equipment required, the emission profile, the achievable hand-feel and ultimately which customers a producer can serve at all. It is the single dimension along which this industry genuinely divides itself today.
microfiber-synthetic-leather-market-trends-market-share-analysis-1787311374443

Waterborne Polyurethane Microfiber Leather

The fastest segment at 12.3%, a full 1.50 times the market rate, covering material impregnated and coated with water-dispersed polyurethane rather than solvent-carried resin. Growth comes almost entirely from specification pull rather than cost advantage: the material costs more to make and sells at a premium of roughly 18% over solvent-based equivalents. Automotive buyers drive most of it, with footwear brands under restricted substance list pressure supplying the rest. The constraint is qualified line capacity, not formulation knowledge, since retrofitting drying and coagulation equipment is expensive and slow. Hand-feel remains the honest technical weakness in premium grades, where the pore structure that water-based coagulation produces is measurably stiffer than what solvent extraction achieves.
CAGR 12.3%

Bio-Based Polyol Microfiber Leather

Growing at 10.9% on polyurethane systems built with polyols derived from castor, corn or recycled polyester feedstock rather than conventional petrochemical routes. Adoption is driven by carmaker and brand carbon accounting rather than by any performance advantage, and the material performs essentially like its conventional equivalent. Bio-content typically runs 30% to 55% of the polyol fraction, and buyers increasingly specify a verified minimum rather than accepting a general claim. Pricing carries a modest premium that brands generally absorb into their own sustainability budgets rather than passing along. Feedstock availability, particularly for castor-derived polyol grown on limited acreage in India and Brazil, is the practical ceiling on how quickly this segment can actually scale.
CAGR 10.9%
Full segment breakdown across 5 segments available in the complete report.

Regional Architecture and Country Demand Map

East Asia dominates on base cloth capacity ownership rather than consumption alone, holding well above the usual regional share. South Asia and Pacific grows fastest as Vietnamese and Indonesian footwear conversion accelerates. North America and Western Europe consume high-value automotive grades they do not produce.

East Asia

Forty percent of global value sits here, and the concentration is real rather than an artefact of accounting. Note: this exceeds the standard regional band because Chinese and Japanese producers own the great majority of world islands-in-the-sea base cloth capacity, and base cloth is where the value concentrates. Chinese output alone accounts for 58% of global base cloth production, with Fujian and Zhejiang holding most of it. Japanese producers occupy the premium end, supplying automotive and luxury goods grades at prices several times Chinese commodity levels. Growth of 9.4% reflects both domestic automotive demand and export volume. Solvent restriction has rationalised the Chinese producer count considerably, and the survivors have priced that improved position into contracts.
Share: 40% | CAGR: 9.4% (2026 to 2036)

North America

Twenty percent of global value, consumed almost entirely as finished material rather than produced locally. Note: this sits below the standard regional band because there is essentially no domestic base cloth capacity and the region imports nearly all of its supply. Demand concentrates in automotive interiors, where US and Mexican assembly plants specify microfiber on an expanding share of platforms, and in furniture and marine upholstery. Growth of 7.6% tracks vehicle build rates more than anything else. Trade policy is the live commercial variable: tariff exposure on Chinese-origin material has pushed several tier-one trim suppliers toward Japanese, Korean and increasingly Vietnamese sourcing despite the landed cost difference that shift involves for every programme affected.
Share: 20% | CAGR: 7.6% (2026 to 2036)
Regional intelligence for 5 additional markets available in the complete report: Western Europe, South Asia and Pacific, Latin America, Middle East and Africa, Eastern Europe. Contact sales@marketmindsadvisory.com.
microfiber-synthetic-leather-market-trends-country-cagr-analysis-1787311374961

Where Margin Actually Sits In This Chain

Four commercial moves separate the producers earning material margins from converters earning only conversion margins. Each one depends on holding something that downstream buyers cannot obtain elsewhere at short notice: qualified waterborne capacity, an automotive approval record, verified bio-content documentation, or outright base cloth ownership that independent finishing houses have no choice but to come to you for.

Convert Impregnation Lines To Waterborne Ahead Of Demand

Retrofitting a line for waterborne polyurethane costs $9 million to $16 million and takes about fourteen months including requalification. Producers who completed it before 2024 now sell qualified waterborne grades at roughly 18% above solvent-based equivalents into a market where automotive buyers are actively short. Those who waited face the same capital cost with none of the pricing benefit, because by the time their lines run the premium will have compressed. The economics here reward early commitment specifically, which is uncomfortable for boards accustomed to building capacity only against a confirmed order book.
Market Impact: Sustains roughly 18% pricing premiu

Pre-Qualify Through Tier-One Trim Suppliers First

Approaching carmakers directly means a 26-month qualification cycle. Approaching through an already-approved tier-one trim supplier cuts that to roughly 18 months, because the trim supplier's own material approval framework carries part of the testing burden. The cost is margin: tier-ones take a slice and specify commercially aggressive terms. But the volume arrives two model years earlier, and the first platform award makes every subsequent one easier. Producers who treat the tier-one relationship as a route to market rather than as an ordinary customer relationship extract considerably more value from it.
Market Impact: Cuts automotive qualification timel

Document Bio-Content To Verified External Standards

Buyers increasingly reject general sustainability claims and require verified bio-carbon content measurement with third-party attestation. Producers holding that documentation win specifications outright against technically identical material that lacks it, and they charge 6% to 9% more for the same product. Certification and testing costs run under $80,000 annually per grade family, which makes the return unusually clean. The reason it works is that brand carbon accounting teams need auditable numbers rather than assurances, and very few Asian producers have yet organised themselves to supply those numbers consistently across a full grade family.
Market Impact: Adds up to 9% pricing on verified g

Sell Base Cloth To Competing Finishing Houses

Producers who own base cloth capacity often restrict it to internal use, which leaves capital underemployed when their own finishing demand dips. Selling base cloth to independent finishers lifts line utilisation from around 71% toward the high eighties and generates margin on an asset that would otherwise idle. The objection is that it arms competitors, but finishers compete on price in a segment the base cloth owner mostly does not want anyway. Producers running this model report 15% to 22% higher return on the base cloth asset across a full cycle.
Market Impact: Lifts base cloth asset return by up

Who Controls the Margin Pool

Concentration is high for a materials business of this size. The five largest producers hold 47% of global revenue, measured on microfiber leather revenue across all participants, and Huafon Microfibre leads on volume by a considerable margin. The gap to the second tier is widest in base cloth capacity rather than in finished output, which is the position that actually matters.
Competition runs on three dimensions currently. Qualified waterborne capacity is the sharpest, since automotive buyers cannot substitute freely and the available supply is genuinely tight. Automotive approval records matter almost as much, functioning as a barrier that money alone cannot clear inside two years. Price competition is intense but confined to footwear and furniture grades where specification requirements are looser and Chinese finishing houses without base cloth ownership fight for volume.

Two pressures are building. Japanese and Italian producers hold the premium automotive and luxury positions on hand-feel that waterborne systems still struggle to match, and if solvent-free chemistry closes that gap their protection erodes quickly. Meanwhile Vietnamese and Indian entrants are building finishing capacity beside footwear manufacture, which threatens Chinese finishing houses more than base cloth owners. Rankings shift where waterborne capability and automotive approvals meet.
microfiber-synthetic-leather-market-trends-company-positioning-matrix-1787311375482

Competitive Moat and Risk Dimensions

HUAFON MICROFIBRE

Moat: Largest qualified base cloth capacity

The company owns more islands-in-the-sea base cloth capacity than any competitor, and that capacity took years and considerable capital to assemble. Downstream finishing houses across China depend on it for supply, which gives the company visibility into competitor volumes and pricing that nobody else in the market has access to.
HUAFON MICROFIBRE

Risk: Concentrated regulatory and policy exposure

Almost all capacity sits within Chinese producing provinces subject to the same solvent, emission and energy policy regime. A further tightening applied nationally would hit every asset at once with no geographic offset available. Trade measures on Chinese-origin material in North America and Europe compound the same concentration from the demand side.
KURARAY

Moat: Premium hand-feel process control

Decades of refinement in fibre splitting and coagulation give the company a surface quality that automotive and luxury buyers consistently rank above alternatives in blind tactile assessment. That advantage rests on process knowledge accumulated across many production campaigns rather than on any patent, which makes it slow to erode and effectively impossible to purchase.
KURARAY

Risk: Premium positioning limits volume growth

The company competes where specification and hand-feel decide, which is a defensible but inherently small pool. Volume growth in this market is coming from mid-specification automotive and athletic footwear, where price matters and where the company's cost position is uncompetitive. Holding the premium end while the market grows elsewhere caps participation in the expansion.

Players Tracked

Prominent Players

Huafon Microfibre
Kuraray
Toray Industries
Asahi Kasei
Alcantara

Other Key Players

Anhui Anli Material Technology
San Fang Chemical Industry
Meisheng Group
Zhejiang Hexin Holdings
Duksung
Teijin Cordley
Filwel
Nan Ya Plastics
Kolon Industries
Daewon Chemical
Wanhua Chemical
Toyobo
Zhejiang Kefeng New Materials
Jiangsu Guobang
Sanling Microfibre

Recent Developments

JANUARY 2025

Huafon commissions additional waterborne impregnation capacity

New waterborne polyurethane impregnation lines entered commercial service at the company's Fujian complex, adding qualified capacity aimed specifically at the automotive interior programmes that European and Japanese carmakers had been unable to source in adequate volume from any domestic supplier operating within their own home regions.
Signal: Waterborne capacity is now being built aga
MAY 2025

Alcantara announces bio-based polyol material introduction

The Italian producer introduced a new interior grade built on partially bio-derived polyol chemistry with independently verified bio-carbon content, targeting European carmakers whose interior carbon accounting now requires auditable feedstock documentation rather than accepting general recycled-content or broad sustainability statements of intent from their material suppliers.
Signal: Verified feedstock documentation is fast b
SEPTEMBER 2025

Kuraray expands automotive-grade finishing in Southeast Asia

The company added finishing and coating capacity serving Southeast Asian vehicle assembly and footwear manufacture, positioning qualified finished output far closer to the trim and upper converters in Vietnam and Thailand that had until then imported all finished material from distant Japanese and Chinese plants.
Signal: Finishing capacity is relocating toward fo

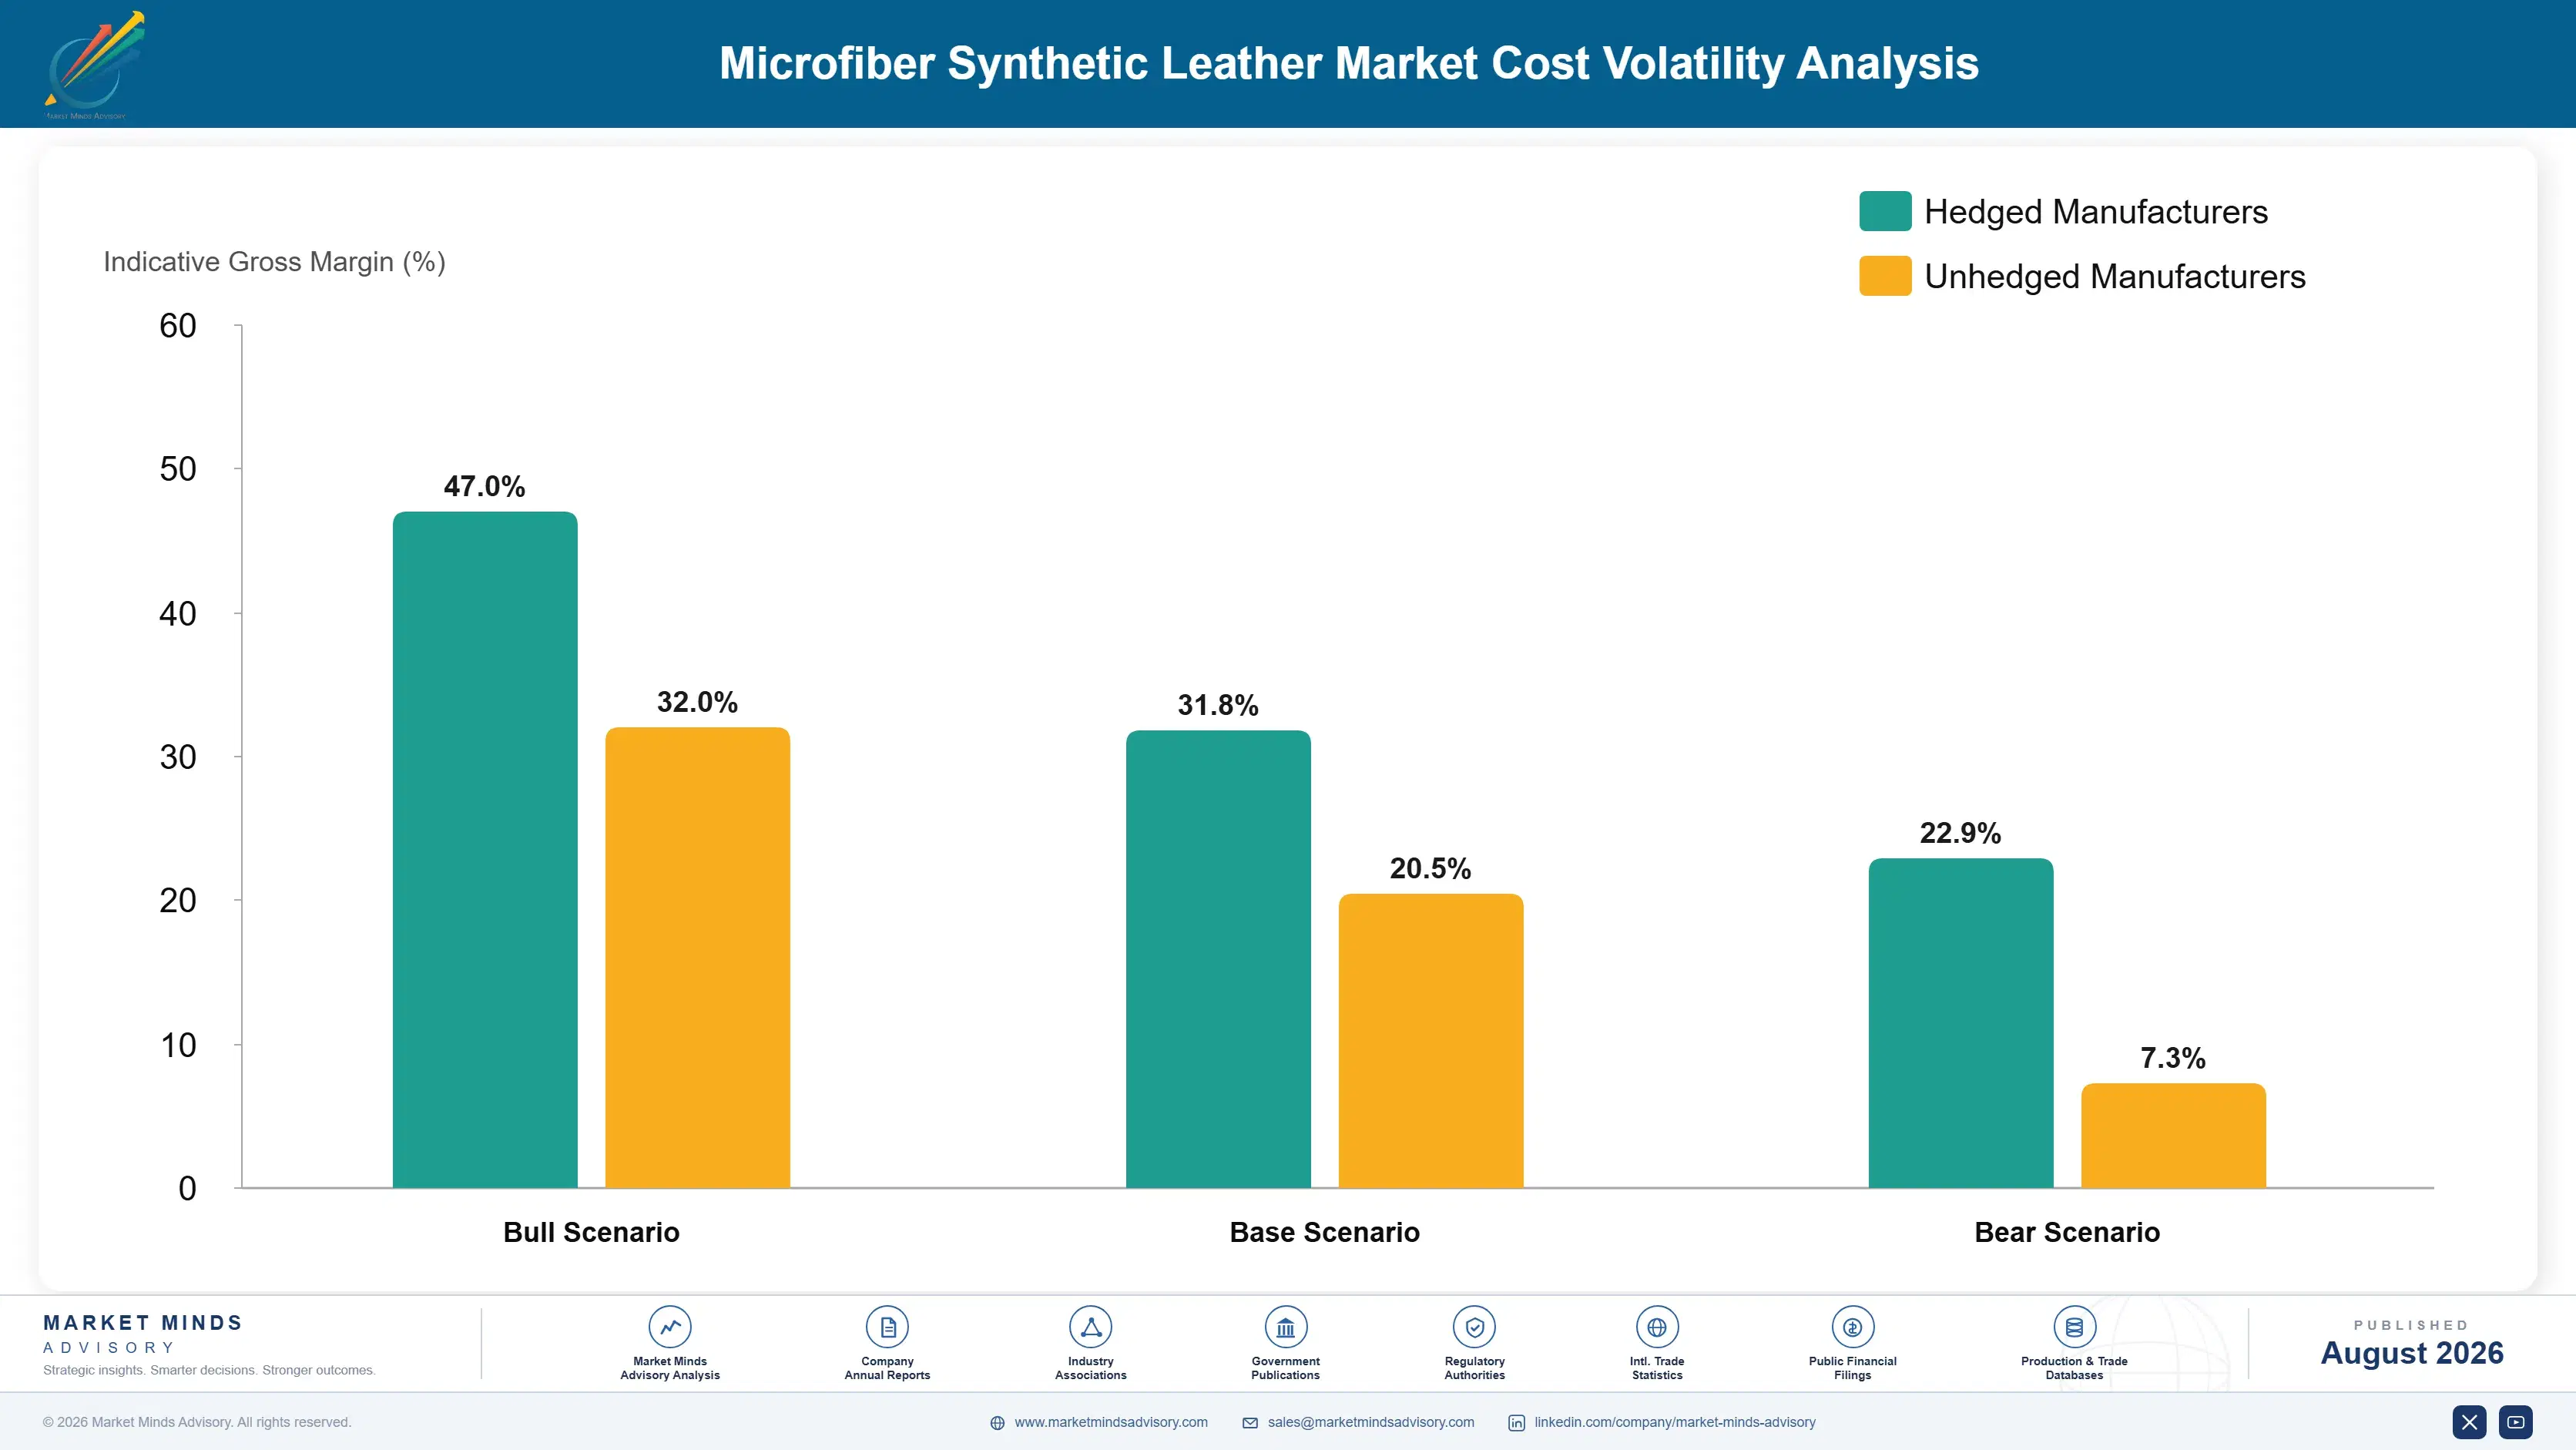
What Drives Production Cost Here

Polyurethane resin and polyol account for roughly 34% of cost of goods, sourced principally from Chinese, Korean and Western European MDI and polyester polyol producers. Polyester and polyamide conjugate fibre feedstock adds another 26%, tracking paraxylene and caprolactam pricing. Energy for drying and coagulation contributes 12%, which is high enough that Chinese provincial power pricing genuinely affects competitiveness.
The 2022 European energy shock demonstrated how exposed the drying stage is. IEA data recorded European industrial gas prices at several times their historical range that winter, and Italian and Spanish finishing operations reported cost increases they could not recover within annual automotive contracts. Alcantara's annual reporting for that period documented material energy cost pressure. Asian producers gained relative position simply by holding cheaper energy, without any operational improvement of their own.

The competitive disadvantage mechanism runs through contract structure rather than raw exposure. Automotive supply agreements fix pricing annually while polyol moves quarterly, so producers weighted toward automotive absorb volatility that footwear-weighted producers pass through within weeks. Chinese producers with captive or nearby resin supply hold a further advantage on logistics. European and Japanese producers carry the worst of both, buying resin at Western prices while selling into fixed automotive contracts.
microfiber-synthetic-leather-market-trends-cost-volatility-analysis-1787311375677

Negotiate quarterly polyol indexation into automotive agreements

Annual price fixing against a quarterly-moving input is the single largest source of margin damage here. Producers now push for indexation clauses referencing published polyol and MDI benchmarks, typically with a quarterly reset and a collar limiting movement to seven percent in either direction, which carmakers now accept considerably more readily than they did five years ago.

Shift drying energy toward recovered heat

Coagulation and drying dominate energy use, and much of the heat currently leaves as exhaust. Heat recovery retrofits cost roughly $2.5 million per line and cut energy cost of goods by around three percentage points, paying back inside four years at current European industrial prices and considerably faster wherever carbon pricing applies to the site.

Qualify a second polyol supplier on every grade

Single-sourced polyol leaves producers exposed when a supplier curtails or reprices, and requalifying a substitute grade against automotive specifications takes months. Carrying a pre-qualified alternate grade costs around $60,000 per grade in testing work and remains the cheapest insurance available anywhere against the kind of supply disruption that hit several producers badly through 2022.

Portfolio Architecture for Margin Defence

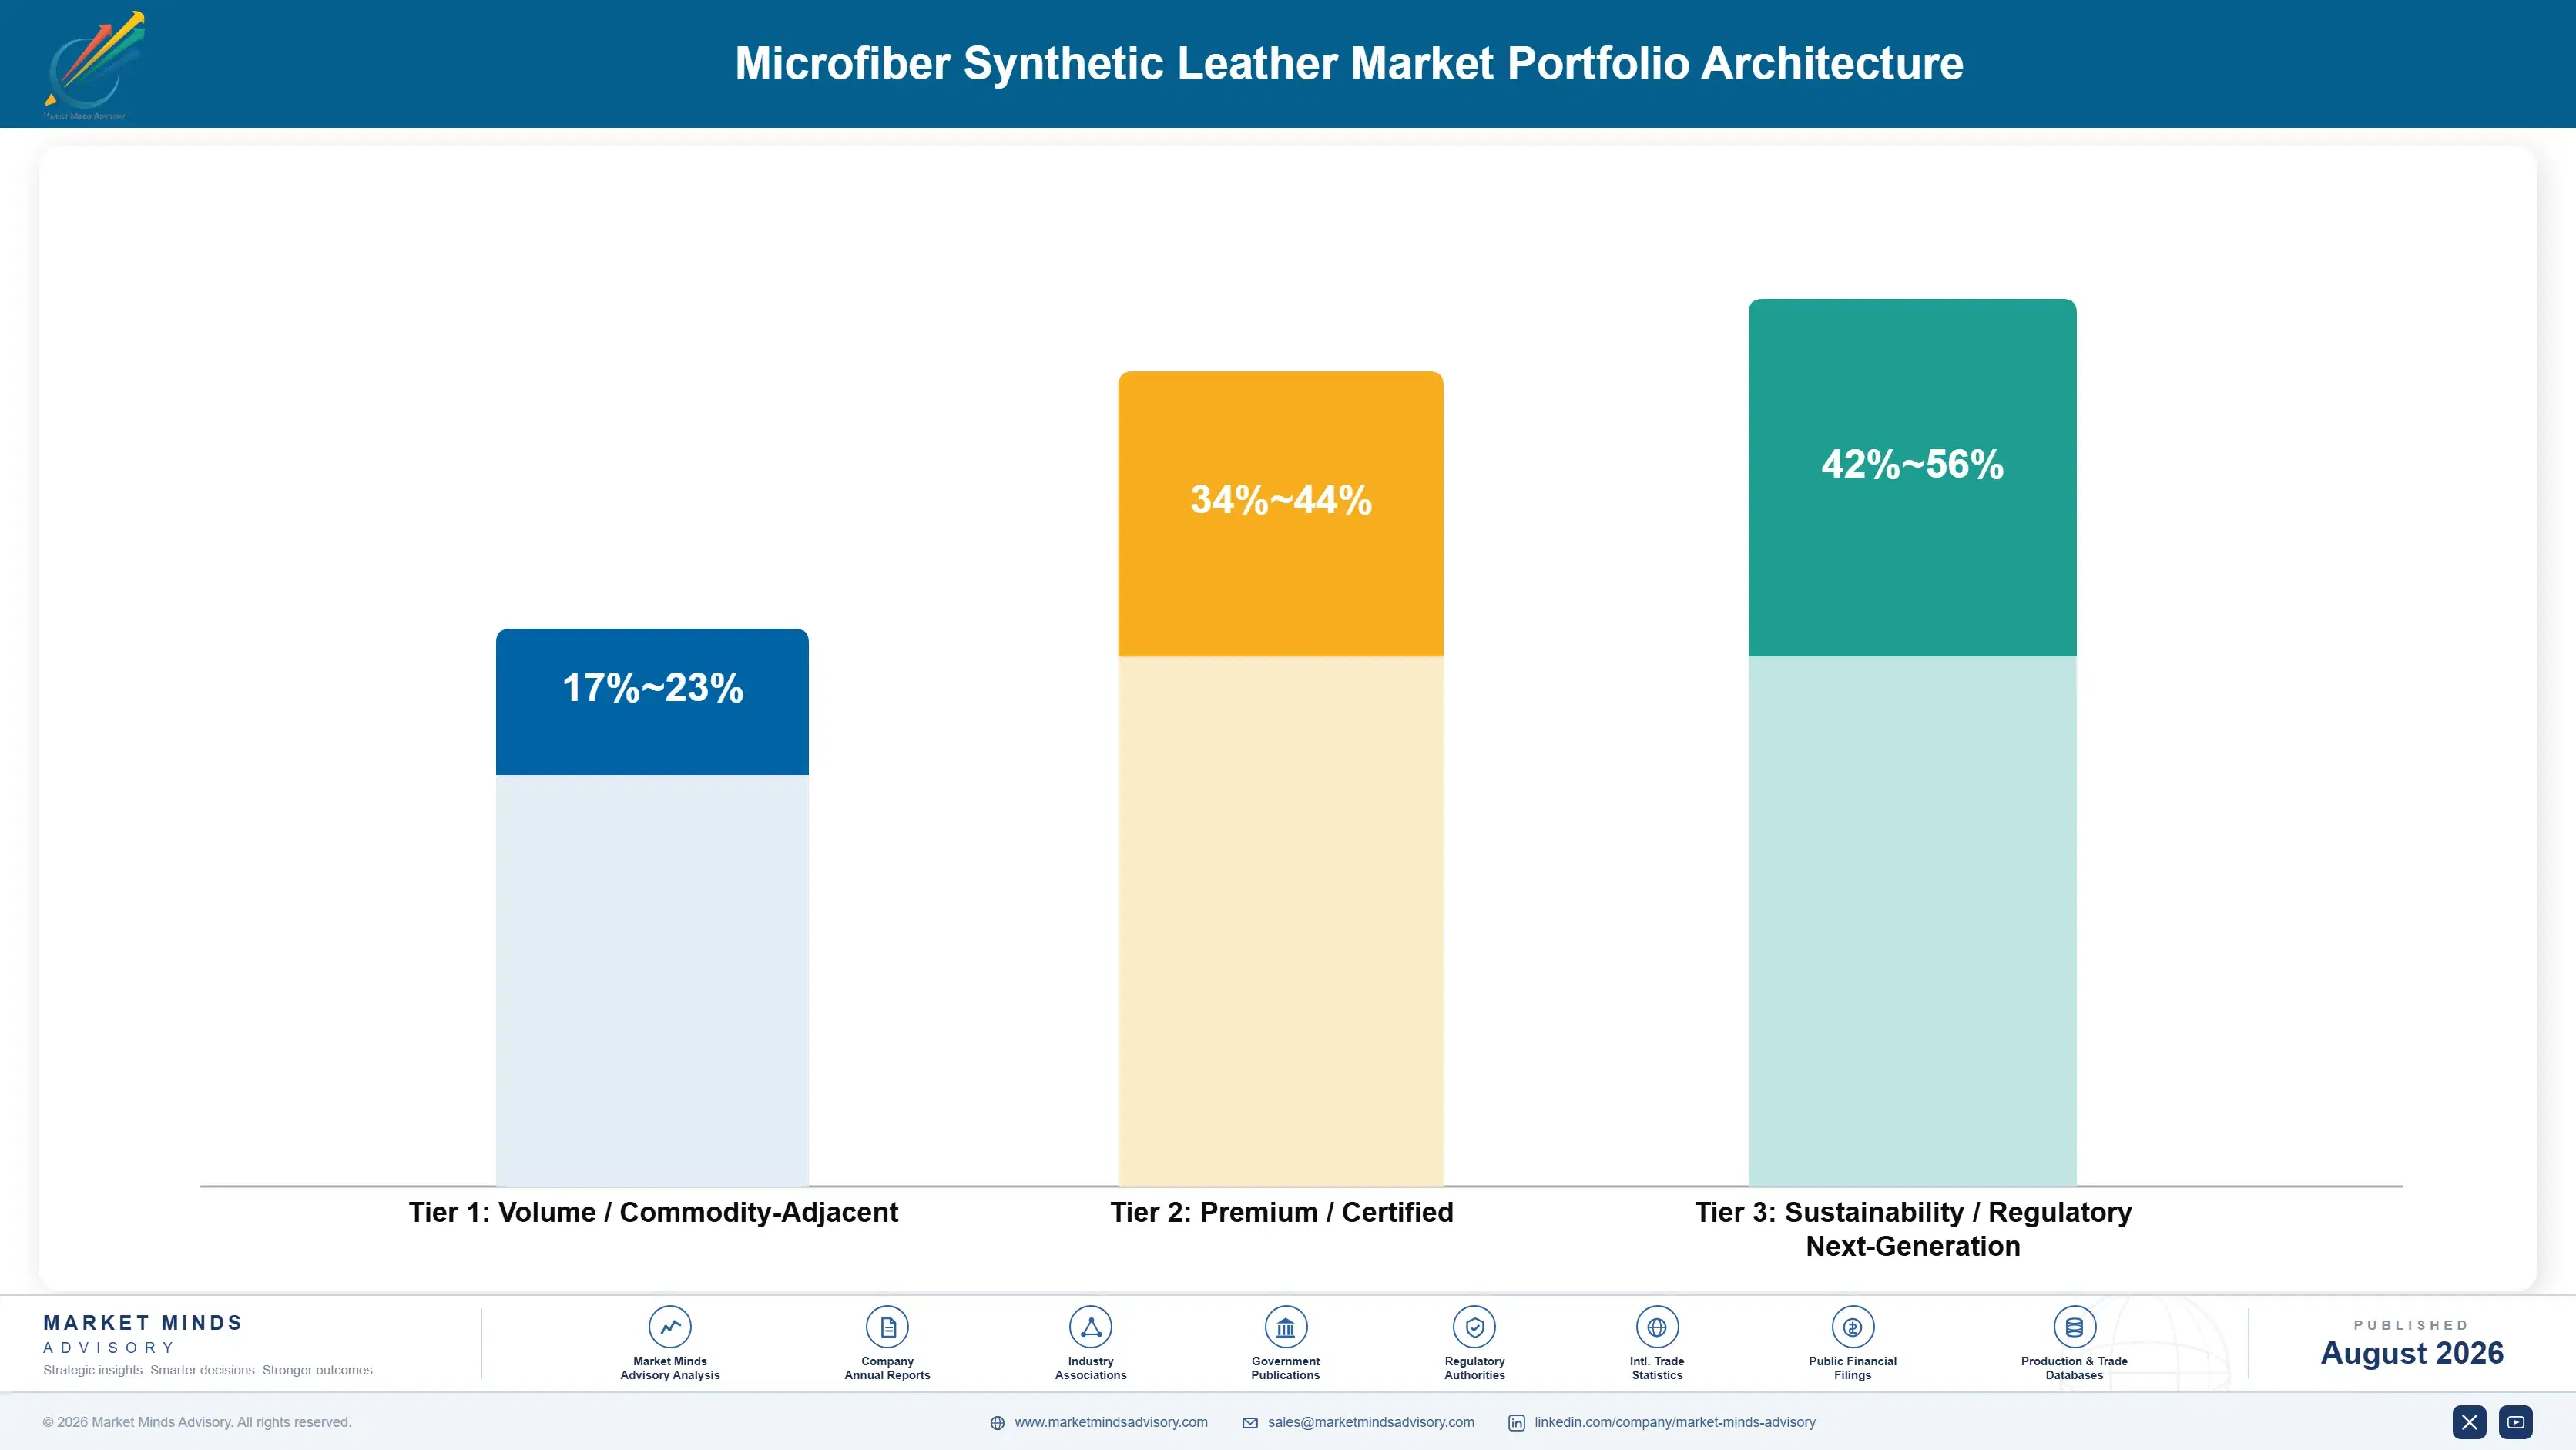
Margin in this industry follows qualification burden almost exactly. Footwear and furniture grades sold on price against loose specifications run at gross margins in the high teens to low twenties, because a dozen Chinese finishing houses can supply them and buyers know it. Automotive-qualified material earns roughly twice that.
The volume-versus-premium tension is genuinely difficult here because of the capital structure. Base cloth lines need high utilisation to earn their cost, and footwear volume is what fills them, yet footwear is exactly where pricing is worst. Producers who chase automotive exclusively run their most expensive asset below eighty percent loading. Those who fill on footwear find the automotive customer waiting behind a queue they cannot serve.

Value concentrates where qualification, capacity scarcity and documentation requirements overlap. Waterborne automotive grades sit at that intersection today and command the market's best pricing. Premium hand-feel material for luxury goods earns more per square metre still but moves in volumes too small to matter to capacity planning. The commodity footwear pool generates the least margin per unit and remains, awkwardly, the volume that makes the whole asset base work.

Volume / Commodity-Adjacent

Standard solvent-processed grades for mid-market footwear, furniture upholstery and general goods. Specifications are loose, supplier choice is wide, and buyers move on delivered price. This work exists mainly to keep base cloth and finishing lines loaded through the year.
Gross Margin: 17-23%

Premium / Certified

Automotive-qualified and branded athletic footwear grades carrying documented approval records. Pricing holds because qualification is expensive to repeat and specifications lock for a platform life. Range reflects the wide gap between mid-range vehicle interiors and premium marque programmes.
Gross Margin: 34-44%

Sustainability / Regulatory / Next-Generation

Waterborne, solvent-free and verified bio-content grades sold into automotive and premium brand programmes. Scarcity of qualified capacity supports the pricing more than the chemistry does. Range is wide because bio-content premiums vary considerably by buyer and by how carbon accounting is applied.
Gross Margin: 42-56%
microfiber-synthetic-leather-market-trends-portfolio-architecture-1787311376183

High-value Sub-segments and Strategic Watch-out

Waterborne Automotive Grades

High value on genuinely high growth at 12.3%, and the strongest realised pricing in the market today. Qualified capacity is short, automotive buyers cannot substitute quickly, and the producers who retrofitted early are collecting a premium that will compress sharply once competing lines finish their own qualification work.
Gross Margin: 42-56%

Bio-Based Polyol Material

Strong pricing on solid rather than spectacular growth at 10.9%. The premium rests on verified documentation rather than any performance advantage, which makes it durable while carbon accounting requirements tighten but vulnerable in the longer run if buyers eventually come to treat bio-content as a simple baseline expectation.
Gross Margin: 40-50%

Commodity Footwear Grades

The utilisation backbone of the whole asset base, necessary for base cloth line economics but earning gross margins in the high teens. Chinese finishing houses without capital positions compete this pool down relentlessly, and Vietnamese entrants are now adding fresh finishing capacity into exactly the same segment.
Gross Margin: 17-23%

Premium Hand-Feel Luxury Material

The strategic watch-out. Japanese and Italian producers earn excellent margins on tactile quality that waterborne systems cannot yet match, but solvent-free chemistry is now closing that gap steadily year by year. When that gap finally closes, a defensible premium position turns into an ordinary one very quickly indeed.
Gross Margin: 46-58%

How This Demand Actually Repeats

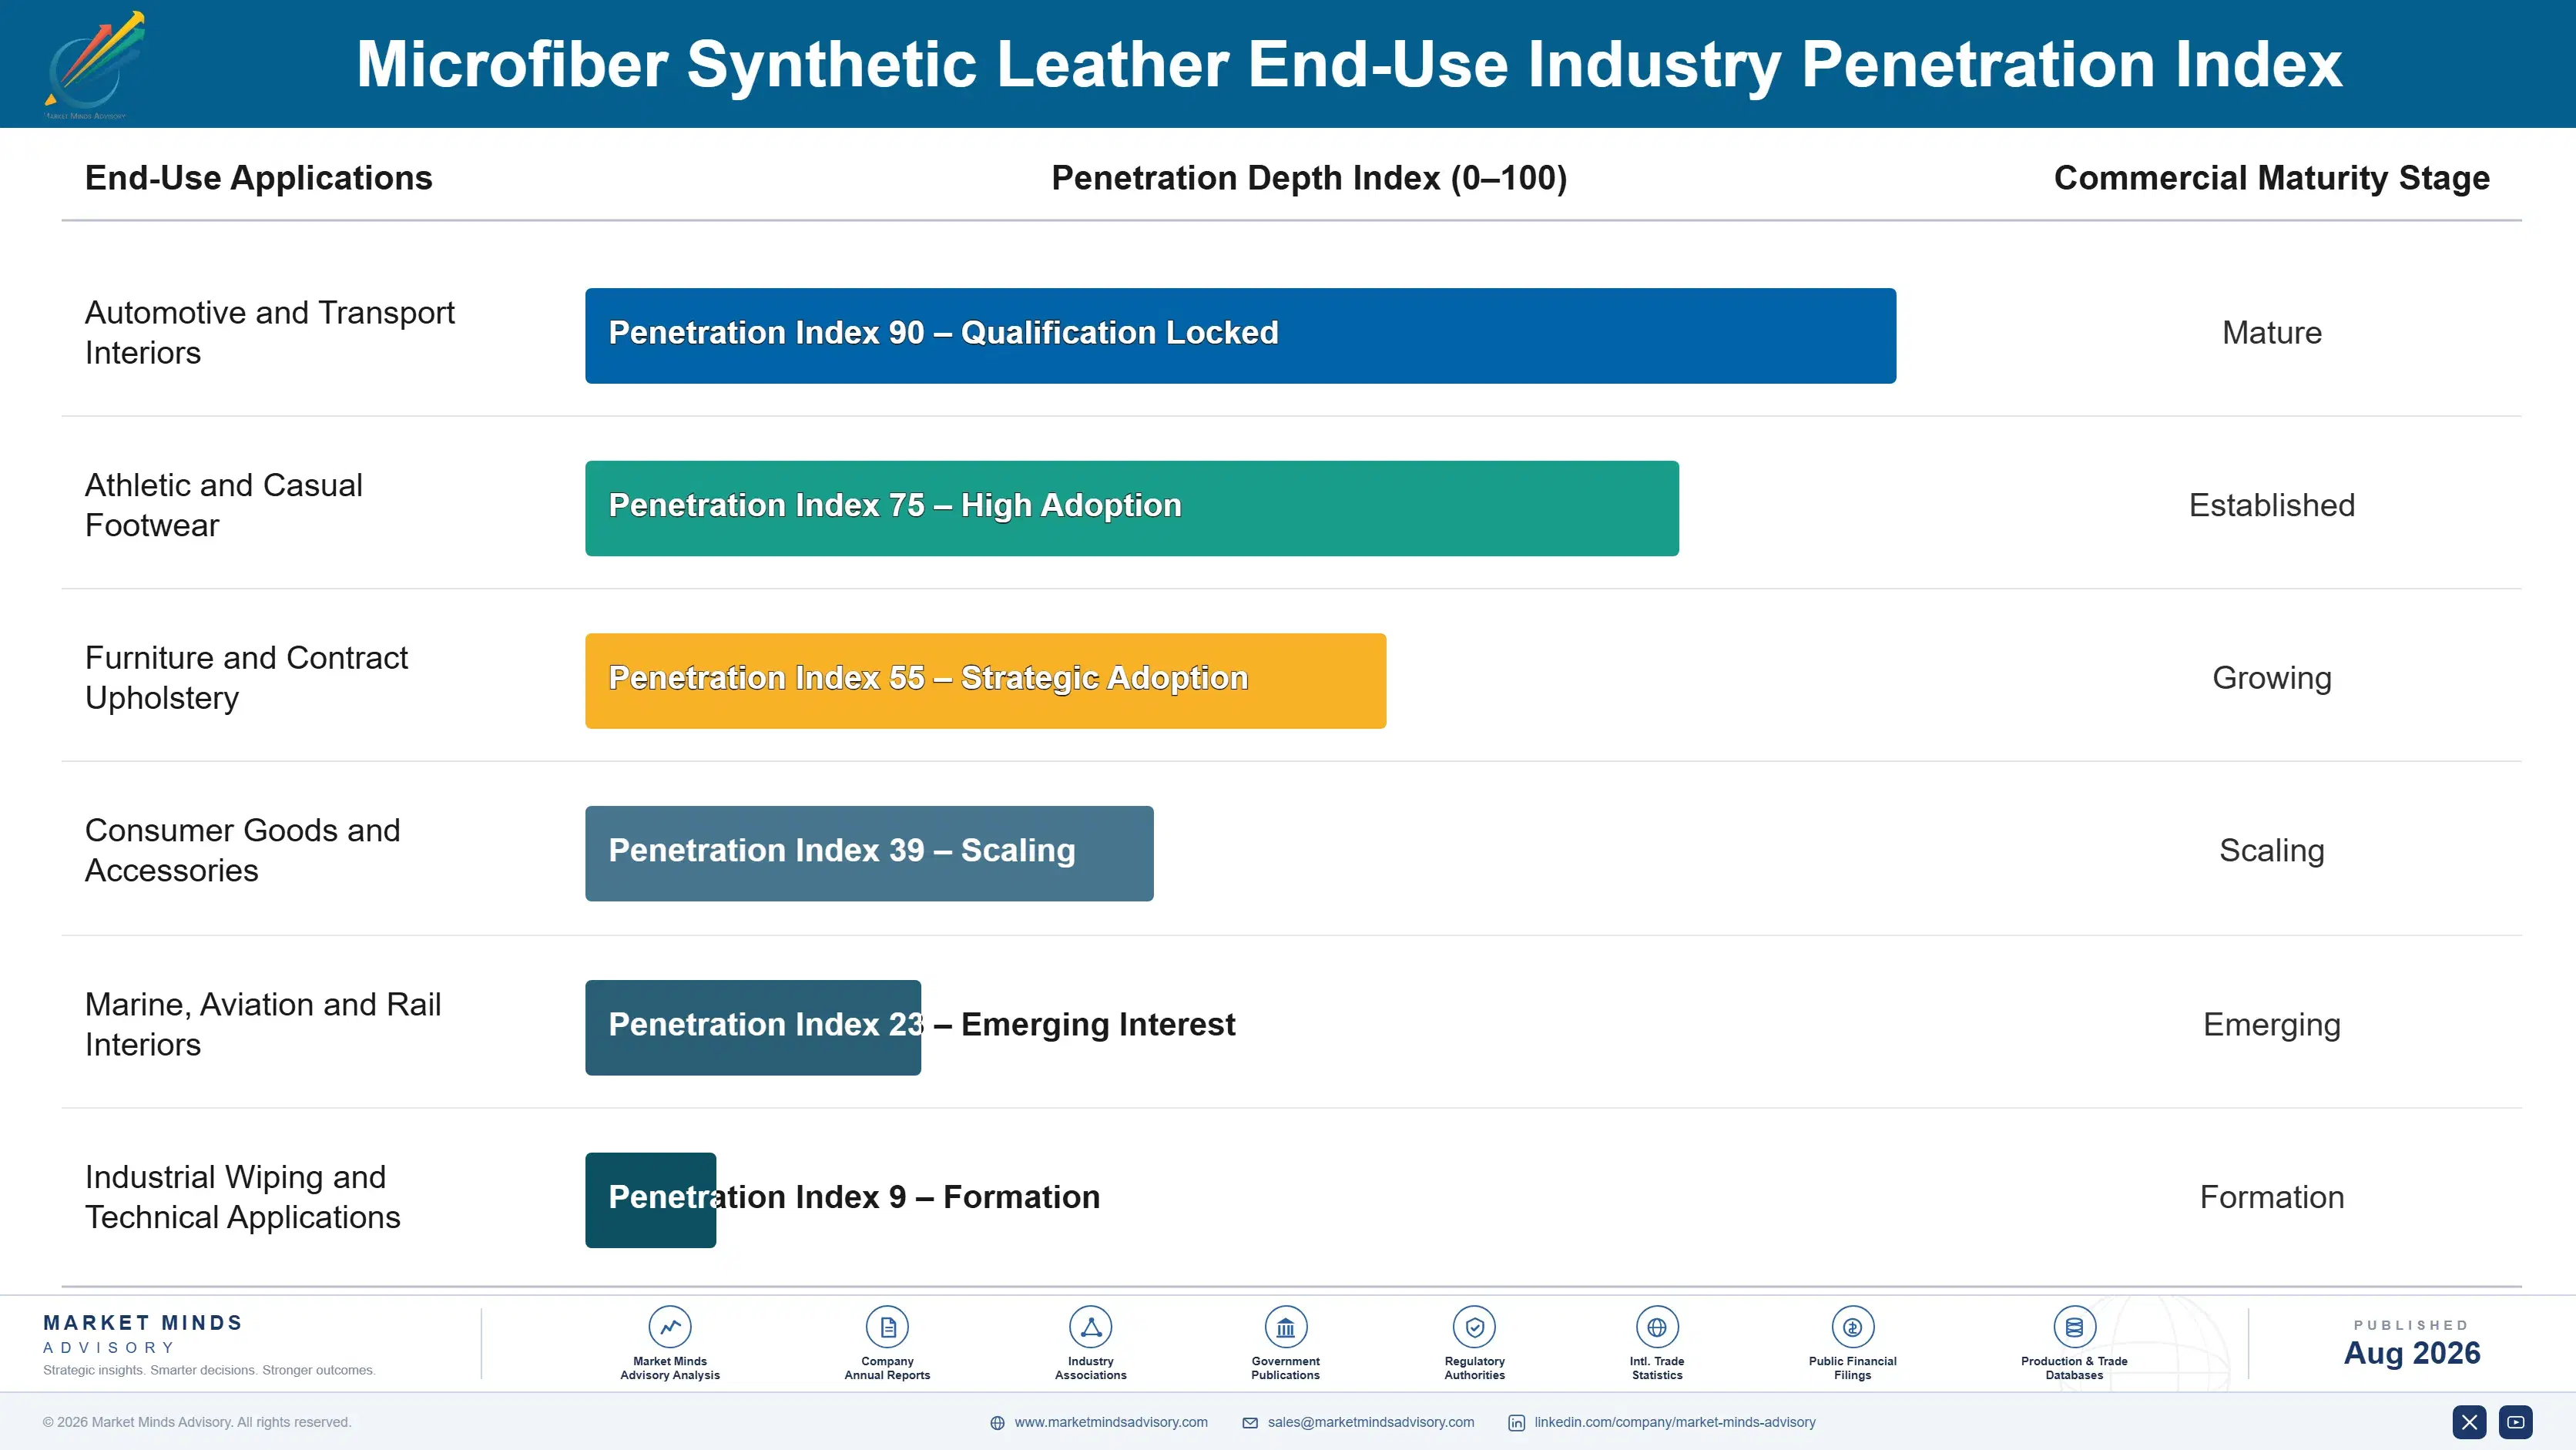
Automotive demand behaves as an annuity attached to a vehicle platform. Once material is qualified into an interior programme it ships for the platform's production life, typically six to eight years, at volumes the carmaker forecasts and the supplier plans against. No further selling is required and no competitor can enter mid-cycle.
Stickiness varies sharply by end-use. Automotive interiors are the tightest, since requalification means reopening a homologation package nobody wants to touch. Branded athletic footwear sits a step looser: brands review material annually and will move volume between qualified suppliers on price, though the qualified list itself changes slowly. Furniture and general goods are barely sticky at all, with buyers switching between finishing houses on nothing more than a quotation. Marine and aviation upholstery sit nearer the automotive end, since certification burden is comparable.

Buyer profiles have shifted noticeably. Material selection once sat with interior design and purchasing, judged on appearance and price. It now involves sustainability and compliance functions who ask about solvent residue, bio-content verification and supply chain audit records, and who hold effective veto. Producers whose commercial organisations still lead with samples and pricing find themselves talking to people who no longer make the decision alone.
microfiber-synthetic-leather-market-trends-end-use-penetration-index-1787311376672

Where To Commit Capital

These are among the four positions where our research anticipates prominent divergence between winners and laggards over the coming forecast period. Each is grounded in the demand model, the regulatory perimeter, and the announced capacity pipeline.
01 / WATERBORNE CAPACITY TIMING

Retrofit before demand confirms, not after

Qualified waterborne capacity is genuinely short today, and producers who converted before 2024 hold roughly 18% pricing premiums that will not survive the next wave of retrofits coming online. A conversion costs $9 million to $16 million and takes fourteen months including requalification, which means committing on forecast rather than on order book. Boards that wait for confirmed demand before committing will pay exactly the same capital cost as the early movers did and collect none of the pricing premium available today.
02 / AUTOMOTIVE APPROVAL DEPTH

The approval record outlasts any chemistry advantage

Qualification takes 26 months and locks material into a platform for six to eight years of production, which makes an approval record the most durable asset in this industry. Chemistry advantages erode steadily as competitors close the technical gaps between them, but a qualified position on a platform already in series production cannot be attacked at all. Capital directed at winning approvals, including through tier-one trim relationships that cut roughly eight months from the cycle, returns considerably more reliably than product development spending does.
03 / BASE CLOTH UTILISATION

Fill the expensive asset, even at thin margin

Base cloth lines cost $40 million to $70 million and only earn their capital at high loading, yet global utilisation sits at 71%. Commodity footwear volume is what actually fills those lines despite gross margins sitting in the high teens, and refusing that work to protect average margin destroys more value than it preserves. Selling surplus base cloth to independent finishing houses lifts returns on that asset by 15% to 22% across a full business cycle, which is the cleanest fix available.
04 / HAND-FEEL POSITION DEFENCE

Premium tactile advantage has a closing window

Japanese and Italian producers earn their best margins on a surface quality that waterborne systems still cannot reproduce, and roughly 20% of premium specifications continue to reject waterborne grades on tactile assessment alone. Solvent-free chemistry is nonetheless now narrowing that gap considerably faster than most premium producers publicly acknowledge. Firms holding this position today should be busy converting that advantage into long-dated automotive platform awards right now, while tactile quality still carries genuine decisive weight inside a carmaker specification decision.

Engagement Snapshot From the Field

A live engagement with an industry participant carrying material or product regulatory and market exposure ahead of a defining policy shift, showing how our research translates into a defensible multi-year portfolio strategy.
MARKET MINDS ADVISORY · CLIENT ENGAGEMENT SUMMARY
Microfiber Synthetic Leather Producer Strategic Portfolio Review and Transition Roadmap 2026·Investment Scenario on Microfiber Synthetic Leather Exposure Evaluation 2025-26
CLIENT PROFILE
A privately held microfiber synthetic leather producer with annual revenue near $210 million (client-reported, unverified by MMA), operating two base cloth lines and four finishing lines across China and Taiwan. Roughly 78% of revenue came from athletic footwear and furniture grades sold on annual quotation, with no automotive platform awards and no waterborne-qualified capacity anywhere in the asset base at the time of engagement.
STRATEGIC CHALLENGE
Footwear margins had compressed by six points across three years as Vietnamese finishing capacity came online, and the board wanted to know whether converting a line to waterborne production and pursuing automotive qualification represented a credible escape or an expensive distraction. Nobody internally could size the automotive opportunity or the realistic timeline to first revenue from it.
MMA APPROACH
MMA modelled waterborne conversion economics against three demand scenarios, mapped automotive qualification pathways through both direct carmaker and tier-one trim supplier routes, and assessed competing qualified capacity coming online through 2028. Findings were tested against 47 expert interviews covering carmaker interior specification practice, tier-one material approval frameworks and competitor retrofit programmes across the region.
KEY FINDINGS
  1. Waterborne pricing premiums were forecast to compress from roughly 18% to under 9% by 2029 as competing retrofits completed, sharply narrowing the window in which conversion economics worked.
  2. Direct carmaker qualification would take 26 months, while a tier-one trim supplier route cut it to about 18 months at a cost of four to six margin points shared with the tier-one partner.
  3. The client's existing footwear customer relationships gave it no useful standing with automotive buyers, who assessed suppliers on approval records the company had never begun to build anywhere.
  4. Selling surplus base cloth to independent finishers would lift utilisation from 68% toward the mid-eighties, funding a large share of the conversion capital without any external financing.
CLIENT PROFILE
A privately held microfiber synthetic leather producer with annual revenue near $210 million (client-reported, unverified by MMA), operating two base cloth lines and four finishing lines across China and Taiwan. Roughly 78% of revenue came from athletic footwear and furniture grades sold on annual quotation, with no automotive platform awards and no waterborne-qualified capacity anywhere in the asset base at the time of engagement.
STRATEGIC CHALLENGE
Footwear margins had compressed by six points across three years as Vietnamese finishing capacity came online, and the board wanted to know whether converting a line to waterborne production and pursuing automotive qualification represented a credible escape or an expensive distraction. Nobody internally could size the automotive opportunity or the realistic timeline to first revenue from it.
MMA APPROACH
MMA modelled waterborne conversion economics against three demand scenarios, mapped automotive qualification pathways through both direct carmaker and tier-one trim supplier routes, and assessed competing qualified capacity coming online through 2028. Findings were tested against 47 expert interviews covering carmaker interior specification practice, tier-one material approval frameworks and competitor retrofit programmes across the region.
KEY FINDINGS
  1. Waterborne pricing premiums were forecast to compress from roughly 18% to under 9% by 2029 as competing retrofits completed, sharply narrowing the window in which conversion economics worked.
  2. Direct carmaker qualification would take 26 months, while a tier-one trim supplier route cut it to about 18 months at a cost of four to six margin points shared with the tier-one partner.
  3. The client's existing footwear customer relationships gave it no useful standing with automotive buyers, who assessed suppliers on approval records the company had never begun to build anywhere.
  4. Selling surplus base cloth to independent finishers would lift utilisation from 68% toward the mid-eighties, funding a large share of the conversion capital without any external financing.
RECOMMENDED STRATEGY
Phase 1: Phase one: convert the newer base cloth line to waterborne within fourteen months, funded partly through opening base cloth sales to independent finishing houses. Phase 2: Phase two: enter automotive qualification through two tier-one trim suppliers concurrently rather than pursuing carmakers directly, accepting the margin share for speed. Phase 3: Phase three: build verified bio-content documentation across the whole waterborne grade family before automotive awards land, so both premiums are captured together.
OUTCOME
The client completed conversion in thirteen months and secured its first tier-one material approval within the following year, reporting waterborne grade pricing roughly 16% above its solvent-based equivalents (client-reported, unverified by MMA). Base cloth sales to third-party finishers lifted line utilisation past 80% and funded most of the retrofit capital internally.

Frequently Asked Questions

Foundational context covering the market sizes, CAGR, scope, country, region and competition that inform every finding below. This section is provided to cover basics and most often pre-purchase conversations, answered from the MMA Primary Research Dataset.

What is the current size of the Microfiber Synthetic Leather Market?

The market was worth $3.4 billion in 2025 and is forecast to reach $3.68 billion in 2026. Growth reflects both volume expansion and a mix shift toward higher-priced waterborne grades.

How large will the Microfiber Synthetic Leather Market be by 2036?

MMA forecasts $8.09 billion by 2036, an expansion multiple of 2.20 times the 2026 base. That represents $4.41 billion of incremental value over the forecast period.

What is the CAGR for the Microfiber Synthetic Leather Market 2026 to 2036?

The base case compound annual growth rate is 8.2%, with a bull case of 9.5% and a bear case of 7.0%. Historical growth from 2020 to 2025 also ran at 7.0%.

Which segment is growing fastest?

Waterborne polyurethane microfiber leather at 12.3%, a full 1.50 times the market rate. Automotive interior specifications and brand restricted substance lists drive almost all of that growth.

Who are the major companies in the Microfiber Synthetic Leather Market?

Huafon Microfibre, Kuraray, Toray Industries, Asahi Kasei and Alcantara lead, holding 47% of revenue between them. Fifteen further producers hold meaningful positions across specific grades and regions.

Which country is growing fastest?

Vietnam at 11.6%, driven by athletic footwear manufacture relocating there from China. Local finishing capacity is only now being built to serve that demand rather than importing finished material.

Report Segmentation Architecture

The full report scope spans multiple orthogonal segmentation dimensions, with cross-tabulated demand data provided for each dimension pair. Coverage extends further to regional breakdowns, trend trajectories, and the competitive detail needed to support segment-level decision-making.

By Polyurethane Resin System

  • Waterborne Polyurethane Microfiber Leather
  • Bio-Based Polyol Microfiber Leather
  • Solvent-Free Polyurethane Microfiber Leather
  • Silicone-Modified Polyurethane Microfiber Leather
  • Solvent-Based Polyurethane Microfiber Leather

By End-Use Industry

  • Automotive and Transport Interiors
  • Athletic and Casual Footwear
  • Furniture and Contract Upholstery
  • Consumer Goods and Accessories
  • Marine, Aviation and Rail Interiors
  • Industrial Wiping and Technical Applications

By Commercial Dimension

  • Direct Supply to Vehicle Tier-One Trim Suppliers
  • Brand-Nominated Footwear Supply
  • Base Cloth Sales to Independent Finishers
  • Distributor and Trading House Channel
  • Contract Finishing and Toll Conversion

By Region

  • North America
  • Western Europe
  • East Asia
  • South Asia and Pacific
  • Latin America
  • Middle East and Africa
  • Eastern Europe

Scope, Methodology, and Coverage

Every figure in this report is reproducible from documented input assumptions. The scope below maps the historical period, the forecast horizon, the segmentation dimensions, and the countries covered, alongside the underlying primary and qualitative methodology.
Historical Period
2020 to 2025
Forecast Period
2026 to 2036
Base Year
2025 (USD billions; MMA Primary Research Dataset, August 2026)
Market Definition
This report covers microfiber synthetic leather, defined as nonwoven base cloth produced from islands-in-the-sea or splittable conjugate microfibre, impregnated with polyurethane and surface-finished into a leather-substitute sheet material. Coverage spans waterborne, solvent-free, solvent-based, silicone-modified and bio-based polyol resin systems, together with base cloth sold to independent finishing operations. Conventional coated fabrics on woven or knitted substrates, PVC leathercloth, bonded leather, mycelium and plant-derived alternatives, and finished articles manufactured from any of these materials are excluded from scope.
Quantitative Units
USD billions at producer realised prices; volume in million square metres; capacity utilisation and gross margin percentages by tier.
Segmentation Dimensions
Polyurethane resin system, end-use industry, commercial dimension, region.
Regions Covered
North America, Western Europe, East Asia, South Asia and Pacific, Latin America, Middle East and Africa, Eastern Europe
Countries Covered
China, Japan, South Korea, Taiwan, Vietnam, Indonesia, India, Thailand, United States, Mexico, Canada, Germany, Italy, Spain, France, Brazil, Poland, Czechia, Turkey, South Africa.
Key Companies Profiled
Huafon Microfibre, Kuraray, Toray Industries, Asahi Kasei, Alcantara, Anhui Anli Material Technology, San Fang Chemical Industry, Meisheng Group, Duksung, Teijin Cordley, and ten further producers.
Quantitative Methodology
Primary survey, n=3,800 respondents, Q4 2025, six countries; demand-side model with trade association cross-validation
Qualitative Methodology
47 expert interviews, Q4 2025; applied to validate demand model assumptions, identify emerging dynamics, and assess competitive positioning
Report Format
PDF and XLSX data workbook (Word format preview document)
Publisher
Market Minds Advisory
Report Code
MMA-2026-CHM-690
Published
August 2026
Contact
sales@marketmindsadvisory.com | www.marketmindsadvisory.com

Purchase the full Microfiber Synthetic Leather Market Report (2026 to 2036).

The full report sets out ten-year forecasts for microfiber synthetic leather by polyurethane resin system, end-use industry and commercial model across seven regions. It quantifies waterborne conversion economics line by line, and tracks qualified capacity coming online against committed automotive programme demand through 2030. Competitive assessment covers twenty producers on a consistent revenue basis, with base cloth ownership mapped separately from finishing capacity. Portfolio margin architecture is broken out across three tiers using ranges calibrated to disclosed company performance and interview evidence. Findings draw on a quantitative survey of 3,800 respondents across six countries and 47 expert interviews conducted during the fourth quarter of 2025.
Ten-year forecasts by resin system and region
Waterborne conversion economics modelled line by line
Base cloth capacity mapped separately from finishing
Twenty-producer competitive assessment on consistent revenue basis
Automotive qualification pathways and realistic timeline benchmarks
Input cost composition and volatility exposure by producer type

Built For The People Who Decide

From boardroom strategy to bench-side execution, this report is read cover-to-cover by leaders shaping the next decade of their industry, turning demand scenarios, market dynamics and valuation benchmarks into decisions.
CXOs/ Presidents/ VPs/ Managers
M&A and Corporate Development
Strategy Teams and R&D Heads
Procurement and Product Directors
Regulatory and Compliance Leaders
Investor Relations and Equity Analysts