Market Minds Advisory
Micro Vials Market

Micro Vials Market: Adsorption Losses, Autosampler Compatibility and the Container That Quietly Changes the Result

At microlitre volumes the surface area to sample ratio becomes extreme, and a compound that binds to the vial wall simply disappears from the analysis without anything in the chromatogram indicating it ever existed.

Lead Analyst

Bilal Shaikh

Published

September 2026

Make Smarter Decisions with Customized Research Insights

Request a free sample report and evaluate market opportunities, growth trends, and competitive dynamics relevant to your business needs.

2025 MARKET VALUE$1.2BMarket Size 2025
2036 FORECAST VALUE$3.0BBase Case , 2026 to 2036
CAGR 2026 TO 20368.4 %Bull 9.6% / Bear 7.2%
INCREMENTAL OPPORTUNITY$1.7BNet 10- year value creation
EXPANSION MULTIPLE2.24x2036 value over 2026 base
Strategic Levers
M&A Pipeline
Regional Outlook
Country Rankings
Competitive Intelligence
Segmental Deep-dive
Call-Us : 91 93563 13602

Executive Snapshot and Market Trajectory

Shrink a sample container and the surface area per microlitre rises sharply. A peptide or a hydrophobic drug metabolite that binds to glass or polypropylene at that ratio is simply gone before the autosampler ever draws. Nothing in the data flags it.
Low-adsorption and surface-treated vials compound at 12.6%, exactly 1.50 times the market, as biologics bioanalysis and trace environmental work push detection limits into territory where wall losses matter more than instrument sensitivity. East Asia holds 30% of demand on contract research capacity and pharmaceutical manufacturing volume. Contract research capacity concentrates consumption well beyond regional pharmaceutical activity. Certified and low-adsorption grades remain largely imported there. The result reads low for months.
Five suppliers hold 47%. The barrier is not moulding or glass forming but dimensional consistency against autosampler tolerances: a vial a fraction out of specification jams a robotic arm, and a laboratory that has lost a batch overnight to a crashed autosampler does not experiment with alternatives afterwards. Dimensional consistency rather than glass forming skill is what a laboratory pays for, and remarkably few suppliers publish that data anywhere at all. A genuine commercial opening.
Market Definition
The market covers vials of nominal capacity up to 2 millilitres used for analytical sample handling and storage, spanning standard chromatography vials, low-adsorption and surface-treated vials, limited-volume inserts and micro-inserts, screw and crimp closure systems with septa, cryogenic and biobanking micro vials, and certified pre-cleaned vials. Larger laboratory bottles, microplates, pipette tips and autosampler instrumentation are excluded.
Base Year Value
$1.2B in 2025 (MMA Primary Research Dataset, August 2026)
Forecast Period
2026 to 2036, eleven discrete annual values
CAGR
8.4% base case. Bull 9.6%. Bear 7.2%.
Fastest Growth Segment
Low-Adsorption and Surface-Treated Vials: 12.6% CAGR
Fastest Growth Country
India: 11.6% CAGR
Fastest Growth Region
South Asia and Pacific: 10.6% CAGR
Largest Region
East Asia: 30% of 2025 global value
Market Leaders
Thermo Fisher Scientific, Agilent Technologies, Waters Corporation, DWK Life Sciences, Merck KGaA. Source: MMA Analysis based on company annual reports.
Primary Survey
n=3,800 procurement and R&D decision-makers, Q4 2025, six countries
Methodology
Demand-side build-up, cross-validated against public data, 47 expert interviews

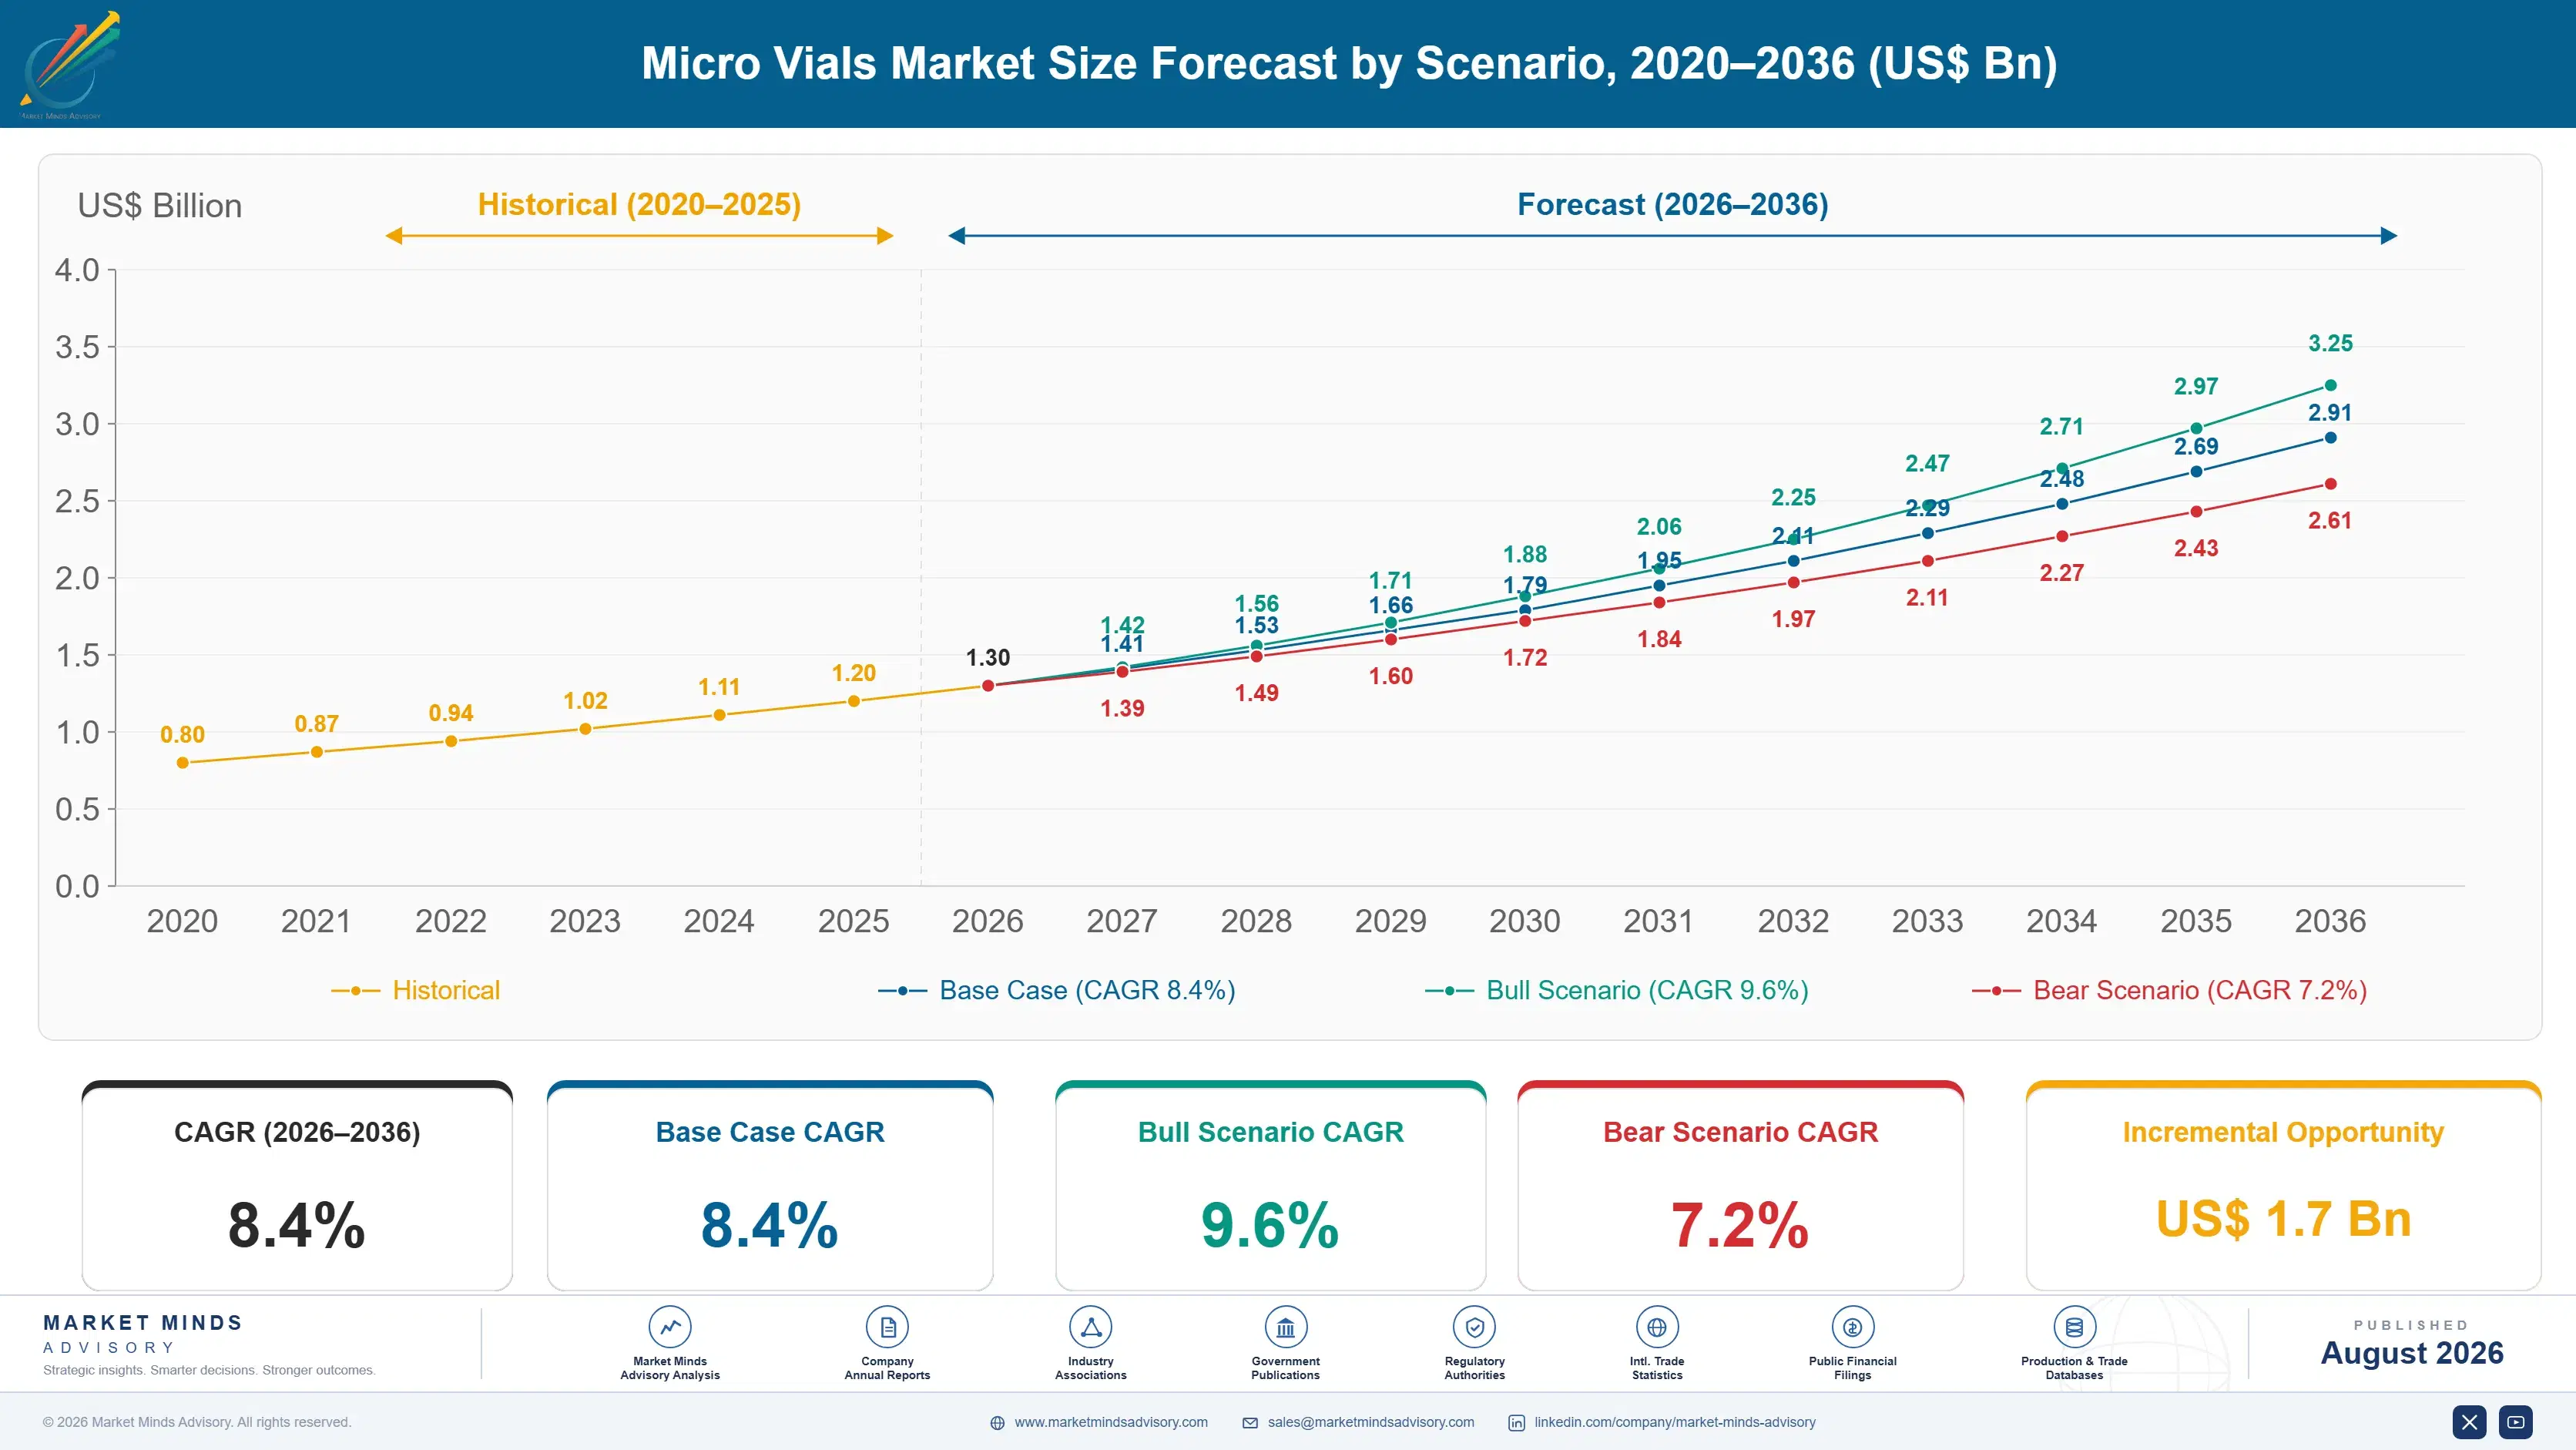
Micro Vials Market Forecast Scenarios

micro-vials-market-size-forecast-scenario-1787308582546
Growth ran at an implied 7.0% across 2020 to 2025 and it followed analytical instrument utilisation rather than laboratory headcount. Routine testing paused through 2020 while pandemic-related analysis surged, then biologics development and environmental monitoring both expanded strongly from 2022, and each new instrument installed consumed vials at a rate its predecessor never had. Instrument utilisation drove all of it.
The base case at 8.4% rests on three mechanisms. Biologics and peptide bioanalysis keeps pushing detection limits into concentrations where adsorption onto the container wall becomes the dominant source of error. Environmental testing for per- and polyfluoroalkyl substances demands certified low-background vials at volumes that barely existed five years ago. And laboratory automation raises the dimensional consistency required of every vial handled. None of the three depends on laboratory headcount growth.
The bull case at 9.6% assumes per- and polyfluoroalkyl substance monitoring requirements extend across further jurisdictions and matrices, since that work demands certified vials and generates very high sample counts. The bear case at 7.2% follows from pharmaceutical research spending restraint alongside instrument makers pushing lower injection volumes that reduce vial consumption per sample analysed.

When the Container Becomes Part of the Measurement

A two millilitre vial holding fifty microlitres of sample presents an unfavourable ratio. Surface area stays roughly constant while sample volume collapses, so any compound with affinity for glass or polymer has proportionally far more wall to bind to. At trace concentrations losses reach 38% of the analyte, and the chromatogram gives no indication whatsoever that anything went missing before injection.
TOP FIVE CONCENTRATION47%Combined share held by the five largest global suppliers
ADSORPTION LOSS RANGE38% of analyteCompound lost to container walls at low working concentrations
DIMENSIONAL TOLERANCE0.15 millimetresHeight variation an autosampler will accept before handling failure
AUTOSAMPLER CRASH COSTUSD 18,000 per eventTypical loss when a jammed instrument aborts an overnight sequence
CERTIFIED VIAL PREMIUM4.2 times standardPrice of documented low-background vials against uncertified equivalents
METHOD REQUALIFICATION TIME7 weeksPeriod to revalidate an analytical method after any consumable change
That problem was tolerable while detection limits sat comfortably above it. Biologics bioanalysis, peptide quantitation and per- and polyfluoroalkyl substance monitoring have all pushed working concentrations down far enough that the container has become a measurable part of the method. Deactivated glass, treated polymer surfaces and certified low-background vials exist entirely to address that, at roughly 4.2 times standard vial pricing. Detection limits finally fell below it.
The second constraint is mechanical rather than chemical. Autosamplers grip, lift and puncture vials on robotic arms with tolerance near 0.15 millimetres on height, and a vial outside that specification jams the instrument. An aborted overnight sequence costs around USD 18,000 in lost instrument time and repeated sample preparation, which is why laboratories do not experiment with unfamiliar suppliers.
"The thing that unsettles analysts most is not that a vial can lose analyte. It is that it does so silently. A blocked column announces itself immediately; a compound stuck to the wall just produces a slightly low result that nobody questions for months."
Director, Analytical Laboratory Consumables and Sample Handling Practice · MMA L

Market Trends

Detection Limits Fall Below the Container's Contribution

Biologics bioanalysis, peptide quantitation and trace contaminant work have pushed working concentrations low enough that adsorption onto the vial wall now exceeds instrument variability as a source of error. Losses reach 38% of analyte for hydrophobic and basic compounds at trace levels, and nothing in the data reveals it. Deactivated glass and treated polymer surfaces address the problem directly, and the segment compounds at 12.6% against a market at 8.4% as methods that previously ignored the container are forced to specify it. The container joined the method. Specification became unavoidable.
Market Impact: Crashes costing USD 18,000 each

Fluorinated Compound Monitoring Demands Certified Low-Background Vials

Per- and polyfluoroalkyl substance monitoring requirements have expanded rapidly across drinking water, soil, food and consumer product matrices in multiple jurisdictions. The analytical difficulty is that fluoropolymer components in ordinary laboratory consumables can themselves contribute background, so vials, caps and septa must be certified free of the compounds being measured. Certified vials price at roughly 4.2 times standard equivalents and sample counts in these programmes are very high, which makes this the single most commercially significant analytical development in the category. Documentation rather than glass is the deliverable. Sample counts are very high.
Market Impact: Biologics at 34% of low-adsorption

Market Opportunities and Growth Drivers

Laboratory Automation Raises Dimensional Consistency Requirements

Autosamplers grip, lift, position and puncture vials under robotic control with height tolerance near 0.15 millimetres, and higher-throughput systems handle racks of ninety-six or more without operator supervision overnight. A vial outside specification jams the arm and aborts the sequence, costing around USD 18,000 in instrument time and repeated preparation. That risk means laboratories buy dimensional consistency rather than vials, and it explains why suppliers with proven autosampler compatibility hold positions almost impossible to contest on price alone. Price arguments rarely reopen those positions. Laboratories buy consistency rather than vials, which is an unusual thing to sell.
Market Impact: Requalification taking 7 weeks

Biologics Development Multiplies Sample Counts Per Programme

A biologic development programme generates far more analytical samples than a small molecule equivalent, covering stability, comparability, immunogenicity and pharmacokinetic work across multiple matrices and time points. Those samples are frequently precious, available only in microlitre volumes, and composed of peptides and proteins that adsorb readily. Roughly 34% of low-adsorption vial demand now comes from biologics bioanalysis, and the sample counts involved grow with pipeline breadth rather than with laboratory headcount or instrument installation. Sample volumes are frequently precious and available only in microlitres, which makes adsorption loss unrecoverable rather than merely inconvenient.
Market Impact: Injection volumes down 44% since 20

Market Restraints and Challenges

Method Requalification Deters Any Consumable Change

A validated analytical method names the container, and changing it requires demonstrating equivalent recovery, carryover and stability, which takes around seven weeks per method. The root cause is regulatory rather than technical: in pharmaceutical and environmental work the method is a controlled document and the vial is part of it. Laboratories running dozens of methods will not undertake that work to save on consumables. Suppliers mitigate by targeting new method development rather than attempting to displace vials from validated procedures. New methods are the accessible opening. Displacement from validated methods is effectively impossible.
Market Impact: Adsorption removing 38% of analyte

Lower Injection Volumes Reduce Vials Consumed Per Sample

Instrument makers keep reducing the injection volume required for a determination, and improved sensitivity means a single vial can serve more injections or a smaller vial can replace a larger one. The root cause is that detector sensitivity has improved faster than sample availability constrains it. That reduces unit consumption even as sample counts rise. Suppliers mitigate by moving toward inserts, micro-inserts and treated surfaces where value per unit rather than unit count carries the revenue. Unit count falls while value per unit rises. Value per unit rather than unit count carries the revenue.
Market Impact: Certified vials priced 4.2 times st
4 additional market trends, 3 additional growth drivers, and 2 additional restraints and challenges are covered in the full report. Contact sales@marketmindsadvisory.com to access the complete intelligence.

Segment CAGR and Growth Architecture

Segmentation follows vial type and surface specification, because each carries a different analytical purpose, a different qualification burden and a different buyer. A certified low-background vial and a standard chromatography vial look identical and answer entirely separate questions about what the laboratory is measuring. Surface specification decides which question the vial answers. Appearance reveals nothing.
micro-vials-market-market-share-analysis-1787308583075

Low-Adsorption and Surface-Treated Vials

Low-adsorption vials compound at 12.6%, exactly 1.50 times the market rate, because analytical methods finally caught up with a problem that had always existed. At trace concentrations a peptide, a basic drug or a hydrophobic metabolite binds to glass silanol groups or to polymer surfaces, and losses reach 38% with nothing in the chromatogram indicating it. Deactivated and silanised glass, treated polypropylene and specialty polymer surfaces all address it by different routes and at different cost points. Biologics bioanalysis drives roughly 34% of the demand. The commercial difficulty is that a laboratory only discovers it needs these vials after investigating a recovery problem, which makes the sale reactive rather than specified.
CAGR 12.6%

Certified Pre-Cleaned and Low-Background Vials

Certified vials grow at 10.8% on trace contaminant monitoring, where the container must be demonstrated free of the compounds being measured. Per- and polyfluoroalkyl substance work has driven most of that, since fluoropolymer septa and cap liners in ordinary consumables can contribute background indistinguishable from the sample. Certification requires lot-level analytical testing with documentation the laboratory files alongside its own results, and that documentation is what the customer is actually buying. Pricing runs roughly 4.2 times standard vials. Sample counts in monitoring programmes are extremely high, and the requirement is written into method specifications rather than left to laboratory preference, which makes demand unusually predictable. Laboratory preference plays no part.
CAGR 10.8%
Full segment breakdown across 6 segments available in the complete report.

Regional Architecture and Country Demand Map

Demand follows analytical instrument installed base rather than population or healthcare spending, since vials are consumed where samples are run. Contract research capacity in particular concentrates consumption well beyond what a region's own pharmaceutical activity would generate. Instrument installed base rather than research spending is the map worth reading.

East Asia

East Asia holds 30% of global demand, the largest regional share, and contract research capacity explains most of it rather than domestic drug development. Chinese contract research and manufacturing organisations run analytical work for sponsors worldwide, which concentrates sample volume far beyond what Chinese pharmaceutical activity alone would generate. Domestic consumable suppliers serve much of the standard vial requirement at prices international companies cannot approach, while certified and low-adsorption grades remain largely imported. Japanese demand is smaller, technically exacting and weighted toward environmental and food safety testing where certification requirements are strict. Korean demand follows biosimilar development and electronics materials analysis. Regional growth of 9.4% tracks instrument installation closely. Certified grades remain largely imported.
Share: 30% | CAGR: 9.4% (2026 to 2036)

South Asia and Pacific

The fastest growing region at 10.6%, with India compounding at 11.6%, South Asia and Pacific accounts for 12% of demand. Indian contract research organisations and generic pharmaceutical manufacturers run enormous analytical volumes, much of it for regulated export markets where method validation follows United States and European requirements. That regulatory exposure pulls certified and low-adsorption grades into Indian laboratories faster than domestic testing alone would. Environmental monitoring is expanding from a low base as water quality regulation tightens. Australian demand is smaller and weighted toward environmental and food testing. Price sensitivity is acute on standard vials while certified grades sell on documentation rather than cost. Regulatory exposure pulls higher grades in faster.
Share: 12% | CAGR: 10.6% (2026 to 2036)
Regional intelligence for 5 additional markets available in the complete report: North America, Western Europe, Latin America, Middle East and Africa, Eastern Europe. Contact sales@marketmindsadvisory.com.
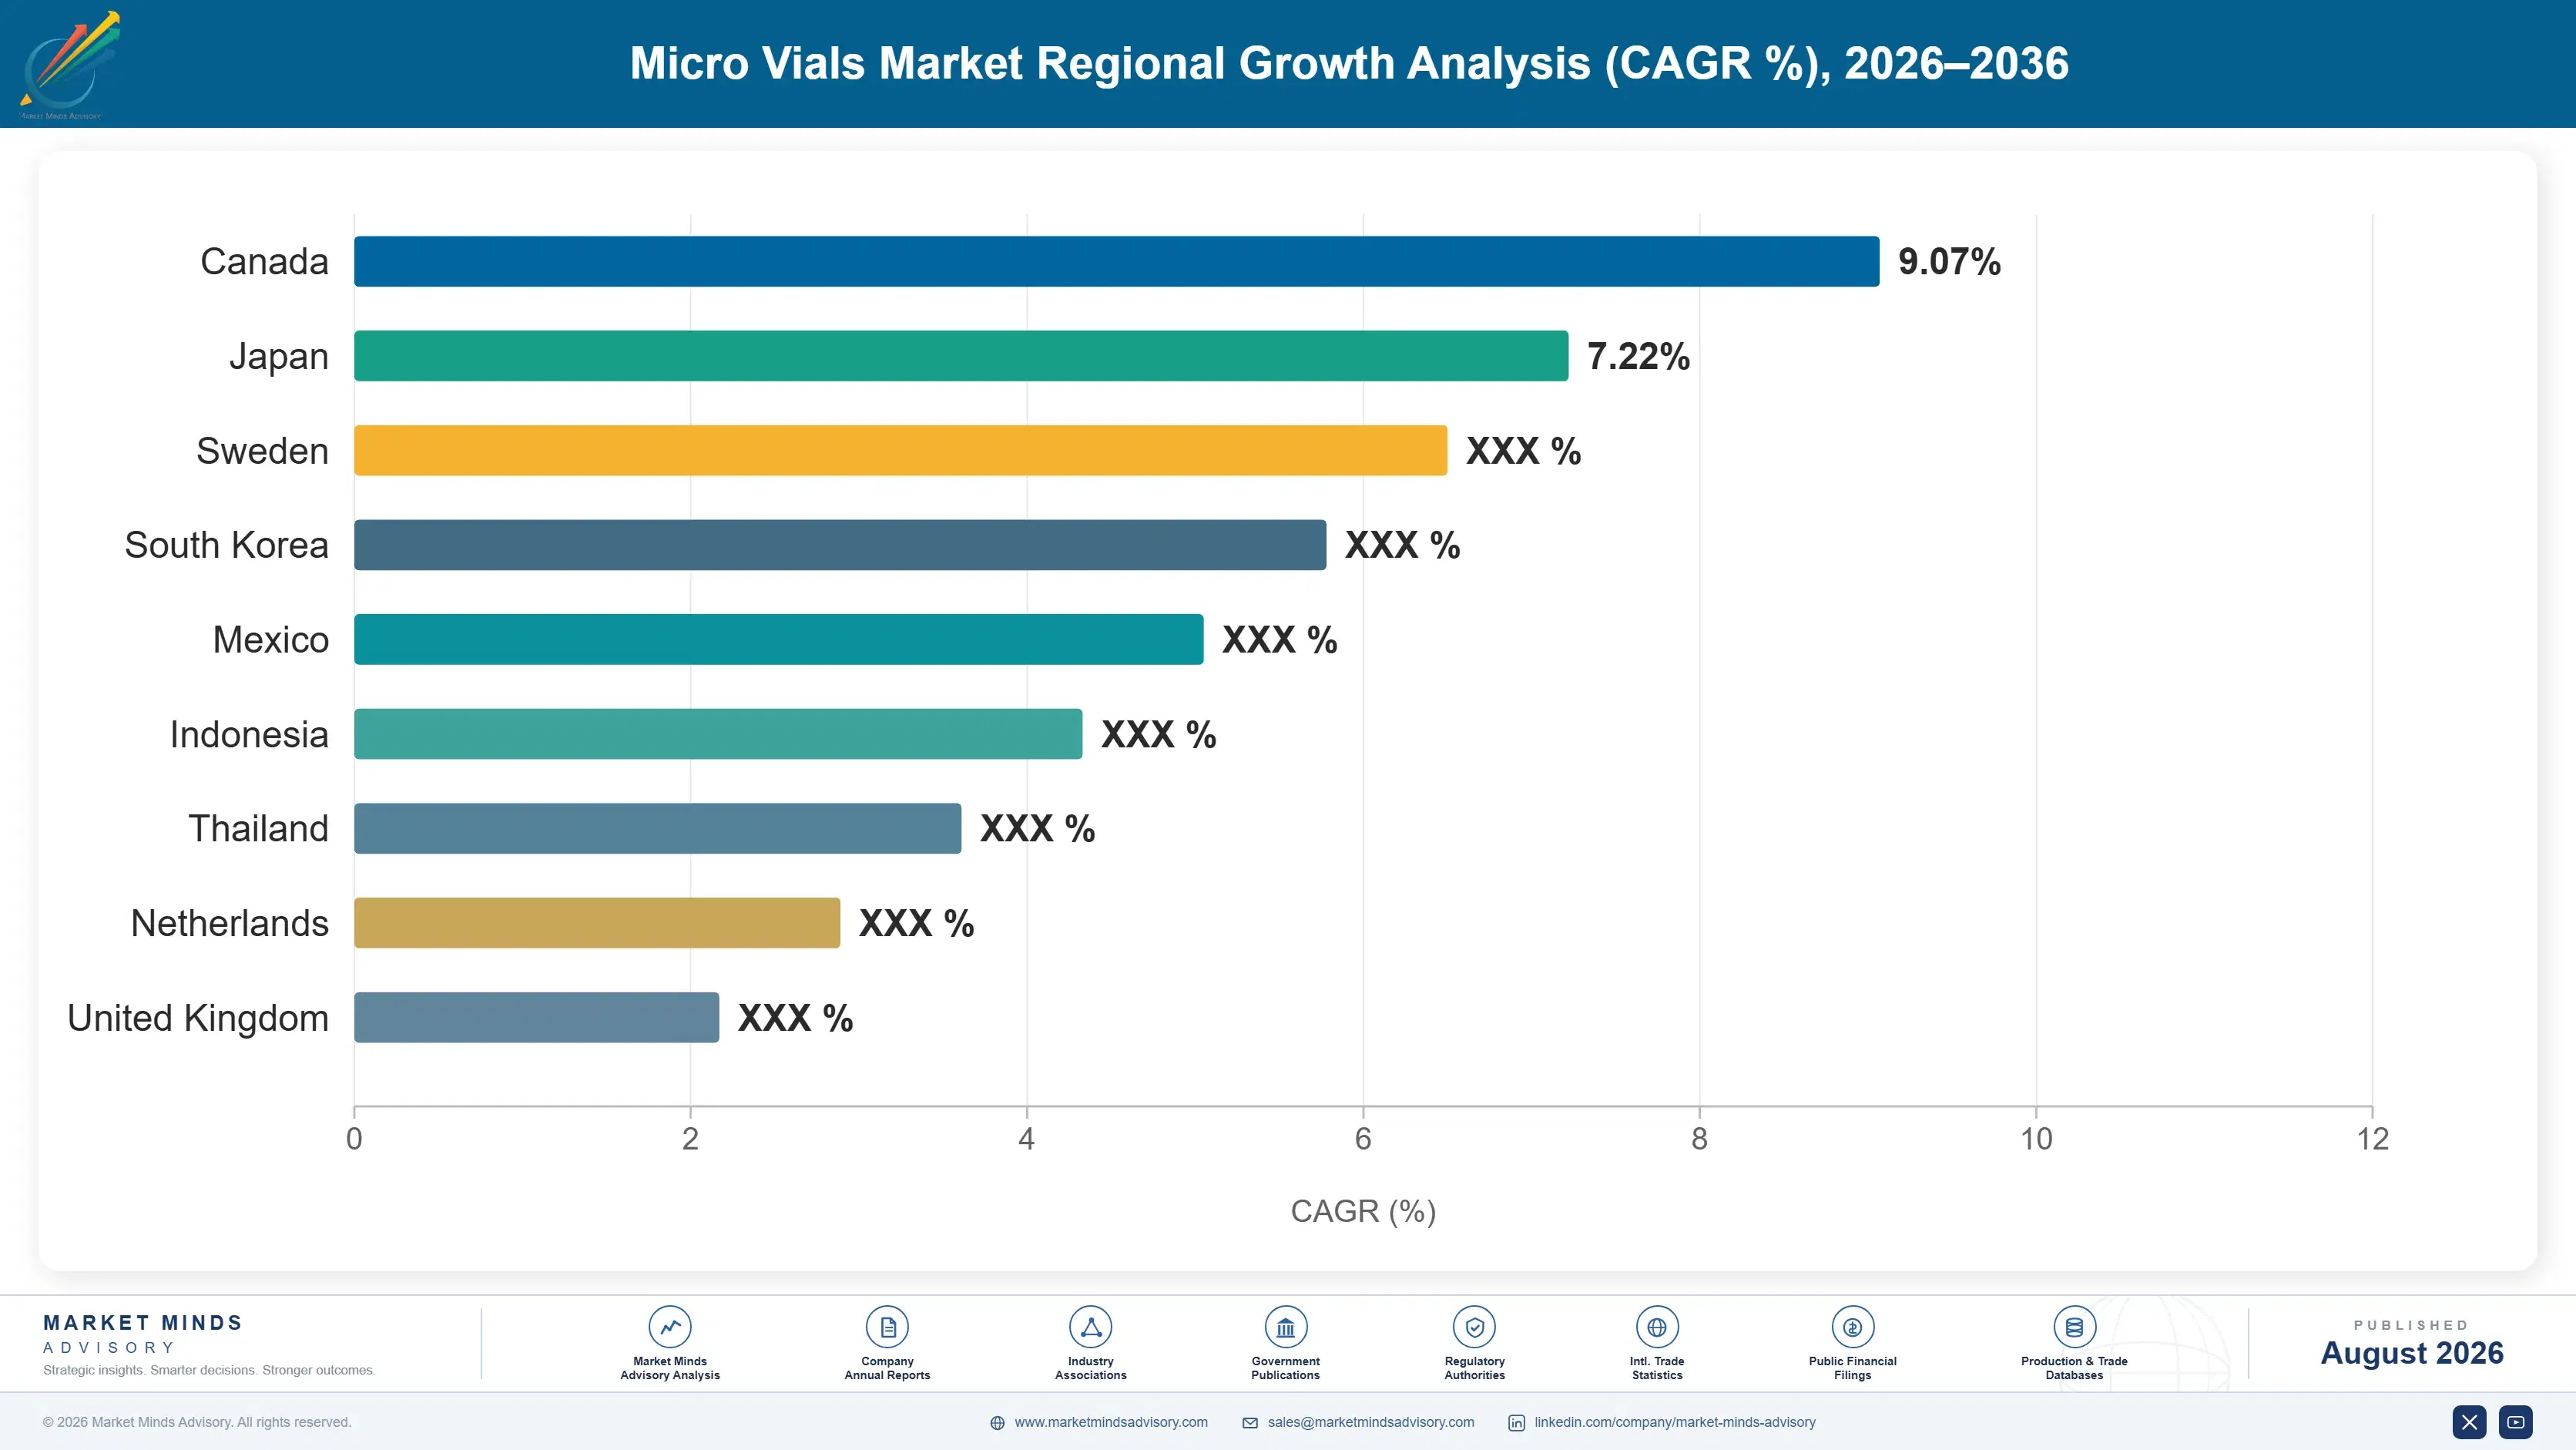
micro-vials-market-country-cagr-analysis-1787308583602

Selling a Container That Changes the Answer

Nobody in a laboratory wants to think about vials, and most do not until something goes wrong. Every commercially useful position here rests on a failure the customer has experienced or a requirement written into a method they cannot vary. Four qualify, and none is won on price per thousand. Price per thousand reaches nobody who matters.

Reach Methods During Development Rather Than After Validation

A validated method names the container, and changing it requires demonstrating equivalent recovery, carryover and stability across roughly seven weeks per method. Laboratories running dozens of methods will never do that to save on consumables. Suppliers targeting method development, where the vial is still being chosen, secure positions that then persist for the method's entire regulated life. Reaching that stage means engaging with analytical development scientists rather than purchasing functions, which is a different commercial motion and a considerably more durable one. Roughly 7 weeks of equivalence work stands between a competitor and any validated method.
Market Impact: Requalification blocking every chan

Sell Adsorption Recovery Data Rather Than Vial Specifications

Losses reach 38% of analyte for hydrophobic and basic compounds at trace concentrations, and nothing in the chromatogram reveals it. Laboratories discover the problem only when investigating a recovery discrepancy, often months later. Suppliers that provide compound-class recovery data, and will run a comparison on the customer's own analyte, convert methods that had never considered the container. Low-adsorption grades compound at 12.6% and carry gross margins roughly 17 to 25 points above standard vials, and the conversion holds for the method's life. The conversion holds for the method's life. Recovery data does the selling.
Market Impact: Low-adsorption carrying 17 to 25 gr

Build Lot-Level Certification for Trace Monitoring Programmes

Per- and polyfluoroalkyl substance monitoring requires vials, caps and septa demonstrated free of the compounds being measured, since fluoropolymer components in ordinary consumables contribute indistinguishable background. Certification requires lot-level analytical testing and documentation the laboratory files with its own results, and that paperwork is what the customer buys. Pricing runs roughly 4.2 times standard vials. Monitoring programmes generate very high sample counts and the requirement sits in method specifications rather than laboratory preference, which makes the demand unusually predictable. Testing capacity constrains release. Sample counts are very high and the requirement sits in the method itself.
Market Impact: Certified vials priced 4.2 times hi

Guarantee Autosampler Dimensional Compatibility Explicitly to Buyers

Autosamplers handle vials under robotic control with height tolerance near 0.15 millimetres, and a vial outside specification jams the arm and aborts an overnight sequence at roughly USD 18,000 in lost instrument time and repeated preparation. Laboratories that have experienced that do not experiment afterwards. Suppliers publishing dimensional tolerance data by instrument model, and guaranteeing compatibility contractually, remove the risk that keeps buyers with incumbents. It costs measurement and documentation rather than manufacturing investment, and very few suppliers do it. The risk is what keeps buyers loyal. Documentation costs almost nothing to produce.
Market Impact: Tolerance held within just 0.15 mil

Who Controls the Margin Pool

Five suppliers hold 47% of the market measured on vial and closure revenue, the basis applied consistently through this section. Concentration reflects instrument manufacturer relationships and method validation lock-in rather than manufacturing capability, since glass forming and polymer moulding are widely available. Thermo Fisher Scientific and Agilent Technologies lead, both selling alongside their own instruments. Glass forming and moulding separate nobody.
Competition operates on three dimensions. Instrument manufacturer affiliation decides who reaches the laboratory when an autosampler is installed and specified. Surface treatment and certification capability decides participation in the segments actually growing. And dimensional consistency decides whether a laboratory that has once lost an overnight sequence will consider a supplier at all. All three sit outside manufacturing capability entirely. None of the three can be bought quickly.

Two pressures will move rankings. Chinese and Indian suppliers compete credibly on standard chromatography vials, particularly in their home contract research markets where volume is enormous and specifications are less prescriptive. Against that, certified and low-adsorption grades reward analytical capability rather than moulding cost. Rankings will shift toward whoever pairs certification testing with development-stage method access. Very few hold both today.
micro-vials-market-company-positioning-matrix-1787308584122

Competitive Moat and Risk Dimensions

THERMO FISHER SCIENTIFIC

Moat: Instrument and consumable integration

Thermo Fisher supplies chromatography instruments and the consumables that run on them, which places its vials in front of a laboratory at the moment an autosampler is installed and a method is being developed. Dimensional compatibility with its own instruments is guaranteed by construction rather than by testing, and that removes precisely the risk that keeps laboratories with familiar suppliers.
THERMO FISHER SCIENTIFIC

Risk: Standard vial price exposure

Ordinary chromatography vials represent substantial volume and face Chinese and Indian suppliers at materially lower prices, particularly in contract research markets running very high sample counts on less prescriptive specifications. Instrument affiliation carries little weight where a laboratory buys on cost per thousand, and the price gap is visible in every routine testing tender.
AGILENT TECHNOLOGIES

Moat: Method development scientific access

Agilent's applications chemistry organisation works alongside laboratories during method development, which is precisely the point at which the container is chosen and before validation locks it in place. That access converts into vial specifications written into controlled methods, and the seven week requalification barrier then protects the position for the method's entire regulated lifetime.
AGILENT TECHNOLOGIES

Risk: Certification testing capability

Trace contaminant monitoring demands lot-level analytical certification that the vial is free of the compounds being measured, and that is a testing and documentation capability rather than a manufacturing one. Suppliers with dedicated certification laboratories can serve per- and polyfluoroalkyl substance programmes at scale, which is where the highest-priced growth in the category currently sits.

Players Tracked

Prominent Players

Thermo Fisher Scientific
Agilent Technologies
Waters Corporation
DWK Life Sciences
Merck KGaA

Other Key Players

Restek Corporation
Shimadzu Corporation
PerkinElmer
Chromatography Research Supplies
Macherey-Nagel
Sarstedt
Eppendorf
Corning
VWR International
Wheaton Industries
JG Finneran Associates
Micro-Tec
Shandong Pharmaceutical Glass
Zhejiang Aijiren Technology
Bio-Rad Laboratories

Recent Developments

FEBRUARY 2025

Fluorinated compound monitoring expands certified consumable requirements

Per- and polyfluoroalkyl substance monitoring requirements extended across further water, soil and consumer product matrices in multiple jurisdictions, requiring vials and closures certified free of the compounds under measurement. These were regulatory implementations rather than commercial developments between suppliers. Lot-level testing capacity became the constraint on supply.
Signal: The consumable itself became a source of c
JUNE 2025

Biologics bioanalysis drives low-adsorption vial specification

Bioanalytical laboratories supporting biologics development increasingly specified deactivated and surface-treated vials after recovery investigations attributed losses to container adsorption rather than to extraction or instrument performance. This reflects method development practice rather than any corporate transaction. Extraction technique had been blamed for months beforehand. Container adsorption was the cause.
Signal: Laboratories are discovering a problem tha
OCTOBER 2025

Higher-throughput autosamplers tighten dimensional requirements

Instrument manufacturers introduced higher-capacity autosampler configurations handling larger unattended sample sequences, raising the consequence of any dimensional inconsistency in vials or closures. These were product introductions rather than acquisitions, and they increase the cost of a single handling failure. Dimensional consistency requirements tightened accordingly. Unattended sequences run longer now.
Signal: Larger unattended sequences mean one out-o

Glass, Polymer and Certification Testing

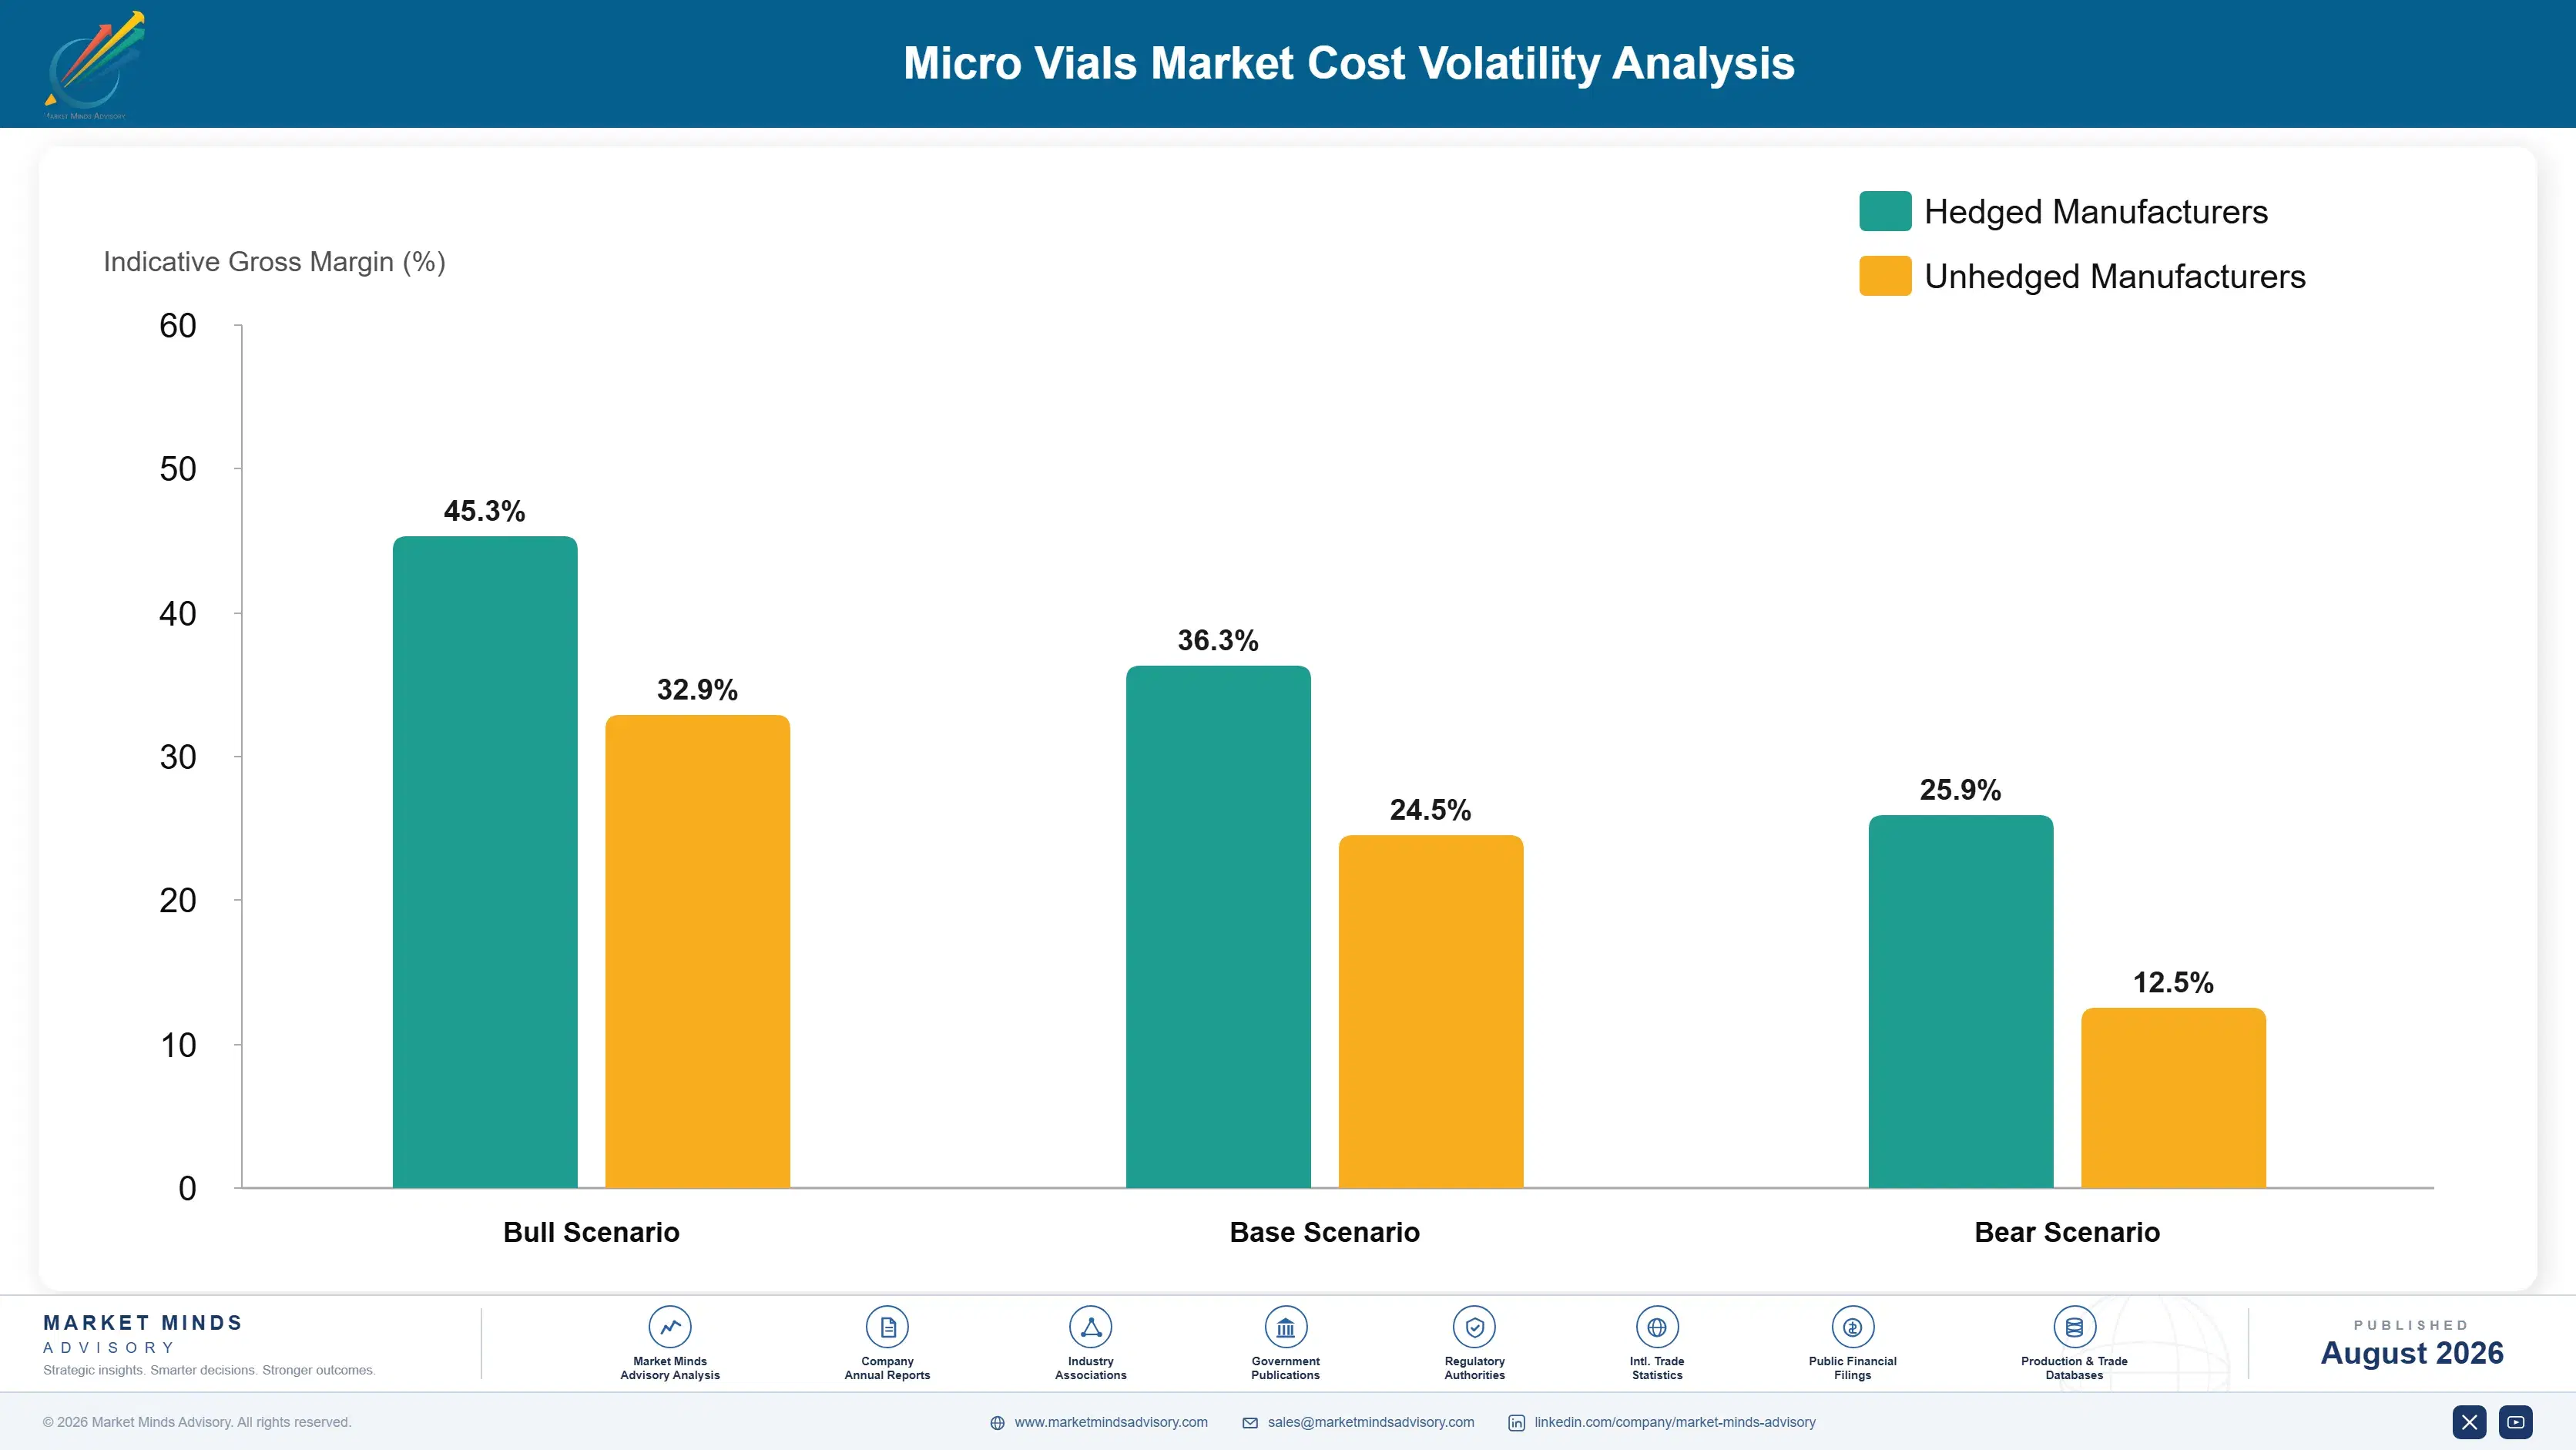
Borosilicate glass tubing and polymer resin account for roughly 31% of cost of goods, purchased from specialty glass drawers and polymer producers to tight dimensional and purity specifications. Closures, septa and liners run a further 22%, with fluoropolymer-free septa carrying disproportionate cost. Certification testing, cleanroom handling and lot documentation make up most of the balance on the higher grades.
Borosilicate tubing pricing moved sharply through 2022 and 2023 as European glass melting energy costs rose, and International Energy Agency reporting across that period documents the underlying movement. Vial makers absorbed much of it, because a vial named in a validated method cannot be substituted with a different glass source without triggering the seven week requalification customers refuse. Company annual reports covering laboratory consumables segments disclose the resulting margin pressure.

Exposure divides by grade mix rather than by scale. Suppliers weighted toward standard chromatography vials compete against Chinese and Indian producers on delivered price and cannot pass increases through. Those weighted toward certified and low-adsorption grades price against documentation and recovery performance, where a laboratory facing method requalification will absorb a cost movement rather than switch supplier over it.
micro-vials-market-cost-volatility-analysis-1787308584317

Qualify a second borosilicate tubing source per specification

A vial named in a validated method cannot change glass source without requalification, so alternative tubing must be qualified during product development rather than in response to a supply or price event. Carrying two qualified sources per specification costs one additional characterisation exercise and removes an exposure that becomes permanent once customers validate methods around the product.

Build certification testing capacity ahead of programme demand

Lot-level certification for trace monitoring is a laboratory capability rather than a manufacturing one, and it constrains how much certified product a supplier can release regardless of moulding or forming capacity. Building that testing capacity ahead of monitoring programme expansion converts directly into share, since certified demand arrives on regulatory timetables rather than gradually.

Weight the portfolio toward method-specified grades

Standard vials compete on delivered price against producers with lower cost bases, while certified and low-adsorption grades are named in controlled methods that customers will not requalify. The same mix shift already justified on growth grounds also removes most input cost exposure, because those customers absorb movements rather than tendering the business away. Tendering pressure largely disappears.

Portfolio Architecture for Margin Defence

The portfolio separates on whether the vial affects the result. Standard chromatography vials are containers, and Chinese and Indian producers compete hard for that volume on delivered price. Low-adsorption grades change measured recovery. Certified vials change measured background. Inserts and micro-inserts change what volume can be analysed at all, and each of those three is chosen by a scientist rather than a purchasing function. Whether the vial affects the answer draws the ladder.
The tension is that standard vials carry the volume, the distributor listings and the account presence from which specialised work follows. A supplier that withdraws from routine chromatography loses visibility at exactly the laboratories where a recovery investigation will eventually create a low-adsorption opportunity. Most successful participants run standard grades as access and treat surface treatment and certification as the margin layer. Access and margin are separate objectives here.

High-value pools concentrate where a method specification or a regulatory programme sets the requirement. Certified low-background vials, deactivated surfaces for biologics and validated closure systems all qualify, and none of them is purchased on cost per thousand units. A scientist rather than a buyer chooses each of them.

Volume / Commodity-Adjacent Tier

Standard chromatography vials, caps and general-purpose septa for routine analytical work. Chinese and Indian producers compete effectively on delivered price, particularly in contract research markets running high sample counts on less prescriptive specifications.
Gross Margin: 29-40%

Premium / Certified Tier

Low-adsorption and surface-treated vials, limited-volume inserts and validated closure systems where recovery performance and dimensional consistency are demonstrated rather than claimed. Autosampler compatibility guarantees matter more than material cost here.
Gross Margin: 46-58%

Sustainability / Regulatory / Next-Generation Tier

Certified pre-cleaned and low-background vials for trace contaminant monitoring, plus cryogenic and biobanking micro vials. The wide margin range reflects the gap between established certification programmes and newer matrices where testing protocols are still being defined.
Gross Margin: 52-74%
micro-vials-market-portfolio-architecture-1787308584816

High-value Sub-segments and Strategic Watch-out

Low-Adsorption Surface-Treated Vials

Compounding at 12.6% as detection limits fall below the container's own contribution, with losses reaching 38% of analyte at trace concentrations. The sale is reactive rather than specified, since laboratories discover the need only when investigating a recovery discrepancy. Recovery data converts the method. Discovery is accidental.
Gross Margin: 50-58%

Certified Low-Background Vials

Growing at 10.8% on trace contaminant monitoring where consumables themselves contribute background. Lot-level certification documentation is the actual product, pricing runs 4.2 times standard vials, and demand arrives on regulatory rather than commercial timetables. Certification testing capacity rather than forming capacity constrains how much a supplier can release.
Gross Margin: 56-74%

Standard Chromatography Vials

The volume core at 6.2%, contested on delivered price by Chinese and Indian producers. Run for distributor listings and laboratory visibility rather than margin, since a supplier absent from routine work never hears about the recovery investigation. Visibility is the whole point. Distributor listings matter here.
Gross Margin: 29-40%

Limited-Volume Inserts and Micro-Inserts

The watch-out and the opportunity together. Falling injection volumes reduce vials consumed per sample, but inserts capture value where sample is precious and unit price rather than unit count carries the revenue for a supplier. Precious samples make inserts genuinely necessary rather than merely convenient.
Gross Margin: 44-60%

Written Into the Method

This is among the most locked consumable positions in laboratory supply. A vial named in a validated analytical method is reordered for the life of that method, because changing it requires demonstrating equivalent recovery, carryover and stability across roughly seven weeks of work. In regulated pharmaceutical and environmental testing the method is a controlled document, so a supplier change is a documented regulatory event rather than a purchasing decision anybody makes lightly.
Depth varies by regulatory exposure. Bioanalytical laboratories supporting regulated submissions buy deepest, specifying surface treatment explicitly and involving suppliers during method development. Environmental monitoring laboratories buy certified grades to programme specification. Academic and research laboratories buy on catalogue price with complete freedom. Quality control laboratories running compendial methods sit between, constrained by the method but not by validation of their own.

The deciding population sits with science rather than purchasing. Vial selection during method development is made by analytical chemists weighing recovery and reproducibility. Once validated, purchasing reorders what the method names and has no authority to vary it, which is why suppliers who reach development-stage scientists hold positions procurement can never dislodge.
micro-vials-market-end-use-penetration-index-1787308585302

Where Vial Suppliers Actually Win

These are among the four positions where our research anticipates prominent divergence between winners and laggards over the coming forecast period. Each is grounded in the demand model, the regulatory perimeter, and the announced capacity pipeline.
01 / DEVELOPMENT STAGE ACCESS

The vial is chosen before validation and never afterwards

A validated analytical method names the container it was developed with, and changing it demands demonstrated equivalence in recovery, carryover and stability across roughly seven weeks of work for every single method affected. Laboratories running dozens of validated methods will never undertake that exercise simply to save money on their consumable spending. Suppliers reaching analytical development scientists while a method is still being written secure positions that persist for its entire regulated lifetime, and those positions are effectively unassailable once validation formally closes.
02 / SILENT LOSS EVIDENCE

Adsorption removes analyte without appearing anywhere in the data

At trace concentrations a peptide, a basic drug or a hydrophobic metabolite binds readily to glass silanol groups or to polymer surfaces, and losses reach 38% of analyte with nothing in the chromatogram indicating that anything went missing at all. Laboratories find it only when investigating a recovery discrepancy months afterwards. Suppliers offering compound-class recovery data, and willing to run a comparison on the customer's own analyte, convert methods that never considered the container, and the conversion then holds for that method's working life.
03 / CERTIFICATION AS PRODUCT

The documentation is what the laboratory is actually buying

Trace contaminant monitoring requires vials, caps and septa demonstrated free of the compounds being measured, because fluoropolymer components in ordinary laboratory consumables contribute background indistinguishable from the sample itself. Lot-level certification testing, and the documentation a laboratory files alongside its own results, is the actual deliverable here rather than the glass. Pricing runs roughly 4.2 times standard vials, and demand arrives on regulatory timetables rather than gradually, across programmes generating extremely high sample counts across every single affected matrix and jurisdiction.
04 / HANDLING RISK REMOVAL

One jammed vial costs more than a year of consumable savings

Autosamplers grip, lift and puncture vials under robotic control at height tolerance near 0.15 millimetres, and a single out-of-specification vial jams the arm and aborts an entire overnight sequence at roughly USD 18,000 in lost instrument time and repeated sample preparation. Laboratories that have experienced that outcome never experiment again with an unfamiliar supplier. Publishing tolerance data by instrument model and guaranteeing compatibility contractually removes that risk completely, at a cost far below that of a single aborted overnight sequence.

Engagement Snapshot From the Field

A live engagement with an industry participant carrying material or product regulatory and market exposure ahead of a defining policy shift, showing how our research translates into a defensible multi-year portfolio strategy.
MARKET MINDS ADVISORY · CLIENT ENGAGEMENT SUMMARY
Micro Vials Producer Strategic Portfolio Review and Transition Roadmap 2026·Investment Scenario on Micro Vials Exposure Evaluation 2025-26
CLIENT PROFILE
A contract research organisation operating bioanalytical laboratories across four countries, running roughly 780,000 analytical samples annually (client-reported, unverified by MMA) for pharmaceutical sponsors. Consumable spend on vials, closures and inserts ran near USD 4.6 million (client-reported, unverified by MMA), purchased through a consolidated agreement awarded on catalogue pricing across all sites. No site held recovery data for its own analytes.
STRATEGIC CHALLENGE
Recovery variability on peptide and biologic assays had prompted several sponsor queries, and the bioanalytical group attributed it to extraction technique. Procurement had recently consolidated consumable supply and reported a saving. Nobody had examined whether the standard vials awarded under the new agreement differed from the surface-treated vials several sites had previously specified.
MMA APPROACH
MMA compared recovery on a panel of representative peptide and hydrophobic analytes across the vials in use before and after consolidation, at concentrations matching the assays generating sponsor queries. Method documentation was reviewed to establish which validated methods actually named a surface specification and which did not. Repeat analysis costs were reconstructed alongside.
KEY FINDINGS
  1. Recovery on the peptide panel fell measurably in the standard vials awarded under consolidation, with losses reaching well over a third of analyte at the lowest concentrations tested in the comparison.
  2. Eleven validated methods named a deactivated surface explicitly and had continued to receive standard vials after consolidation, which was a documented deviation nobody had identified internally.
  3. The consumable saving achieved through consolidation was smaller than the cost of the repeat analyses already run in response to sponsor recovery queries over the preceding year.
  4. No site had recovery data for its own analytes on any vial surface, so the original surface specifications had been inherited from method transfer rather than established locally.
CLIENT PROFILE
A contract research organisation operating bioanalytical laboratories across four countries, running roughly 780,000 analytical samples annually (client-reported, unverified by MMA) for pharmaceutical sponsors. Consumable spend on vials, closures and inserts ran near USD 4.6 million (client-reported, unverified by MMA), purchased through a consolidated agreement awarded on catalogue pricing across all sites. No site held recovery data for its own analytes.
STRATEGIC CHALLENGE
Recovery variability on peptide and biologic assays had prompted several sponsor queries, and the bioanalytical group attributed it to extraction technique. Procurement had recently consolidated consumable supply and reported a saving. Nobody had examined whether the standard vials awarded under the new agreement differed from the surface-treated vials several sites had previously specified.
MMA APPROACH
MMA compared recovery on a panel of representative peptide and hydrophobic analytes across the vials in use before and after consolidation, at concentrations matching the assays generating sponsor queries. Method documentation was reviewed to establish which validated methods actually named a surface specification and which did not. Repeat analysis costs were reconstructed alongside.
KEY FINDINGS
  1. Recovery on the peptide panel fell measurably in the standard vials awarded under consolidation, with losses reaching well over a third of analyte at the lowest concentrations tested in the comparison.
  2. Eleven validated methods named a deactivated surface explicitly and had continued to receive standard vials after consolidation, which was a documented deviation nobody had identified internally.
  3. The consumable saving achieved through consolidation was smaller than the cost of the repeat analyses already run in response to sponsor recovery queries over the preceding year.
  4. No site had recovery data for its own analytes on any vial surface, so the original surface specifications had been inherited from method transfer rather than established locally.
RECOMMENDED STRATEGY
Phase 1: Phase 1 (months 1 to 4): Restore deactivated vials on the eleven methods naming a surface specification and document the deviation closure formally. Phase 2: Phase 2 (months 4 to 12): Generate recovery data by analyte class across candidate vial surfaces and write surface specifications into new method development. Phase 3: Phase 3 (months 12 to 22): Rebuild consumable purchasing so method-specified grades are separated from genuinely interchangeable routine laboratory items.
OUTCOME
Sponsor recovery queries ceased within two reporting cycles of the vial restoration (client-reported, unverified by MMA). Consumable spend rose by approximately USD 340,000 annually against repeat analysis costs the client valued near USD 1.9 million. Surface specifications were subsequently written into all new method validations (client-reported, unverified by MMA).

Frequently Asked Questions

Foundational context covering the market sizes, CAGR, scope, country, region and competition that inform every finding below. This section is provided to cover basics and most often pre-purchase conversations, answered from the MMA Primary Research Dataset.

What is the current size of the Micro Vials Market?

The global market was worth USD 1.24 billion in 2025, reaching USD 1.34 billion in 2026. East Asia holds the largest regional share at 30% of demand.

How large will the Micro Vials Market be by 2036?

MMA forecasts USD 3.0 billion by 2036, an expansion multiple of 2.24 times the 2026 base. That represents roughly USD 1.66 billion of incremental value.

What is the CAGR for the Micro Vials Market 2026 to 2036?

The base case compounds at 8.4% annually, with a bull case of 9.6% and a bear case of 7.2%. Historical growth from 2020 to 2025 ran at 7.0%.

Which segment is growing fastest?

Low-adsorption and surface-treated vials compound at 12.6%, exactly 1.50 times the market rate. Analyte losses to container walls reach 38% at the trace working concentrations these methods now use.

Who are the major companies in the Micro Vials Market?

Thermo Fisher Scientific, Agilent Technologies, Waters Corporation, DWK Life Sciences and Merck KGaA hold a combined 47% of the market. Instrument affiliation and method lock-in sustain that concentration.

Which country is growing fastest?

India compounds at 11.6%, ahead of every other national market. Contract research organisations and generic manufacturers there run enormous analytical volumes for regulated export markets.

Report Segmentation Architecture

The full report scope spans multiple orthogonal segmentation dimensions, with cross-tabulated demand data provided for each dimension pair. Coverage extends further to regional breakdowns, trend trajectories, and the competitive detail needed to support segment-level decision-making.

By Vial Type and Surface

  • Standard Chromatography Vials
  • Low-Adsorption and Surface-Treated Vials
  • Limited-Volume Inserts and Micro-Inserts
  • Screw and Crimp Closure Systems
  • Cryogenic and Biobanking Micro Vials
  • Certified Pre-Cleaned and Low-Background Vials

By End-Use Setting

  • Pharmaceutical Bioanalytical Laboratories
  • Contract Research Organisations
  • Environmental and Water Testing Laboratories
  • Food Safety and Agricultural Testing
  • Academic and Government Research

By Commercial Dimension

  • Instrument Manufacturer Affiliated Supply
  • Laboratory Distributor Channel
  • Direct Institutional Contract Supply
  • Method Development Specified Supply

By Region

  • North America
  • Western Europe
  • East Asia
  • South Asia and Pacific
  • Latin America
  • Middle East and Africa
  • Eastern Europe

Scope, Methodology, and Coverage

Every figure in this report is reproducible from documented input assumptions. The scope below maps the historical period, the forecast horizon, the segmentation dimensions, and the countries covered, alongside the underlying primary and qualitative methodology.
Historical Period
2020 to 2025
Forecast Period
2026 to 2036
Base Year
2025 (USD billions; MMA Primary Research Dataset, August 2026)
Market Definition
The market covers vials of nominal capacity up to 2 millilitres used for analytical sample handling, injection and storage, spanning standard chromatography vials, low-adsorption and surface-treated vials, limited-volume inserts and micro-inserts, screw and crimp closure systems including septa, cryogenic and biobanking micro vials, and certified pre-cleaned low-background vials. Larger laboratory bottles and storage containers, microplates, pipette tips, syringes and autosampler instrumentation are excluded. Sizing is measured at supplier revenue in current prices.
Quantitative Units
USD billions (current prices); vial units and analyte recovery percentages where applicable
Segmentation Dimensions
By Vial Type and Surface; By End-Use Setting; By Commercial Dimension; By Region
Regions Covered
North America, Western Europe, East Asia, South Asia and Pacific, Latin America, Middle East and Africa, Eastern Europe
Countries Covered
USA, China, Germany, France, UK, Japan, South Korea, India, Australia, Canada, Brazil, Mexico, Indonesia, Vietnam, Thailand, Malaysia, UAE, Saudi Arabia, South Africa, Nigeria, Turkey, Poland, Netherlands, Italy, Spain, Sweden, Switzerland, Argentina, Colombia, Singapore, and additional markets relevant to this sector
Key Companies Profiled
Thermo Fisher Scientific, Agilent Technologies, Waters Corporation, DWK Life Sciences, Merck KGaA, Restek Corporation, Shimadzu Corporation, PerkinElmer, Chromatography Research Supplies, Macherey-Nagel, Sarstedt, Eppendorf, Corning, VWR International, Wheaton Industries, JG Finneran Associates, Micro-Tec, Shandong Pharmaceutical Glass, Zhejiang Aijiren Technology, Bio-Rad Laboratories
Quantitative Methodology
Primary survey, n=3,800 respondents, Q4 2025, six countries; demand-side model with trade association cross-validation
Qualitative Methodology
47 expert interviews, Q4 2025; applied to validate demand model assumptions, identify emerging dynamics, and assess competitive positioning
Report Format
PDF and XLSX data workbook (Word format preview document)
Publisher
Market Minds Advisory
Report Code
MMA-2026-HLT-759
Published
August 2026
Contact
sales@marketmindsadvisory.com | www.marketmindsadvisory.com

Purchase the full Micro Vials Market Report (2026 to 2036).

The full report sizes micro vials across six type and surface categories, three commercial dimensions and seven regions, with annual forecasts to 2036 under base, bull and bear scenarios. Analyte recovery is compared across vial surfaces by compound class, quantifying the losses that validated methods frequently fail to account for. Certification requirements for trace contaminant monitoring are set out by matrix and jurisdiction, with testing capacity assessed supplier by supplier. Autosampler dimensional tolerances are compiled by instrument model. Twenty suppliers are profiled on a consistent vial and closure revenue basis.
Analyte recovery compared across vial surfaces by compound class
Certification requirements set out by matrix and jurisdiction
Autosampler dimensional tolerances compiled by instrument model
Method validation lock-in quantified across regulated laboratory types
Certified vial testing capacity assessed across the supplier set
Injection volume trends modelled against unit consumption per sample

Built For The People Who Decide

From boardroom strategy to bench-side execution, this report is read cover-to-cover by leaders shaping the next decade of their industry, turning demand scenarios, market dynamics and valuation benchmarks into decisions.
CXOs/ Presidents/ VPs/ Managers
M&A and Corporate Development
Strategy Teams and R&D Heads
Procurement and Product Directors
Regulatory and Compliance Leaders
Investor Relations and Equity Analysts