

Market Minds Advisory
Micro-Mobility Charging Infrastructure Market

Micro-Mobility Charging Infrastructure Market: Fire regulation, battery swapping and the standards nobody agreed to 2036

People died in flat fires started by cheap batteries, cities banned indoor charging within months, and a market that barely existed has suddenly become something somebody now has to build.

Lead Analyst

David Horsley

Published

September 2026

Make Smarter Decisions with Customized Research Insights

Request a free sample report and evaluate market opportunities, growth trends, and competitive dynamics relevant to your business needs.

2025 MARKET VALUE$1.6BMarket Size 2025
2036 FORECAST VALUE$7.2BBase Case , 2026 to 2036
CAGR 2026 TO 203614.6 %Bull 15.9% / Bear 13.3%
INCREMENTAL OPPORTUNITY$5.3BNet 10- year value creation
EXPANSION MULTIPLE3.91x2036 value over 2026 base
Strategic Levers
M&A Pipeline
Regional Outlook
Country Rankings
Competitive Intelligence
Segmental Deep-dive
Call-Us : 91 93563 13602

Executive Snapshot and Market Trajectory

Roughly 41% of urban housing now bars battery charging inside dwellings, following fires that killed people in New York and London. That converted charging from something a rider did in a hallway into infrastructure somebody has to build, own and site. The market exists because of a safety failure.
Battery swapping cabinets grow at 21.9%, half again the market rate of 14.6%, because exchanging a pack takes around 90 seconds while charging takes hours and most urban riders have nowhere to do it. East Asia holds 32% of value, above any normal band, on a Chinese electric two-wheeler fleet running into hundreds of millions. Deployed public bays sit at 31% utilisation. Infrastructure nobody uses stops attracting the capital that builds more of it.
Five suppliers hold just 24% of infrastructure supply and the fragmentation has a specific technical cause. Fourteen incompatible connector and battery formats are in commercial use, which means no charging point serves everybody and every swap network is closed by construction rather than by strategy. Nobody has agreed a standard, and until somebody does this market cannot work the way car charging does.
Market Definition
This report covers charging and battery exchange infrastructure supplied for electric bicycles, scooters, mopeds and light three-wheelers, spanning private and home charging equipment, battery swapping cabinets, fire-rated communal charging cabinets, public kerbside charging points, fleet depot charging systems, and integrated charging lockers and storage. Value is measured at supplier level on installed system and equipment revenue. Excluded are the vehicles and batteries themselves, electric car charging equipment, grid connection works, and mobility operating services.
Base Year Value
$1.6B in 2025 (MMA Primary Research Dataset, August 2026)
Forecast Period
2026 to 2036, eleven discrete annual values
CAGR
14.6% base case. Bull 15.9%. Bear 13.3%.
Fastest Growth Segment
Battery Swapping Cabinets: 21.9% CAGR
Fastest Growth Country
India: 19.2% CAGR
Fastest Growth Region
South Asia and Pacific: 17.0% CAGR
Largest Region
East Asia: 32% of 2025 global value
Market Leaders
Gogoro, Honda Motor, NIU Technologies, Swobbee and SUN Mobility lead the market. Source: MMA Primary Research Dataset, July 2026.
Primary Survey
n=3,800 procurement and R&D decision-makers, Q4 2025, six countries
Methodology
Demand-side build-up, cross-validated against public data, 47 expert interviews

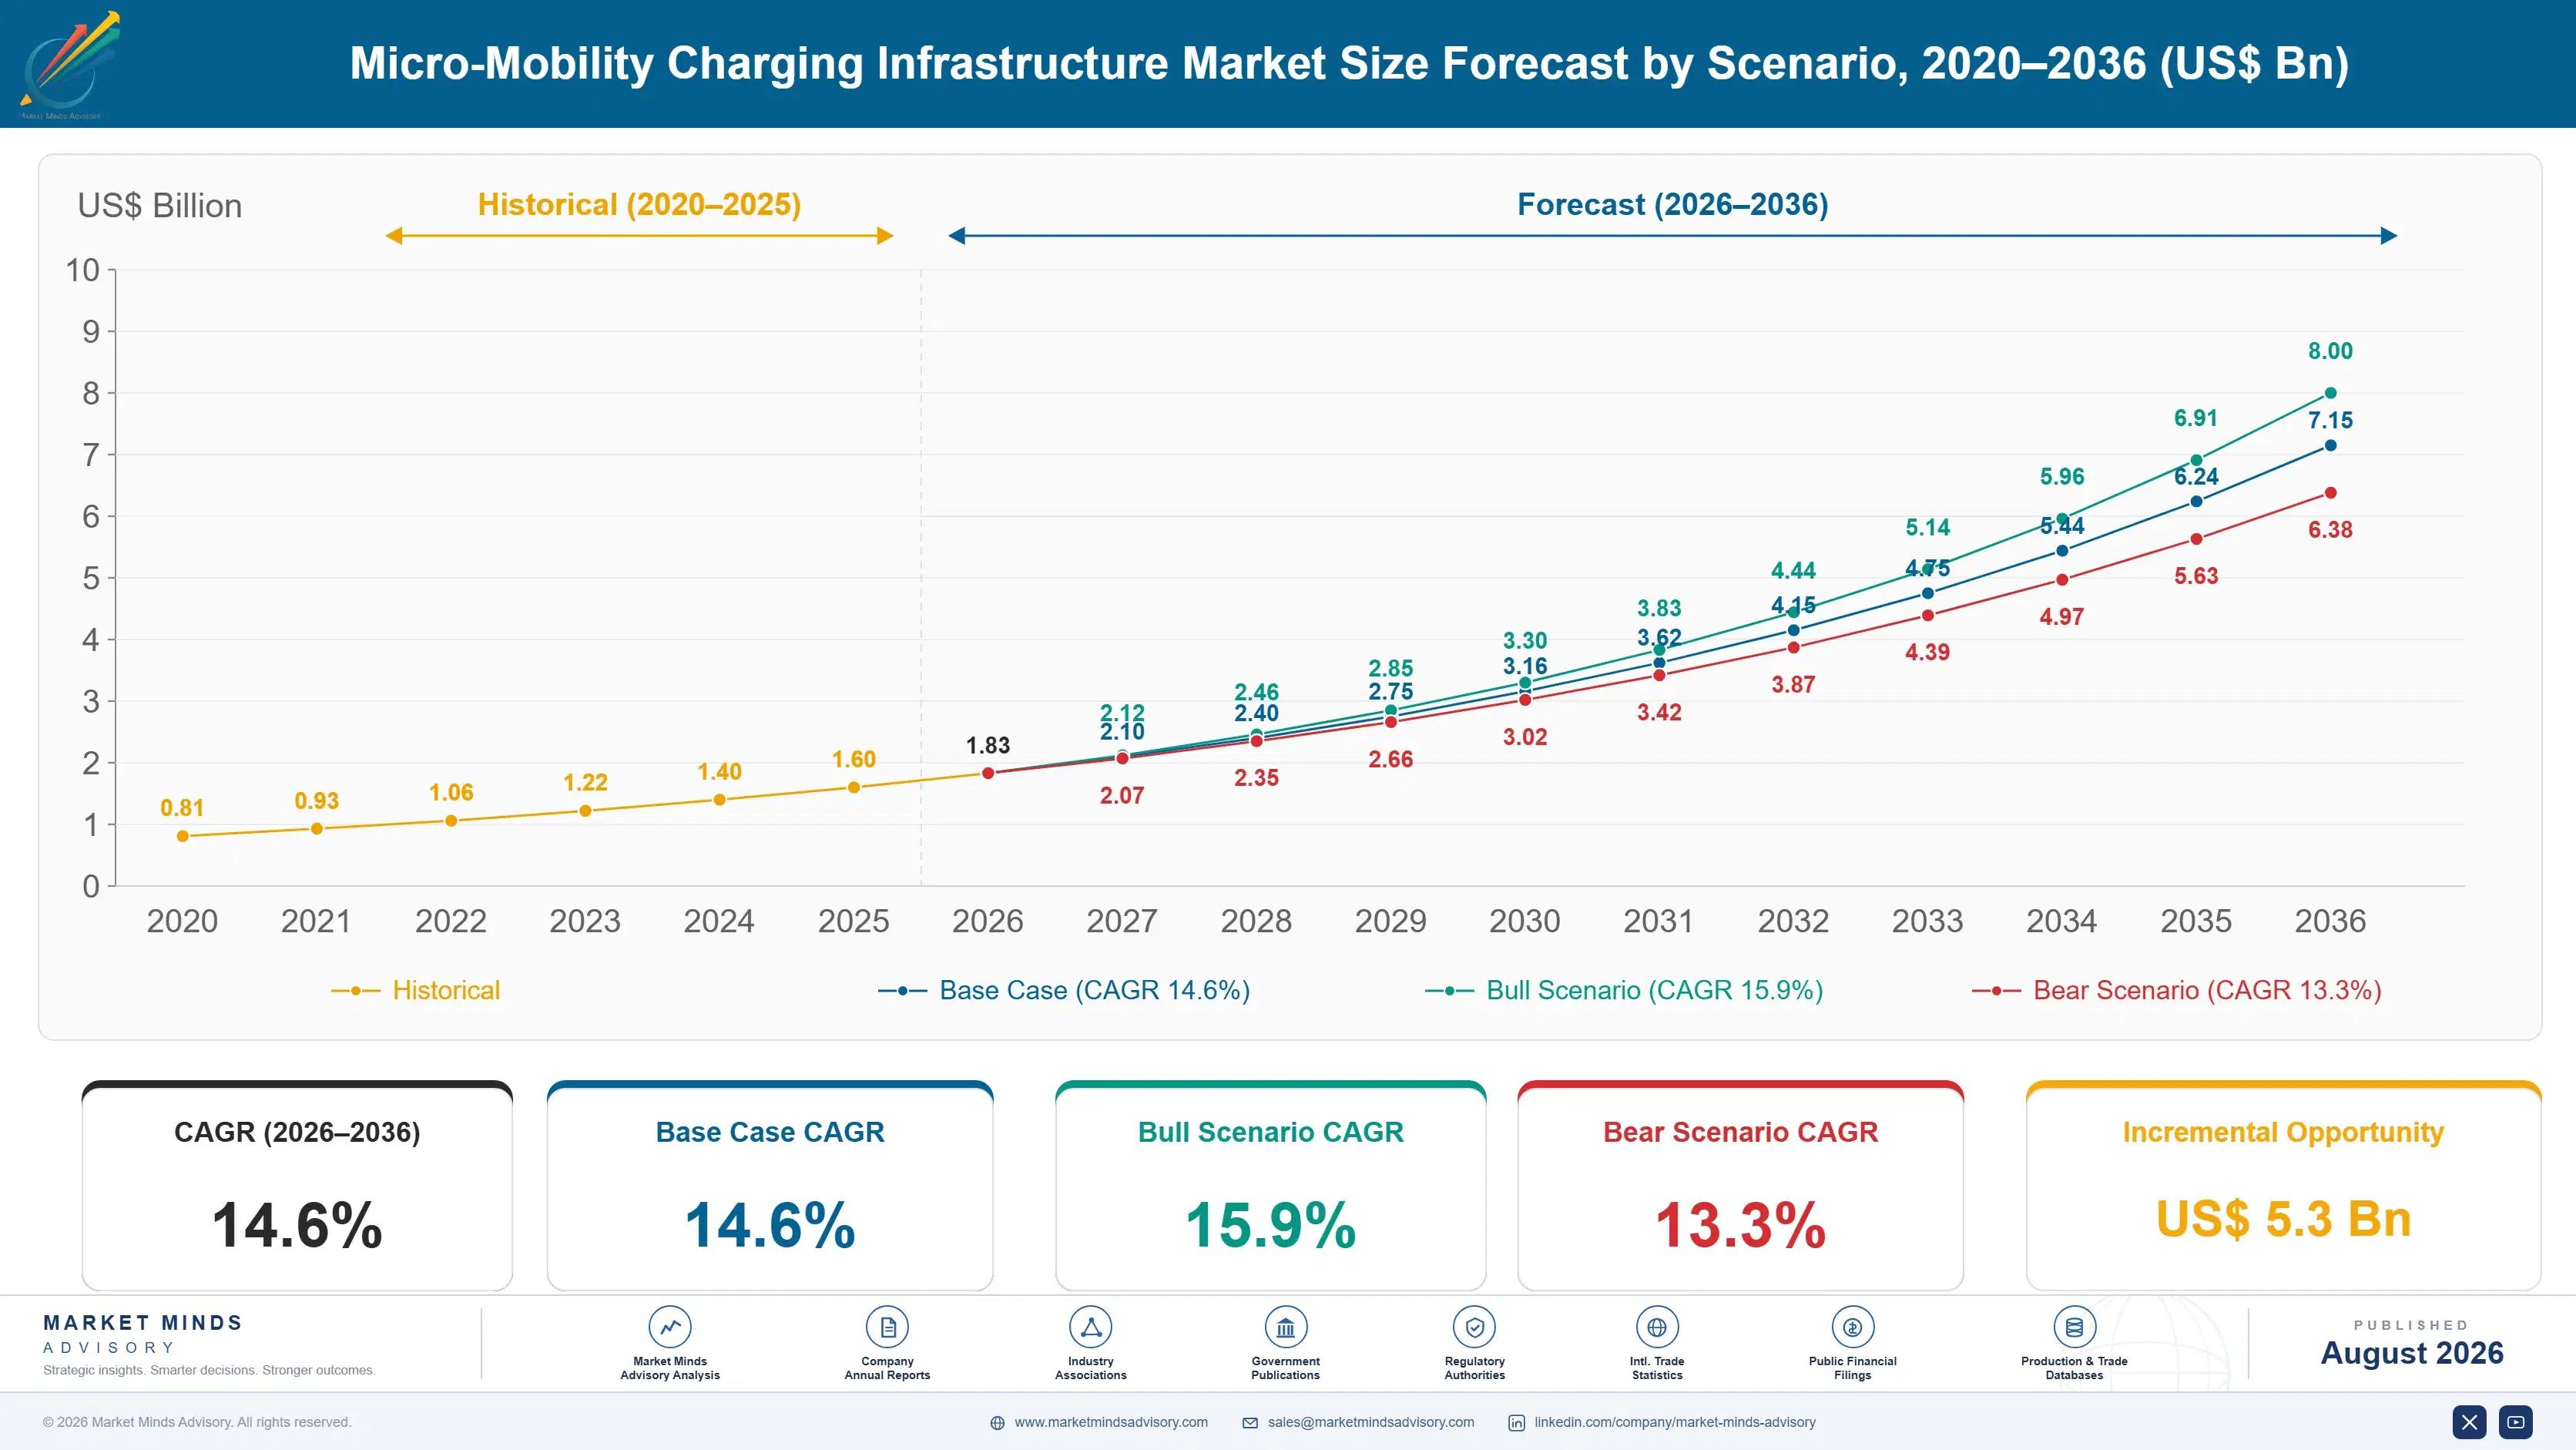
Micro-Mobility Charging Infrastructure Market Forecast Scenarios

micro-mobility-charging-infrastructure-market-size-forecast-scenario-1787555573212
Growth ran at 12.8% between 2020 and 2025 and the composition shifted entirely partway through. Early growth came from shared fleet operators building depot capacity and from Asian battery swapping networks expanding with two-wheeler adoption. Then fires in residential buildings produced regulation that arrived within months rather than years, and communal fire-rated charging became a category driven by housing providers and insurers rather than by anybody in mobility.
The 14.6% base case rests on three mechanisms. Indoor charging prohibitions keep spreading across urban housing, which forces communal provision that housing associations, employers and municipalities have to fund and install. Asian battery swapping keeps expanding at 21.9% on exchange times around 90 seconds that charging cannot approach. And Indian two and three-wheeler swapping keeps growing at 19.2% on commercial fleets where vehicle downtime costs a driver their income. All three run independently.
The 15.9% bull case is agreement on a common battery or connector standard, which would make open public charging viable and open siting that proprietary networks cannot justify. The 13.3% bear case is deployed utilisation staying near 31%, since infrastructure nobody uses stops attracting capital regardless of how many riders exist or what regulation requires them to do.

Built From A Safety Failure

This market was created by fires. Cheap uncertified lithium packs charging overnight in hallways and flats caused deaths in New York and London, and the regulatory response arrived within months rather than the years these things usually take. Certification requirements, sale prohibitions and housing rules barring indoor charging followed quickly. Around 41% of urban housing now prohibits charging inside dwellings, which means several million people who were charging at home need somewhere else to do it and somebody has to provide that.
TOP-FIVE CONCENTRATION24%Combined position across charging infrastructure supply held by leaders
INDOOR CHARGING PROHIBITION RATE41%Share of urban housing now barring battery charging inside dwellings
BATTERY SWAP EXCHANGE TIME90 secondsHow long replacing a depleted pack takes at a cabinet
CONNECTOR STANDARDS IN USE14Number of incompatible charging interfaces across major manufacturers
EQUIPMENT COST SHARE62%Portion of installed system cost attributable to the hardware
CABINET UTILISATION RATE31%Average daily occupancy across deployed public charging bays
Battery swapping is the answer wherever micro-mobility is genuinely transport rather than recreation. Exchanging a depleted pack takes around 90 seconds while charging takes hours, and a rider with no home charging option and a delivery shift to complete cannot wait. That is why Chinese, Taiwanese and Indian networks scaled while Western equivalents did not, and it reflects what the vehicles are for.
The underlying problem is that nobody agreed a standard. Fourteen incompatible connector and battery formats are in commercial use, which means a charging point cannot serve everybody and every swap network is closed by construction. Public charging as car drivers understand it is not currently possible.
"Car charging works because a handful of connectors won and everybody else gave up. This industry has fourteen formats and every manufacturer thinks theirs will be the one, which guarantees that none of them is and that public infrastructure stays uneconomic."
Director, Light Electric Mobility and Charging Systems Practice · MMA Energy Practice · August 2026

Market Trends

Indoor charging prohibitions create a market from nothing

Residential fires caused by uncertified lithium packs produced regulation faster than almost any consumer safety issue in recent memory, with device certification requirements, sale bans and housing rules barring indoor charging arriving within months of the incidents. Around 41% of urban housing now prohibits charging inside dwellings across affected cities. That leaves riders who were charging in hallways needing communal provision that housing associations, employers and municipalities must fund and install. The buyer is therefore a landlord or a local authority rather than anybody in mobility, which is an entirely different sales process from what this industry was organised around.
Market Impact: Exchanges packs in 90 seconds

Fourteen incompatible formats prevent open public charging

Fourteen connector and battery formats are in commercial use across major manufacturers, none compatible with any other, which means a public charging point can serve only the riders whose vehicles match it. Car charging became viable because a small number of connectors won and everybody else conceded, and this industry has not reached that point and shows little sign of doing so. Every swap network is therefore closed by construction rather than by commercial choice. Commercially this caps utilisation, prevents the shared infrastructure economics that make public charging work and keeps deployed bay occupancy near 31%.
Market Impact: Drives 19.2% Indian growth

Market Opportunities and Growth Drivers

Battery swapping suits riders who cannot wait to charge

Exchanging a depleted pack at a cabinet takes around 90 seconds while charging the same battery takes several hours, and for a delivery rider or a commuter with no home charging option that difference decides whether electric transport works at all. Chinese, Taiwanese and Indian networks scaled on exactly that arithmetic. Growth at 21.9% follows commercial and utility riding rather than recreational use, which explains why adoption maps so closely onto where two-wheelers are transport rather than leisure. The economics also shift battery ownership to the network, which removes the largest single cost from the vehicle purchase.
Market Impact: Runs at 31% bay occupancy

Indian commercial fleets adopt swapping faster than anywhere

Indian electric two and three-wheeler fleets serve delivery, ride-hailing and goods transport where a vehicle standing idle costs the driver income directly, which makes charging time a wage question rather than a convenience one. Battery swapping removes it entirely and separates battery ownership from vehicle purchase, cutting the upfront price that constrains adoption most. Growth at 19.2% is the fastest of any country here and rests on commercial economics rather than on subsidy or environmental preference. Several domestic networks have scaled quickly and international suppliers have barely engaged with the opportunity at all.
Market Impact: Grows fire-rated cabinets at 19.4%

Market Restraints and Challenges

Deployed utilisation stays low and deters further capital

Public charging bays average around 31% daily occupancy, which is well below what the economics require and far below what deployment forecasts assumed. The root cause is siting: infrastructure went where planners could obtain permission and grid connection rather than where riders actually stop, and a charging point three streets from a destination might as well not exist. Commercially this makes each additional deployment harder to fund and slows the network effects public charging depends on. Operators are responding with usage data driven siting and with placement inside buildings and workplaces where the rider is already going.
Market Impact: Affects 41% of urban housing

Fire liability makes siting and insurance genuinely difficult

The same fire risk creating demand for communal charging also makes anybody installing it nervous, since a cabinet containing several charging lithium packs is a concentrated hazard that insurers, landlords and fire authorities all scrutinise. The root cause is that thermal runaway in one pack can propagate, and containment requires engineering that adds substantial cost. Commercially this slows installation approvals and raises equipment specification well above what the charging function alone would need. Suppliers are responding with fire-rated enclosures, thermal isolation between bays and suppression systems, all of which price considerably above basic charging hardware.
Market Impact: Splits demand across 14 formats
3 additional market trends, 4 additional growth drivers, and 2 additional restraints and challenges are covered in the full report. Contact sales@marketmindsadvisory.com to access the complete intelligence.

Segment CAGR and Growth Architecture

Systems are classified here by installation type, since that determines who buys it, where it sits and what safety engineering it requires. Vehicle category, ownership model and payment arrangement are handled separately in the framework, because a single installation type serves private riders, fleets and shared operators without changing what it is. Installation type decides the buyer.
micro-mobility-charging-infrastructure-market-market-share-analysis-1787555573757

Battery Swapping Cabinets

Growing at 21.9%, half again the market rate, swapping wins wherever a rider genuinely cannot wait. Exchanging a pack takes around 90 seconds against several hours to charge, which matters enormously to a delivery rider paid per drop and not at all to somebody riding at weekends. That distinction explains the geography precisely: Chinese, Taiwanese and Indian networks scaled because two-wheelers are transport there, and Western deployment lagged because they largely are not. Swapping also moves battery ownership to the network, removing the biggest single cost from vehicle purchase. Every network is proprietary and closed, which is the model's commercial strength and its ceiling simultaneously. Nobody has solved that tension.
CAGR 21.9%

Fire-Rated Communal Charging Cabinets

This segment barely existed three years ago and now grows at 19.4%, driven entirely by regulation responding to residential fires. Around 41% of urban housing bars indoor charging, which leaves housing associations, employers and municipalities needing to provide somewhere safe. The engineering requirement is containment rather than charging: thermal isolation between bays, fire-rated enclosure construction and suppression systems capable of holding a propagating lithium fire long enough for a building to be evacuated. That specification prices well above ordinary charging hardware. The buyer is a landlord or facilities manager rather than anybody in mobility, which most suppliers in this industry have never sold to before. Most suppliers here have never sold to a facilities manager before.
CAGR 19.4%
Full segment breakdown across 6 segments available in the complete report.

Regional Architecture and Country Demand Map

East Asia holds 32% of value, above the usual band, because Chinese electric two-wheeler numbers run into hundreds of millions and swap cabinets are ordinary street furniture there. North America follows at 22% on fire regulation rather than ridership. Vehicle purpose decides everything here. Purpose beats population.

East Asia

At 32% this region sits above the usual band ceiling, and the reason is scale rather than policy: Chinese electric two-wheeler numbers run into the hundreds of millions and battery swap cabinets are ordinary street furniture rather than novel infrastructure. Those vehicles are transport for people who work, which makes exchange time a wage question and swapping the obvious answer. Taiwanese networks demonstrated the model at national scale before anybody else attempted it. Japanese and Korean deployment is smaller and focused on delivery fleets. Growth at 15.6% combines fleet expansion with cabinet density rising in cities that already have substantial coverage. This share sits above the usual ceiling because the vehicle fleet genuinely has no comparison anywhere else.
Share: 32% | CAGR: 15.6% (2026 to 2036)

North America

Regulation rather than ridership drives this market, and it arrived abruptly following residential fires that killed people in New York. Device certification requirements, sale prohibitions and housing rules barring indoor charging appeared within months, creating demand for communal provision from landlords and municipalities who had never bought charging equipment before. Delivery riding in dense cities is the largest use case and it is commercial rather than recreational, which suits swapping better than most suppliers assumed. Shared scooter fleets use van-based battery collection rather than fixed infrastructure. Growth at 15.8% is the fastest on this table and rests almost entirely on safety regulation. Safety regulation rather than ridership created essentially the whole opportunity here, which is unusual.
Share: 22% | CAGR: 15.8% (2026 to 2036)
Regional intelligence for 5 additional markets available in the complete report: Western Europe, South Asia and Pacific, Latin America, Middle East and Africa, Eastern Europe. Contact sales@marketmindsadvisory.com.
micro-mobility-charging-infrastructure-market-country-cagr-analysis-1787555574284

Where Charging Margin Actually Sits

Four moves matter in a market created by a safety failure, fragmented across fourteen incompatible formats and running at a third of the utilisation its economics need. Two are about the buyers regulation created, and two are about making infrastructure that people actually use. Waiting for a standard is not among them. Nobody is coming.

Sell to landlords, not to mobility operators

Around 41% of urban housing now prohibits indoor battery charging, which makes housing associations, employers and municipalities the buyers of communal provision rather than anybody in mobility. Those organisations have never purchased charging equipment, buy on liability and insurance rather than on utilisation, and fund from building budgets rather than mobility ones. Suppliers organised around fleet operators and city transport departments are addressing the wrong customer entirely for the fastest-growing segment. Fire-rated cabinets compound at 19.4% and the sales process resembles building services rather than mobility infrastructure. Very few suppliers can sell that way.
Market Impact: Reaches buyers across 41% of all urban housing

Site from usage data, not planning convenience

Deployed public bays run at around 31% occupancy because infrastructure went where permission and grid connection were obtainable rather than where riders actually stop. A charging point three streets from a destination might as well not exist, and every underused installation makes the next one harder to fund. Siting from anonymised trip termination data rather than from planning availability transforms utilisation without changing the hardware at all. Operators doing this report occupancy well above the deployed average, which changes the economics of every subsequent installation they propose. Hardware changes not at all.
Market Impact: Lifts occupancy well above the 31% deployed average

Build for commercial riding, not recreational use

Swapping wins where a rider cannot wait, and exchange at around 90 seconds against hours of charging matters enormously to somebody paid per delivery and not at all to a weekend cyclist. That distinction explains the entire geographic pattern of adoption, and it means the addressable customer is a delivery platform or a fleet rather than a city population. Suppliers sizing markets by rider numbers rather than by commercial riding hours consistently overestimate Western demand and underestimate Indian and Southeast Asian demand by considerable margins. That gap is consistently large.
Market Impact: Serves riders needing a 90 second pack exchange

Design for heat before entering hot markets

Cabinet cooling determines charging rate and thermal safety together, and equipment designed for temperate European conditions performs badly across the Gulf, South Asia and much of Africa where a substantial share of commercial two-wheeler riding happens. Ambient temperatures above forty degrees reduce achievable charge rates and raise propagation risk in a cabinet holding multiple packs. Temperate designs exported there derate quickly. Designing for heat from the start is considerably cheaper than retrofitting cooling after a deployment underperforms. Cooling capacity above 40 degrees ambient is the specification that decides whether a cabinet works at all in these markets.
Market Impact: Handles a 40 degree ambient without any derating

Who Controls the Margin Pool

Five suppliers hold just 24% of infrastructure supply, measured on installed system and equipment revenue at supplier level, the basis used throughout this section. That fragmentation has a specific technical cause rather than a commercial one, since fourteen incompatible connector and battery formats mean no supplier can serve the whole market and every swap network is closed by construction. The gap between leaders and everybody else is network density within a format rather than any product advantage.
Competition runs on three dimensions. Format position, since a supplier serves only vehicles matching its interface and that is decided upstream by manufacturers. Safety engineering, which regulation has made decisive rather than optional. And siting capability, because utilisation at 31% shows most deployment has been placed badly. Price competes least, since liability rather than cost drives the fastest-growing purchases.

Rankings shift as fire regulation creates buyers who never previously existed, favouring suppliers who can sell to building services rather than mobility departments. Indian and Chinese swap networks are scaling faster than anybody Western. Any move toward format standardisation would redistribute positions completely, which is presumably why incumbents show no interest in one.
micro-mobility-charging-infrastructure-market-company-positioning-matrix-1787555574823

Competitive Moat and Risk Dimensions

GOGORO

Moat: National network density achieved

Gogoro built swap cabinet density across Taiwan sufficient that a rider is never far from an exchange, which is the threshold at which swapping becomes genuinely better than charging rather than merely faster. That density took years and considerable capital, and it makes the network self-reinforcing since riders choose vehicles for the network rather than the reverse.
GOGORO

Risk: Closed format expansion difficulty

The network works because the format is proprietary and controlled, and that same closure means every new market requires building density from zero before the proposition works at all. Expansion is therefore capital-intensive and slow in a way that open infrastructure would not be. Competitors in markets with domestic champions face an incumbent doing exactly the same thing locally.
SUN MOBILITY

Moat: Commercial fleet economics focus

SUN Mobility built around Indian commercial riding where vehicle downtime costs a driver income directly, which makes swapping a wage argument rather than a convenience one. Separating battery ownership from vehicle purchase also removes the largest barrier to adoption, and that financing structure is harder for a hardware supplier to replicate than the cabinets themselves.
SUN MOBILITY

Risk: Domestic competitive intensity

Indian swap networks have multiplied quickly and several are well funded, competing for the same commercial fleets in the same cities with broadly similar propositions. Density economics reward whoever reaches sufficient coverage first, which turns the market into a capital race rather than a product competition. Incumbency in one city confers limited advantage in the next one.

Players Tracked

Prominent Players

Gogoro
Honda Motor
NIU Technologies
Swobbee
SUN Mobility

Other Key Players

Swiftmile
Bikeep
Battery Smart
Immotor
Kuaidian Power
Vmoto
Piaggio Group
Yamaha Motor
Bosch
ABB
Charge Amps
Bolt Technology
Tier Mobility
Lime
Zoomo

Recent Developments

MARCH 2025

A housing authority mandated fire-rated communal charging provision

A major city housing authority required fire-rated communal charging installation across residential blocks where indoor charging had been prohibited, funding it from building safety budgets rather than transport programmes. This was a regulatory and procurement decision rather than any transaction between equipment suppliers. Transport budgets funded none of it.
Signal: Building safety budgets rather than mobility budgets are funding this, which changes who the supplier must actually convince
AUGUST 2025

An Indian swap network reached ten thousand cabinet deployments

An Indian battery swapping operator passed ten thousand deployed cabinets serving commercial two and three-wheeler fleets, expanding on delivery and goods transport economics rather than on consumer adoption. This was an operational milestone rather than any transaction or partnership announcement. Consumer adoption played almost no part in reaching that milestone.
Signal: Density is being reached fastest where riding is work rather than leisure, which is where swapping economics genuinely apply
DECEMBER 2025

A European consortium published a common swappable battery specification

A consortium of European two-wheeler manufacturers published a common swappable battery specification intended to allow shared infrastructure across brands. This was a technical specification release rather than any commercial transaction, and adoption commitments beyond the consortium members remain limited. Fourteen formats remain in commercial use.
Signal: Standardisation attempts keep emerging without adoption, which suggests fourteen formats will persist longer than anybody wants

What Moves System Cost

Equipment accounts for around 62% of installed system cost, covering cabinet structure, power electronics, connectors, cooling and increasingly fire containment engineering. Installation, electrical works and grid connection make up most of the remainder and vary enormously by site. Network software and payment infrastructure are amortised across deployments. Fire-rated construction adds substantially to hardware cost wherever regulation requires it.
Power electronics and connector component costs moved sharply through 2021 and 2022 on semiconductor shortage and metals inflation, and IEA data record energy and materials movement across the period. ABB noted component availability and cost pressure across its electrification operations in its Annual Report 2022. Suppliers holding fixed-price municipal and housing contracts absorbed most of the movement, since a public procurement price is set at tender and does not reopen.

Grid connection rather than equipment is the cost that determines whether a site happens at all. A cabinet needing a new supply can cost several times the hardware in electrical works and can wait many months for the connection itself. Suppliers designing for existing supply capacity site far more installations per year than those specifying maximum charge rates.
micro-mobility-charging-infrastructure-market-cost-volatility-analysis-1787555575021

Design for existing supply rather than maximum charge rate

Grid connection frequently costs several times the equipment and delays a site by many months, which makes power draw a siting variable rather than a performance one. Cabinets specified to run within existing building supply capacity deploy far faster and in far more locations than those requiring new connections. Suppliers optimising charge rate rather than deployability lose installations.

Standardise fire containment across the whole product range

Fire-rated construction is becoming a requirement rather than an option across an expanding set of jurisdictions, and maintaining separate rated and unrated product lines doubles engineering and inventory for a distinction that regulation keeps erasing. Building containment into every product simplifies the range and anticipates rules arriving anyway. The cost premium falls considerably at volume across a single specification.

Index municipal contracts to published component benchmarks

Power electronics and connector costs move on semiconductor and metals markets entirely unconnected to charging demand, and fixed-price public procurement transfers that exposure wholly to the supplier across contract periods measured in years. Indexing to published benchmarks removes it. Public buyers resist because their budgets are fixed, which makes this a genuine negotiation rather than a formality anywhere.

Portfolio Architecture for Margin Defence

Margin here tracks liability and safety engineering rather than charging performance, which is not what the hardware would suggest. Basic private and home charging equipment runs at gross margins in the high teens against commodity imports meeting the same function. Public kerbside and depot systems run better on installation complexity and network software. Fire-rated communal cabinets and swap infrastructure run considerably higher, because the buyer is managing a liability rather than purchasing a charging rate.
The tension is that swap networks require enormous capital before any density threshold makes them work, while communal cabinets sell one site at a time to buyers with building budgets. Those are completely different businesses with different funding profiles and different customers, and suppliers attempting both have generally found the network capital consuming attention the cabinet sales process needed. That shows up as slow response to housing procurement, which is exactly the fastest-growing demand available.

High-value pools sit in fire-rated communal provision, commercial fleet swapping and heat-capable equipment for hot markets. None of the three depends on any charging standard being agreed. Charging hardware alone defends very little in a fragmented market.

Volume / Commodity-Adjacent

Private and home charging equipment competing against commodity imports performing the same function at lower cost. The eight-point range separates suppliers with certification and safety approvals from those selling uncertified product into markets that increasingly prohibit it.
Gross Margin: 17%-25%

Premium / Certified

Public kerbside points, depot systems and integrated lockers where installation complexity, network software and siting capability narrow the field. The twelve-point spread reflects utilisation, since a well-sited installation earns very differently from a poorly sited identical one.
Gross Margin: 28%-40%

Sustainability / Regulatory / Next-Generation

Fire-rated communal cabinets, swap infrastructure and heat-capable equipment for high ambient markets. The twenty-point range is wide because these price against liability and network position rather than against any charging function a buyer could compare.
Gross Margin: 38%-58%
micro-mobility-charging-infrastructure-market-portfolio-architecture-1787555575529

High-value Sub-segments and Strategic Watch-out

Fire-Rated Communal Provision

Compounding at 19.4% and bought by housing associations and employers managing liability rather than by anybody in mobility. Suppliers organised around fleet operators are addressing entirely the wrong customer for the fastest-growing demand available. Building services sells nothing like mobility does at all. Nobody overlaps.
Gross Margin: 40%-58%

Commercial Fleet Swapping

Growing at 21.9% on 90 second exchange against hours of charging, which matters to a rider paid per delivery and not at all to a weekend cyclist. Geographic adoption maps precisely onto whether riding is work. Delivery platforms rather than city populations size this segment properly.
Gross Margin: 36%-52%

Private Charging Equipment

The commodity volume, competing against imports doing the same job cheaper and increasingly restricted by certification requirements. Manage for certification compliance rather than margin, because differentiation is genuinely not available here. Certification compliance is the only real requirement left in it now. Margin is unavailable.
Gross Margin: 17%-25%

High Ambient Temperature Systems

Cabinet cooling decides charge rate and thermal safety together, and temperate designs derate badly above forty degrees. A substantial share of commercial riding happens in exactly those conditions, and very few suppliers design for it. Retrofitting cooling after a deployment underperforms costs considerably more. Design early.
Gross Margin: 34%-48%

How Charging Demand Renews

Demand renews on two entirely separate clocks and suppliers usually understand only one. Infrastructure sales renew on deployment programmes, where a housing authority or fleet operator installs a batch and does not return for years. Swap network revenue renews on every exchange, continuously and forever, which makes it an annuity attached to a rider rather than a capital sale. The second earns more across a decade and needs enormous capital before density makes it work.
Stickiness runs through format rather than relationship, which is unusual and decisive. A rider whose vehicle matches one network cannot use another regardless of price, service or preference, so retention is a manufacturing decision taken upstream rather than anything the infrastructure supplier influences. Fire-rated cabinet sales are stickier than they look, since a housing provider who installed one range specifies it again for consistency and maintenance simplicity.

The buyer changed completely and most suppliers have not followed. This industry sold to mobility operators and city transport departments who understood ridership and utilisation. The fastest-growing demand now comes from housing associations, facilities managers and insurers who care about containment ratings and liability, and who never attend mobility conferences.
micro-mobility-charging-infrastructure-market-end-use-penetration-index-1787555576021

Where To Place The Bet

These are among the four positions where our research anticipates prominent divergence between winners and laggards over the coming forecast period. Each is grounded in the demand model, the regulatory perimeter, and the announced capacity pipeline.
01 / BUILDING BUYER REDIRECTION

Sell to landlords who never bought charging

Roughly 41% of urban housing now prohibits battery charging inside dwellings following residential fires, which makes housing associations, employers and municipalities the buyers of communal provision rather than anybody working in mobility. Those organisations purchase on liability and insurance exposure rather than on utilisation, fund from building safety budgets rather than transport ones, and have never bought charging equipment before in any form. Suppliers organised entirely around fleet operators and city transport departments are addressing precisely the wrong customer for the fastest-growing segment available.
02 / SITING DATA DISCIPLINE

Place infrastructure where riders actually stop

Deployed public charging bays average around 31% daily occupancy because installations went where planning permission and grid connection could be obtained rather than where riders genuinely finish their journeys. A charging point three streets from a destination might as well not exist, and every underused installation makes funding the next one considerably harder to justify. Siting from anonymised trip termination data rather than from planning availability transforms utilisation without any change to the hardware, and operators doing it report occupancy far above the deployed average.
03 / COMMERCIAL RIDING FOCUS

Follow the riders who cannot afford to wait

Swapping a battery takes around 90 seconds against several hours to charge one, and that difference decides everything for a delivery rider paid per drop while meaning almost nothing to somebody cycling at weekends for pleasure. The entire geographic pattern of swap network adoption follows that single distinction rather than any policy, subsidy or technology preference anybody has expressed. Suppliers sizing markets by total rider population rather than by commercial riding hours consistently overestimate Western demand and underestimate Indian and Southeast Asian opportunity substantially.
04 / THERMAL DESIGN REQUIREMENT

Engineer for heat before selling into it

Cabinet cooling determines both achievable charging rate and thermal propagation safety, and equipment designed around temperate European conditions performs badly across the Gulf, South Asia and much of Africa where a very large share of commercial two-wheeler riding actually happens. Ambient temperatures above forty degrees reduce charge rates and raise the risk of propagation inside a cabinet holding multiple packs simultaneously. Suppliers exporting temperate designs into those markets meet derating and safety problems that damage reputation faster than any commercial recovery allows.

Engagement Snapshot From the Field

A live engagement with an industry participant carrying material or product regulatory and market exposure ahead of a defining policy shift, showing how our research translates into a defensible multi-year portfolio strategy.
MARKET MINDS ADVISORY · CLIENT ENGAGEMENT SUMMARY
Micro-Mobility Charging Infrastructure Producer Strategic Portfolio Review and Transition Roadmap 2026·Investment Scenario on Micro-Mobility Charging Infrastructure Exposure Evaluation 2025-26
CLIENT PROFILE
A European micro-mobility charging supplier with annual revenue around EUR 26 million (client-reported, unverified by MMA), producing public kerbside charging points and depot systems for shared fleet operators and municipalities. The business held no fire-rated product and no swap capability. Commercial effort targeted city transport departments exclusively. Deployed utilisation was not tracked. Fire regulation was never tracked.
STRATEGIC CHALLENGE
Shared scooter operators had moved to van-based battery collection (client-reported, unverified by MMA), removing the client's largest customer segment, and municipal orders had slowed. Management proposed price reductions to win remaining tenders. Nobody had examined where demand was actually growing or who was funding it, which made the proposal a fight for a shrinking pool.
MMA APPROACH
MMA sized demand by funding source rather than by application, separating transport budgets from building safety budgets across the client's markets. Fire-rated communal requirements were mapped against housing regulation by city. Deployed utilisation was measured across the client's installed base, and swap network economics were assessed against the client's commercial riding exposure.
KEY FINDINGS
  1. Building safety budgets were funding considerably more charging installation than transport budgets across the client's markets, and the client had never approached a single housing provider.
  2. The client's deployed base averaged utilisation well below the market figure, because siting had followed municipal permission rather than any analysis of where riders actually stopped.
  3. Fire-rated communal cabinets required containment engineering the client did not possess, though its enclosure manufacturing was closer to the requirement than management believed.
  4. Commercial delivery riding in the client's cities was expanding steadily while shared recreational scooter use had plateaued, and the client served neither segment deliberately.
CLIENT PROFILE
A European micro-mobility charging supplier with annual revenue around EUR 26 million (client-reported, unverified by MMA), producing public kerbside charging points and depot systems for shared fleet operators and municipalities. The business held no fire-rated product and no swap capability. Commercial effort targeted city transport departments exclusively. Deployed utilisation was not tracked. Fire regulation was never tracked.
STRATEGIC CHALLENGE
Shared scooter operators had moved to van-based battery collection (client-reported, unverified by MMA), removing the client's largest customer segment, and municipal orders had slowed. Management proposed price reductions to win remaining tenders. Nobody had examined where demand was actually growing or who was funding it, which made the proposal a fight for a shrinking pool.
MMA APPROACH
MMA sized demand by funding source rather than by application, separating transport budgets from building safety budgets across the client's markets. Fire-rated communal requirements were mapped against housing regulation by city. Deployed utilisation was measured across the client's installed base, and swap network economics were assessed against the client's commercial riding exposure.
KEY FINDINGS
  1. Building safety budgets were funding considerably more charging installation than transport budgets across the client's markets, and the client had never approached a single housing provider.
  2. The client's deployed base averaged utilisation well below the market figure, because siting had followed municipal permission rather than any analysis of where riders actually stopped.
  3. Fire-rated communal cabinets required containment engineering the client did not possess, though its enclosure manufacturing was closer to the requirement than management believed.
  4. Commercial delivery riding in the client's cities was expanding steadily while shared recreational scooter use had plateaued, and the client served neither segment deliberately.
RECOMMENDED STRATEGY
Phase 1: Phase one: abandon the price reduction and build a fire-rated communal product, approaching housing associations and facilities managers rather than transport departments. Phase 2: Phase two: reposition siting proposals around trip termination data, using utilisation evidence to justify placement against municipal planning preference instead. Phase 3: Phase three: develop commercial delivery fleet propositions separately from shared recreational operators, since the two buy for entirely different reasons.
OUTCOME
A fire-rated product launched in late 2026 with three housing association orders secured. Siting proposals now use trip data and deployed utilisation is improving. Delivery fleet engagement has begun separately, and the client reports order intake recovering without any price reduction (client-reported, unverified by MMA).

Frequently Asked Questions

Foundational context covering the market sizes, CAGR, scope, country, region and competition that inform every finding below. This section is provided to cover basics and most often pre-purchase conversations, answered from the MMA Primary Research Dataset.

What is the current size of the Micro-Mobility Charging Infrastructure Market?

The market was valued at USD 1.6 billion in 2025, rising to an estimated USD 1.83 billion in 2026. East Asia holds the largest regional share at 32% of value.

How large will the Micro-Mobility Charging Infrastructure Market be by 2036?

MMA forecasts USD 7.16 billion by 2036 under the base case, an expansion multiple of 3.91 times the 2026 value. That represents USD 5.33 billion of incremental value.

What is the CAGR for the Micro-Mobility Charging Infrastructure Market 2026 to 2036?

The base case runs at 14.6% compound annual growth between 2026 and 2036, with a bull case at 15.9% and a bear case at 13.3%. Historical growth from 2020 to 2025 was 12.8%.

Which segment is growing fastest?

Battery swapping cabinets lead at 21.9%, half again the market rate, exchanging a pack in around 90 seconds. Fire-rated communal cabinets follow closely at 19.4%.

Who are the major companies in the Micro-Mobility Charging Infrastructure Market?

Gogoro, Honda Motor, NIU Technologies, Swobbee and SUN Mobility hold just 24% between them. Fourteen incompatible formats prevent anybody serving the whole market at all.

Which country is growing fastest?

India leads at 19.2%, where commercial two and three-wheeler fleets treat charging time as lost income rather than as an inconvenience they can simply absorb.

Report Segmentation Architecture

The full report scope spans multiple orthogonal segmentation dimensions, with cross-tabulated demand data provided for each dimension pair. Coverage extends further to regional breakdowns, trend trajectories, and the competitive detail needed to support segment-level decision-making.

By Installation Type

  • Private and Home Charging Equipment
  • Battery Swapping Cabinets
  • Fire-Rated Communal Charging Cabinets
  • Public Kerbside Charging Points
  • Fleet Depot Charging Systems
  • Integrated Charging Lockers and Storage

By End-Use Industry

  • Delivery and Logistics Fleets
  • Shared Mobility Operators
  • Residential Housing Providers
  • Employer and Workplace Provision
  • Municipal Public Infrastructure
  • Private Consumer Ownership

By Payment Arrangement

  • Equipment Purchase
  • Subscription Network Access
  • Pay Per Exchange
  • Managed Service Contract
  • Public Procurement Tender

By Region

  • North America
  • Western Europe
  • East Asia
  • South Asia and Pacific
  • Latin America
  • Middle East and Africa
  • Eastern Europe

Scope, Methodology, and Coverage

Every figure in this report is reproducible from documented input assumptions. The scope below maps the historical period, the forecast horizon, the segmentation dimensions, and the countries covered, alongside the underlying primary and qualitative methodology.
Historical Period
2020 to 2025
Forecast Period
2026 to 2036
Base Year
2025 (USD billions; MMA Primary Research Dataset, August 2026)
Market Definition
The market comprises charging and battery exchange infrastructure supplied for electric bicycles, scooters, mopeds and light three-wheelers across delivery, shared mobility, residential, workplace, municipal and private applications, covering private and home charging equipment, battery swapping cabinets, fire-rated communal charging cabinets, public kerbside charging points, fleet depot charging systems, and integrated charging lockers and storage. Value is measured at supplier level on installed system and equipment revenue. The vehicles and batteries themselves, electric car charging equipment, grid connection works and mobility operating services fall outside scope.
Quantitative Units
USD billions (current prices); thousand charging and exchange points deployed annually; USD per installed point by installation type
Segmentation Dimensions
By Installation Type; By End-Use Industry; By Payment Arrangement; By Region
Regions Covered
North America, Western Europe, East Asia, South Asia and Pacific, Latin America, Middle East and Africa, Eastern Europe
Countries Covered
China, Taiwan, Japan, South Korea, India, Indonesia, Vietnam, Thailand, Australia, United States, Canada, Mexico, United Kingdom, Netherlands, Germany, France, Spain, Italy, Belgium, Denmark, Poland, Czechia, Romania, Hungary, Brazil, Colombia, Argentina, United Arab Emirates, Saudi Arabia, Kenya
Key Companies Profiled
Gogoro, Honda Motor, NIU Technologies, Swobbee, SUN Mobility, Swiftmile, Bikeep, Battery Smart, Immotor, Kuaidian Power, Vmoto, Piaggio Group, Yamaha Motor, Bosch, ABB, Charge Amps, Bolt Technology, Tier Mobility, Lime, Zoomo
Quantitative Methodology
Primary survey, n=3,800 respondents, Q4 2025, six countries; demand-side model with trade association cross-validation
Qualitative Methodology
47 expert interviews, Q4 2025; applied to validate demand model assumptions, identify emerging dynamics, and assess competitive positioning
Report Format
PDF and XLSX data workbook (Word format preview document)
Publisher
Market Minds Advisory
Report Code
MMA-2026-ENE-138
Published
August 2026
Contact
sales@marketmindsadvisory.com | www.marketmindsadvisory.com

Purchase the full Micro-Mobility Charging Infrastructure Market Report (2026 to 2036).

The full report sizes the global micro-mobility charging infrastructure market to 2036 across six installation types and seven regions, measured on installed system and equipment revenue at supplier level. It treats fire regulation as the origin of the fastest-growing segment and maps indoor charging prohibitions by city. Competitive analysis covers 20 participants evaluated on installed system revenue, with moat and risk assessment for the two leaders. Demand is sized by funding source, separating building safety budgets from transport budgets, since the two buy for entirely different reasons. Four quantified revenue levers close the analysis.
Six-installation segment sizing with segment-level growth rates
Seven-region share and growth breakdown to 2036
Twenty-participant competitive map on one revenue basis
Demand sized by funding source rather than by application
Indoor charging prohibitions mapped city by city
Four quantified revenue levers with commercial impact ranges

Built For The People Who Decide

From boardroom strategy to bench-side execution, this report is read cover-to-cover by leaders shaping the next decade of their industry, turning demand scenarios, market dynamics and valuation benchmarks into decisions.
CXOs/ Presidents/ VPs/ Managers
M&A and Corporate Development
Strategy Teams and R&D Heads
Procurement and Product Directors
Regulatory and Compliance Leaders
Investor Relations and Equity Analysts