Market Minds Advisory
Micro Mobile Data Center Market

Micro Mobile Data Center Market: Micro Mobile Data Center Market. Trends and Forecast 2026 to 2036

Edge computing latency needs and 5G densification are pulling data center capacity out of hyperscale campuses into container-sized deployments at cell towers and factories, forcing vendors to prove thermal and security performance outside controlled facilities.

Lead Analyst

Published

September 2026

Make Smarter Decisions with Customized Research Insights

Request a free sample report and evaluate market opportunities, growth trends, and competitive dynamics relevant to your business needs.

2025 MARKET VALUE$6.8BMarket Size 2025
2036 FORECAST VALUE$24.8BBase Case , 2026 to 2036
CAGR 2026 TO 203612.5 %Bull 13.8% / Bear 11.2%
INCREMENTAL OPPORTUNITY$17.2BNet 10- year value creation
EXPANSION MULTIPLE3.25x2036 value over 2026 base
Strategic Levers
M&A Pipeline
Regional Outlook
Country Rankings
Competitive Intelligence
Segmental Deep-dive
Call-Us : 91 93563 13602

Executive Snapshot and Market Trajectory.

5G base stations and factory floors need compute placed very close to where data is actually being generated, and micro mobile data centers deliver that capability without the multi-year hyperscale build cycle traditional facilities still require today, arriving instead as a fully factory-built enclosure ready to power up on arrival.
Telecommunications operators and manufacturers are shifting capital from centralized cloud regions toward prefabricated, ruggedized enclosures that deploy in weeks rather than the eighteen months a traditional facility requires from permitting through commissioning and utility interconnection. Early demand concentrates in East Asia's dense 5G rollout markets and North America's industrial automation retrofits, where latency-sensitive applications cannot tolerate round trips to distant cloud regions.
Competitive character centers on thermal engineering and remote monitoring software rather than raw compute density, since these units run unattended in environments hyperscale operators never had to design equipment for previously. Regulatory pressure around data sovereignty is pushing some deployments toward local edge processing specifically to keep sensitive data within national borders rather than routing it continuously to distant cloud infrastructure, a constraint that varies considerably by jurisdiction and the specific workload type.
Market Definition
The Micro Mobile Data Center Market covers prefabricated, self-contained computing enclosures ranging from single-cabinet to shipping-container scale, including integrated power, cooling, and security systems designed for deployment outside traditional purpose-built data center facilities. It excludes hyperscale colocation campuses and standard server racks installed within existing conventional data center buildings.
Base Year Value
$6.8B in 2025 (MMA Primary Research Dataset, September 2026)
Forecast Period
2026 to 2036, eleven discrete annual values
CAGR
12.5% base case. Bull 13.8%. Bear 11.2%.
Fastest Growth Segment
Containerized Edge Micro Data Center Units: 17.5% CAGR
Fastest Growth Country
China: 14.5% CAGR
Fastest Growth Region
South Asia and Pacific: 14.5% CAGR
Largest Region
East Asia: 29% of 2025 global value
Market Leaders
Leading participants include Schneider Electric, Vertiv, Huawei, Rittal, and Eaton Corporation.
Primary Survey
n=3,800 procurement and R&D decision-makers, Q4 2025, six countries
Methodology
Demand-side build-up, cross-validated against public data, 47 expert interviews

Micro Mobile Data Center Market Forecast Scenarios

micro-mobile-data-center-market-size-forecast-scenario-1789996180759
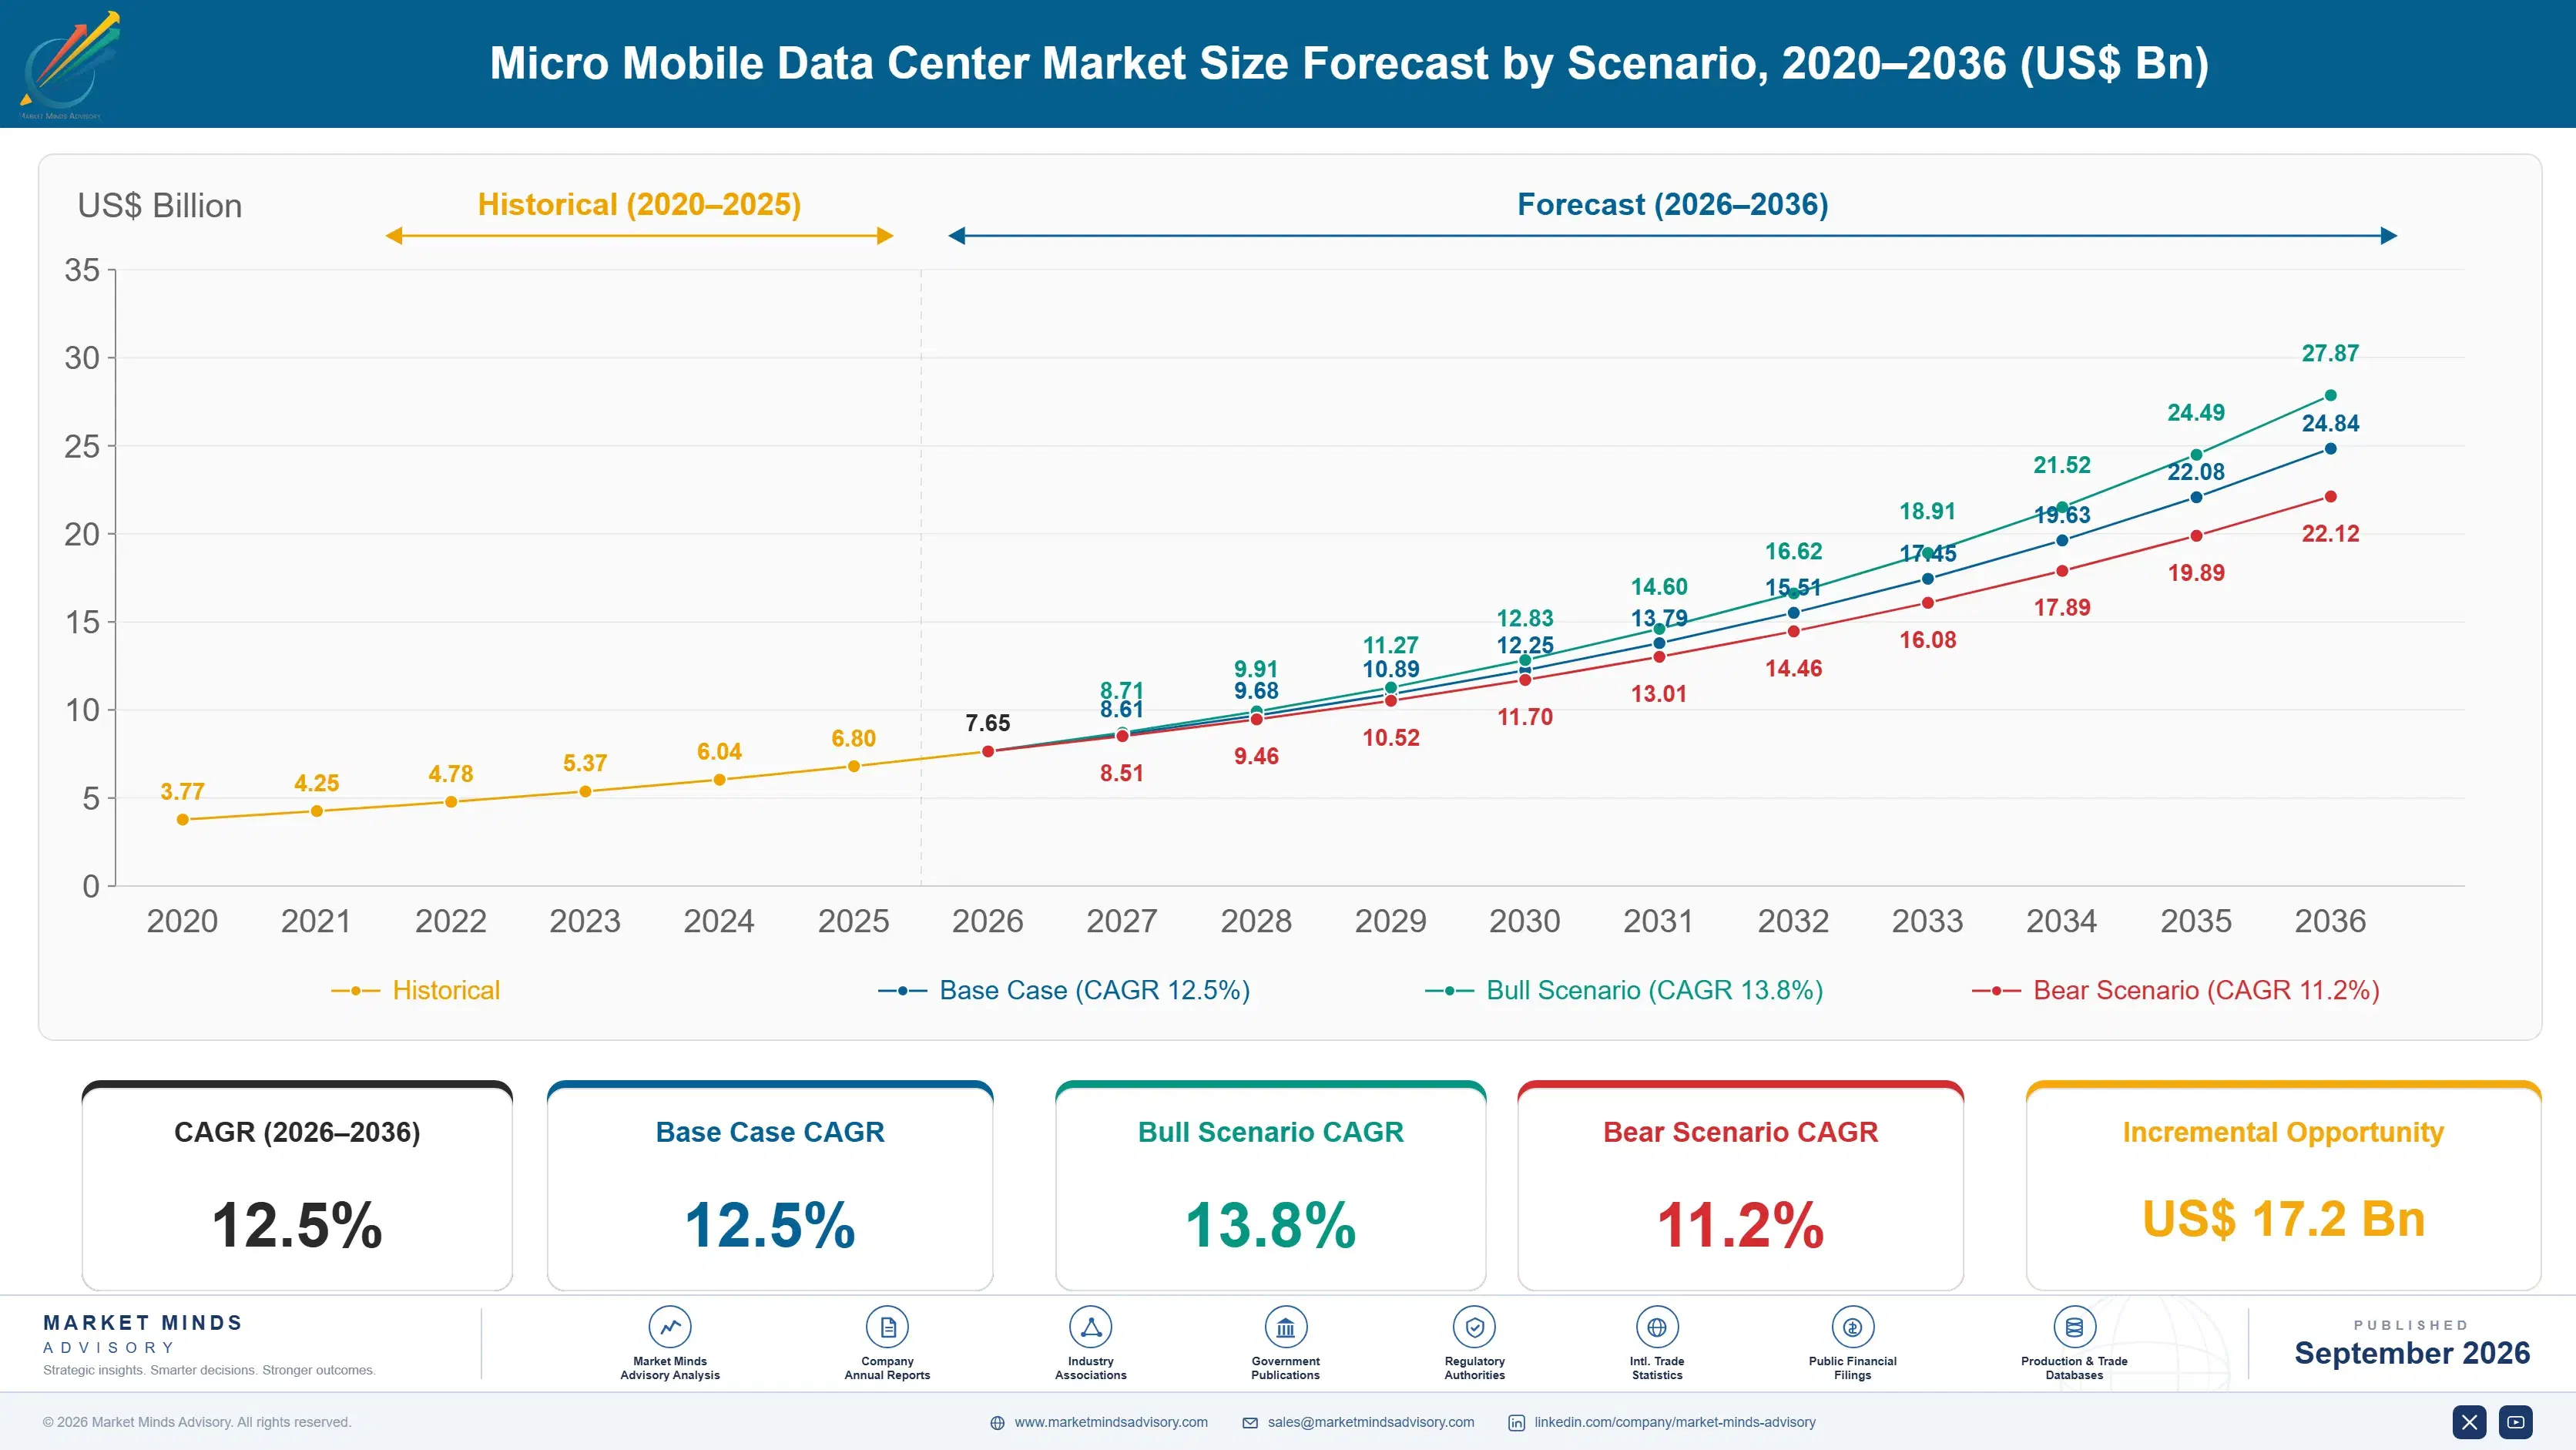
Between 2020 and 2025, demand grew steadily as telecom operators began piloting containerized edge sites ahead of nationwide 5G rollouts, though early deployments were limited by immature thermal and remote management designs that raised operating costs. Growth accelerated meaningfully toward the end of the period as manufacturing and retail customers joined telecom operators as buyers of standardized enclosures.
The base case assumes continued 5G densification, expanding industrial IoT deployment requiring local data processing, and growing enterprise adoption of edge computing to reduce cloud data transfer costs across geographically distributed operations. Telecom operators will keep expanding containerized sites at cell tower and central office locations, manufacturers will deploy factory-floor units for real-time production analytics, and retailers will adopt smaller cabinet-format units for point-of-sale and inventory processing at store level.
A bull scenario emerges if edge AI inference workloads scale faster than expected, pulling forward demand for locally-sited compute across every deployed vertical simultaneously and shortening replacement cycles. The bear risk is that centralized cloud providers extend low-latency network backbones far enough that the economic case for distributed micro data centers weakens meaningfully in cost-sensitive deployment scenarios.

Where Deployment Speed Beats Compute Density

Micro mobile data centers are converging two previously separate purchasing categories: telecom infrastructure and enterprise IT, as both buyer types now need compute deployed at the network edge rather than in a distant regional cloud facility that adds latency no application can afford to absorb any longer. Procurement decisions increasingly involve both network engineering and IT teams working from a shared specification rather than separate budgets.
MARKET CONCENTRATIONCR5 38%Top five vendors hold under half of revenue
AVERAGE UNIT PRICE$180,000Typical cost for a fully equipped cabinet unit
TOP PRODUCING COUNTRY SHARE27%China leads global containerized unit manufacturing output volume
CAPACITY UTILIZATION65-80%Typical compute load carried by deployed edge units
DEPLOYMENT LEAD TIME6-10 weeksTypical span from order placement to site activation
REPLACEMENT CYCLE LENGTH7-9 yearsAverage service life before a hardware refresh occurs
Vendors compete on deployment speed and remote manageability rather than raw server density, since these units run unattended for years in locations with no on-site technical staff and limited environmental control, a very different design constraint from anything hyperscale operators have historically had to engineer around. Remote diagnostics and predictive maintenance software have become as commercially important as the physical enclosure itself.
The next decade will be shaped by AI inference workloads moving toward the edge, national data sovereignty rules tightening across major economies, and telecom operators treating containerized compute as standard cell site infrastructure rather than a specialty purchase reserved for a handful of flagship locations. Standardization around common enclosure formats is beginning to lower integration costs across the industry.
"A micro data center that needs a truck roll every quarter isn't edge infrastructure, it's a liability someone forgot to budget for. The units that win are the ones nobody has to visit."
Director, Edge Infrastructure and Distributed Computing Practice · MMA Technology Practice · September 2026

Market Trends

Prefabricated Units Compress Deployment Timelines Sharply

Factory-assembled micro data centers arrive on site with power, cooling, and networking already integrated and fully tested, cutting deployment timelines from the twelve to eighteen months a purpose-built facility requires down to roughly six to ten weeks from order to activation. This compression matters most for telecom operators racing to light up 5G coverage ahead of competitors, since a faster activation schedule translates directly into earlier subscriber revenue. Manufacturers have responded by expanding standardized product lines rather than custom-engineering every deployment, further shortening lead times as production volume scales up.
Market Impact: Requires 10,000 new cell sites

Liquid Cooling Rapidly Enters Edge-Scale Deployments Now

Rising rack power density from AI inference workloads is pushing liquid cooling out of hyperscale data halls and into cabinet and container-scale units, since air cooling alone cannot dissipate heat from modern accelerator hardware packed into a small footprint. Vendors offering factory-integrated liquid cooling report supporting rack densities above thirty kilowatts, roughly triple what air-cooled edge units typically manage today. This capability has become a deciding factor for customers planning to run demanding AI inference workloads at edge locations rather than routing that traffic back to a centralized cloud region.
Market Impact: Supports over 50 production lines

Market Opportunities and Growth Drivers

5G Network Densification Drives Edge Site Buildout

Mobile carriers deploying dense 5G small cell networks need local compute at thousands of new cell sites to handle network functions that previously ran in centralized regional data centers, since 5G's latency targets cannot tolerate the round trip. Several national carriers have committed to activating more than ten thousand new cell sites over the next three years, each requiring some form of local edge compute capacity from a single server chassis to a full cabinet unit. This buildout pace creates sustained multi-year procurement volume that smooths demand across the forecast period rather than concentrating it in a single deployment wave.
Market Impact: Raises theft incidents 3 times higher

Manufacturing Automation Requires Local Real-Time Processing

Factory automation systems processing machine vision and robotics data cannot tolerate the latency of routing that data to a distant cloud region, pushing manufacturers to install ruggedized micro data centers directly on their production floors near the equipment they monitor. Automotive and electronics manufacturers have led early adoption, with several major plants reporting deployment of edge compute racks supporting real-time quality inspection across more than fifty production lines simultaneously. This shift is spreading to smaller manufacturers as unit prices fall and vendors offer pre-configured packages requiring minimal in-house networking expertise.
Market Impact: Adds 15 to 20% integration cost

Market Restraints and Challenges

Remote Sites Complicate Physical Security and Maintenance

Micro data centers placed at cell towers, factory floors, or retail back rooms lack the fencing, badge access, and on-site guards that protect hyperscale facilities, exposing them to theft and tampering risk operators never had to plan for. The root cause is that these deployments trade physical security for proximity, since a hardened perimeter facility defeats the purpose of placing compute at the edge. Operators report equipment theft incidents at unmonitored sites running several times higher than at traditional facilities, driving up insurance and replacement costs. Vendors are building tamper detection sensors directly into enclosure designs to offset this exposure.
Market Impact: Cuts deployment time to 8 weeks

Fragmented Industry Standards Slow Multi-Vendor Interoperability Efforts

No single industry standard governs enclosure dimensions, power connectors, or remote management software across micro data center vendors, forcing customers deploying at scale to either commit to one vendor's proprietary platform or manage several incompatible management systems simultaneously. The underlying cause is that the category grew out of several adjacent industries, telecom shelters, industrial enclosures, and IT racks, each bringing its own legacy specifications rather than converging on a shared standard. This fragmentation adds integration cost estimated at fifteen to twenty percent above hardware price for large rollouts. Industry groups have begun drafting common interface specifications, though adoption remains inconsistent.
Market Impact: Supports rack densities above 30 kilowatts
3 additional market trends, 4 additional growth drivers, and 2 additional restraints and challenges are covered in the full report. Contact sales@marketmindsadvisory.com to access the complete intelligence.

Segment CAGR and Growth Architecture

Micro mobile data centers segment by physical form factor, the dimension that determines deployment speed, site requirements, and target buyer more directly than any other classification available in this market today. Containerized and cabinet-enclosed units are pulling ahead as 5G and industrial customers prioritize rapid, standardized deployment over custom engineering approaches for every new site.
micro-mobile-data-center-market-market-share-analysis-1789996181305

Containerized Edge Micro Data Center Units

Containerized edge micro data center units, built from standard shipping-container dimensions, pack integrated power distribution, cooling, and fire suppression into a single factory-tested enclosure that ships ready to connect to utility power and fiber. Telecom operators favor this format for larger cell sites and regional aggregation points where compute demand exceeds what a single cabinet can support, while data center operators use containerized units for rapid capacity expansion adjacent to existing facilities without a multi-year construction permit process. Falling steel and component costs have pushed unit prices down by roughly eighteen percent over three years, pulling this format into mid-size deployments that previously defaulted to smaller cabinet units, and making it the fastest-growing format in the market.
CAGR 17.5%

Cabinet and Rack-Enclosed Micro Data Center Units

Cabinet and rack-enclosed micro data center units house a smaller footprint of servers, networking, and cooling within a single sealed cabinet designed to sit indoors or in a lightly protected outdoor shelter close to the point of use. Retailers and manufacturers favor this format for point-of-sale processing, inventory systems, and localized production analytics where full containerized capacity would be unnecessary and cost-prohibitive for the application at hand and the available budget. Vendors have improved cabinet-scale cooling substantially over the past several years, enabling much higher-density hardware including AI inference accelerators that previously required container or full-room installations, a capability upgrade that has made this the second-fastest-growing format in the entire category.
CAGR 15.0%
Full segment breakdown across 6 segments available in the complete report.

Regional Architecture and Country Demand Map

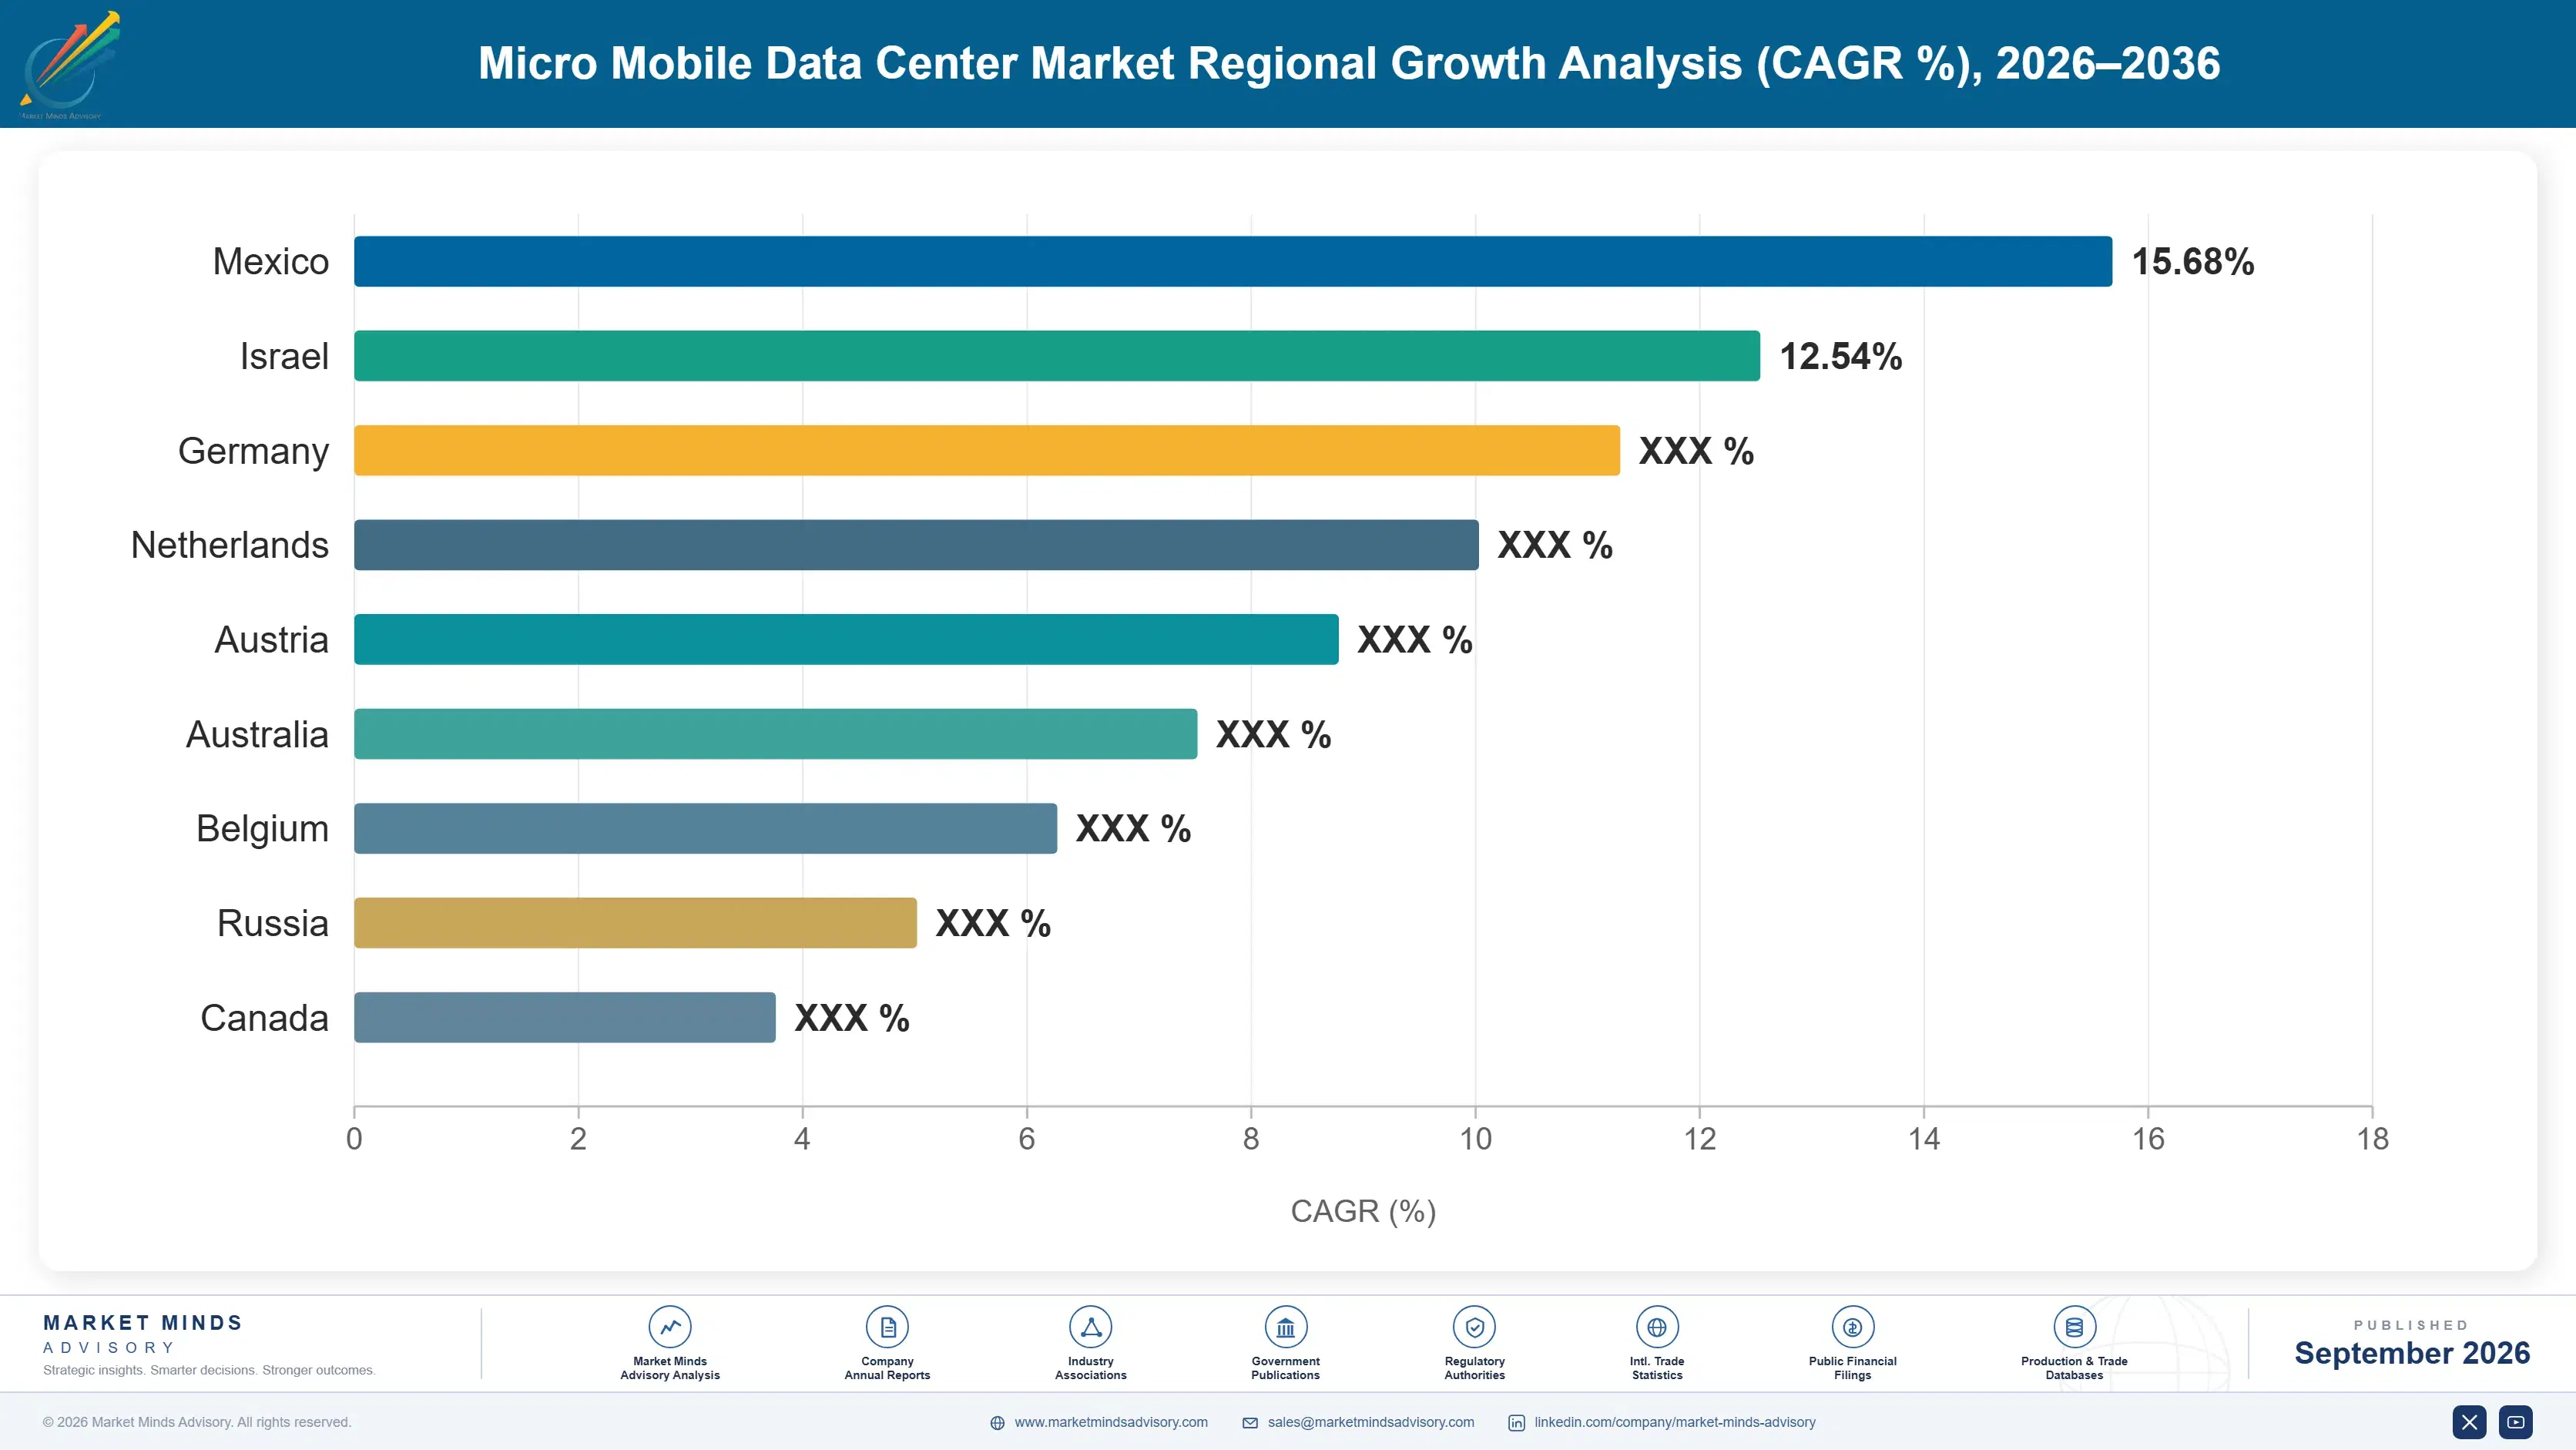
Demand concentrates where 5G network buildout intensity and manufacturing automation scale intersect most directly across the global market. East Asia leads on both containerized unit production and 5G deployment density, while North America follows closely on industrial edge computing, hyperscale-adjacent expansion capital, and telecom operator investment.

North America

Industrial edge computing and hyperscale-adjacent capacity expansion anchor demand growth across North America. United States telecom carriers are activating 5G small cells in dense urban corridors where fiber backhaul is expensive, making local edge compute a cost-effective alternative to centralized processing. Manufacturing plants across the automotive and aerospace sectors have adopted ruggedized micro data centers for real-time robotics and quality control applications on the factory floor. Canada's resource extraction industry, particularly mining and oil and gas, has deployed remote edge compute at sites lacking reliable fiber connectivity. Cloud hyperscalers based in the region also use micro data centers as staging infrastructure ahead of full regional data center construction, reinforcing North America's position as an early adopter.
Share: 27% | CAGR: 13.0% (2026 to 2036)

Western Europe

Regulatory pressure around data sovereignty and energy efficiency shapes demand growth across Western Europe more directly than in most other regions. Germany's automotive manufacturing sector leads adoption of factory-floor edge compute tied to Industry 4.0 modernization programs, while the Nordics prioritize energy-efficient designs suited to their carbon reduction commitments and cold-climate cooling advantages. France and the United Kingdom drive telecom-sector demand as national operators complete 5G coverage in secondary cities beyond initial metropolitan rollouts. The European Union's data localization requirements have pushed several cloud providers toward edge processing architectures that keep data within national borders, a compliance driver now treated as a baseline design requirement across the region's enterprise deployments.
Share: 20% | CAGR: 11.0% (2026 to 2036)
Regional intelligence for 5 additional markets available in the complete report: East Asia, South Asia and Pacific, Latin America, Middle East and Africa, Eastern Europe. Contact sales@marketmindsadvisory.com.
micro-mobile-data-center-market-country-cagr-analysis-1789996181846

Where Micro Data Center Vendors Capture Margin

Hardware alone commoditizes very quickly as enclosure manufacturing scales globally worldwide, so the durable margin pools sit in remote management software, installation services, and long-term maintenance contracts rather than in the physical unit itself. Vendors combining hardware with a recurring service layer earn disproportionate value relative to their unit shipment share across this market.

Bundling Remote Monitoring Software Subscription Tiers

Vendors that ship a proprietary remote monitoring and predictive maintenance platform alongside the physical enclosure capture a recurring per-site subscription fee that hardware sales alone cannot generate, converting a one-time equipment purchase into a multi-year service relationship with the customer base. Customers accept the added cost because in-house monitoring infrastructure requires dedicated staff and software licensing costs that few edge deployments can justify independently on their own. Several vendors have raised blended contract values by 25 percent after introducing tiered monitoring subscriptions, since software margin runs far above enclosure manufacturing margin.
Market Impact: Raises blended contract values by 25 percent overall

Offering Turnkey Installation and Site Commissioning

Customers deploying at scale across dozens or hundreds of sites lack the specialized crews needed for electrical, networking, and thermal commissioning work, creating an opening for vendors to sell turnkey installation as a paid service layered on top of the hardware sale itself. Vendors offering in-house commissioning teams report capturing contracts worth an additional 18 percent of hardware value per site, since customers avoid coordinating multiple third-party contractors across a distributed rollout. This installation service margin runs well above hardware margin and deepens the customer relationship ahead of future contract renewals.
Market Impact: Adds roughly 18% of hardware value per site

Selling Multi-Year Maintenance and Parts Contracts

Unattended edge sites require preventive maintenance visits and rapid parts replacement to avoid extended downtime, an operational burden most telecom and manufacturing customers prefer to outsource rather than staff internally. Vendors bundling multi-year maintenance contracts alongside the initial hardware sale report contract values running 30 percent above hardware price alone across a typical five-year term, capturing recurring revenue that continues well after the original equipment sale closes. This lever works best with customers operating more than 20 sites, where the economics of outsourced maintenance clearly beat building an internal field service team.
Market Impact: Adds roughly 30 percent to a five-year contract

Offering Capacity-as-a-Service Consumption Financing Payment Options

Customers hesitant to commit large upfront capital for edge infrastructure increasingly prefer a consumption-based payment model, opening a financing-driven revenue stream for vendors willing to retain ownership of the hardware and charge a monthly fee tied to compute capacity used. Vendors offering this model report average deal sizes 40 percent larger than upfront purchase contracts, since customers commit to longer terms once the capital barrier is removed from the purchasing decision entirely. This approach works particularly well with retail and hospitality customers managing tight capital budgets across many small sites simultaneously.
Market Impact: Grows average deal size by 40 percent overall

Who Controls the Margin Pool

Micro mobile data centers show moderate fragmentation with a CR5 of thirty-eight percent, reflecting a market that grew out of adjacent industries rather than a single established leader. Schneider Electric and Vertiv lead on revenue given their broad power and cooling equipment portfolios, holding a meaningful gap over challengers such as Rittal and Eaton Corporation, whose narrower product lines limit cross-sell opportunities into adjacent facility infrastructure.
Current competitive activity centers on software differentiation, as hardware vendors race to build remote monitoring platforms that lock in multi-year service contracts rather than competing purely on enclosure specifications. Several vendors have also launched pre-configured product lines targeting specific verticals such as telecom or manufacturing, reducing customization time and building deeper account relationships with repeat buyers across large multi-site rollouts.

Emerging pressure comes from telecom equipment makers that could bundle edge compute directly into their existing radio access network hardware, potentially squeezing standalone micro data center vendors out of the telecom segment specifically. Rankings are most likely to shift among mid-tier challengers, where signing one large telecom framework agreement can move a vendor from a regional player into a global top-tier competitor within a single product cycle.
micro-mobile-data-center-market-company-positioning-matrix-1789996182393

Competitive Moat and Risk Dimensions

SCHNEIDER ELECTRIC

Moat: Broad Power and Cooling Portfolio

Schneider Electric's existing power distribution and cooling equipment business gives it a cross-sell advantage that pure-play enclosure vendors cannot match, letting it bundle micro data center units with uninterruptible power supplies and building management systems customers already purchase. This breadth also gives Schneider global service coverage few standalone vendors can replicate at comparable scale.
SCHNEIDER ELECTRIC

Risk: Slower Product Cycle Speed

Schneider's large organizational structure and broad product portfolio can slow decision-making on new form factors compared to smaller, more focused competitors chasing the latest thermal or software innovation. A nimble challenger that ships a superior liquid-cooled unit first could capture design wins before Schneider's product roadmap catches up to emerging AI workload requirements.
HUAWEI

Moat: Telecom Equipment Distribution Reach

Huawei's existing telecom equipment relationships across Asia, Africa, and parts of Europe give it direct access to carrier procurement decisions that independent micro data center vendors must win through separate sales channels. This distribution reach lets Huawei bundle edge compute directly into broader network infrastructure contracts.
HUAWEI

Risk: Geopolitical Trade Restriction Exposure

Huawei faces ongoing restrictions on selling telecom and networking equipment in the United States and parts of Europe over national security concerns, cutting it off from two of the largest markets for micro data center deployment. This exposure could deepen further if additional governments restrict Huawei-sourced network infrastructure procurement.

Players Tracked

Prominent Players

Schneider Electric
Vertiv
Huawei
Rittal
Eaton Corporation

Other Key Players

Hewlett Packard Enterprise
Dell Technologies
Cisco Systems
Delta Electronics
Legrand
STULZ
Zella DC
Cannon Technologies
Panduit
nVent Electric
IceoTope
EdgeConneX
Compass Datacenters
Hitachi Vantara
Fujitsu

Recent Developments

FEBRUARY 2026

Vertiv Acquires Liquid Cooling Specialist for Edge Units

Vertiv acquired a privately held liquid cooling technology developer to add high-density thermal management capability to its micro data center line, integrating the firm's cold plate and rear-door heat exchanger designs into upcoming cabinet and container products. The deal gives Vertiv in-house liquid cooling expertise previously sourced through partnerships.
Signal: Signals thermal management becoming a core competitive battleground rather than merely a peripheral hardware feature entirely.
SEPTEMBER 2025

Schneider Electric Signs Multi-Year Telecom Supply Agreement

Schneider Electric and a major North American telecom carrier signed a multi-year supply agreement covering containerized edge compute units for the carrier's ongoing 5G small cell densification program across dense urban markets nationwide. The agreement locks in guaranteed production volume for Schneider Electric through 2029.
Signal: Shows large telecom carriers securing multi-year hardware supply well ahead of planned network buildout schedules entirely.
NOVEMBER 2025

Rittal Expands Manufacturing Capacity for Cabinet Units

Rittal expanded its organic manufacturing capacity for cabinet-enclosed micro data center units by opening a new production line dedicated entirely to pre-configured retail and manufacturing packages, responding to rising customer demand for much faster delivery than custom-engineered orders typically allow across most served regions today.
Signal: Reflects growing customer demand for standardized, faster-delivery units over custom-engineered configurations requiring much longer lead times.

Steel and Power Electronics Cost Exposure

Steel enclosure fabrication and power electronics together account for roughly fifty percent of a micro data center's bill of materials, with cooling systems adding another twenty percent. Steel is sourced largely from domestic mills in each deployment region, while power electronics components draw heavily on Southeast Asian and Chinese semiconductor supply chains regardless of final assembly location.
The clearest recent volatility event traces to the 2022 to 2023 global steel price surge following energy cost increases in Europe, a dynamic documented in the International Energy Agency's tracking of industrial energy costs tied to that period's broader disruption. Enclosure manufacturers absorbed cost increases of roughly twenty percent during peak pricing before passing a portion through to customers, delaying several planned price increases by two to three quarters while vendors worked through existing steel inventory.

This exposure disadvantages smaller regional manufacturers more than the largest global vendors, since companies like Schneider Electric and Vertiv negotiate steel and component pricing across diversified global supply agreements that smooth regional price spikes. Vendors sourcing steel entirely from a single domestic mill face sharper margin swings during regional shocks, a gap that widens whenever energy costs or trade tariffs move unpredictably.
micro-mobile-data-center-market-cost-volatility-analysis-1789996182592

Diversify Steel Sourcing Across Multiple Mills

Manufacturers are qualifying steel suppliers across multiple regions rather than relying on a single domestic mill, spreading exposure to any one region's energy cost spikes or trade disruptions across the wider supply base. This adds supplier qualification cost upfront but has shortened recovery time during regional price shocks and given procurement teams stronger negotiating leverage overall.

Lock In Multi-Year Component Pricing Agreements

Larger vendors are signing multi-year pricing agreements directly with power electronics suppliers to smooth cost volatility across annual budget cycles, trading some near-term flexibility for much greater long-term predictability in planning. Smaller manufacturers without comparable purchasing volume increasingly join buying consortiums to access similar pricing stability collectively across the wider industry as a whole.

Redesign Enclosures Around Lighter Alternative Materials

Engineering teams are testing aluminum and composite alternatives to steel for non-structural enclosure panels, reducing exposure to steel-specific price swings while also cutting overall shipping weight considerably across most product lines. This material substitution adds development cost but has already lowered bill-of-materials exposure to any single commodity category for several vendors testing the approach.

Portfolio Architecture for Margin Defence

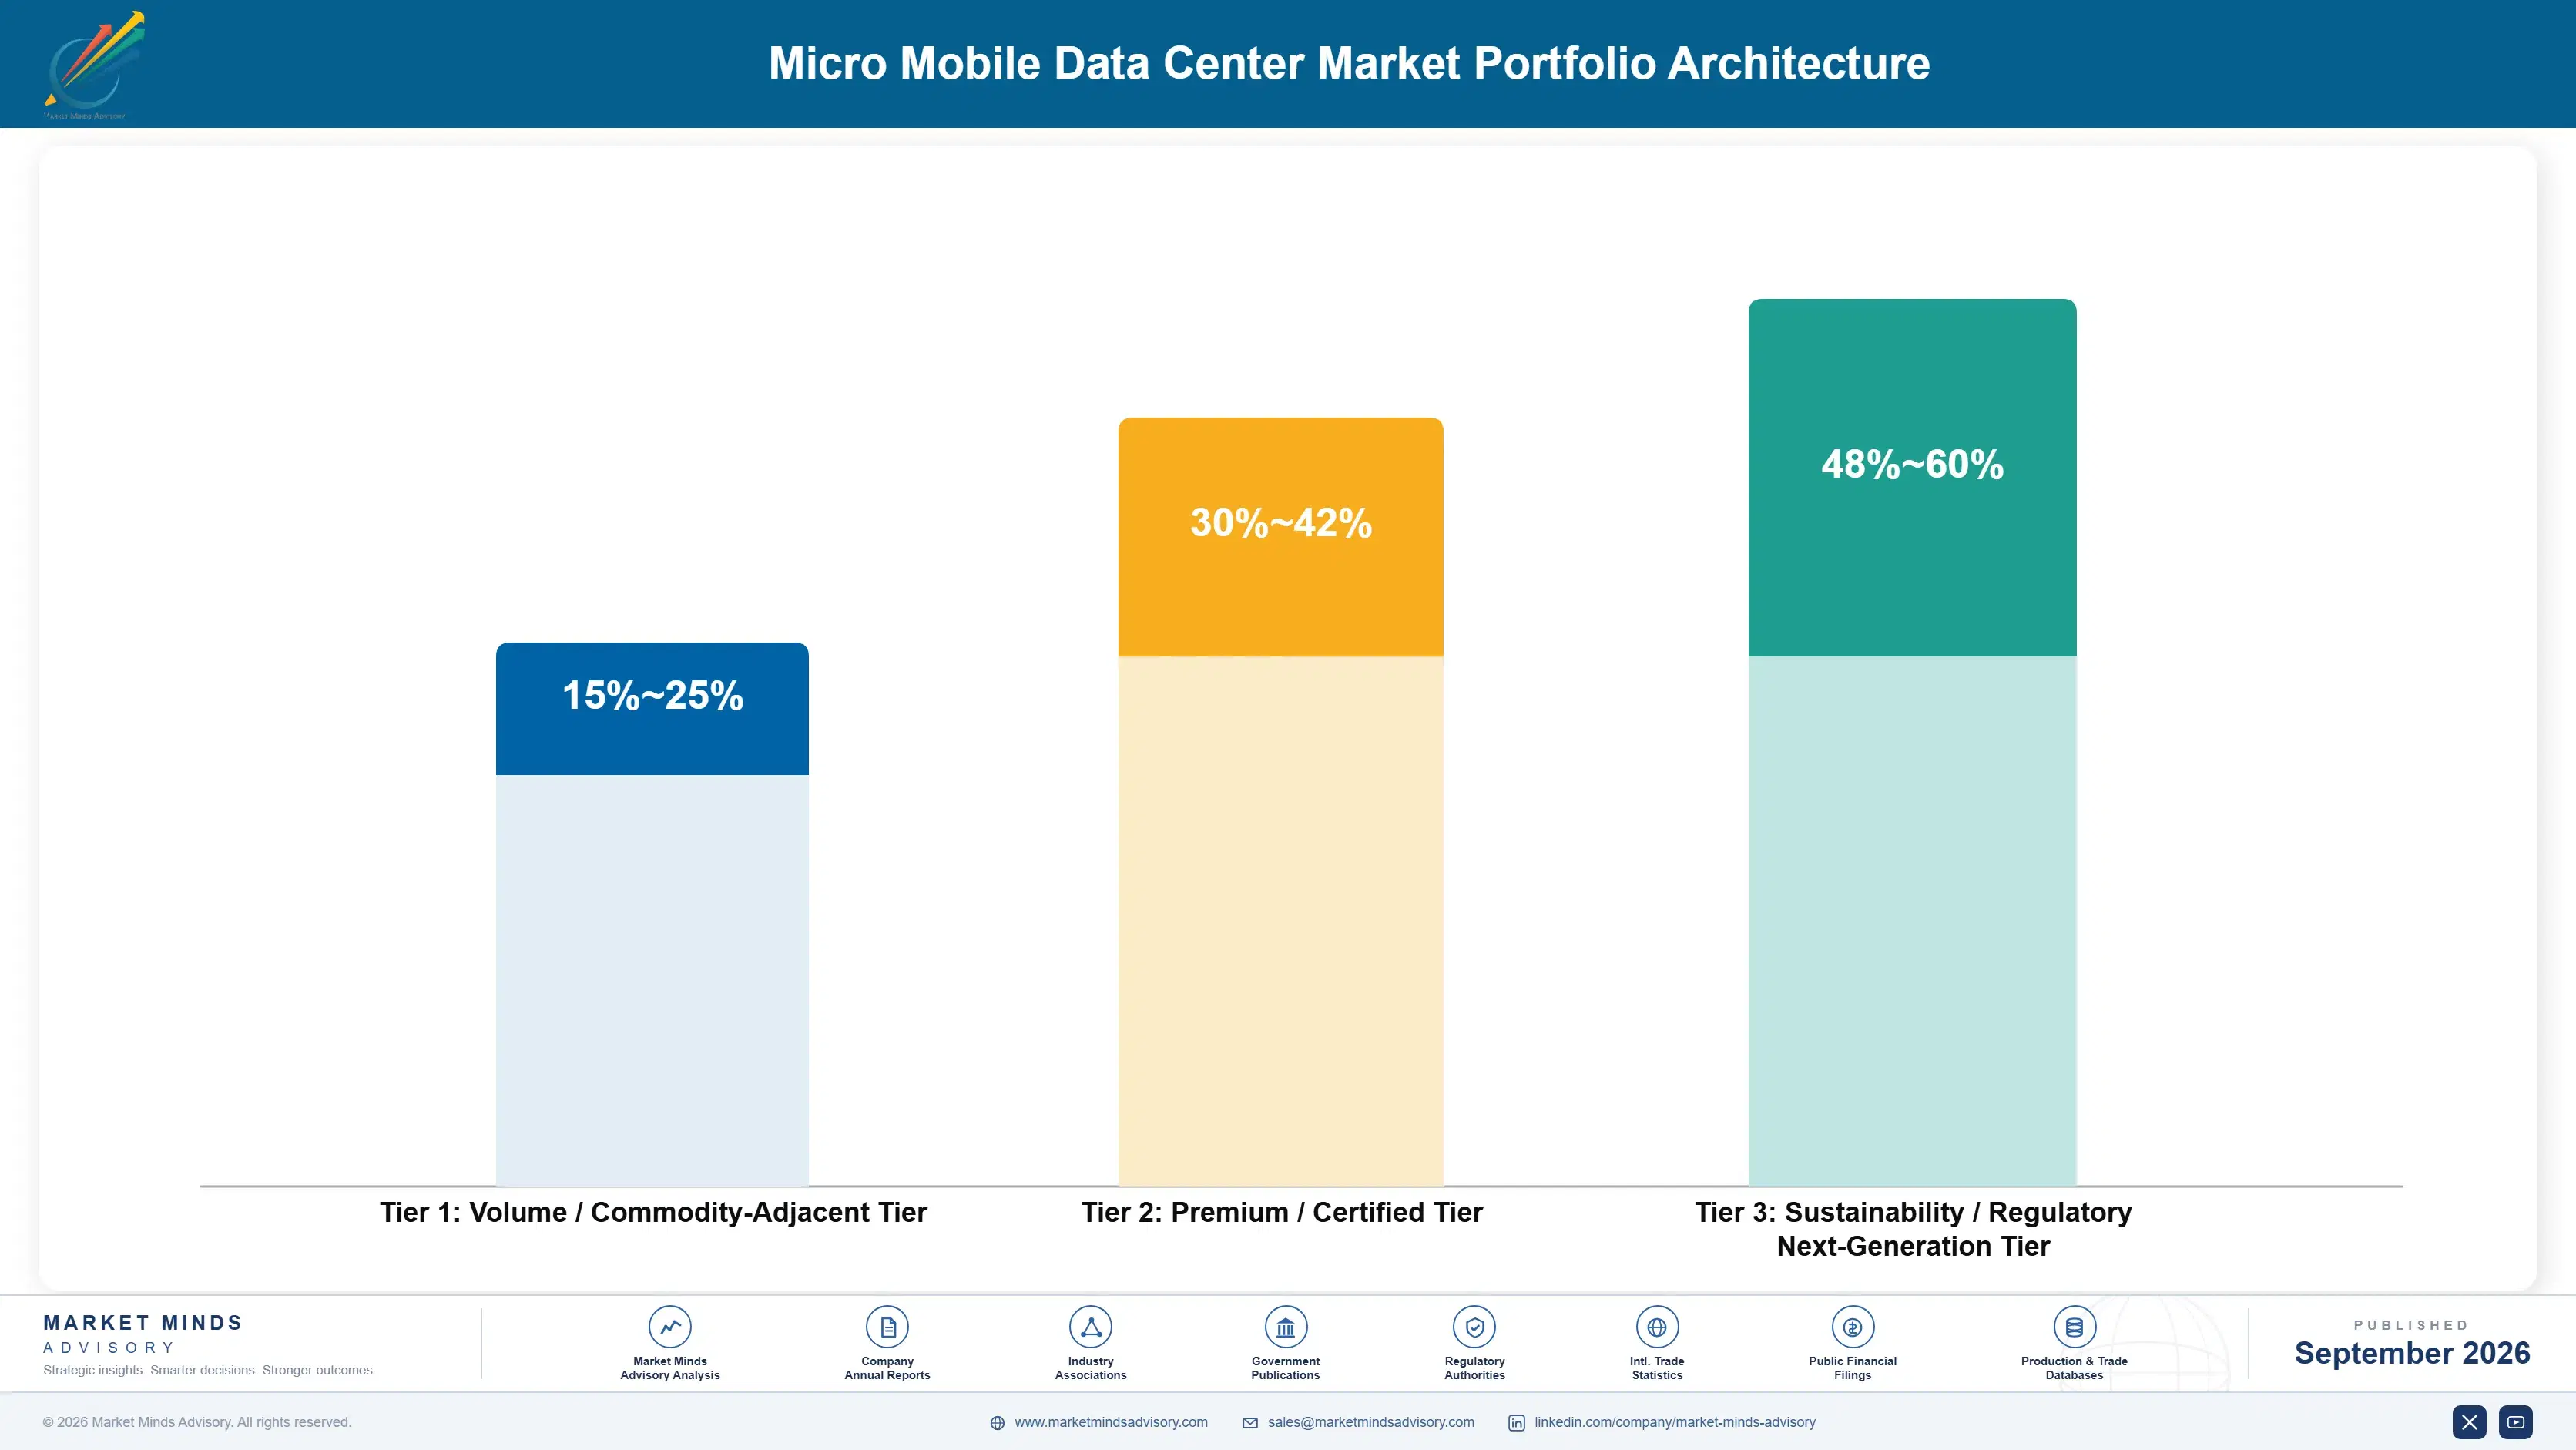
Micro mobile data center portfolios split into three margin tiers tracking how customized and service-attached each product line is relative to a standardized commodity enclosure sold at scale. Volume commodity-adjacent cabinet units carry thin margins driven by manufacturing scale competition among many suppliers, while certified premium containerized units command a markup tied to thermal performance guarantees and telecom-grade certification standards demanded by carrier customers.
The volume versus premium tension appears most clearly in how vendors allocate manufacturing capacity across competing product families: chasing high-volume telecom cabinet orders requires aggressive cost reduction that can erode the margin structure supporting premium containerized and liquid-cooled product lines simultaneously. Vendors trying to serve both ends with a single manufacturing line typically end up uncompetitive in each segment they attempt to serve.

High-value margin pools concentrate in software-attached service contracts and liquid cooling capability rather than in the base enclosure itself, which explains why the fastest-growing revenue lines sit closer to AI workload support than to standard telecom deployments. Vendors positioning purely as commodity cabinet manufacturers face the steepest long-term margin compression as enclosure manufacturing scales globally across every producing region.

Volume / Commodity-Adjacent Tier

Standardized cabinet units sold into retail and small-manufacturer applications, priced on unit cost competition with gross margins typically in the fifteen to twenty-five percent range across most suppliers in the category.
Gross Margin: 15-25%

Premium / Certified Tier

Containerized units carrying telecom-grade or industrial certification, sold at a premium for documented thermal reliability and remote management capability, with gross margins running thirty to forty-two percent for certified vendors.
Gross Margin: 30-42%

Sustainability / Regulatory / Next-Generation Tier

Liquid-cooled, software-attached platforms supporting AI inference workloads and multi-year service contracts, carrying the highest margins in the entire portfolio at forty-eight to sixty percent gross margin across nearly every deployed configuration.
Gross Margin: 48-60%
micro-mobile-data-center-market-portfolio-architecture-1789996183092

High-value Sub-segments and Strategic Watch-out

Containerized Edge Units (5G and Industrial)

Containerized edge units for 5G small cell and industrial deployment, combining the fastest unit growth with the highest software-attachment margins in the portfolio, a rare pairing that makes this segment the priority allocation target for most vendors' manufacturing investment over the coming several years ahead.
Gross Margin: 35-48%

Cabinet Units (Retail and Factory-Floor)

Cabinet units for retail and factory-floor applications, growing quickly on falling AI accelerator costs but facing a longer sales cycle tied to multi-site rollout planning that slows large enterprise procurement decisions somewhat more than typical telecom orders require to close out fully and completely each time.
Gross Margin: 28-38%

Standard Telecom Cell Site Cabinets (Volume Core)

Standard telecom cell site cabinet installations, the largest installed base and steadiest cash generator in the category even as unit pricing declines gradually and margins compress each successive year across nearly every producing region worldwide over the entire forecast horizon and well beyond that too.
Gross Margin: 15-22%

Portable Trailer-Mounted Units (Strategic Watch)

Portable trailer-mounted deployable units for disaster recovery and temporary event capacity, a niche segment facing uncertain long-term demand, worth monitoring closely for whether utilities and emergency agencies choose to expand standing contracts over the next several forecast years well ahead of schedule considerably and consistently.
Gross Margin: 18-28%

Edge Contracts Run on Multi-Year Terms

Micro data center contracts increasingly behave like annuities rather than one-time equipment purchases, since telecom framework agreements and manufacturing site rollouts lock in multi-year procurement commitments tied to a broader network or facility expansion plan rather than a single order. A vendor that wins a telecom framework agreement can expect several years of recurring unit orders as the carrier activates new sites under the same contract.
Adoption depth varies sharply by end-use vertical: telecom operators treat edge compute as core network infrastructure with near-universal deployment across new cell sites, while manufacturing adoption remains uneven, concentrated in automotive and electronics plants but still largely absent from smaller factories where capital budgets rule out anything beyond basic connectivity. Retail adoption sits between these extremes, growing steadily as point-of-sale digitization spreads across store formats.

Buyer profiles are shifting generationally as procurement decisions move from facilities and network engineering teams toward IT and digital transformation leaders who evaluate edge compute alongside cloud strategy and data governance criteria rather than power and cooling specifications alone. This shift favors vendors that can demonstrate software integration and remote management capability over those competing purely on enclosure engineering credentials.
micro-mobile-data-center-market-end-use-penetration-index-1789996183587

Where the Real Margin Sits

These are among the four positions where our research anticipates prominent divergence between winners and laggards over the coming forecast period. Each is grounded in the demand model, the regulatory perimeter, and the announced capacity pipeline.
01 / PRODUCT FORM FACTOR PRIORITY

Prioritize Containerized Units Over Cabinet-Only Lines

Vendors concentrating engineering investment on containerized edge units are positioned ahead of the market's fastest-growing format, expanding at seventeen and a half percent annually against a twelve and a half percent market average overall. Containerized units capture both large telecom regional aggregation demand and industrial expansion projects that cabinet-only product lines simply cannot address effectively. Companies that keep treating containerized units as a niche extension of their cabinet business risk ceding the fastest-growing accounts to competitors building purpose-designed container platforms.
02 / SOFTWARE AND SERVICE ATTACH

Attach Remote Monitoring Software to Every Sale

Pure hardware vendors face relentless price competition as enclosure manufacturing scales globally across nearly every producing region worldwide, while software-attached offerings command the highest margins found anywhere across this entire portfolio today. Bundling a proprietary remote monitoring and predictive maintenance platform converts a one-time equipment sale into a recurring subscription tied to every unit deployed across a customer's entire site portfolio. Vendors that delay this transition will find themselves competing purely on steel and component cost against lower-margin manufacturing-scale competitors.
03 / LIQUID COOLING CAPABILITY INVESTMENT

Build Liquid Cooling Capability Ahead of AI Demand

AI inference workloads moving to the edge require rack densities air cooling alone simply cannot support, and vendors without liquid cooling capability will lose these valuable design wins to competitors who have already made the engineering investment required. Building this capability in-house or through acquisition supports rack densities above thirty kilowatts, roughly triple what conventional air-cooled edge units manage today. This investment pays back fastest with telecom and industrial customers running the most demanding compute workloads at the network edge.
04 / SUPPLY CHAIN DIVERSIFICATION PLANNING

Diversify Steel and Component Sourcing Regionally

Steel and power electronics costs concentrate heavily in regional mills and Asian semiconductor supply chains, leaving vendors exposed to the same volatility that produced twenty percent cost spikes during the recent steel price surge across Europe. Qualifying suppliers across multiple regions adds upfront verification cost but shortens recovery time substantially when the next regional disruption occurs. Vendors treating this diversification as optional rather than mandatory will keep losing margin to competitors who can absorb the next price shock more smoothly.

Engagement Snapshot From the Field

A live engagement with an industry participant carrying material or product regulatory and market exposure ahead of a defining policy shift, showing how our research translates into a defensible multi-year portfolio strategy.
MARKET MINDS ADVISORY · CLIENT ENGAGEMENT SUMMARY
Micro Mobile Data Center Producer Strategic Portfolio Review and Transition Roadmap 2026·Investment Scenario on Micro Mobile Data Center Exposure Evaluation 2025-26
CLIENT PROFILE
The client is a regional telecom carrier with roughly 2.1 billion dollars in annual revenue (client-reported, unverified by MMA), operating across a mid-size national market undergoing aggressive 5G small cell rollout. The carrier had relied on centralized regional data centers for network functions but faced mounting latency complaints as subscriber density increased in dense urban corridors. Leadership sought an independent assessment of edge compute deployment options before committing capital.
STRATEGIC CHALLENGE
The carrier faced rising latency-related churn in its densest urban markets while lacking internal expertise to evaluate competing micro data center vendors and form factors. Network engineering and IT procurement teams disagreed on whether to standardize on containerized or cabinet-format units, and the board wanted a data-driven recommendation before a planned capital allocation decision.
MMA APPROACH
MMA conducted structured interviews with the carrier's network engineering leadership alongside its own primary survey and expert interview datasets to benchmark deployment timelines and total cost of ownership across leading vendors. The analysis mapped latency-sensitive coverage gaps against candidate site locations to prioritize which cell sites needed edge compute first.
KEY FINDINGS
  1. Cabinet-format units proved sufficient for eighty percent of identified sites, reserving costlier containerized units for only the highest-density urban locations requiring additional compute capacity.
  2. Vendors offering bundled remote monitoring software reduced projected field service visits by roughly 35 percent compared to hardware-only vendors evaluated during the same procurement process.
  3. Standardizing on a single vendor's cabinet platform across all identified sites was projected to lower per-unit procurement cost by approximately 12 percent through volume commitment pricing.
  4. Latency-sensitive churn in the carrier's three densest markets was traced directly to backhaul distance rather than radio access network capacity, confirming edge compute as the correct remedy.
CLIENT PROFILE
The client is a regional telecom carrier with roughly 2.1 billion dollars in annual revenue (client-reported, unverified by MMA), operating across a mid-size national market undergoing aggressive 5G small cell rollout. The carrier had relied on centralized regional data centers for network functions but faced mounting latency complaints as subscriber density increased in dense urban corridors. Leadership sought an independent assessment of edge compute deployment options before committing capital.
STRATEGIC CHALLENGE
The carrier faced rising latency-related churn in its densest urban markets while lacking internal expertise to evaluate competing micro data center vendors and form factors. Network engineering and IT procurement teams disagreed on whether to standardize on containerized or cabinet-format units, and the board wanted a data-driven recommendation before a planned capital allocation decision.
MMA APPROACH
MMA conducted structured interviews with the carrier's network engineering leadership alongside its own primary survey and expert interview datasets to benchmark deployment timelines and total cost of ownership across leading vendors. The analysis mapped latency-sensitive coverage gaps against candidate site locations to prioritize which cell sites needed edge compute first.
KEY FINDINGS
  1. Cabinet-format units proved sufficient for eighty percent of identified sites, reserving costlier containerized units for only the highest-density urban locations requiring additional compute capacity.
  2. Vendors offering bundled remote monitoring software reduced projected field service visits by roughly 35 percent compared to hardware-only vendors evaluated during the same procurement process.
  3. Standardizing on a single vendor's cabinet platform across all identified sites was projected to lower per-unit procurement cost by approximately 12 percent through volume commitment pricing.
  4. Latency-sensitive churn in the carrier's three densest markets was traced directly to backhaul distance rather than radio access network capacity, confirming edge compute as the correct remedy.
RECOMMENDED STRATEGY
Phase 1: Phase 1 (Pilot Deployment): Deploy cabinet units at the ten highest-latency sites within six months to validate vendor performance claims. Phase 2: Phase 2 (Standardization): Standardize procurement on the selected vendor's cabinet platform across all remaining identified sites over the next eighteen months. Phase 3: Phase 3 (Software Attach): Layer remote monitoring software across the full deployed fleet to reduce ongoing field service visit frequency.
OUTCOME
The carrier completed pilot deployment at ten sites within five months and reported a measurable reduction in latency-related customer complaints in those markets (client-reported, unverified by MMA). The carrier subsequently committed to a three-year rollout across an additional 240 sites using the standardized vendor platform recommended.

Frequently Asked Questions

Foundational context covering the market sizes, CAGR, scope, country, region and competition that inform every finding below. This section is provided to cover basics and most often pre-purchase conversations, answered from the MMA Primary Research Dataset.

What is the current size of the Micro Mobile Data Center Market?

The Micro Mobile Data Center Market is valued at 6.8 billion dollars in 2025, the base year for this analysis. It is projected to reach 7.65 billion dollars in 2026 as 5G and edge computing deployment accelerates.

How large will the Micro Mobile Data Center Market be by 2036?

The market is forecast to reach 24.84 billion dollars by 2036, up from 7.65 billion dollars in 2026. This represents a 3.25 times expansion over the ten-year forecast period.

What is the CAGR for the Micro Mobile Data Center Market 2026 to 2036?

The market is projected to grow at a compound annual growth rate of 12.5 percent between 2026 and 2036. Bull and bear scenarios range from 13.8 percent to 11.2 percent depending on 5G rollout pace.

Which segment is growing fastest?

Containerized Edge Micro Data Center Units is the fastest-growing segment, expanding at 17.5 percent annually, 1.4 times the overall market rate. Falling component costs are pulling this format into mid-size deployments across telecom and industrial sites.

Who are the major companies in the Micro Mobile Data Center Market?

Leading participants include Schneider Electric, Vertiv, Huawei, Rittal, and Eaton Corporation. These five companies hold a combined CR5 of 38 percent, reflecting a moderately fragmented competitive landscape.

Which country is growing fastest?

China is the fastest-growing country, expanding at 14.5 percent annually as domestic telecom operators and manufacturers integrate containerized edge compute at rising volume. This outpaces the broader East Asia regional average.

Report Segmentation Architecture

The full report scope spans multiple orthogonal segmentation dimensions, with cross-tabulated demand data provided for each dimension pair. Coverage extends further to regional breakdowns, trend trajectories, and the competitive detail needed to support segment-level decision-making.

By Product Form Factor

  • Containerized Edge Micro Data Center Units
  • Cabinet and Rack-Enclosed Micro Data Center Units
  • All-in-One Skid-Mounted Modular Units
  • Remote Monitoring and Management Software
  • Portable Trailer-Mounted Deployable Units
  • Installation and Maintenance Services

By End-Use Industry

  • Telecommunications
  • Manufacturing and Industrial
  • Retail and Hospitality
  • Government and Public Safety
  • Healthcare

By Commercial Dimension

  • Direct Original Equipment Manufacturer Sales
  • Systems Integrator Channel
  • Capacity-as-a-Service Subscription Model

By Region

  • North America
  • Western Europe
  • East Asia
  • South Asia and Pacific
  • Latin America
  • Middle East and Africa
  • Eastern Europe

Scope, Methodology, and Coverage

Every figure in this report is reproducible from documented input assumptions. The scope below maps the historical period, the forecast horizon, the segmentation dimensions, and the countries covered, alongside the underlying primary and qualitative methodology.
Historical Period
2020 to 2025
Forecast Period
2026 to 2036
Base Year
2025 (USD billions; MMA Primary Research Dataset, September 2026)
Market Definition
The Micro Mobile Data Center Market covers prefabricated, self-contained computing enclosures ranging from single-cabinet to shipping-container scale, including integrated power, cooling, and security systems designed for deployment outside traditional purpose-built data center facilities. It excludes hyperscale colocation campuses and standard server racks installed within existing conventional data center buildings.
Quantitative Units
USD Billion, CAGR (%)
Segmentation Dimensions
By Product Form Factor, By End-Use Industry, By Commercial Dimension, By Region
Regions Covered
North America, Western Europe, East Asia, South Asia and Pacific, Latin America, Middle East and Africa, Eastern Europe
Countries Covered
United States, Canada, Germany, United Kingdom, France, China, Japan, South Korea, Taiwan, India, Australia, Vietnam, Indonesia, Brazil, Mexico, United Arab Emirates, Saudi Arabia, South Africa, Nigeria, Poland
Key Companies Profiled
Schneider Electric, Vertiv, Huawei, Rittal, Eaton Corporation, Hewlett Packard Enterprise, Dell Technologies, Cisco Systems, Delta Electronics, Legrand, STULZ, Zella DC, Cannon Technologies, Panduit, nVent Electric, IceoTope, EdgeConneX, Compass Datacenters, Hitachi Vantara, Fujitsu
Quantitative Methodology
Primary survey, n=3,800 respondents, Q4 2025, six countries; demand-side model with trade association cross-validation
Qualitative Methodology
47 expert interviews, Q4 2025; applied to validate demand model assumptions, identify emerging dynamics, and assess competitive positioning
Report Format
PDF and XLSX data workbook (Word format preview document)
Publisher
Market Minds Advisory
Report Code
MMA-2026-TEC-954
Published
September 2026
Contact
sales@marketmindsadvisory.com | www.marketmindsadvisory.com

Purchase the full Micro Mobile Data Center Market Report (2026 to 2036).

This report provides a comprehensive analysis of the global Micro Mobile Data Center Market from 2026 through 2036, covering market sizing, segmentation, regional dynamics, and competitive positioning across all major deployment form factors. It draws on primary survey data from 3,800 respondents and 47 expert interviews conducted in the fourth quarter of 2025 to ground every forecast in verifiable industry behavior. Segment-level growth projections identify where containerized units are outpacing legacy cabinet formats as 5G and industrial automation scale. Readers also gain regional demand drivers, input cost exposure analysis, and a strategic verdict identifying where margin and growth intersect.
Ten-year market sizing and growth forecast
Six-format segmentation with detailed growth rate data
Seven-region demand pattern and competitive positioning analysis
Twenty-company competitive benchmarking and moat assessment database
Input cost and supply chain risk assessment
Anonymized client engagement case study with outcomes

Built For The People Who Decide

From boardroom strategy to bench-side execution, this report is read cover-to-cover by leaders shaping the next decade of their industry, turning demand scenarios, market dynamics and valuation benchmarks into decisions.
CXOs/ Presidents/ VPs/ Managers
M&A and Corporate Development
Strategy Teams and R&D Heads
Procurement and Product Directors
Regulatory and Compliance Leaders
Investor Relations and Equity Analysts