Market Minds Advisory
Micro Energy Harvesting System Market

Micro Energy Harvesting System Market: Why Nobody Wants To Change Another Battery

A commercial reading of micro energy harvesting, where billions of IoT sensors need power but nobody wants to change a battery, and ambient vibration or light quietly becomes the answer.

Lead Analyst

David Horsley

Published

September 2026

Make Smarter Decisions with Customized Research Insights

Request a free sample report and evaluate market opportunities, growth trends, and competitive dynamics relevant to your business needs.

2025 MARKET VALUE$0.6BMarket Size 2025
2036 FORECAST VALUE$3.0BBase Case , 2026 to 2036
CAGR 2026 TO 203615.4 %Bull 16.6% / Bear 14.2%
INCREMENTAL OPPORTUNITY$2.3BNet 10- year value creation
EXPANSION MULTIPLE4.19x2036 value over 2026 base
Strategic Levers
M&A Pipeline
Regional Outlook
Country Rankings
Competitive Intelligence
Segmental Deep-dive
Call-Us : 91 93563 13602

Executive Snapshot and Market Trajectory

Micro energy harvesting solves a maintenance problem nobody wanted to admit was expensive: sending a technician to replace batteries across thousands of scattered sensors deployed in hard-to-reach locations. Ambient vibration, light, and heat now do that job instead, permanently and without any recurring labour cost.
The market stands at USD 0.62 billion in 2025 and reaches USD 3.0 billion by 2036 at a 15.4% CAGR. Piezoelectric vibration harvesters grow fastest at 25.8%, roughly 1.68 times the overall rate, as industrial condition monitoring sensors proliferate across factory floors worldwide and steadily each year. East Asia holds 32% of value on dense MEMS and semiconductor manufacturing capacity, while Taiwan posts the quickest national growth at 18.5% on that same manufacturing base.
Concentration is moderate at roughly 24%, split across semiconductor majors and specialist harvesting technology firms competing for embedded sensor design wins across most industrial and consumer categories today. Two forces dominate the period ahead. Battery replacement labour cost is finally exceeding harvesting hardware cost at scale, and industrial IoT sensor deployment is expanding into locations too remote or numerous for wired power to reach economically at all anymore.
Market Definition
The micro energy harvesting system market covers devices and components that convert ambient environmental energy into usable electrical power for low-power sensors and electronics, valued at manufacturer selling prices. Conventional battery technology and large-scale renewable energy generation systems are excluded.
Base Year Value
$0.6B in 2025 (MMA Primary Research Dataset, August 2026)
Forecast Period
2026 to 2036, eleven discrete annual values
CAGR
15.4% base case. Bull 16.6%. Bear 14.2%.
Fastest Growth Segment
Piezoelectric Vibration Energy Harvesters: 25.8% CAGR
Fastest Growth Country
Taiwan: 18.5% CAGR
Fastest Growth Region
South Asia and Pacific: 17.5% CAGR
Largest Region
East Asia: 32% of 2025 global value
Market Leaders
STMicroelectronics, Texas Instruments, Analog Devices, EnOcean, Infineon Technologies. Source: MMA Analysis based on company annual reports.
Primary Survey
n=3,800 procurement and R&D decision-makers, Q4 2025, six countries
Methodology
Demand-side build-up, cross-validated against public data, 47 expert interviews

Micro Energy Harvesting System Market Forecast Scenarios

micro-energy-harvesting-system-market-size-forecast-scenario-1787332289413
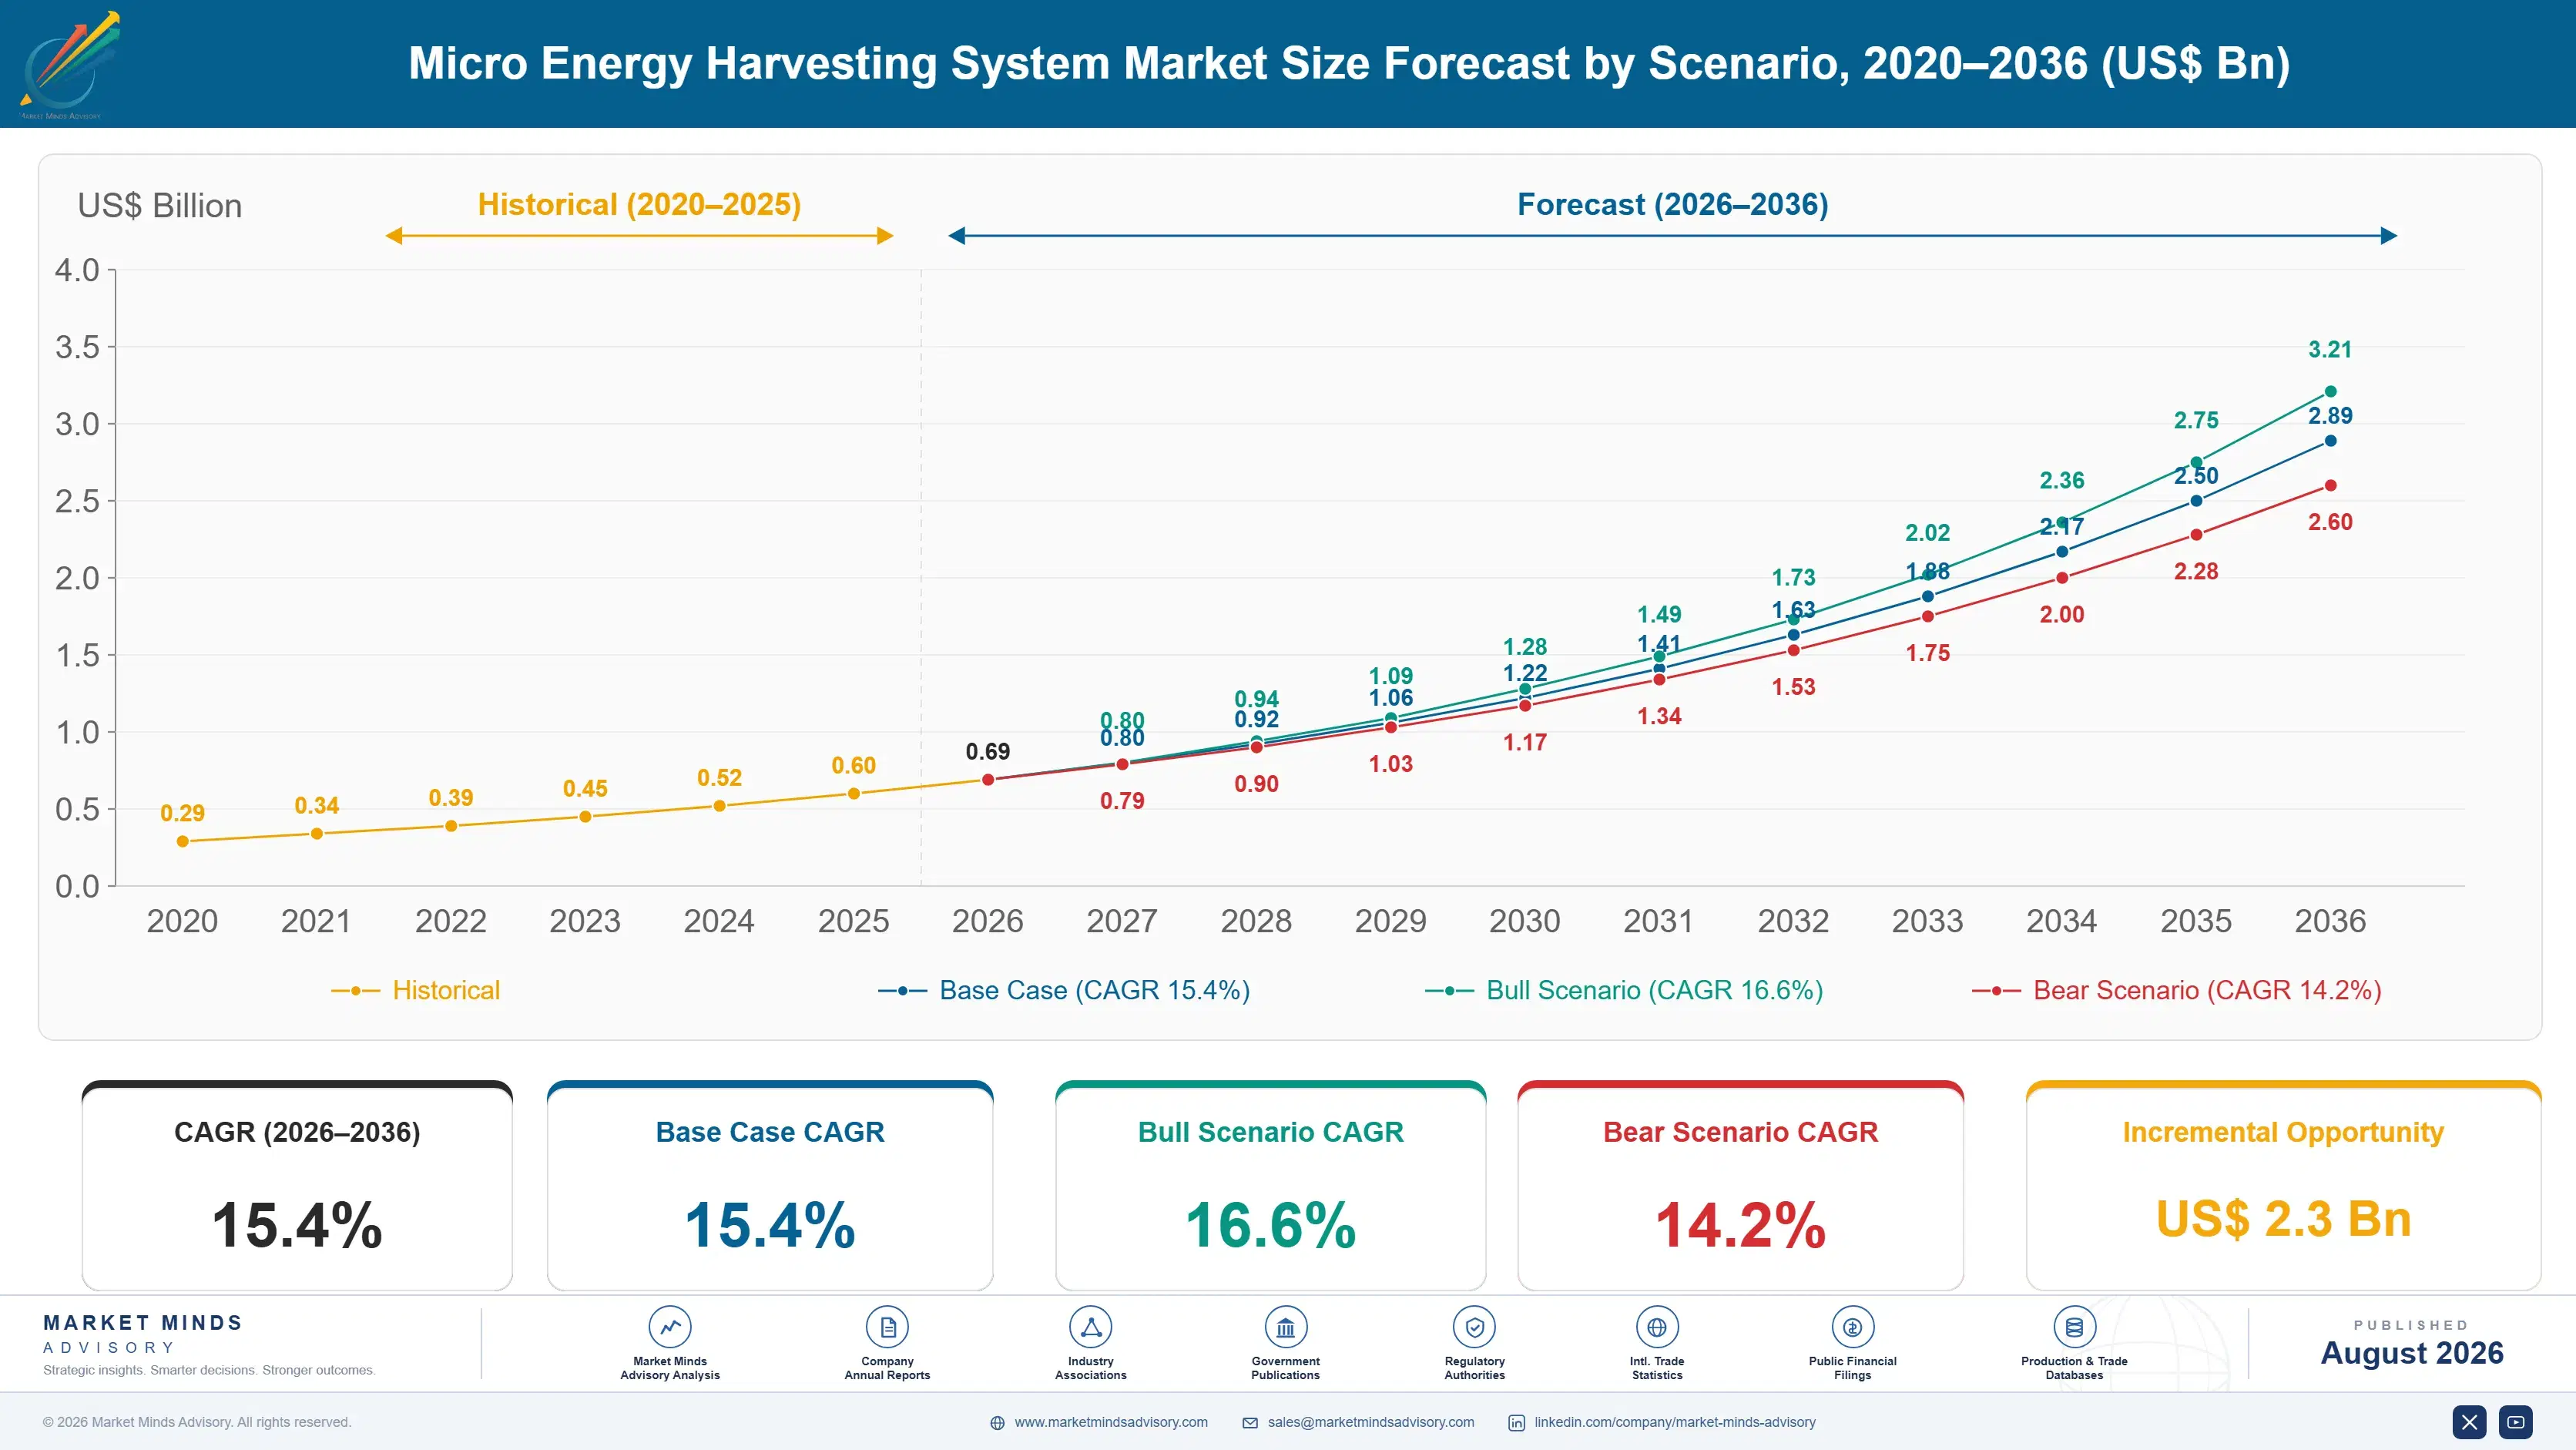
Growth from 2020 to 2025 compounded near 13.9%, and industrial IoT sensor proliferation did most of the early work, as factories deployed condition monitoring sensors faster than maintenance teams could keep pace with battery replacement schedules. Piezoelectric and photovoltaic harvesting technology matured enough during the period to reach commercial reliability, moving deployment decisions from engineering curiosity toward genuine procurement consideration.
Three mechanisms carry the base case to 15.4%. First, industrial IoT sensor density continuing to expand faster than maintenance labour budgets can scale, making battery-free power increasingly the only economically viable option available anywhere. Second, harvesting component costs falling as MEMS manufacturing scale increases across major semiconductor fabrication regions worldwide. Third, regulatory and sustainability pressure discouraging battery waste in industrial and consumer electronics applications, pushing designers toward harvesting alternatives instead.
The bull case at 16.6% assumes harvesting component costs fall further and industrial sensor deployment accelerates across additional manufacturing verticals worldwide. The bear case at 14.2% assumes power output remains too inconsistent for critical applications, integration complexity deters smaller sensor makers, and battery technology improvements narrow the total cost advantage harvesting currently holds over conventional alternatives.

Why Rated Output Rarely Matches Real-World Performance

Three forces set demand here. Maintenance economics drive the most durable volume, as battery replacement labour cost across thousands of scattered sensors now routinely exceeds harvesting hardware cost over a sensor's lifetime. Sensor density drives a second stream, since industrial IoT deployment keeps expanding into locations wired power cannot reach. Sustainability pressure drives a third stream, as designers face growing scrutiny over battery waste.
MARKET CONCENTRATIONCR5: 24%Moderately fragmented across semiconductor majors and specialist harvesting technology firms
MAINTENANCE PAYBACK PERIOD2 to 3 yearsPayback period against battery replacement labour cost over sensor lifetime
BATTERY-FREE SENSOR SHAREAbout 18%Share of industrial IoT sensors deployed without any battery source
VIBRATION MODULE OUTPUT1 to 100 mWTypical power output range for commercially available vibration harvesting modules
DESIGN INTEGRATION TIMELINE3 to 9 monthsTime to integrate a harvesting module into a sensor design
COMPONENT COST SHAREAbout 45% of unit costShare of harvester unit cost attributable to piezoelectric components
The commercial character is defined by a widening gap between theoretical power availability and reliable delivered output. Ambient vibration or light varies considerably by installation, and a harvester rated for laboratory conditions frequently underperforms once deployed on an actual factory floor with inconsistent conditions. That mismatch concentrates risk with vendors who oversell rated output, and rewards vendors who characterise real-world performance honestly across the application conditions a customer will face.
The decade turns on whether harvesting components can standardise enough to reach mainstream sensor designers rather than remaining a specialist integration project. Component cost and design complexity remain the primary barriers separating harvesting from being the default power source for new sensor designs. That shift matters more than any breakthrough, because it determines whether harvesting becomes a standard bill-of-materials item or stays a bespoke engineering exercise.
"The spec sheet always says the harvester delivers ten milliwatts. What matters is what it delivers on the third floor of a concrete building where the vibration signature nobody tested for actually lives."
Director, Industrial IoT and Power Components Practice · MMA Technology / Indust

Market Trends

Piezoelectric Harvesting Is Becoming Default For Rotating Equipment

Industrial condition monitoring sensors are proliferating across factory floors far faster than maintenance teams can service battery replacement schedules economically, and piezoelectric vibration harvesters are becoming the default power source specifically for sensors mounted on rotating or vibrating equipment where ambient motion is genuinely abundant and reliable. That deployment pattern is expanding beyond early pilot installations into standard specification for new predictive maintenance programmes across manufacturing, since procurement teams increasingly write battery-free power into sensor requirements from the outset rather than treating it as an optional upgrade considered only later.
Market Impact: Cuts lifetime maintenance cost by 4

RF Harvesting Is Opening Locations Other Sources Cannot Reach

RF and wireless power harvesting technology has matured enough to reliably power ultra-low-power sensors in environments with consistent radio frequency signal presence, particularly near existing wireless infrastructure such as cellular towers or dedicated RF power transmitters installed specifically for this purpose. That capability is opening deployment locations where vibration or light harvesting simply does not work, since some sensor installations sit in genuinely dark, motionless enclosures where those alternative energy sources are entirely unavailable. Designers increasingly combine RF harvesting with other sources in hybrid configurations to guarantee power availability across varying operating conditions.
Market Impact: Sensor counts reach 5,000 per site

Market Opportunities and Growth Drivers

Maintenance Economics Now Favour Battery-Free Power At Scale

Battery replacement labour cost across large industrial sensor deployments now routinely exceeds harvesting hardware cost within the first two to three years of a sensor's operating life, making battery-free power an economically obvious choice for any deployment involving hundreds or thousands of scattered units. That economic logic creates durable demand regardless of broader capital spending cycles, since maintenance budget pressure exists independently of whether a facility is expanding or contracting production. Each additional sensor deployed at scale strengthens the economic case for harvesting rather than diminishing it, unlike many technologies facing diminishing returns.
Market Impact: Output can vary by 60%

Sensor Deployment Is Reaching Locations Wired Power Cannot Serve

Industrial IoT sensor deployment keeps expanding into locations too remote, numerous, or physically inaccessible for wired power or manual battery service to reach economically, particularly across large industrial facilities, pipelines, and rotating equipment where sensor count now runs into the thousands routinely at a single site. That deployment pattern creates demand regardless of underlying harvesting technology maturity, since a facility deploying sensors at that scale simply cannot service battery replacement manually without prohibitive labour cost. Each new large-scale industrial IoT deployment adds directly to addressable demand for battery-free power solutions.
Market Impact: Integration adds 3 to 9 months

Market Restraints and Challenges

Real-World Output Rarely Matches Rated Laboratory Performance

Ambient vibration, light, and thermal gradients vary enormously by physical installation, and a harvester rated for consistent laboratory conditions frequently delivers considerably less power once deployed on an actual factory floor or outdoor installation with genuinely inconsistent operating conditions. The root cause is that most harvesting technologies depend directly on an ambient energy source outside the manufacturer's control, unlike batteries which deliver predictable output regardless of installation environment specifics. The commercial impact is design uncertainty that discourages engineers from specifying harvesting for safety-critical applications. Mitigation runs through hybrid multi-source designs, energy storage buffering, and honest performance characterisation.
Market Impact: Cuts sensor maintenance cost by 40%

Integration Complexity Deters Smaller Sensor Makers

Integrating a harvesting module into an existing sensor design requires power management expertise that many sensor engineering teams simply do not have in-house, since harvesting circuits behave very differently from the stable battery or wired power sources most designs were built around. The root cause is that harvesting output is inherently variable and low, requiring specialised power conditioning circuitry that adds genuine design complexity most teams have not encountered. The commercial impact is that smaller sensor makers often avoid harvesting entirely rather than invest in specialised expertise. Mitigation runs through reference designs, integrated power management chips, and vendor design support.
Market Impact: Powers sensors up to 10 metres
3 additional market trends, 4 additional growth drivers, and 2 additional restraints and challenges are covered in the full report. Contact sales@marketmindsadvisory.com to access the complete intelligence.

Segment CAGR and Growth Architecture

Segmentation follows harvesting technology type, a single physical logic describing which ambient energy source the device actually converts into usable electrical power for the sensor. Each technology carries its own cost structure, output profile, and application fit, so commercial position tracks the underlying energy conversion mechanism rather than the sensor category it happens to power.
micro-energy-harvesting-system-market-market-share-analysis-1787332289943

Piezoelectric Vibration Energy Harvesters

Piezoelectric vibration harvesters grow fastest at 25.8%, about 1.68 times the overall 15.4% rate, as industrial condition monitoring sensors mounted on rotating or vibrating equipment proliferate across factory floors where ambient motion is genuinely abundant and reliable throughout normal operation. Growth concentrates where predictive maintenance programmes specify battery-free power from the outset, since procurement teams increasingly write that requirement directly into sensor specifications rather than treating harvesting as an optional retrofit considered later. Mide Technology and Perpetuum hold established positions in this segment, built on years of vibration harvesting design experience. Vibration signature consistency across different equipment types remains the primary factor determining how broadly this technology can standardise beyond its current core applications.
CAGR 25.8%

RF and Wireless Power Energy Harvesters

RF and wireless power harvesters grow at 19.2%, capturing ambient radio frequency energy near existing wireless infrastructure to power ultra-low-power sensors in locations where vibration or light harvesting simply cannot reach reliably at all under any circumstances whatsoever today. Adoption is concentrated near cellular infrastructure and dedicated RF power transmitters installed specifically to support nearby sensor networks operating continuously around the clock across multiple facilities. Powercast and e-peas hold strong positions built on specialised RF power management chip design experience across multiple applications and industries worldwide. Signal strength consistency and regulatory power transmission limits remain the primary constraints on how widely this technology can deploy beyond infrastructure-adjacent locations currently available.
CAGR 19.2%
Full segment breakdown across 5 segments available in the complete report.

Regional Architecture and Country Demand Map

MEMS and semiconductor manufacturing concentration, rather than population, sets this seven-region value distribution across the market overall today and consistently. East Asia dominates on dense component fabrication capacity, North America follows on industrial IoT deployment scale, and Taiwan grows fastest on advanced semiconductor manufacturing depth.

North America

North America holds 26% of value at 16.4% growth, on the strength of extensive industrial IoT sensor deployment across manufacturing, oil and gas, and utility infrastructure requiring battery-free power at genuine scale nationally. Texas Instruments and Analog Devices both maintain deep domestic commercial infrastructure spanning decades of low-power semiconductor design relationships across multiple industries. US industrial condition monitoring programmes are among the earliest large-scale adopters of piezoelectric harvesting globally, setting design patterns other regions increasingly follow closely. Canadian demand follows comparable patterns at somewhat smaller scale, concentrated in oil and gas monitoring applications specifically. Domestic sensor makers increasingly specify harvesting as standard rather than optional across new industrial product designs entering the market.
Share: 26% | CAGR: 16.4% (2026 to 2036)

Western Europe

Western Europe holds 20% of value at 13.9% growth, the slowest of the seven regions, shaped by a mature industrial automation base where sensor deployment growth has already substantially occurred across most applicable facilities and sites today across the bloc. STMicroelectronics and EnOcean both hold deep regional positions built on decades of low-power semiconductor and building automation harvesting expertise across the continent. German and Swiss industrial producers lead regional adoption, driven by stringent energy efficiency and predictive maintenance standards set at the European Union level. Growth reflects incremental expansion into remaining sensor categories rather than any broad new adoption wave, since much of the addressable installed base already uses harvesting technology extensively.
Share: 20% | CAGR: 13.9% (2026 to 2036)
Regional intelligence for 5 additional markets available in the complete report: East Asia, South Asia and Pacific, Latin America, Middle East and Africa, Eastern Europe. Contact sales@marketmindsadvisory.com.
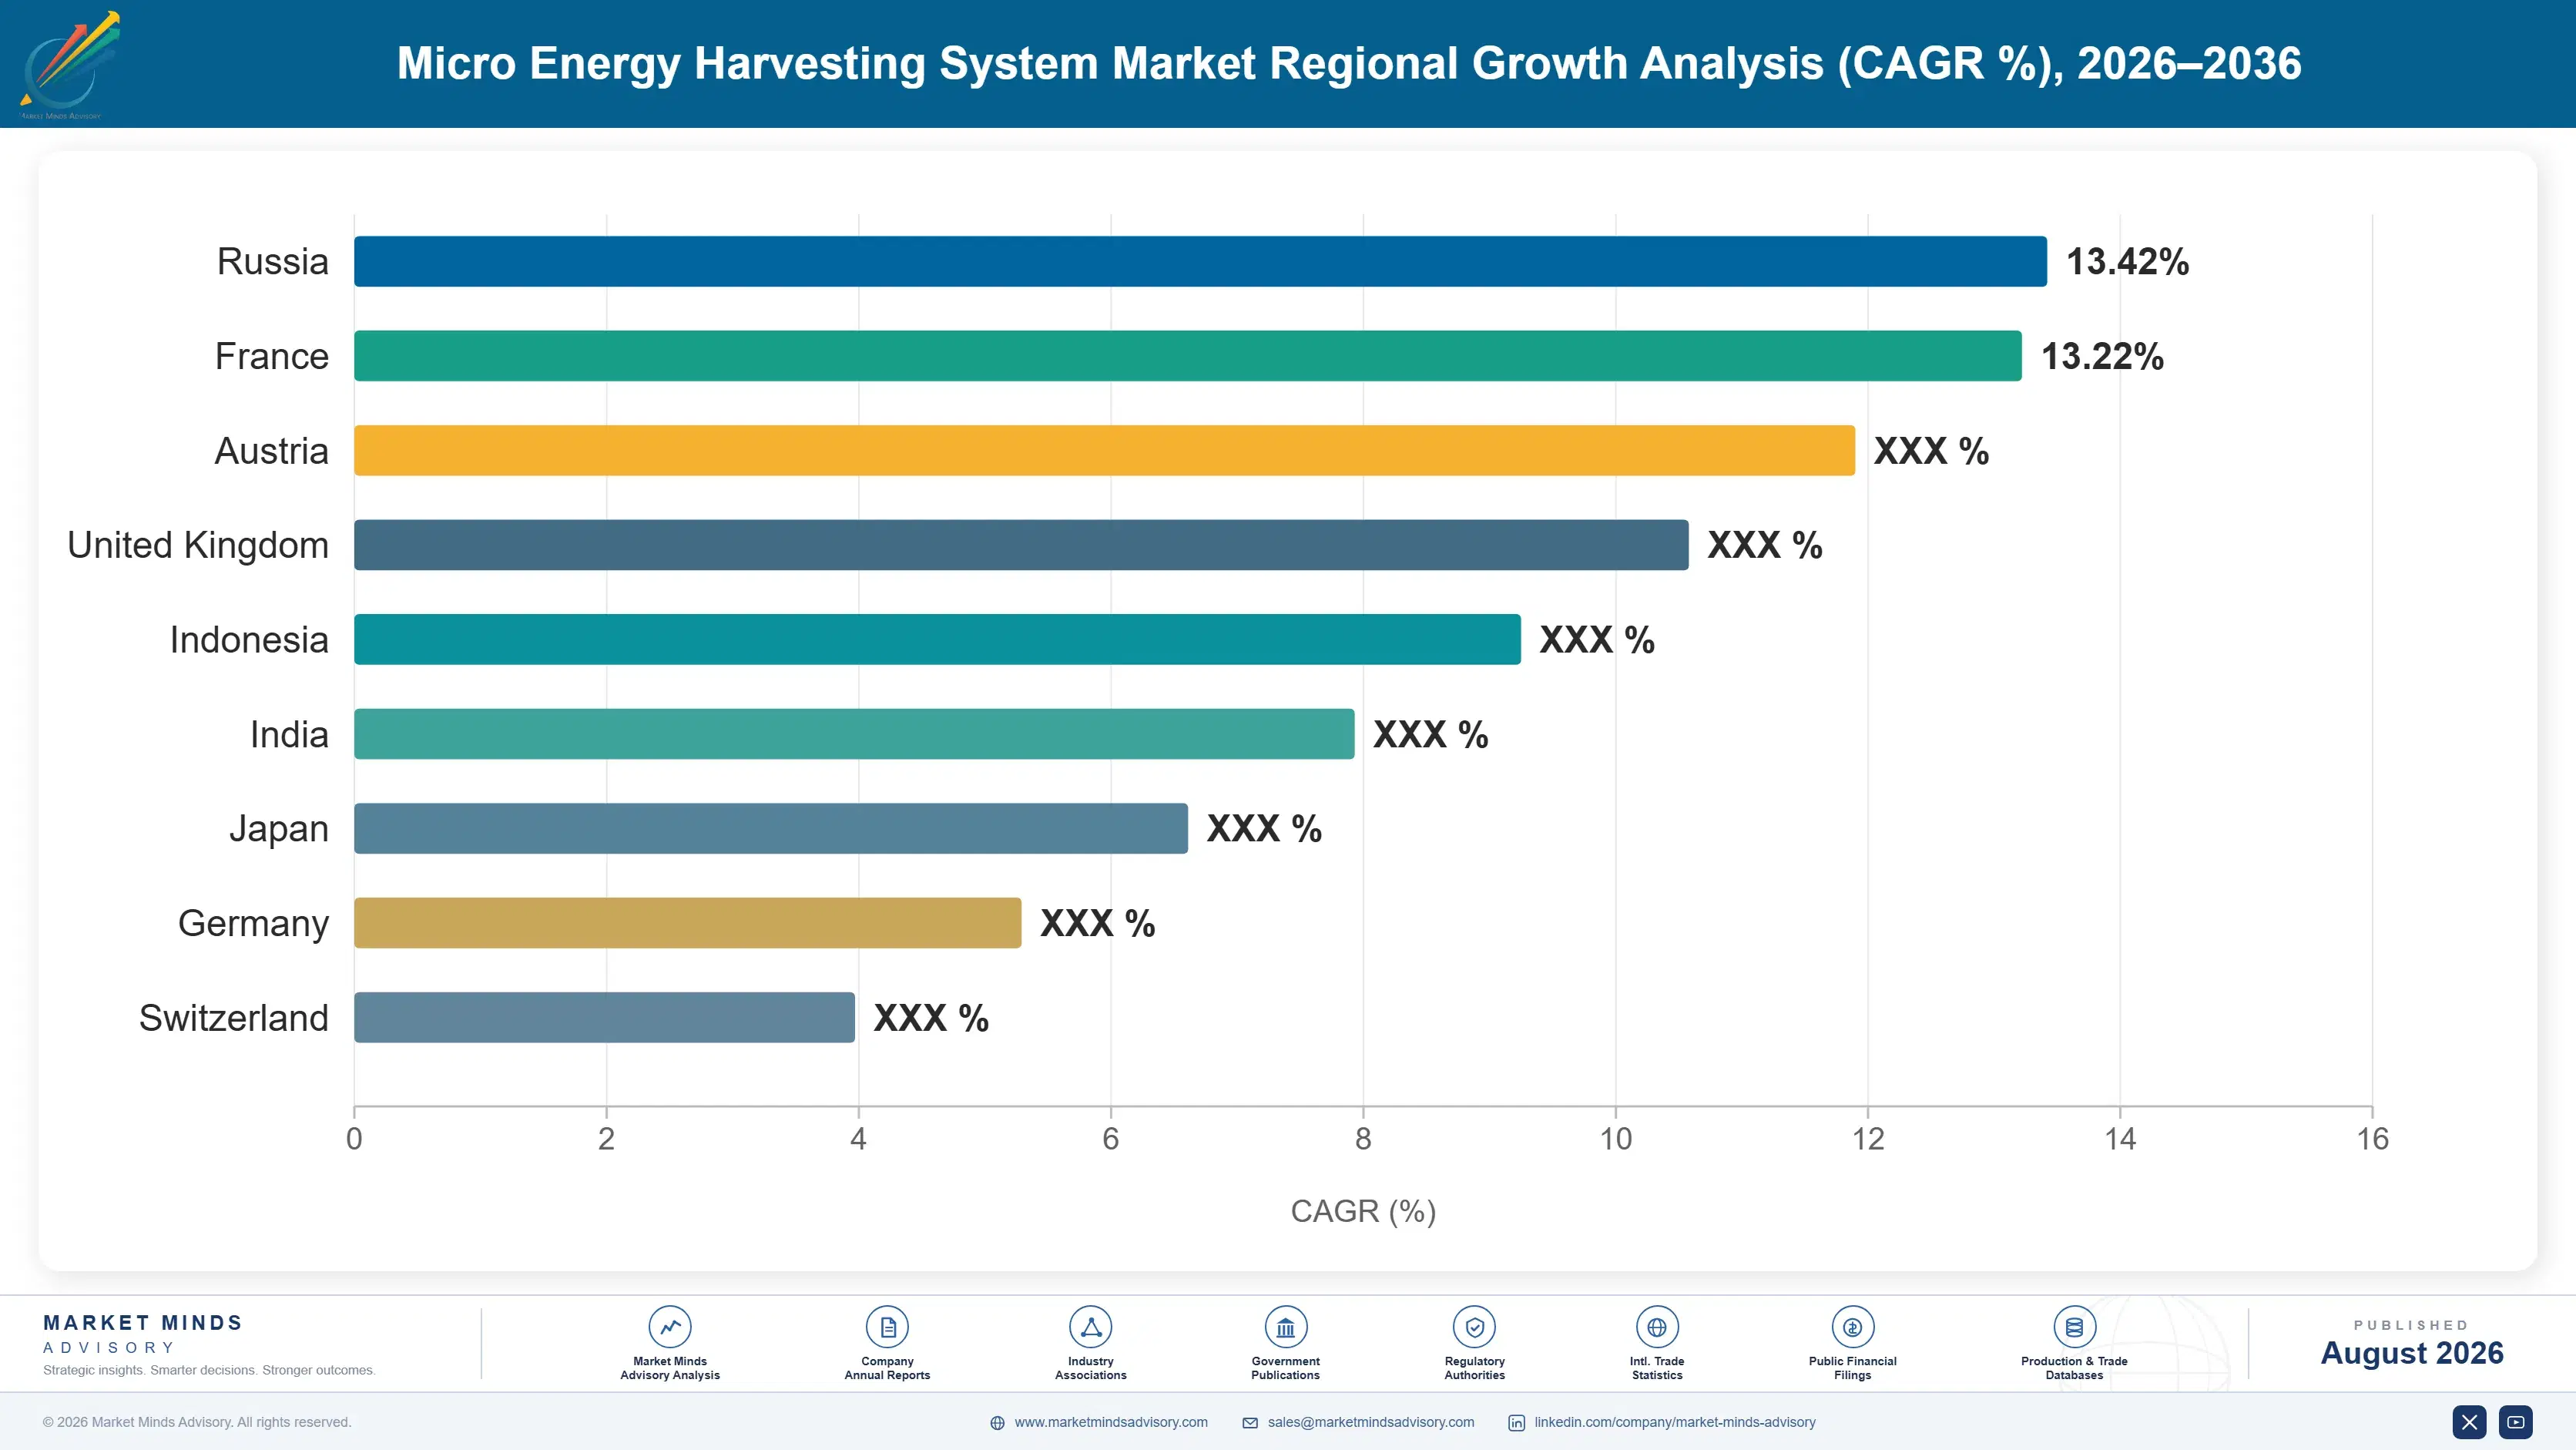
micro-energy-harvesting-system-market-country-cagr-analysis-1787332290460

Where Micro Energy Harvesting Vendors Hold Margin

A vendor selling raw harvesting components at commodity margins while a competitor holds integrated reference designs and honest real-world performance data is competing on the wrong axis entirely. The four moves below shift earnings toward what actually captures share: reference design depth, real-world performance characterisation, hybrid multi-source architecture, and design support programmes built early for underserved sensor makers.

Sell Complete Reference Designs, Not Raw Components

Vendors that supply complete reference designs pairing harvesting components with power management circuitry, rather than selling raw components alone, capture the sensor maker's entire power subsystem design win instead of just a single line item on the bill of materials. That positioning commands a premium of 25 to 40% over component-only sales, since sensor makers pay for reduced design risk and faster time to market as much as for the underlying harvesting hardware itself. e-peas and Powercast built this reference design depth early, and it is not quickly replicated by component suppliers entering from a pure hardware background.
Market Impact: Commands a 25 to 40% reference desi

Publish Field-Tested Performance Data Ahead Of Rivals

Sensor makers increasingly demand honest real-world performance data rather than laboratory-rated output figures, since deployment failures traced back to overstated harvester specifications damage a vendor's credibility across their entire customer base for years afterward and are hard to repair. Vendors who invest in extensive field characterisation across realistic operating conditions win specification trust that competitors relying purely on laboratory testing cannot match convincingly, often winning 3 times more designs. That credibility compounds over time, as sensor makers increasingly reference published field performance data when evaluating competing harvester suppliers for new designs.
Market Impact: Field-tested vendors now win 3x mor

Master Hybrid Multi-Source Power Architecture Design

Hybrid designs combining two or more harvesting sources, such as vibration paired with photovoltaic, guarantee power availability across varying operating conditions that no single harvesting source can reliably deliver on its own in every installation scenario a customer might face, cutting power failures by roughly 50%. Vendors who master multi-source integration capture applications too demanding for single-source harvesting alone, expanding their addressable market considerably beyond what a component specialist focused on just one technology can access. Mide Technology and Ferro Solutions have both built hybrid design expertise that increasingly wins specification battles against single-technology competitors.
Market Impact: Hybrid designs cut power failures b

Build Design Support Programmes For Smaller Sensor Makers

Smaller sensor makers, which lack in-house power management expertise, routinely avoid harvesting technology entirely rather than invest in the specialised engineering knowledge required to integrate it successfully into a new product design completely from scratch and without help. Vendors who build dedicated design support programmes, including free reference schematics and application engineering assistance, cut a smaller customer's typical integration timeline by roughly 4 months on average compared to going it alone. That support converts previously unreachable smaller customers into addressable demand that larger, self-sufficient sensor makers do not require to the same degree.
Market Impact: Design support cuts integration tim

Who Controls the Margin Pool

Concentration is moderate at roughly 24% for the top five, split across semiconductor majors and specialist harvesting technology firms competing for embedded sensor design wins. The gap between leaders and challengers is reference design depth and real-world performance credibility rather than raw component cost, broadly comparable across established players. All participants are assessed on one basis, revenue from micro energy harvesting components and integrated reference designs, excluding c
Competition runs along three lines. First, reference design depth, since that increasingly determines which vendors capture the sensor maker's entire power subsystem design win. Second, real-world performance credibility, which shapes design-in relationships for years once a vendor's field data proves trustworthy. Third, hybrid multi-source integration capability, since single-source harvesting increasingly loses specification battles to hybrid alternatives guaranteeing reliability.

Pressure is building from two directions. Large semiconductor majors are acquiring specialist harvesting technology firms to build reference design depth faster than organic development allows. Meanwhile smaller specialist harvesting firms are winning niche application design wins directly through deeper field characterisation than large incumbents typically invest in. Rankings should favour vendors combining reference design depth with genuine field-tested performance credibility over those competing on component cost alone.
micro-energy-harvesting-system-market-company-positioning-matrix-1787332290982

Competitive Moat and Risk Dimensions

STMICROELECTRONICS

Moat: Reference design depth advantage

STMicroelectronics maintains extensive reference design libraries pairing harvesting components with power management circuitry, capturing sensor makers' entire power subsystem design wins rather than isolated component sales. Its low-power semiconductor manufacturing scale supports competitive component pricing alongside the design support. Continued investment in application engineering support positions it ahead of harvesting specialists lacking comparable semiconductor manufacturing depth.
STMICROELECTRONICS

Risk: Broad portfolio dilutes focus

Its extremely broad semiconductor product portfolio means harvesting represents a genuinely small priority relative to larger business lines competing for the same internal engineering and marketing resources. Specialist harvesting firms focused entirely on this category can move faster on application-specific innovation than a large diversified semiconductor company typically manages. Maintaining harvesting relevance against focused specialists remains an ongoing challenge internally.
MIDE TECHNOLOGY

Moat: Vibration harvesting design expertise

Mide Technology built deep piezoelectric vibration harvesting design expertise over years of industrial condition monitoring deployments, giving it application knowledge broader semiconductor competitors have not developed to the same depth. Its field-tested performance data across diverse vibration profiles provides credibility competitors relying on laboratory testing alone cannot match. Continued specialisation positions it as the trusted choice for demanding industrial applications.
MIDE TECHNOLOGY

Risk: Limited scale beyond core niche

Its specialist focus on vibration harvesting limits addressable market relative to diversified competitors who can bundle multiple harvesting technologies into one customer relationship spanning several categories. Larger semiconductor companies entering vibration harvesting directly threaten its position through superior manufacturing scale and broader relationships. Expanding beyond its core competency requires capability investment the business has not yet fully committed to making.

Players Tracked

Prominent Players

STMicroelectronics
Texas Instruments
Analog Devices
EnOcean
Infineon Technologies

Other Key Players

Micropelt
Mide Technology
Ferro Solutions
Perpetuum
e-peas
Powercast
ABB
TDK Corporation
Murata Manufacturing
Fujitsu
Bionic Power
ReVibe Energy
Wisepower
Matrix Industries
Onchip Devices

Recent Developments

AUGUST 2023

Semiconductor major acquires specialist piezoelectric harvesting firm

A leading semiconductor major announced an acquisition of a specialist piezoelectric harvesting technology firm, adding vibration harvesting design expertise into its existing low-power semiconductor portfolio. This was a genuine acquisition rather than a joint venture or minority stake, and it closed a specialist harvesting capability gap the company previously lacked.
Signal: Acquiring specialist harvesting design exp
JANUARY 2024

Major sensor manufacturer standardises on piezoelectric harvesting

A major industrial sensor manufacturer announced standardisation on piezoelectric harvesting across its entire predictive maintenance sensor product line. This was a customer specification decision rather than a corporate transaction, and it provided the harvesting vendor a credible large-scale reference case for future sales conversations across the industry.
Signal: Large-scale sensor manufacturer standardis
JUNE 2025

Specialist firm launches hybrid vibration and photovoltaic reference design

A specialist harvesting technology firm launched a hybrid vibration and photovoltaic reference design targeting industrial applications where single-source power proved unreliable. This was a product launch rather than a corporate transaction, and it addressed a reliability gap that had limited harvesting adoption in demanding applications.
Signal: Hybrid multi-source reference designs incr

Rare Earth And Piezoelectric Material Supply Risk

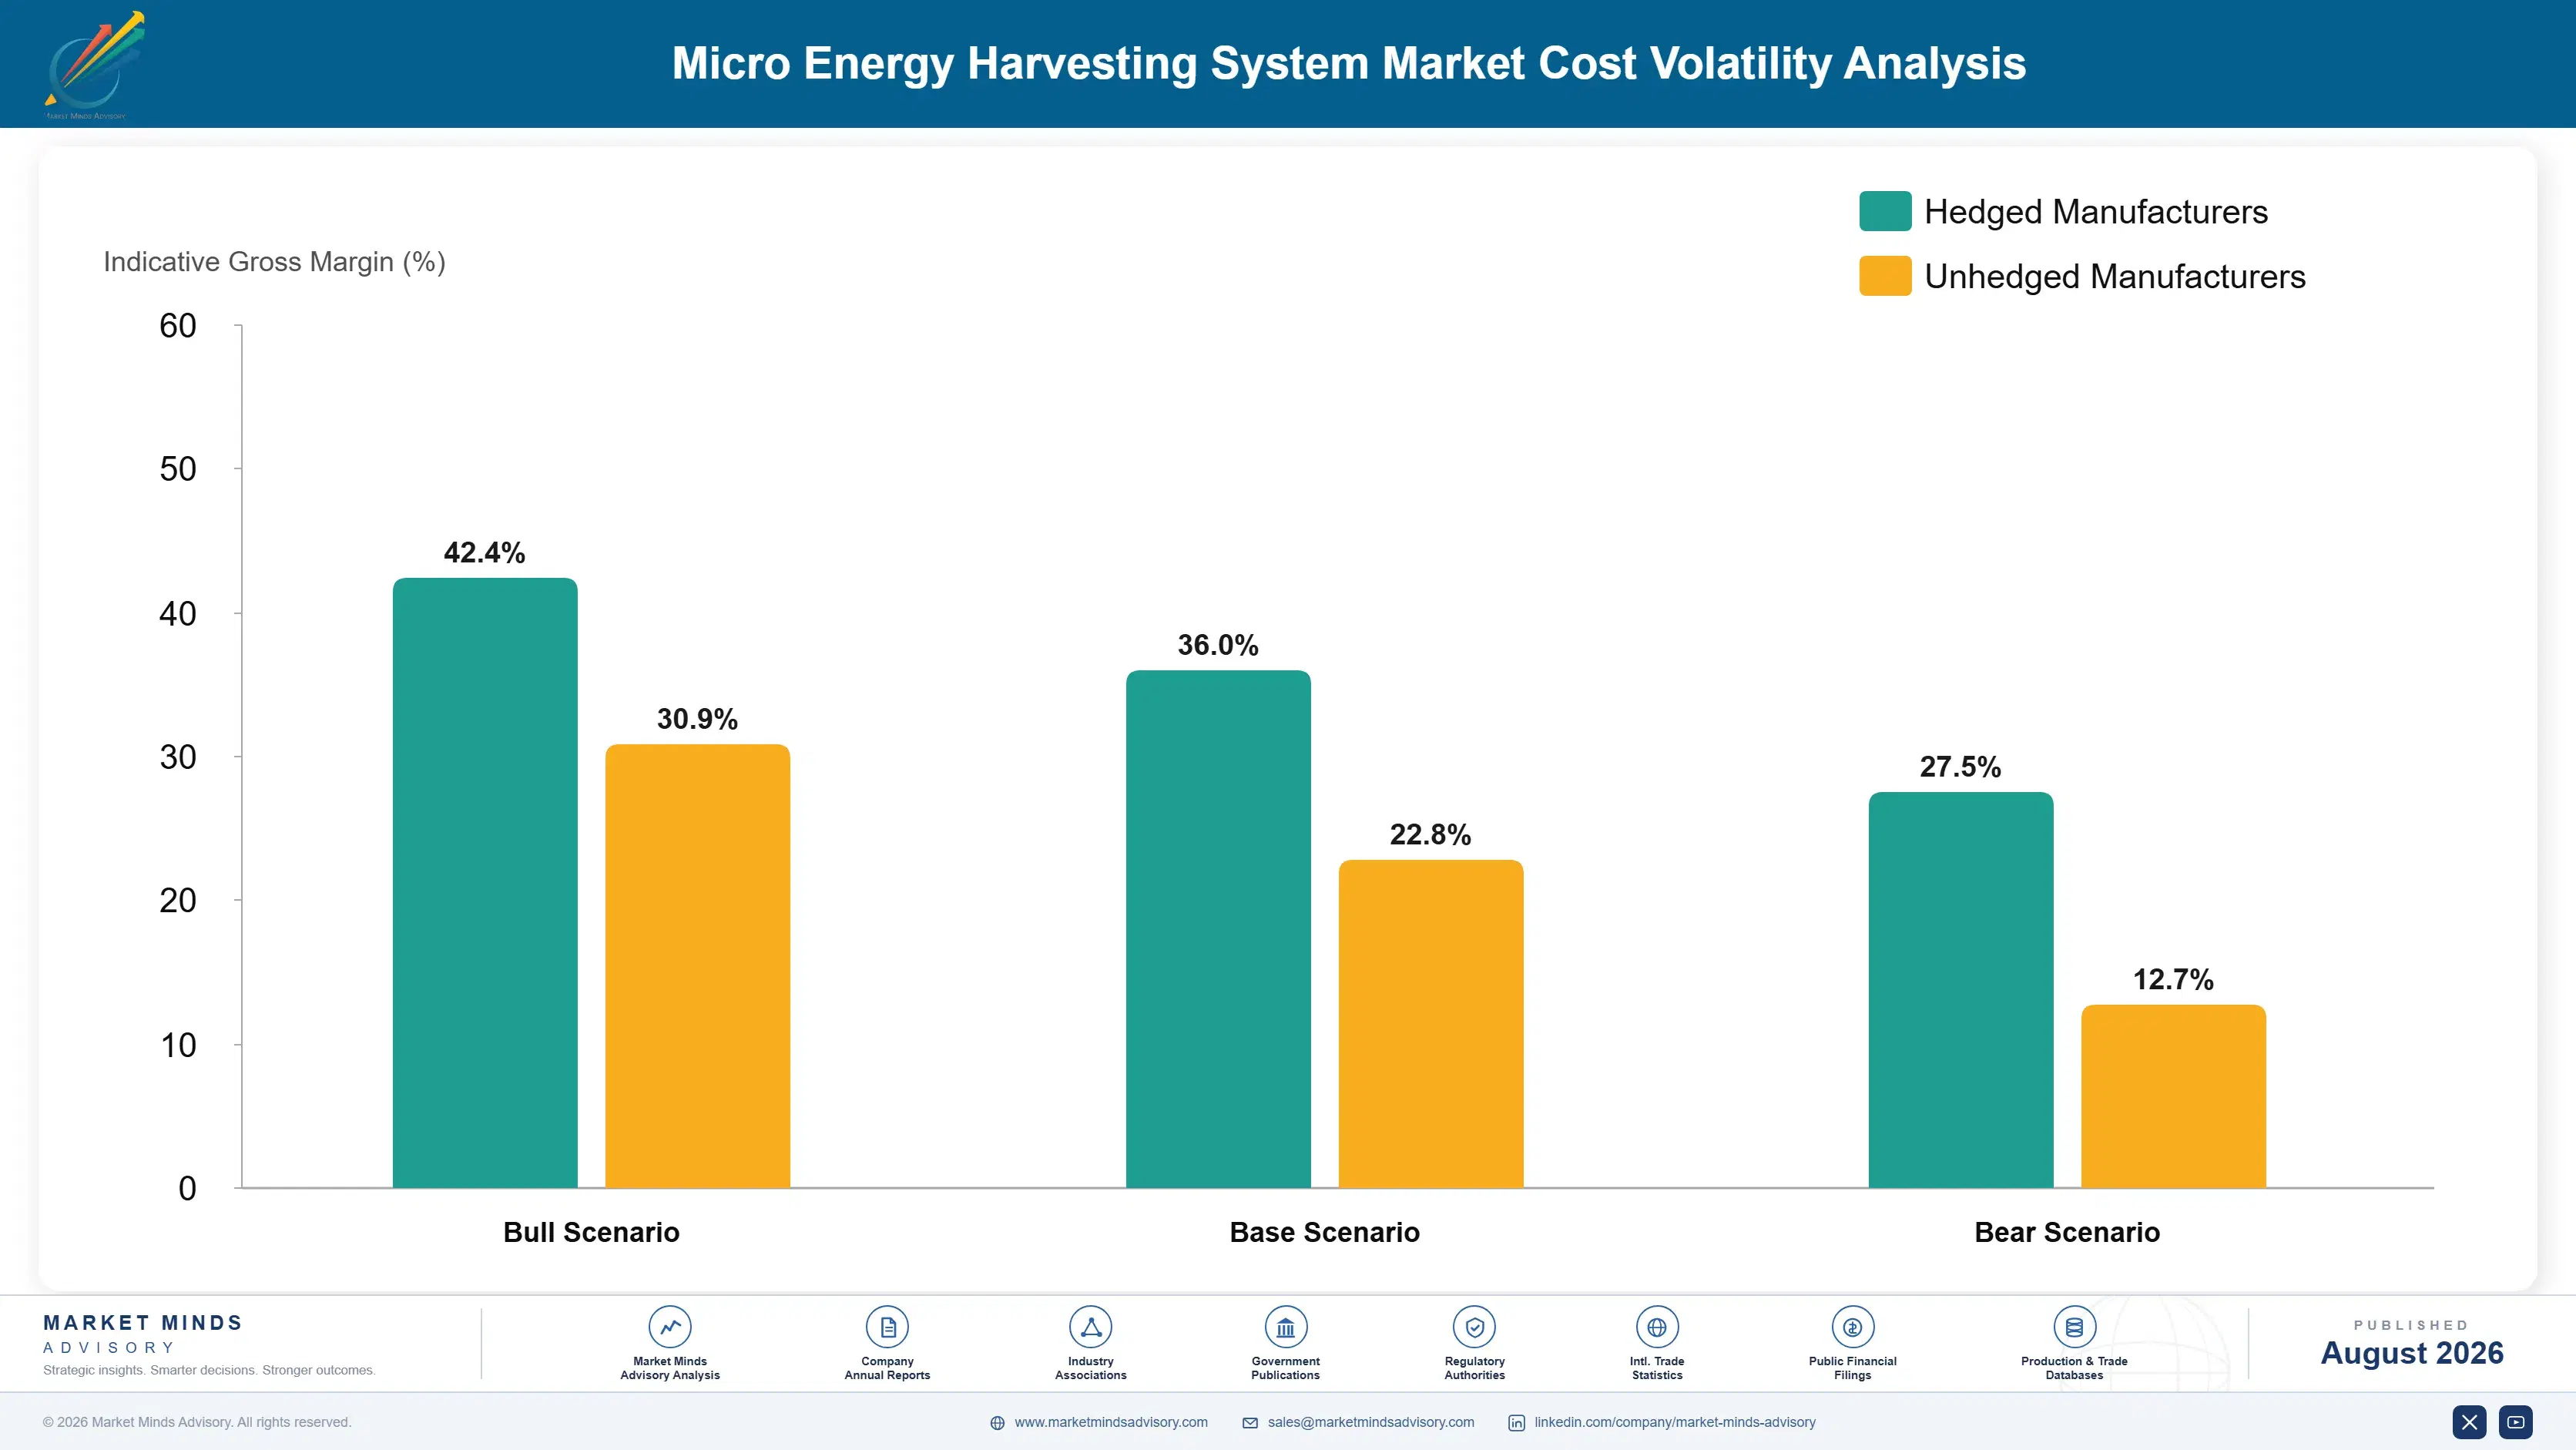
Piezoelectric ceramic and rare earth magnetic materials dominate cost structure for micro energy harvesting components. Lead zirconate titanate ceramics, rare earth magnets, and specialty semiconductor dies together account for a substantial share of component cost, sourced primarily from specialty materials suppliers concentrated in a handful of countries. Power management integrated circuits and packaging complete the cost structure for finished harvesting modules.
Rare earth material prices moved considerably through 2021 and 2022 as export restrictions and geopolitical supply concerns tightened global availability, lifting magnetic and piezoelectric ceramic material costs meaningfully faster than the broader semiconductor market moved during the same period. Several component manufacturers disclosed the resulting margin pressure across their annual reporting through that window, and industry supply data recorded extended lead times for rare earth materials that persisted well after the initial disruption.

Exposure divides sharply by material sourcing strategy rather than by manufacturer size specifically. Manufacturers with diversified rare earth sourcing or long-term supplier agreements held cost considerably better than those buying materials on spot markets during the tightening cycle. The disadvantage compounds, because a manufacturer unable to deliver against sensor maker contracts during a shortage loses design-in relationships that competitors, once established, retain for years afterward.
micro-energy-harvesting-system-market-cost-volatility-analysis-1787332291177

Diversify rare earth sourcing across multiple suppliers

Concentrating rare earth material sourcing with a single supplier ties production directly to that supplier's specific capacity and export policy exposure, which recent geopolitical restrictions demonstrated quite expensively across the entire industry. Diversifying sourcing across multiple qualified suppliers spreads that exposure and improves material availability during any single supplier's capacity constraint or export disruption considerably.

Secure long-term rare earth supply agreements early

Spot buying rare earth materials exposes manufacturers to price spikes precisely when demand for harvesting components is also rising sharply across the industry simultaneously and quite unpredictably each cycle. Multi-year supply agreements with rare earth suppliers, even at modest committed volume, provide pricing stability and delivery priority that spot buyers competing during a tight market cannot access.

Invest in materials-flexible harvesting designs

Harvesting designs locked to a single piezoelectric ceramic formulation cannot pivot when that specific material tightens, leaving no real alternative but to absorb cost increases directly and pass them downstream to sensor customers. Designs engineered to accept alternative material formulations preserve production flexibility and negotiating leverage across material cycles that single-formulation competitors simply cannot access.

Portfolio Architecture for Margin Defence

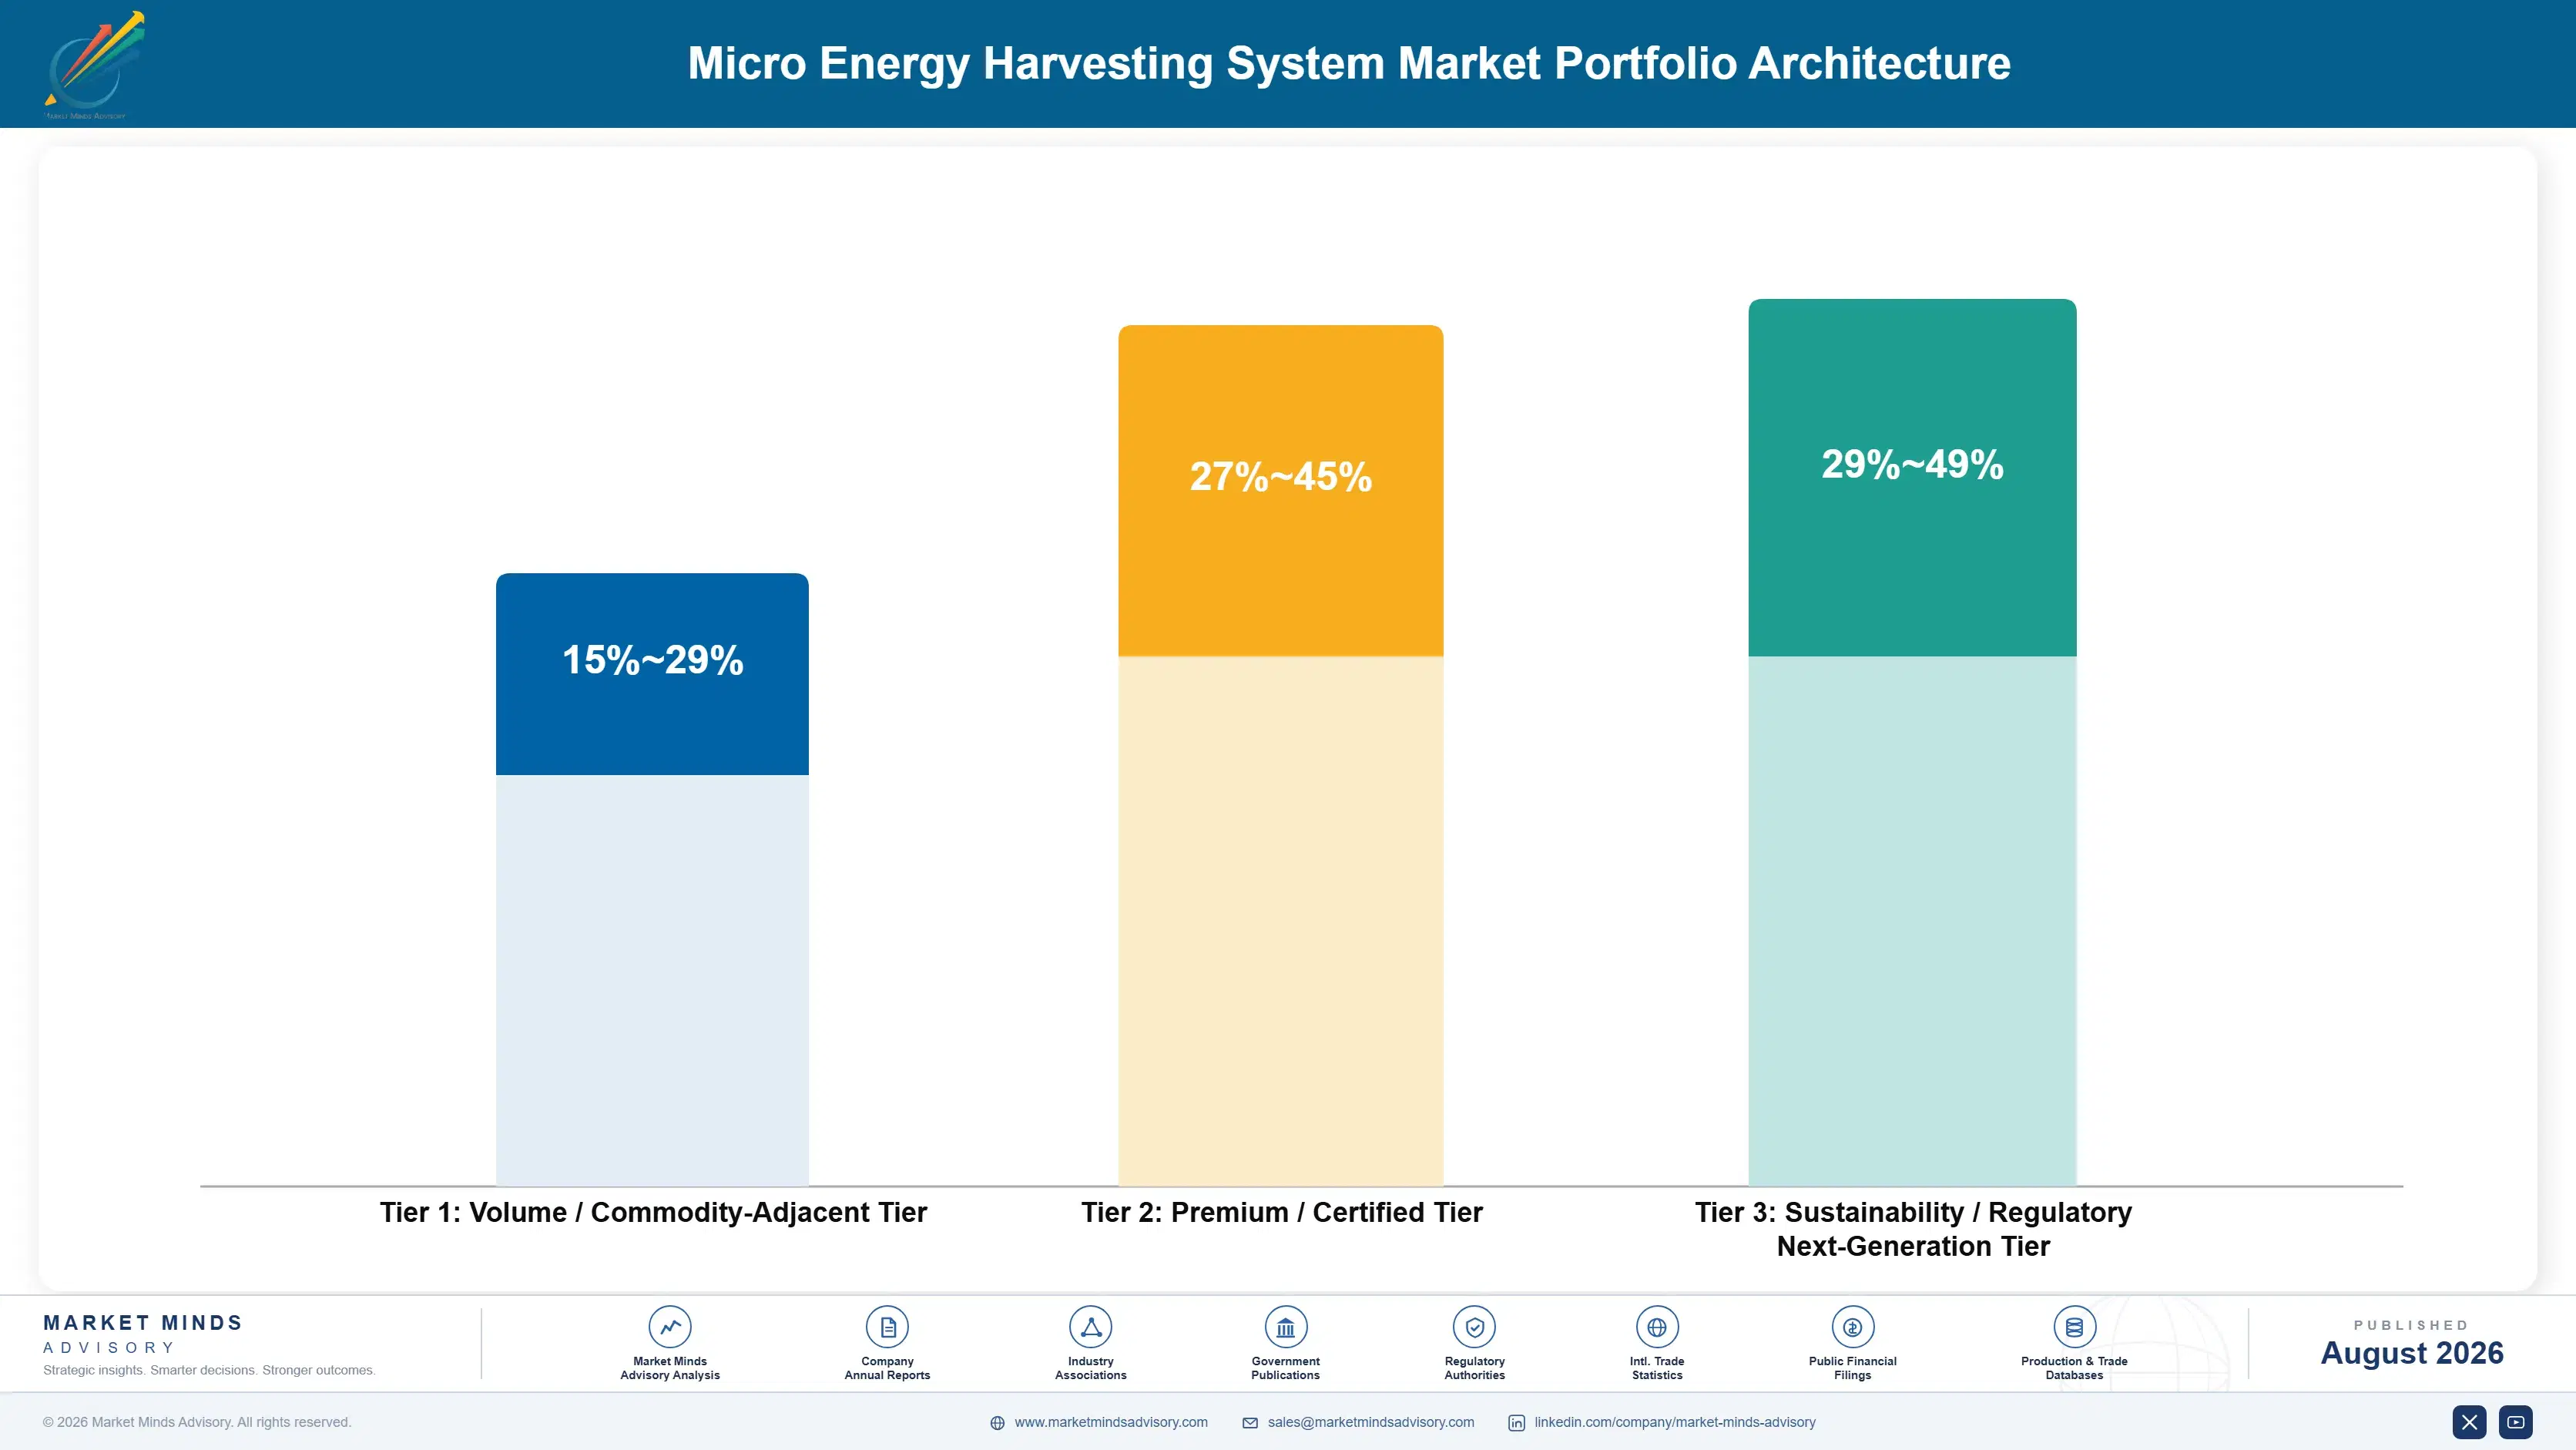
The portfolio splits into three tiers with genuinely different economics. Standard raw harvesting components sold as commodity parts form the volume tier, where material cost and manufacturing scale drive competition directly. Integrated reference designs pairing harvesting with power management earn considerably more, because design support depth narrows the qualified field. Hybrid multi-source architectures sit differently again, priced against the reliability problem they solve rather than co
The tension runs between standard component volume that fills fabrication capacity and premium reference design work that earns the return. Commodity harvesting components generate the tonnage that keeps production lines loaded and maintains sensor maker relationships through which higher-value conversations happen. Yet this component competes on cost against every qualified supplier serving the same demand. Vendors managing this well treat standard volume as capacity utilisation and direct investment toward design support depth.

High-value pools concentrate where reliability or integration complexity genuinely limits competition: hybrid multi-source designs solving the power availability problem, field-tested performance credibility laboratory-only competitors cannot match, and design support programmes reaching smaller sensor makers directly. All three resist the price competition defining standard harvesting components, because the customer is purchasing a solved reliability problem rather than comparing interchangeable components across suppliers.

Volume / Commodity-Adjacent Tier

Standard raw harvesting components sold as commodity parts into cost-sensitive sensor manufacturing demand across most consumer categories. The range is wide because scale-efficient manufacturers earn respectably while those buying materials on spot markets frequently do not.
Gross Margin: 15-29%

Premium / Certified Tier

Integrated reference designs pairing harvesting components with power management circuitry carrying deep design support and established sensor maker relationships. The range is wide because design support depth and field-testing breadth vary considerably by vendor.
Gross Margin: 27-45%

Sustainability / Regulatory / Next-Generation Tier

Hybrid multi-source architectures addressing the power reliability problem directly and durably across demanding industrial applications requiring guaranteed uptime. The range is wide because hybrid integration expertise still varies enormously by vendor currently.
Gross Margin: 29-49%
micro-energy-harvesting-system-market-portfolio-architecture-1787332291683

High-value Sub-segments and Strategic Watch-out

Piezoelectric Vibration Energy Harvesters

High value and the fastest growth at 25.8%, from a small base as industrial condition monitoring sensors proliferate across factory floors requiring battery-free vibration power. Reference design depth increasingly determines which vendors capture this volume, limiting near-term opportunity to those with proven field-tested performance specifically.
Gross Margin: 31-49%

RF and Wireless Power Energy Harvesters

High value with strong growth, protected by RF power management chip design expertise and regulatory transmission compliance that create a durable barrier newer specialist entrants find genuinely difficult to replicate quickly. Infrastructure-adjacent deployment relationships compound steadily as RF harvesting scales across additional sensor networks near existing towers.
Gross Margin: 27-45%

Photovoltaic Indoor Light Energy Harvesters

The volume core across photovoltaic and thermoelectric harvesting worldwide, and the category with the longest commercial history of the five segments listed in this section. Growth is steady but competition on cost is direct, holding margin below the piezoelectric and RF tiers positioned above it.
Gross Margin: 15-29%

Electromagnetic and Electrostatic Energy Harvesters

The strategic watch-out, growing slowest as designers increasingly favour piezoelectric and RF sources over electromagnetic and electrostatic harvesting lacking comparable power density across most industrial applications today. Limited design-in momentum constrains addressable volume exactly where growth elsewhere is fastest, threatening this segment's position over time.
Gross Margin: 17-31%

How Micro Energy Harvesting Design-Ins Commit

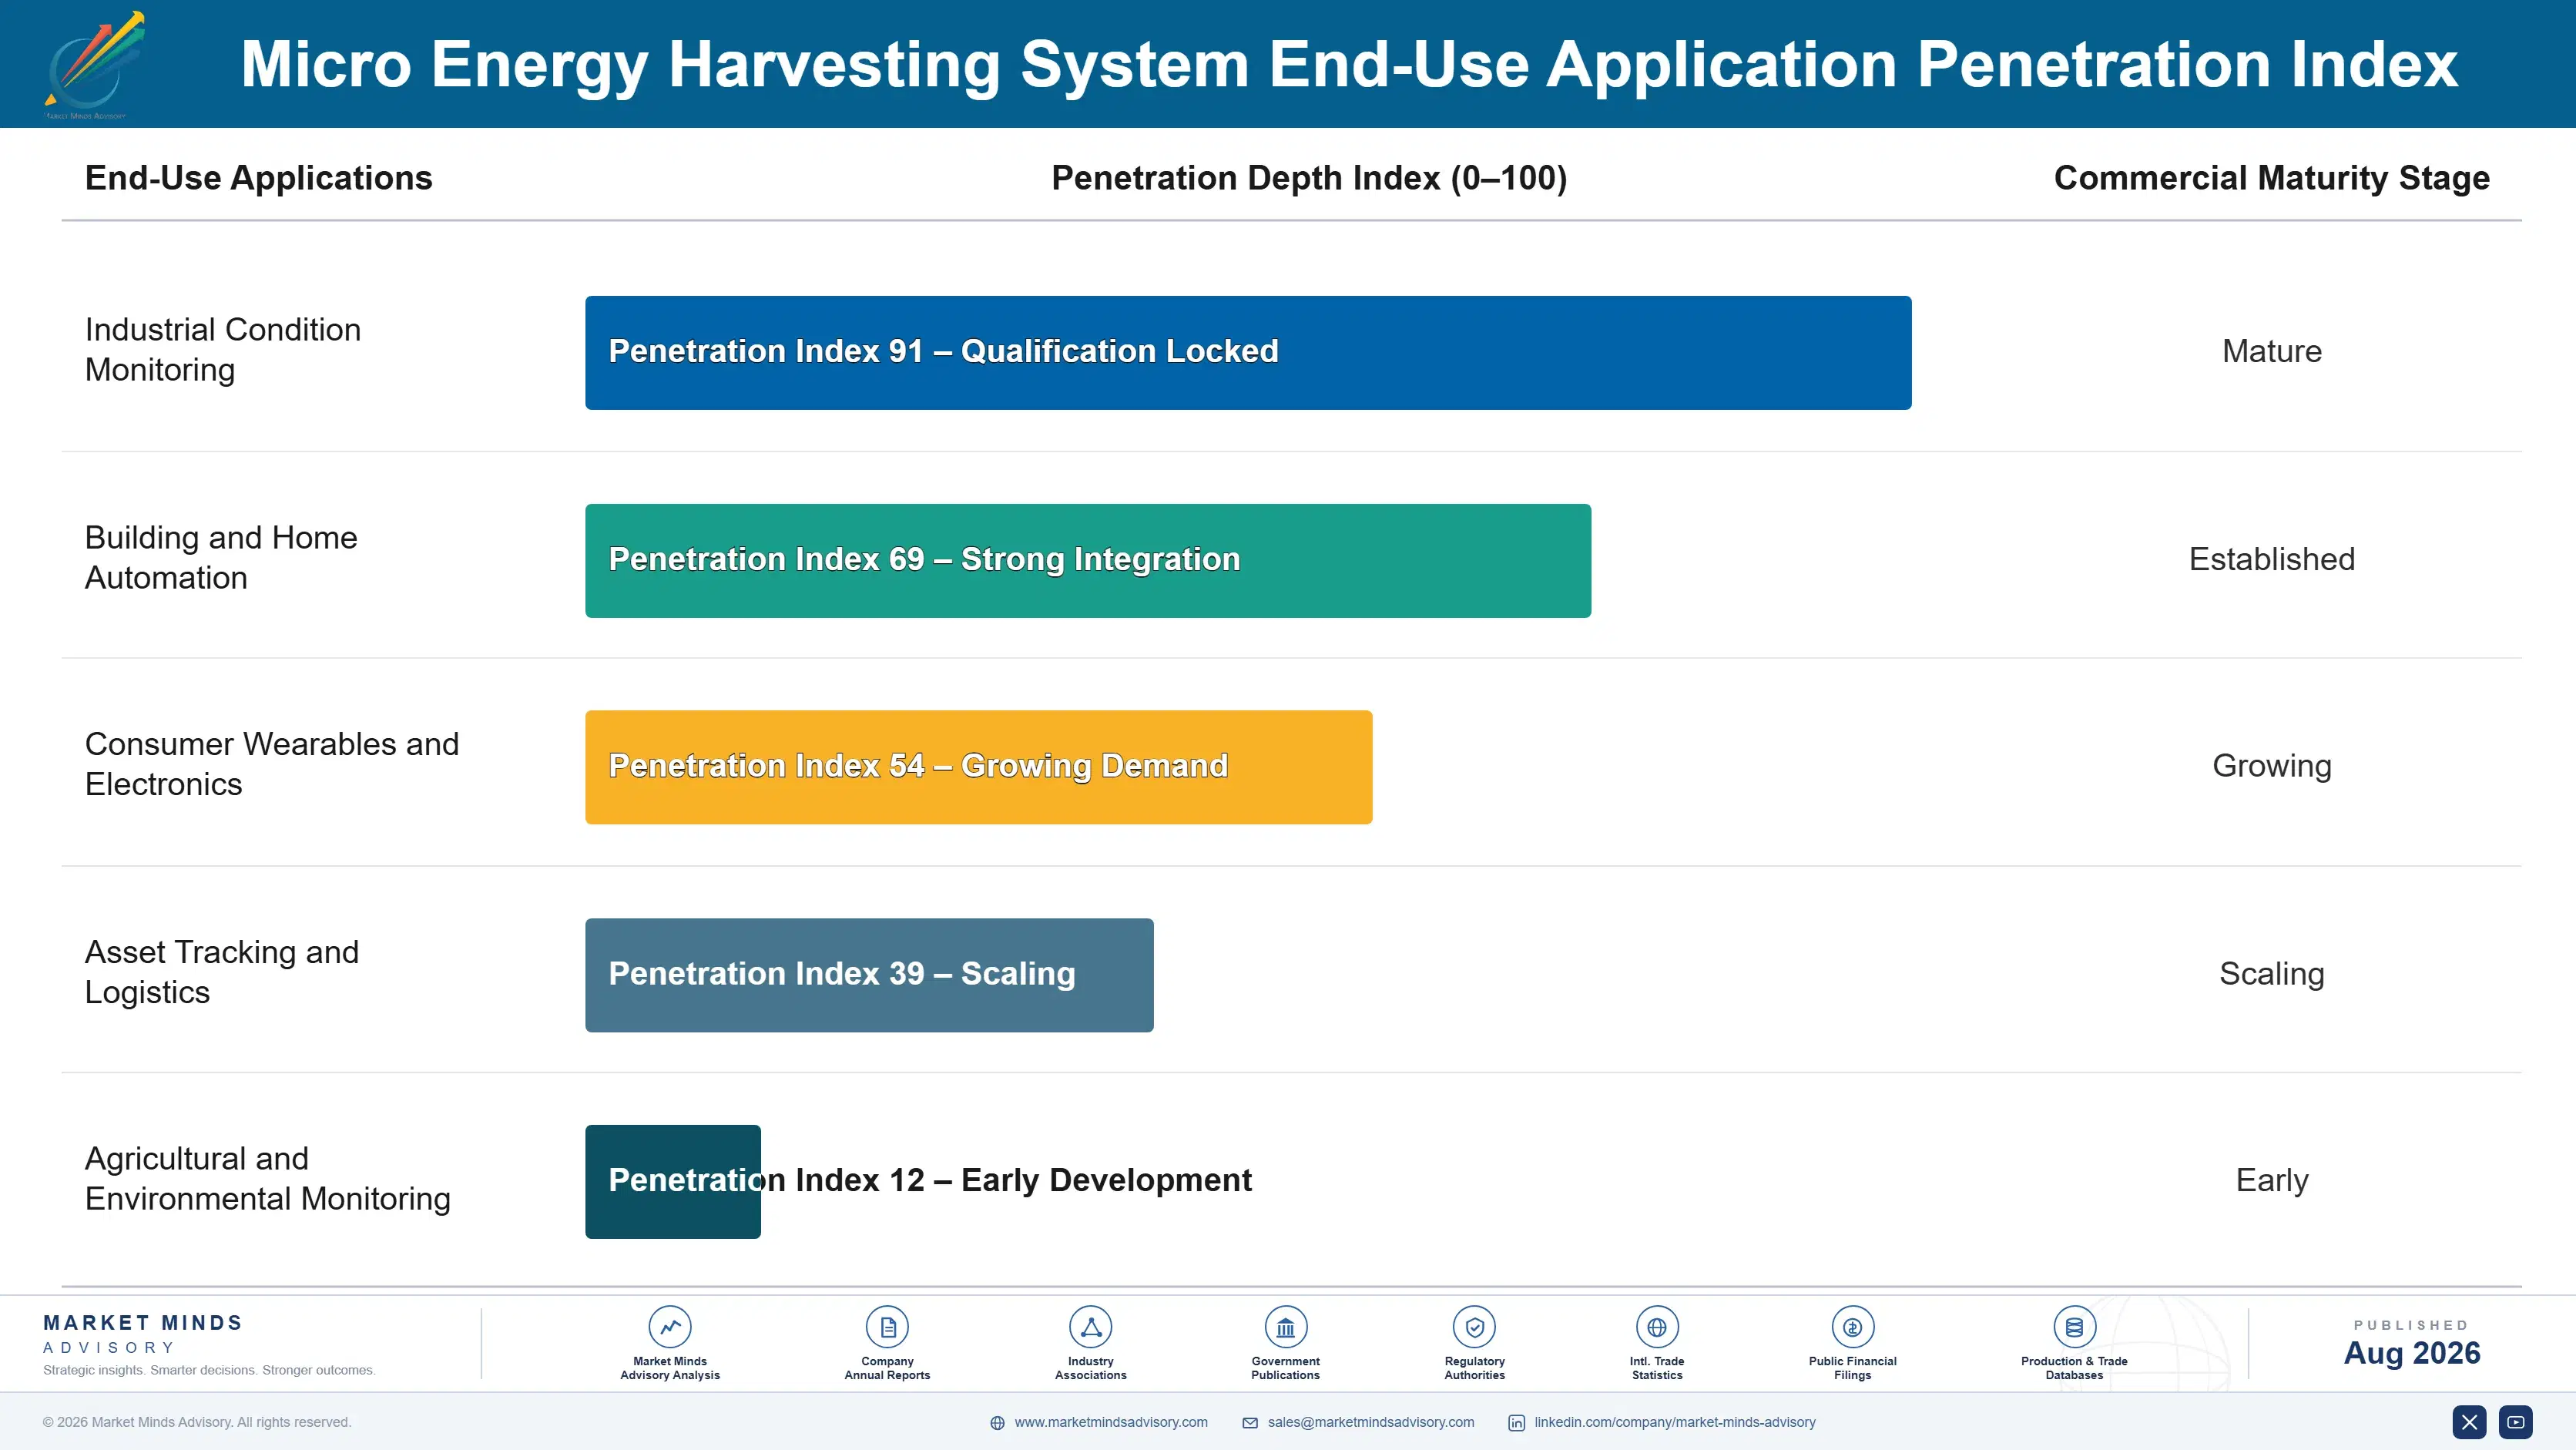
Revenue commits differently depending on which mechanism drives the purchase. Design-in wins lock in tightly once a sensor maker qualifies a harvesting component into a product design, since reorders continue automatically throughout that product's manufacturing lifecycle. Retrofit and replacement demand moves more slowly and stays genuinely reversible if a competing technology proves more cost-effective. Understanding which mechanism applies shapes both pricing power and retention expectations.
Adoption depth varies sharply by sensor maker scale. Large industrial sensor manufacturers go deepest, standardising harvesting across their product line once a design proves reliable in field deployment. Mid-sized makers adopt more selectively, often piloting a single product category before committing further engineering resources. Smaller makers weigh integration complexity most heavily, since limited engineering headcount makes power management design harder to absorb.

Buyer profiles have shifted from procurement engineers toward product design leads and reliability engineering functions with distinct priorities. A procurement engineer once compared unit cost directly; a product design lead now tracks total design integration effort, and a reliability engineering function drives specification against field failure data a purely cost-focused evaluation would never have prioritised. Vendors selling on component price alone find decisions made by engineers who never reviewed their field data.
micro-energy-harvesting-system-market-end-use-penetration-index-1787332292176

Our Call On Micro Energy Harvesting

These are among the four positions where our research anticipates prominent divergence between winners and laggards over the coming forecast period. Each is grounded in the demand model, the regulatory perimeter, and the announced capacity pipeline.
01 / REFERENCE DESIGN STRATEGY

Sell complete design solutions, not raw components

Vendors that supply complete reference designs pairing harvesting components with power management circuitry, rather than selling raw components alone, capture the sensor maker's entire power subsystem design win instead of just a single bill-of-materials line item. That positioning commands a premium of 25 to 40% over component-only sales, since sensor makers pay for reduced design risk and faster time to market as much as for the underlying hardware itself. Vendors should prioritise reference design depth now, because it is not quickly replicated.
02 / FIELD-TESTED PERFORMANCE CREDIBILITY

Publish honest field data before rivals win on trust

Sensor makers increasingly demand honest real-world performance data rather than laboratory-rated output figures, since deployment failures traced back to overstated harvester specifications damage a vendor's credibility across their entire customer base for years afterward and are hard to repair. Vendors who invest in extensive field characterisation across realistic operating conditions win specification trust that competitors relying purely on laboratory testing cannot match, often winning three times more design contracts. That credibility compounds as sensor makers reference published field data repeatedly.
03 / HYBRID MULTI-SOURCE DESIGN

Combine harvesting sources to guarantee power reliability

Hybrid designs combining two or more harvesting sources guarantee power availability across varying operating conditions that no single harvesting source can reliably deliver on its own in every installation scenario a customer might realistically face during deployment anywhere. Vendors who master multi-source integration capture applications too demanding for single-source harvesting alone, expanding their addressable market considerably beyond what a component specialist focused on just one technology can access. That capability cuts power failures by roughly half in demanding operating conditions.
04 / DESIGN SUPPORT STRATEGY

Build support programmes that reach underserved sensor makers

Smaller sensor makers, which lack in-house power management expertise, routinely avoid harvesting technology entirely rather than invest in the specialised engineering knowledge required to integrate it successfully into a new product design from scratch. Vendors who build dedicated design support programmes, including free reference schematics and application engineering assistance, cut a smaller customer's typical integration timeline by roughly 4 months on average. That support converts previously unreachable smaller customers into addressable demand that larger, self-sufficient sensor makers do not require to the same degree at all.

Engagement Snapshot From the Field

A live engagement with an industry participant carrying material or product regulatory and market exposure ahead of a defining policy shift, showing how our research translates into a defensible multi-year portfolio strategy.
MARKET MINDS ADVISORY · CLIENT ENGAGEMENT SUMMARY
Micro Energy Harvesting System Producer Strategic Portfolio Review and Transition Roadmap 2026·Investment Scenario on Micro Energy Harvesting System Exposure Evaluation 2025-26
CLIENT PROFILE
A mid-sized industrial sensor manufacturer engaged MMA while evaluating a shift to piezoelectric harvesting across its predictive maintenance sensor product line following rising customer complaints about battery replacement labour costs. The client reported annual sensor sales near USD 65 million and faced growing pressure from its largest customers to eliminate scheduled battery service entirely (client-reported, unverified by MMA).
STRATEGIC CHALLENGE
Switching to harvesting would eliminate battery replacement complaints, but the client's engineering team had no prior power management design experience and limited internal capacity to evaluate competing harvester vendors thoroughly. The board wanted cost certainty and a credible reliability case before committing to a full product line redesign involving significant engineering investment.
MMA APPROACH
MMA evaluated five candidate harvesting vendors against reference design completeness, field-tested performance data across the client's specific vibration profiles, and design support availability given the client's limited internal expertise. We modelled total integration cost including engineering time rather than component price alone. We then assessed each vendor's track record with comparable industrial sensor manufacturers.
KEY FINDINGS
  1. Only two of the five candidate vendors had field-tested performance data specific to the client's vibration frequency range and mounting configuration requirements.
  2. The recommended vendor's complete reference design cut projected engineering integration time by roughly 60% compared to sourcing raw components separately (client-reported, unverified by MMA).
  3. Battery replacement labour costs across the client's installed base exceeded projected harvesting hardware costs within roughly eighteen months of full deployment overall.
  4. A vendor selected purely on component price, without reference design support, would have added at least four additional months to the client's engineering timeline.
CLIENT PROFILE
A mid-sized industrial sensor manufacturer engaged MMA while evaluating a shift to piezoelectric harvesting across its predictive maintenance sensor product line following rising customer complaints about battery replacement labour costs. The client reported annual sensor sales near USD 65 million and faced growing pressure from its largest customers to eliminate scheduled battery service entirely (client-reported, unverified by MMA).
STRATEGIC CHALLENGE
Switching to harvesting would eliminate battery replacement complaints, but the client's engineering team had no prior power management design experience and limited internal capacity to evaluate competing harvester vendors thoroughly. The board wanted cost certainty and a credible reliability case before committing to a full product line redesign involving significant engineering investment.
MMA APPROACH
MMA evaluated five candidate harvesting vendors against reference design completeness, field-tested performance data across the client's specific vibration profiles, and design support availability given the client's limited internal expertise. We modelled total integration cost including engineering time rather than component price alone. We then assessed each vendor's track record with comparable industrial sensor manufacturers.
KEY FINDINGS
  1. Only two of the five candidate vendors had field-tested performance data specific to the client's vibration frequency range and mounting configuration requirements.
  2. The recommended vendor's complete reference design cut projected engineering integration time by roughly 60% compared to sourcing raw components separately (client-reported, unverified by MMA).
  3. Battery replacement labour costs across the client's installed base exceeded projected harvesting hardware costs within roughly eighteen months of full deployment overall.
  4. A vendor selected purely on component price, without reference design support, would have added at least four additional months to the client's engineering timeline.
RECOMMENDED STRATEGY
Phase 1: Phase 1 (0 to 3 months): Validate the recommended vendor's harvesting design against the client's specific vibration profile in laboratory testing. Phase 2: Phase 2 (3 to 9 months): Integrate harvesting into the client's flagship sensor product line and complete field validation testing. Phase 3: Phase 3 (9 to 18 months): Extend harvesting across the remaining product line and phase out battery-powered variants entirely and permanently.
OUTCOME
The client successfully eliminated battery replacement requirements across its flagship product line within the eighteen-month timeline, using the recommended vendor's complete reference design rather than sourcing components independently. Customer complaints about battery service dropped considerably, and the harvesting-first approach is now standard across all new sensor product development (client-reported, unverified by MMA).

Frequently Asked Questions

Foundational context covering the market sizes, CAGR, scope, country, region and competition that inform every finding below. This section is provided to cover basics and most often pre-purchase conversations, answered from the MMA Primary Research Dataset.

What is the current size of the Micro Energy Harvesting System Market?

The global micro energy harvesting system market is valued at USD 0.62 billion in 2025, covering piezoelectric, RF, photovoltaic, thermoelectric, and electromagnetic harvesting components for sensors. Conventional battery and wired power products are excluded.

How large will the Micro Energy Harvesting System Market be by 2036?

The market is forecast to reach USD 3.0 billion by 2036 in the base case, about 4.19 times the 2026 level. That represents incremental value of roughly USD 2.28 billion across the forecast decade.

What is the CAGR for the Micro Energy Harvesting System Market 2026 to 2036?

The market grows at a 15.4% CAGR in the base case, with bull and bear scenarios at 16.6% and 14.2%. The spread turns mainly on component cost decline and industrial sensor deployment pace.

Which segment is growing fastest?

Piezoelectric vibration harvesters grow fastest at 25.8%, about 1.68 times the overall rate, as industrial condition monitoring sensors proliferate across factory floors worldwide. RF and wireless power harvesters follow at 19.2%.

Who are the major companies in the Micro Energy Harvesting System Market?

Leading suppliers include STMicroelectronics, Texas Instruments, Analog Devices, EnOcean, and Infineon Technologies, holding roughly 24% between them. Vendors combining reference design depth with field-tested credibility are increasingly capturing premium positioning.

Which country is growing fastest?

Taiwan grows fastest at an 18.5% CAGR, building on advanced semiconductor and MEMS manufacturing depth supplying harvesting components globally. South Korea follows closely on comparable manufacturing scale.

Report Segmentation Architecture

The full report scope spans multiple orthogonal segmentation dimensions, with cross-tabulated demand data provided for each dimension pair. Coverage extends further to regional breakdowns, trend trajectories, and the competitive detail needed to support segment-level decision-making.

By Harvesting Technology

  • Piezoelectric Vibration Energy Harvesters
  • RF and Wireless Power Energy Harvesters
  • Photovoltaic Indoor Light Energy Harvesters
  • Thermoelectric Energy Harvesters
  • Electromagnetic and Electrostatic Energy Harvesters

By End-Use Application

  • Industrial Condition Monitoring
  • Building and Home Automation
  • Consumer Wearables and Electronics
  • Asset Tracking and Logistics
  • Agricultural and Environmental Monitoring

By Commercial Dimension

  • Direct Component Sales
  • Integrated Reference Design Licensing
  • OEM Design Partnership Agreements
  • Distributor Channel Sales

By Region

  • North America
  • Western Europe
  • East Asia
  • South Asia and Pacific
  • Latin America
  • Middle East and Africa
  • Eastern Europe

Scope, Methodology, and Coverage

Every figure in this report is reproducible from documented input assumptions. The scope below maps the historical period, the forecast horizon, the segmentation dimensions, and the countries covered, alongside the underlying primary and qualitative methodology.
Historical Period
2020 to 2025
Forecast Period
2026 to 2036
Base Year
2025 (USD billions; MMA Primary Research Dataset, August 2026)
Market Definition
The micro energy harvesting system market comprises devices and components that convert ambient environmental energy into usable electrical power for low-power sensors and electronics, valued at manufacturer selling prices. It spans piezoelectric vibration harvesters, RF and wireless power harvesters, photovoltaic indoor light harvesters, thermoelectric harvesters, and electromagnetic and electrostatic harvesters, including associated power management and reference design components. Conventional battery technology, wired power infrastructure, and large-scale renewable energy generation systems such as utility solar or wind installations are excluded from this scope entirely.
Quantitative Units
USD billions (current prices); unit shipments in millions by harvesting technology where applicable
Segmentation Dimensions
By Harvesting Technology; By End-Use Application; By Commercial Dimension; By Region
Regions Covered
North America, Western Europe, East Asia, South Asia and Pacific, Latin America, Middle East and Africa, Eastern Europe
Countries Covered
USA, Canada, Germany, France, UK, Italy, Spain, Netherlands, China, Japan, South Korea, Taiwan, India, Australia, Vietnam, Malaysia, Brazil, Mexico, Chile, Argentina, UAE, Saudi Arabia, South Africa, Egypt, Poland, Czechia, Hungary, Romania, and additional markets relevant to this sector
Key Companies Profiled
STMicroelectronics, Texas Instruments, Analog Devices, EnOcean, Infineon Technologies, Micropelt, Mide Technology, Ferro Solutions, Perpetuum, e-peas, Powercast, ABB, TDK Corporation, Murata Manufacturing, Fujitsu, Bionic Power, ReVibe Energy, Wisepower, Matrix Industries, Onchip Devices
Quantitative Methodology
Primary survey, n=3,800 respondents, Q4 2025, six countries; demand-side model with trade association cross-validation
Qualitative Methodology
47 expert interviews, Q4 2025; applied to validate demand model assumptions, identify emerging dynamics, and assess competitive positioning
Report Format
PDF and XLSX data workbook (Word format preview document)
Publisher
Market Minds Advisory
Report Code
MMA-2026-TEC-256
Published
August 2026
Contact
sales@marketmindsadvisory.com | www.marketmindsadvisory.com

Purchase the full Micro Energy Harvesting System Market Report (2026 to 2036).

The full MMA Micro Energy Harvesting System report sizes the market across five technology types, five end-use applications, and seven regions through 2036. It profiles 20 vendors on a consistent basis of harvesting component and system revenue, scoring each on reference design depth, field-tested performance credibility, hybrid multi-source integration capability, and design support reach. Scenario models quantify how industrial IoT deployment, component cost decline, and maintenance economics move both volume and achievable margin by technology type. The report also includes rare earth material supply chain risk mapping and field performance benchmarking.
Five-technology and five-application market sizing through 2036
Twenty-vendor benchmark on harvesting component revenue
Field-tested performance data benchmarking across technologies
Rare earth material supply chain risk mapping
Reference design and integration support coverage tracking
Hybrid multi-source architecture adoption tracking by application

Built For The People Who Decide

From boardroom strategy to bench-side execution, this report is read cover-to-cover by leaders shaping the next decade of their industry, turning demand scenarios, market dynamics and valuation benchmarks into decisions.
CXOs/ Presidents/ VPs/ Managers
M&A and Corporate Development
Strategy Teams and R&D Heads
Procurement and Product Directors
Regulatory and Compliance Leaders
Investor Relations and Equity Analysts