Market Minds Advisory
Micro Display Market

Micro Display Market: Micro Display Market. Trends and Forecast 2026 to 2036

AR smart glasses momentum, mixed reality headset adoption, and microLED brightness breakthroughs are pushing micro displays out of niche viewfinder applications toward mainstream wearable optics, rewarding makers who can shrink pixel pitch without sacrificing luminance.

Lead Analyst

Published

September 2026

Make Smarter Decisions with Customized Research Insights

Request a free sample report and evaluate market opportunities, growth trends, and competitive dynamics relevant to your business needs.

2025 MARKET VALUE$3.2BMarket Size 2025
2036 FORECAST VALUE$14.9BBase Case , 2026 to 2036
CAGR 2026 TO 203615.0 %Bull 16.3% / Bear 13.7%
INCREMENTAL OPPORTUNITY$11.2BNet 10- year value creation
EXPANSION MULTIPLE4.05x2036 value over 2026 base
Strategic Levers
M&A Pipeline
Regional Outlook
Country Rankings
Competitive Intelligence
Segmental Deep-dive
Call-Us : 91 93563 13602

Executive Snapshot and Market Trajectory.

Micro displays have moved from a specialized viewfinder and projector component into the core enabling technology for the entire augmented and mixed reality hardware category, as microLED brightness and efficiency gains finally make all-day wearable optics commercially realistic for mainstream consumers across the entire industry today and well beyond.
AR smart glasses momentum, mixed reality headset adoption, and expanding automotive head-up display applications are converging on microLED and micro-OLED panels that pack far higher pixel density and brightness into a smaller form factor than earlier microdisplay generations ever achieved before, while Chinese and Korean display manufacturers concentrate scarce engineering talent and manufacturing capacity within a handful of specialized panel makers serving global device brands directly across the entire industry.
Competitive intensity centers on a highly concentrated group of display specialists competing on pixel density and luminous efficiency rather than price alone, even as manufacturing yield challenges at microLED scale and slower-than-expected consumer AR headset adoption threaten to delay the mass-market inflection point the entire supply chain has been positioning around for years of sustained capital investment and engineering effort across every major device category worldwide.
Market Definition
The micro display market covers microLED, micro-OLED, LCoS, and DLP panels smaller than roughly one inch diagonal used in AR and VR headsets, viewfinders, projectors, and automotive head-up displays. It excludes conventional smartphone and television display panels and standalone projection lens systems sold without an integrated microdisplay chip.
Base Year Value
$3.2B in 2025 (MMA Primary Research Dataset, September 2026)
Forecast Period
2026 to 2036, eleven discrete annual values
CAGR
15.0% base case. Bull 16.3%. Bear 13.7%.
Fastest Growth Segment
MicroLED Displays for AR Smart Glasses and Headsets: 24.0% CAGR
Fastest Growth Country
China: 18.5% CAGR
Fastest Growth Region
South Asia and Pacific: 17.0% CAGR
Largest Region
East Asia: 50% of 2025 global value
Market Leaders
Leading suppliers: Sony, Samsung Display, BOE Technology Group, JBD, Kopin Corporation. Source: MMA Primary Research Dataset, July 2026.
Primary Survey
n=3,800 procurement and R&D decision-makers, Q4 2025, six countries
Methodology
Demand-side build-up, cross-validated against public data, 47 expert interviews

Micro Display Market Forecast Scenarios

micro-display-market-size-forecast-scenario-1790002592701
Between 2020 and 2025, micro display demand grew steadily as camera viewfinder and industrial projector applications provided a stable revenue base across the entire industry worldwide today, then accelerated meaningfully as early AR and mixed reality headset launches proved microLED and micro-OLED technology could deliver the brightness and efficiency wearable optics genuinely require for extended use.
The base case assumes continued AR and mixed reality adoption and rests on three commercial mechanisms: expanding consumer AR smart glasses shipment volumes requiring compact, efficient microdisplay panels across every price tier and geography, sustained mixed reality headset adoption across both consumer and enterprise customers, and automotive head-up display integration spreading from premium vehicles into mid-tier models, each reinforcing capacity investment in microLED fabrication through the back half of the forecast window.
A bull case built on faster-than-expected consumer AR glasses adoption and accelerating microLED yield improvement could push volumes meaningfully above trend, while a bear scenario tied to persistent manufacturing yield challenges and slower-than-expected headset sales would compress order backlogs and delay new microdisplay fabrication capacity qualification across major device categories worldwide and internationally over the coming years.

Micro Displays: Luminous Efficiency Sets the Economics

Micro display economics increasingly track luminous efficiency and pixel density simultaneously rather than either variable alone, since AR glasses genuinely require enough brightness to remain clearly visible outdoors in direct sunlight while also consuming little enough power to last an entire day of continuous wear without any recharge or battery swap of any kind whatsoever throughout the entire day.
MARKET CONCENTRATIONCR5 64%top five makers hold roughly two-thirds of orders
AVERAGE SELLING PRICE$45 per microdisplay unitpricing scales with pixel density and brightness level
TOP PRODUCING COUNTRY SHAREChina 36%leads volume ahead of Japan and South Korea
CAPACITY UTILISATION76%microLED fabrication lines run below ceiling amid yield issues
TRADE INTENSITY69% exportedfinished panels ship onward to global headset assemblers
FEEDSTOCK COST SHARE37%gallium nitride wafers and driver chips dominate input cost
Pricing rewards makers who can hit both brightness and power efficiency targets at high pixel density simultaneously across an entire product line and diverse global customer base worldwide today, so microLED specialists with proven small-pixel mass transfer processes command a durable premium over LCoS competitors still relying on older, less efficient display technology built for entirely different applications and use cases altogether across the entire industry.
Gallium nitride wafer and driver chip costs move with broader compound semiconductor supply cycles rather than microdisplay-specific demand, which means margin timing in this business often depends more on upstream wafer availability and pricing decisions made many months ahead of actual production than on headset brand shipment announcements or consumer demand signals observed quarterly across the entire global industry today.
"Nobody buys AR glasses for the display, they buy them despite it if the display isn't good enough. Micro display quality is the single biggest reason consumer AR keeps missing its own adoption timeline."
Director, Display Technology and Wearables Practice · MMA Technology Practice · September 2026

Market Trends

MicroLED Mass Transfer Yield Improvement Accelerates Cost Reduction

MicroLED mass transfer yield, the process of moving millions of microscopic LEDs onto a display backplane, has improved from roughly 90 percent to more than 99.9 percent at leading manufacturers over the past three years, dramatically reducing the defect rate that historically made microLED panels prohibitively expensive to produce at scale. This yield improvement directly translates into lower per-unit manufacturing cost, since each defective pixel previously required either costly repair or complete panel rejection during final inspection. Manufacturers who mastered high-yield mass transfer earliest are now positioned to undercut competitors still working through yield ramp challenges on comparable pixel densities.
Market Impact: Shipments surpassed 6 million units
Automotive Head-Up Display Adoption Expands Beyond Premium Vehicles

Head-up display adoption in new vehicles surpassed 18 percent of global production in 2025, up from under 8 percent five years earlier, as microdisplay cost reduction made the feature commercially viable for mid-tier vehicle trims rather than remaining confined to luxury models. This automotive expansion has created a demand channel with different technical requirements than consumer AR applications, favoring durability and temperature tolerance over the absolute brightness and power efficiency that headset applications prioritize most heavily. Suppliers who can serve both automotive and consumer AR requirements simultaneously are capturing design wins that specialists in either category alone cannot match.
Market Impact: Enterprise deployment reached 2.4 million units

Market Opportunities and Growth Drivers

Consumer AR Smart Glasses Shipments Cross Meaningful Volume Threshold

Global consumer AR smart glasses shipments surpassed 6 million units in 2025, a threshold widely regarded within the industry as the point where component suppliers can justify dedicated production lines rather than treating microdisplay orders as custom, low-volume engagements. This volume milestone has attracted new entrants into microdisplay fabrication who previously viewed the category as too small to warrant capital investment. Suppliers who can scale production alongside this shipment growth are positioned to capture disproportionate share as the category moves from early adopter status toward genuine mainstream consumer electronics volume.
Market Impact: Yield stays below 60 percent

Enterprise Mixed Reality Deployment Sustains Premium Segment Demand

Enterprise mixed reality headset deployment for training, remote assistance, and industrial design applications reached roughly 2.4 million active units in 2025, sustaining demand for premium high-resolution microdisplay panels even as broader consumer AR adoption remains at an earlier stage of overall market development. This enterprise segment carries meaningfully higher average selling prices than consumer applications, since enterprise customers prioritize resolution and reliability over the aggressive cost targets consumer products require. Suppliers with established enterprise relationships are capturing steady, predictable revenue that helps fund research investment for future consumer product generations.
Market Impact: Adoption ran 30 percent below forecasts

Market Restraints and Challenges

MicroLED Manufacturing Yield Challenges Persist at Highest Densities

MicroLED panels at the highest pixel densities required for compact AR glasses still achieve first-pass yield below 60 percent at several manufacturers, well below the yield levels considered commercially sustainable for mass consumer production. The root cause is the fundamental difficulty of placing millions of microscopic LEDs, each smaller than a human red blood cell, without any placement defects across an entire panel. Manufacturers are exploring redundant pixel architectures and improved mass transfer equipment precision to narrow the yield gap, but neither approach has yet reached the reliability required for high-volume mainstream production.
Market Impact: Yield now exceeds 99.9 percent

Slower Than Expected Consumer AR Adoption Delays Investment Payback

Consumer AR smart glasses adoption has run roughly 30 percent below earlier industry forecasts published in 2022, delaying the volume ramp that microdisplay manufacturers had planned capacity investment around for this specific product category. The root cause is a combination of persistent price sensitivity among mainstream consumers and unresolved comfort and battery life limitations that earlier product generations have not fully addressed. Manufacturers are mitigating the friction by diversifying into automotive and enterprise applications that provide revenue independent of consumer AR adoption timing, though this diversification dilutes focus on the category's original growth thesis.
Market Impact: Head-up display adoption passed 18 percent
4 additional market trends, 3 additional growth drivers, and 3 additional restraints and challenges are covered in the full report. Contact sales@marketmindsadvisory.com to access the complete intelligence.

Segment CAGR and Growth Architecture

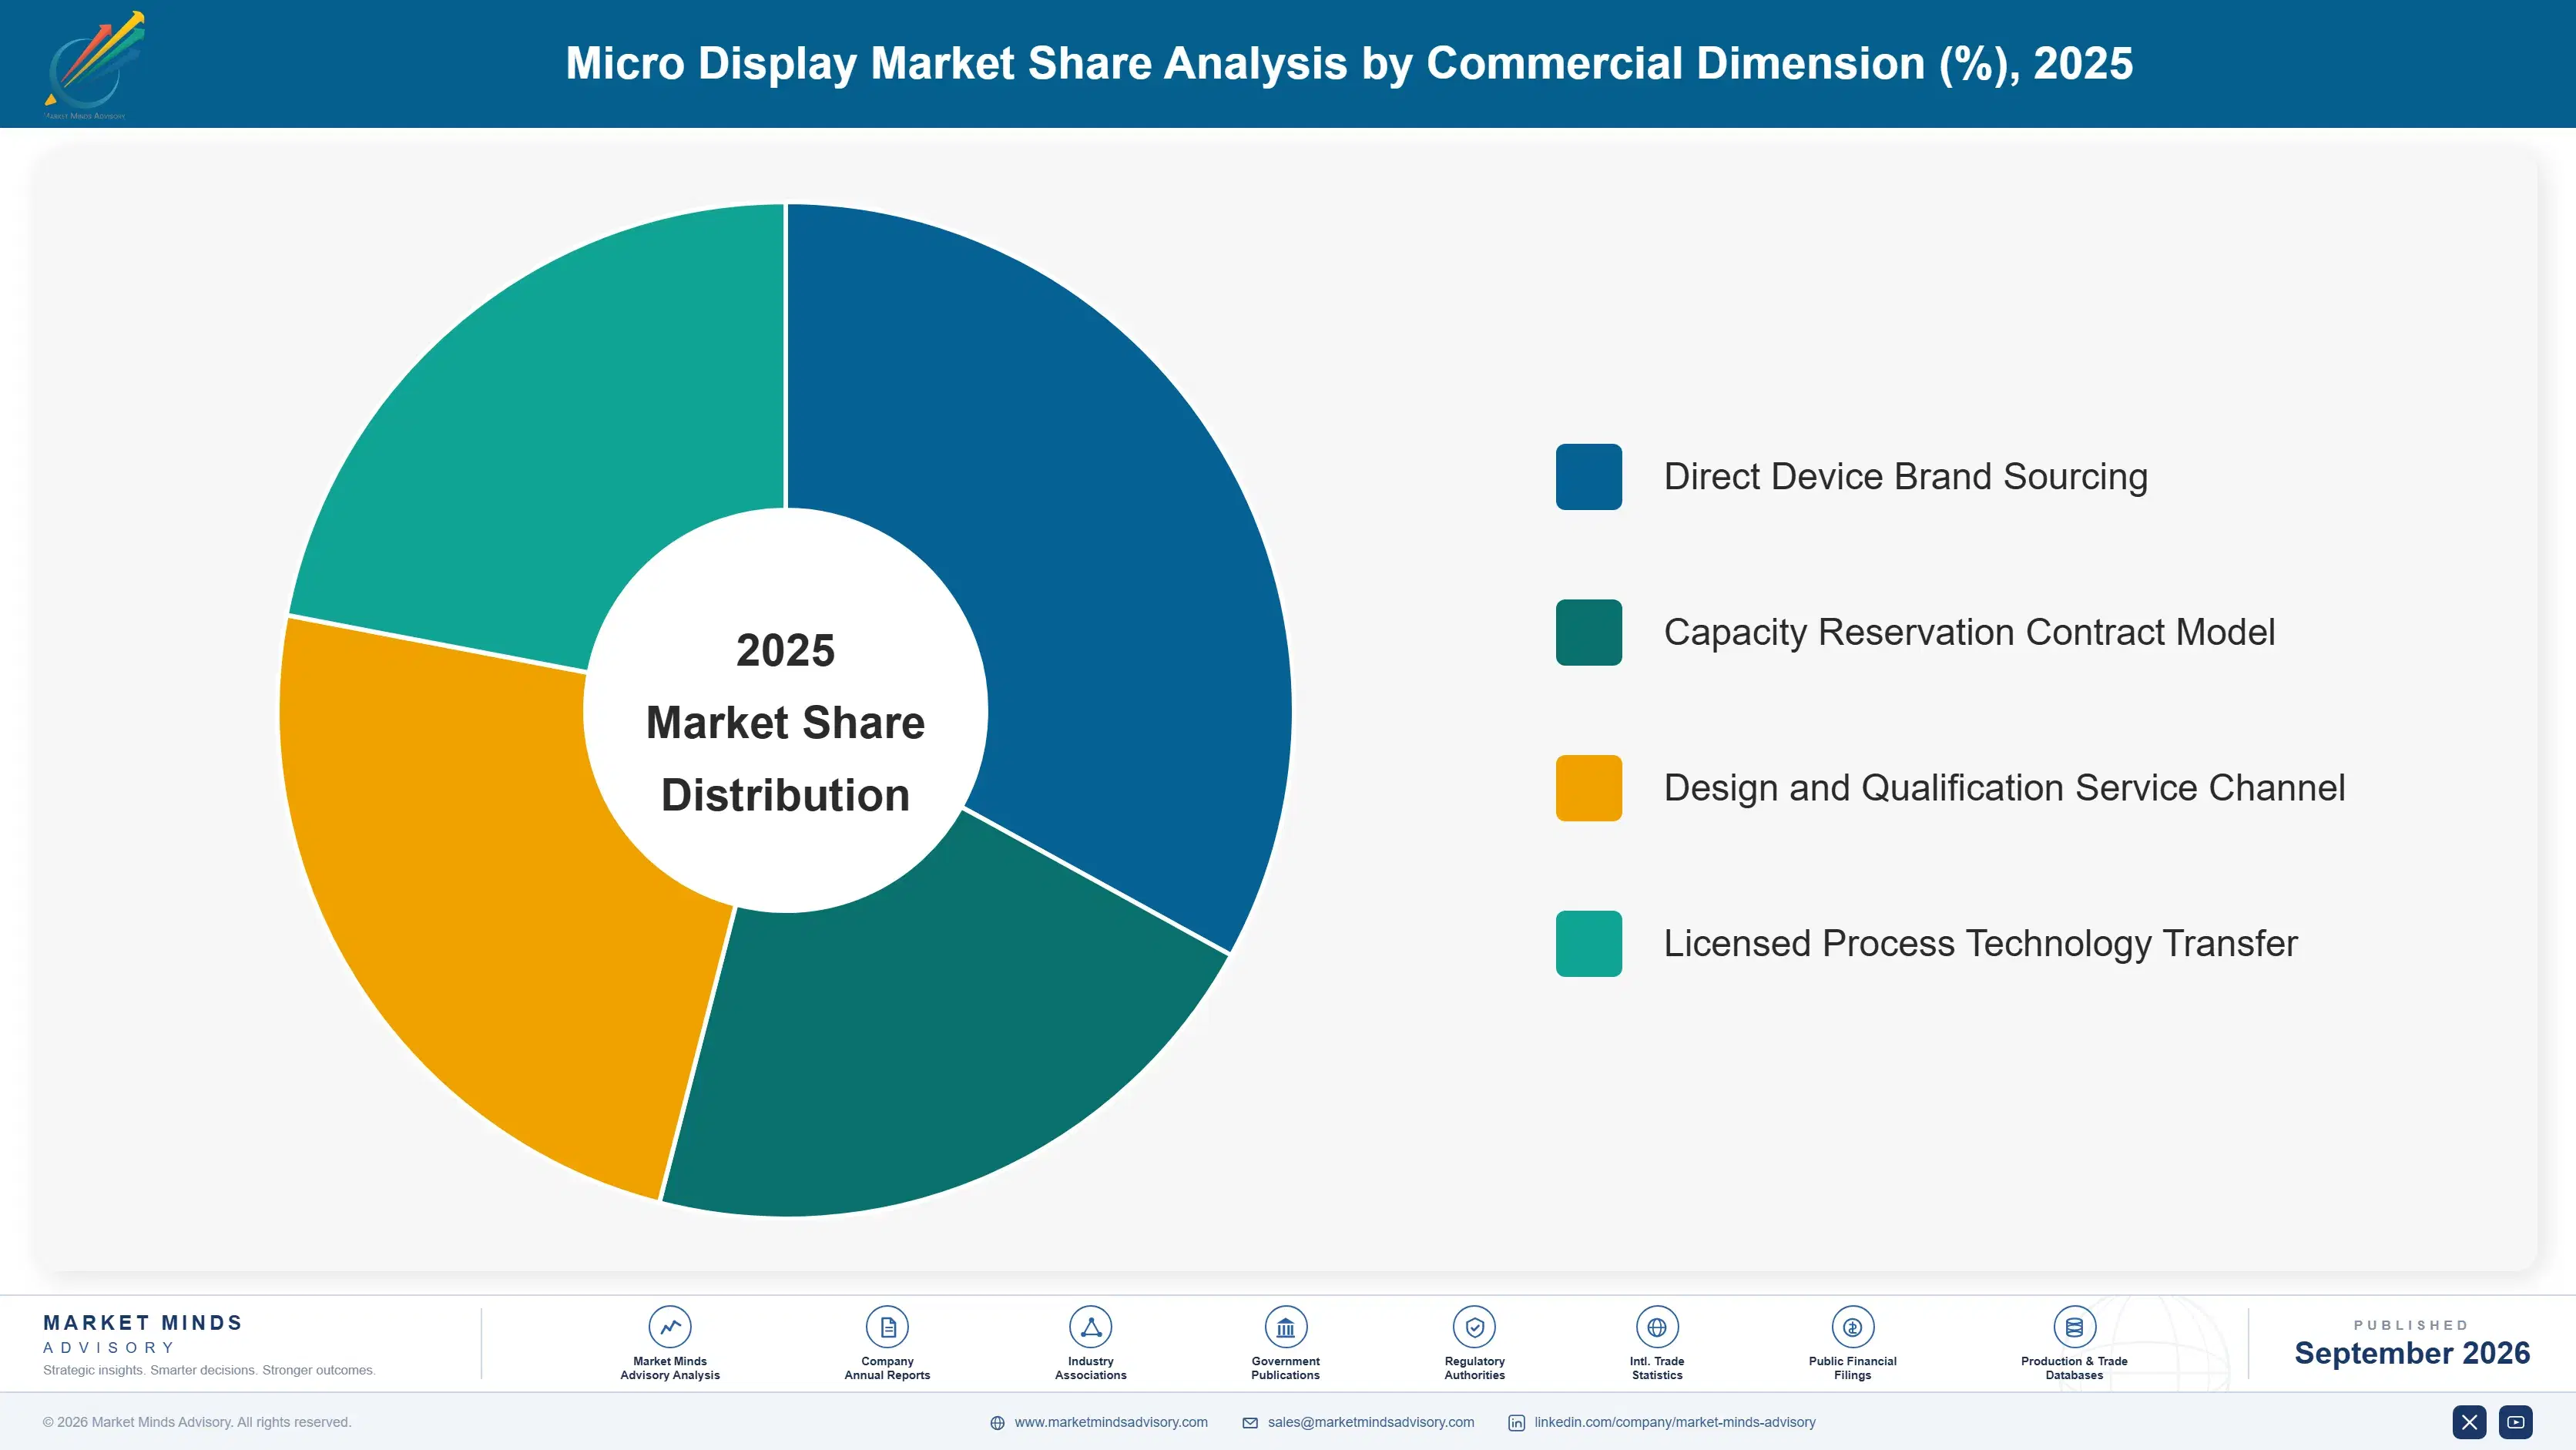
Micro displays are segmented here in this detailed comparative market analysis by panel technology rather than by end device category, since microLED, micro-OLED, LCoS, and DLP each carry distinct fabrication processes, cost structures, and brightness characteristics despite serving overlapping AR, VR, and automotive customer bases across every major geography worldwide today and well into tomorrow.
micro-display-market-market-share-analysis-1790002593581

MicroLED Displays for AR Smart Glasses and Headsets

MicroLED displays for AR smart glasses and headsets are the fastest-growing segment, expanding at 24.0 percent annually as brightness and power efficiency improvements finally make all-day wearable optics commercially realistic for mainstream consumers rather than early adopters alone across the entire global market today and every price tier available. This segment commands the industry's highest research and development intensity, since achieving sufficient outdoor brightness at extremely low power consumption remains the single hardest unsolved problem in consumer AR hardware development generally. Chinese and Korean manufacturers who mastered high-yield mass transfer earliest are capturing disproportionate share of design wins as major device brands finalize their next-generation smart glasses platforms and roadmaps.
CAGR 24.0%

MicroLED Displays for Automotive Head-Up Displays

MicroLED displays for automotive head-up displays are the second-fastest segment, growing at 19.0 percent as cost reduction from consumer AR-driven manufacturing scale makes the technology commercially viable for mid-tier vehicle trims rather than remaining confined to luxury models alone across the entire global automotive industry today and every major region worldwide. This segment benefits directly from shared manufacturing infrastructure with consumer AR applications, since automotive customers can apply cost improvements originally driven by smartphone and wearable device volume to their own production lines and platforms directly. Suppliers serving both automotive and consumer AR customers simultaneously are capturing design wins that single-application specialists cannot match on comparable cost structure or scale.
CAGR 19.0%
Full segment breakdown across 6 segments available in the complete report.

Regional Architecture and Country Demand Map

Micro display demand concentrates wherever display panel fabrication, AR headset assembly, and specialized microLED manufacturing all converge together at genuine national industrial scale, pulling a disproportionate share of total global microdisplay volume into East Asia well ahead of every single other region on the planet today.

North America

North America's share sits below the standard regional band because essentially no microdisplay fabrication capacity exists anywhere across the entire region today, a persistent gap reflecting the concentration of display manufacturing investment in Asia over multiple decades of continuous industry consolidation and capital investment. American technology companies design AR and mixed reality headsets domestically and specify microdisplay requirements to Asian suppliers, but physical panel fabrication happens almost entirely overseas under long-term supply agreements. United States enterprise mixed reality deployment for training and industrial applications provides steady demand independent of consumer AR adoption timing. This region's genuine contribution remains concentrated in device design and software rather than microdisplay manufacturing capability itself.
Share: 20% | CAGR: 16.0% (2026 to 2036)

Western Europe

Western Europe's share falls below the standard regional band because the region hosts no meaningful microdisplay fabrication capacity of its own today, a gap reflecting decades of consolidated Asian investment that European display manufacturers never seriously attempted to match at any comparable scale or cost structure across the entire continent. German automotive manufacturers specify head-up display microdisplay requirements for premium vehicle exports, sourcing finished panels from Asian suppliers under established procurement relationships. French and British enterprise customers deploy mixed reality headsets for industrial training applications, adding steady secondary demand across the entire region. The region's contribution remains concentrated in device design and automotive integration rather than physical microdisplay manufacturing capacity.
Share: 12% | CAGR: 13.5% (2026 to 2036)
Regional intelligence for 5 additional markets available in the complete report: East Asia, South Asia and Pacific, Latin America, Middle East and Africa, Eastern Europe. Contact sales@marketmindsadvisory.com.
micro-display-market-country-cagr-analysis-1790002594476

Brightness Precision and Recurring Design Support Revenue

Micro display makers can expand revenue well beyond per-panel sales by moving into design engineering support services for headset and AR glasses brands worldwide, long-term capacity reservation agreements with major device customers, proprietary mass transfer process licensing to smaller competitors, and bundled optical calibration services that competitors without proven high-yield production cannot easily replicate.

Design Engineering Support Services for Headset Makers

Makers who help headset designers optimize optical architecture and thermal management before production begins can charge separately for design engineering support, capturing revenue months before the first commercial panel ever ships to the paying customer directly. This pre-production engagement typically runs 8 to 12 months per programme and carries margins above 50 percent, well ahead of standard panel sales, because it draws on scarce optics and materials engineering expertise most competitors lack entirely. Customers who pay for design support also tend to award the resulting production volume to the same supplier.
Market Impact: Design support work carries margins above 50 percent

Long-Term Capacity Reservation Agreements for AR Brands

Makers who secure capacity reservation commitments from major AR and headset brands years ahead of actual production can charge a premium reflecting guaranteed delivery during periods of acute microLED shortage, effectively monetizing scarce fabrication slots as a standalone commercial asset worth defending over time. This approach has become increasingly valuable as microdisplay lead times stretch past 9 months during peak demand periods, turning guaranteed capacity into something customers will pay extra to secure. Makers with the largest reserved capacity positions increasingly command pricing power over customers desperate for near-term delivery.
Market Impact: Reserved capacity commands premiums during long 9-month waits

Licensing Proprietary Mass Transfer Process Technology

A small number of makers have developed proprietary mass transfer equipment and process technology that achieves industry-leading yield at high pixel density across the entire product portfolio and every generation, and some now license this technology to smaller regional competitors for an upfront fee plus a running royalty near 6 percent of licensee production revenue each year. This converts research investment into a second income stream without requiring additional capital expenditure on new physical fabrication capacity. Licensing also extends the technology's reach into markets where the original developer lacks direct manufacturing presence.
Market Impact: Royalty fees run near 6 percent of revenue

Bundled Optical Calibration and Certification Testing Packages

Beyond the panel itself, makers can bundle optical calibration, brightness uniformity testing, and reliability certification as a paid add-on package rather than folding these steps quietly into base panel pricing structures used elsewhere in the industry. Customers requiring formal qualification certificates for AR or automotive programme approval pay a premium of roughly 22 percent over standard panel fees for this bundled service, and the resulting test data often becomes reusable across multiple customer programmes at no incremental cost. This add-on has become a meaningful profit center for makers serving safety-critical customers.
Market Impact: Adds a 22 percent premium over standard fees

Who Controls the Margin Pool

Micro display supply sits in the hands of a highly concentrated group of Asian display specialists, with a CR5 near 64 percent that reflects how few firms hold both proven microLED mass transfer yield and the specialized fabrication infrastructure advanced panels require. The gap between the leading suppliers and mid-tier challengers is wide, since customers requiring AR-grade brightness and efficiency cannot easily switch away from proven high-yield production partners.
Current competitive activity centers on microLED yield improvement and mass transfer equipment development rather than incremental improvements to legacy LCoS and DLP product lines, since consumer AR glasses have become the industry's primary growth driver. Firms are differentiating through proprietary mass transfer process patents and through dedicated engineering teams embedded at major headset brand design centers well ahead of production.

Emerging pressure comes from Chinese domestic display makers who reward cost efficiency and vertical integration with device assembly over established brand relationships, opening space for aggressive new entrants outside the traditional Japanese and Korean supply base. Rankings could shift meaningfully if a mid-tier maker secures a major AR headset platform relationship or if microLED yield improvement accelerates faster than incumbent LCoS producers can respond.
micro-display-market-company-positioning-matrix-1790002595508

Competitive Moat and Risk Dimensions

SONY

Moat: Proven Micro-OLED Manufacturing Depth

Sony holds the industry's deepest manufacturing track record in micro-OLED technology for viewfinder and headset applications, giving it first access to premium mixed reality design cycles that require proven reliability at scale. Its process expertise, refined across multiple camera and display generations, lets it deliver contrast and color performance newer microLED entrants have not yet matched.
SONY

Risk: Slower MicroLED Transition Pace

Sony's deep investment in micro-OLED manufacturing infrastructure has made it comparatively slower to pivot toward microLED technology, the segment growing fastest in AR applications specifically. Competitors who invested earlier in microLED mass transfer capability are capturing AR smart glasses design wins that Sony's current product portfolio cannot yet address.
BOE TECHNOLOGY GROUP

Moat: Vertically Integrated Chinese Manufacturing Scale

BOE operates the largest integrated display manufacturing footprint in China, giving it cost advantages and domestic device assembler proximity that smaller specialized competitors cannot match. This scale lets BOE absorb the capital intensity of microLED capacity expansion more comfortably than pure-play microdisplay specialists lacking comparable balance sheet strength.
BOE TECHNOLOGY GROUP

Risk: Limited Brand Recognition Outside China

BOE's manufacturing scale advantage has not yet translated into comparable brand recognition or design relationships with Western AR headset makers, leaving it more dependent on Chinese domestic device brands than globally diversified rivals. Expanding Western customer relationships requires years of qualification and trust-building that established suppliers already possess.

Players Tracked

Prominent Players

Sony
Samsung Display
BOE Technology Group
JBD
Kopin Corporation

Other Key Players

eMagin Corporation
Himax Technologies
Raysolve Optoelectronics
Applied Materials
Aledia
Plessey Semiconductors
Porotech
MICLEDI Microdisplays
VueReal
Glo AB
LetinAR
Seeya Technology
Truly Semiconductors
Coretronic
Meta Materials

Recent Developments

FEBRUARY 2026

BOE Expands MicroLED Fabrication Capacity in China

BOE announced organic capacity expansion at its Chinese facility, adding new microLED fabrication lines dedicated entirely to AR smart glasses panel production. Funded through internal capital, the expansion should lift qualified microLED output roughly 35 percent once commissioned in late 2026, addressing sustained AR customer demand.
Signal: Signals sustained capital commitment to microLED scale leadership rather than pursuing entirely new market diversification bets.
AUGUST 2025

Sony Signs Multi-Year Mixed Reality Supply Agreement

Sony entered a multi-year supply agreement with a major mixed reality headset brand to provide micro-OLED panels for a new premium product platform spanning multiple generations. The agreement is a commercial supply contract rather than an acquisition or joint venture, marking Sony's largest single mixed reality commitment.
Signal: Confirms Sony's continued strategy of prioritizing premium mixed reality relationships well over cheaper consumer AR glasses.
NOVEMBER 2025

Kopin Acquires MicroLED Mass Transfer Technology Startup

Kopin completed the acquisition of a smaller microLED mass transfer technology startup focused on high-yield equipment for compact displays, adding proprietary transfer process capability to its product portfolio. The acquired firm's roughly 50 employees and existing patents transferred fully, giving Kopin immediate access to improved yield.
Signal: Confirms acquisition, rather than organic internal development, remains Kopin's clearly preferred route into new microLED capability.

Gallium Nitride Price Exposure in Panel Fabrication

Gallium nitride wafers and driver chips together account for roughly 37 percent of microdisplay cost of goods sold, with epitaxial wafer supply sourced primarily from Taiwanese and Japanese semiconductor makers while driver chip fabrication concentrates among a handful of specialty analog semiconductor producers holding genuinely limited spare capacity for sudden demand surges across the industry.
Gallium nitride wafer prices climbed more than 20 percent between 2024 and 2025 according to industry supply chain tracking data, as demand for microLED-grade epitaxial material outpaced available production capacity at qualified specialty foundries worldwide during this recent period of tight global supply and rising demand. The price increase disproportionately affected smaller microdisplay makers without long-term wafer supply agreements, forcing several to pass cost increases directly into customer pricing negotiations.

Larger microdisplay makers who secured multi-year gallium nitride supply agreements are insulated from these price swings in ways that smaller competitors buying on shorter-term contracts simply are not able to match. This gap widens further for makers competing in cost-sensitive viewfinder and industrial projector segments, where thinner margins leave less room to absorb sudden wafer cost increases without raising customer prices sharply.
micro-display-market-cost-volatility-analysis-1790002595869

Securing Multi-Year Gallium Nitride Wafer Supply Contracts

Larger makers are locking in multi-year gallium nitride wafer supply agreements with epitaxial producers rather than purchasing on the spot market, insulating themselves from price volatility that hits smaller competitors hardest during extended periods of tight global supply. This approach requires substantial upfront negotiation but pays back through predictable input cost over the long term.

Diversifying Driver Chip Sourcing Across Suppliers

Several manufacturers are qualifying alternative driver chip suppliers beyond their traditional sources to reduce dependence on any single analog semiconductor producer, even though these newer suppliers currently carry slightly higher qualification costs during initial testing phases each fiscal year. This diversification smooths supply continuity risk during future shortages or price spikes affecting the industry.

Portfolio Architecture for Margin Defence

Micro display margin economics separate cleanly along panel technology and pixel density rather than end application alone, with the widest gross margins concentrated in AI-grade microLED panels regardless of whether the customer is an AR glasses brand or an automotive head-up display integrator purchasing at scale. Legacy LCoS and DLP panels run on considerably thinner margins sustained by throughput rather than differentiation.
The tension between volume and premium tiers plays out most clearly in capital allocation decisions: every dollar spent scaling microLED mass transfer capacity pulls engineering resources away from mature LCoS and DLP production that still serves existing viewfinder and projector customers under long-standing supply contracts. Most established makers maintain both tiers simultaneously rather than fully committing capital to one over the other.

High-value margin pools concentrate overwhelmingly in microLED panels for AR glasses and automotive applications, where mass transfer yield barriers and process reliability track record keep new entrants out far more effectively than pricing power alone ever could achieve. Emerging next-generation brightness technology remains small today but is positioned to absorb a growing share of new capital investment as consumer adoption accelerates.

Volume / Commodity-Adjacent

Legacy LCoS and DLP microdisplay systems for projectors and industrial applications, running on high volume and thin unit margins sustained by throughput rather than pixel density or genuine brightness differentiation.
Gross Margin: 18-26%

Premium / Certified

MicroLED and micro-OLED panels for AR smart glasses, mixed reality headsets, and automotive head-up displays, where brightness, power efficiency, and mass transfer yield command a durable price premium over legacy display technology.
Gross Margin: 40-50%

Sustainability / Regulatory / Next-Generation

Next-generation microLED and hybrid display technology tied to future consumer AR platforms and extended reality applications, still small in volume today but drawing rising capital allocation from established makers positioning early.
Gross Margin: 44-56%
micro-display-market-portfolio-architecture-1790002596829

High-value Sub-segments and Strategic Watch-out

MicroLED Displays for AR Smart Glasses

The fastest-growing, highest-margin segment, driven by brightness and efficiency improvements enabling all-day wearable optics for mainstream consumers across the industry. Mass transfer yield barriers protect incumbent margins, and the segment is expected to absorb the largest share of new capital investment through the forecast window.
Gross Margin: 42-52%

MicroLED Displays for Automotive Applications

High-value and growing steadily as cost reduction from AR-driven manufacturing scale makes microLED head-up displays viable for mid-tier vehicles across every price segment and region worldwide today and tomorrow, with shared infrastructure between automotive and consumer applications compounding cost advantages for suppliers serving both markets simultaneously.
Gross Margin: 36-46%

Micro-OLED Displays for VR and Mixed Reality

The volume core of the market, sustained by ongoing mixed reality headset shipment volume and steady enterprise deployment demand across major global markets each year and budget cycle worldwide, though margins stay moderate because established panel technology faces competition from a wider pool of suppliers.
Gross Margin: 30-38%

LCoS Displays for Legacy Projector Applications

A strategic watch-out segment where accelerating adoption of microLED and micro-OLED alternatives could leave committed LCoS manufacturing capacity substantially underutilized well before existing long-term supply contracts naturally expire across the entire broader legacy supplier base entirely over the many coming years ahead ultimately and permanently.
Gross Margin: 16-22%

Recurring Revenue Beneath Panel Sales

Micro display revenue behaves less like a one-time component sale and more like an annuity once a design support engagement or capacity reservation agreement is secured, since multi-year headset platform commitments lock in repeat orders that persist well beyond the original qualification phase and complete design handoff.
Stickiness varies sharply by end-use vertical: AR glasses and mixed reality headset relationships carry the deepest lock-in because requalifying a new microdisplay supplier mid-platform can take years and risks disrupting an entire product roadmap and launch schedule, while viewfinder and projector customers are far more contestable since manufacturers routinely dual-source across two or three qualified suppliers each product cycle. Automotive head-up display relationships sit closer to headset stickiness, anchored by shared engineering roadmaps.

Buyer profiles are shifting generationally as procurement authority moves from pure component cost engineers toward optics and systems architects who weigh brightness performance and power efficiency far more heavily than unit price alone in every negotiation. This generational change favors incumbents with documented mass transfer yield track records over new entrants offering only lower cost, reshaping how future design contracts get awarded across the industry.
micro-display-market-end-use-penetration-index-1790002597731

Where Mass Transfer Yield Decides Position

These are among the four positions where our research anticipates prominent divergence between winners and laggards over the coming forecast period. Each is grounded in the demand model, the regulatory perimeter, and the announced capacity pipeline.
01 / MICROLED YIELD PRIORITY

Invest in Mass Transfer Yield Before Gap Widens Further

Makers without proven high-yield microLED mass transfer capability should invest decisively in process improvement immediately, before leading competitors finish widening the yield gap that increasingly decides which vendors can bid on AR glasses design cycles at all. Waiting even one product cycle risks permanent exclusion from the highest-margin segment of this entire market, a mistake genuinely difficult to reverse. Early movers who invested ahead of the yield race are already locking in multi-year customer agreements that latecomers cannot easily displace at this stage.
02 / AR GLASSES DESIGN SUPPORT

Build Design Engineering Support to Capture Recurring Revenue

Hardware-only makers should invest in design engineering support capability deliberately and soon, since pre-production engagement fees generate meaningfully more revenue over the relationship lifetime than a single panel sale ever could produce alone. Developing credible optics and thermal engineering expertise takes real investment and demands sustained commitment most smaller competitors will simply not make voluntarily given the uncertain near-term payback timeline. Firms that clear this bar first should expect to hold meaningful customer relationship advantages over hardware-only rivals for years afterward.
03 / AUTOMOTIVE DIVERSIFICATION STRATEGY

Pursue Automotive Head-Up Display Design Wins for Diversification

Makers focused exclusively on consumer AR should pursue automotive head-up display design wins deliberately and without any further delay, since automotive demand provides revenue independent of consumer AR adoption timing that has repeatedly disappointed industry forecasts in recent years. This is no longer a discretionary product decision given how quickly cost reduction is making microLED viable for mid-tier vehicles worldwide. Competitors with automotive design wins already secured will simply capture revenue that AR-only rivals cannot access during slower consumer adoption periods.
04 / GALLIUM NITRIDE SUPPLY SECURITY

Diversify Gallium Nitride Sourcing Before the Next Shortage

Firms weighing supply chain resilience should evaluate select alternative gallium nitride wafer sourcing carefully and methodically over an extended planning horizon spanning several years, particularly where diversified suppliers could offset exposure to future epitaxial material shortages meaningfully over time. This diversification carries real quality risk during initial qualification and should not be treated as a near-term cost reduction measure alone. It functions best as an option on future supply security rather than a present-day cost optimization strategy for most makers.

Engagement Snapshot From the Field

A live engagement with an industry participant carrying material or product regulatory and market exposure ahead of a defining policy shift, showing how our research translates into a defensible multi-year portfolio strategy.
MARKET MINDS ADVISORY · CLIENT ENGAGEMENT SUMMARY
Micro Display Producer Strategic Portfolio Review and Transition Roadmap 2026·Investment Scenario on Micro Display Exposure Evaluation 2025-26
CLIENT PROFILE
The client is a mid-tier AR glasses startup preparing to launch its first consumer product requiring lightweight, all-day-wearable microLED displays capable of outdoor visibility. The company had previously relied on off-the-shelf LCoS modules for its earlier prototype and had no prior sourcing relationship with microLED specialists. Its engineering team understood optical requirements broadly but lacked experience evaluating mass transfer yield claims from competing suppliers.
STRATEGIC CHALLENGE
The client needed to identify and qualify a microLED display supplier capable of meeting brightness and power efficiency targets within an aggressive ten-month product launch window tied to a fixed investor demonstration deadline. Existing supplier relationships in LCoS technology offered no relevant qualification pathway, and the client's engineering team had never evaluated mass transfer yield or gallium nitride supply terms before this specific programme.
MMA APPROACH
MMA conducted a structured supplier assessment across nine qualified microLED display vendors, screening for documented brightness and power efficiency performance, mass transfer yield track record, and available capacity for a startup-scale order volume. The assessment combined primary interviews with vendor engineering leadership and a review of each candidate's field performance data from comparable AR glasses programmes over the prior two years.
KEY FINDINGS
  1. Only three of nine assessed vendors held documented brightness performance data specific to the client's target outdoor visibility requirements and power budget.
  2. The client's initial preferred vendor lacked available capacity for startup-scale order volume within the required timeline, a gap that would have delayed launch by months.
  3. Recurring design support revenue, once modeled properly across the product's projected volume, represented roughly three times the value of the initial panel order alone.
  4. Two of the nine candidate vendors offered bundled optical calibration services that reduced the client's internal testing burden significantly ahead of the demonstration deadline.
CLIENT PROFILE
The client is a mid-tier AR glasses startup preparing to launch its first consumer product requiring lightweight, all-day-wearable microLED displays capable of outdoor visibility. The company had previously relied on off-the-shelf LCoS modules for its earlier prototype and had no prior sourcing relationship with microLED specialists. Its engineering team understood optical requirements broadly but lacked experience evaluating mass transfer yield claims from competing suppliers.
STRATEGIC CHALLENGE
The client needed to identify and qualify a microLED display supplier capable of meeting brightness and power efficiency targets within an aggressive ten-month product launch window tied to a fixed investor demonstration deadline. Existing supplier relationships in LCoS technology offered no relevant qualification pathway, and the client's engineering team had never evaluated mass transfer yield or gallium nitride supply terms before this specific programme.
MMA APPROACH
MMA conducted a structured supplier assessment across nine qualified microLED display vendors, screening for documented brightness and power efficiency performance, mass transfer yield track record, and available capacity for a startup-scale order volume. The assessment combined primary interviews with vendor engineering leadership and a review of each candidate's field performance data from comparable AR glasses programmes over the prior two years.
KEY FINDINGS
  1. Only three of nine assessed vendors held documented brightness performance data specific to the client's target outdoor visibility requirements and power budget.
  2. The client's initial preferred vendor lacked available capacity for startup-scale order volume within the required timeline, a gap that would have delayed launch by months.
  3. Recurring design support revenue, once modeled properly across the product's projected volume, represented roughly three times the value of the initial panel order alone.
  4. Two of the nine candidate vendors offered bundled optical calibration services that reduced the client's internal testing burden significantly ahead of the demonstration deadline.
RECOMMENDED STRATEGY
Phase 1: Phase 1 (Vendor Screening): Narrow the nine candidate vendors down to three finalists based on brightness performance and available capacity. Phase 2: Phase 2 (Field Validation): Commission independent outdoor brightness testing on all finalist samples before finally finalizing the entire vendor selection. Phase 3: Phase 3 (Contract Structuring): Negotiate a design-support-inclusive supply agreement with pricing tiers tied to future production volume growth milestones ahead.
OUTCOME
The client selected a vendor with documented outdoor brightness performance and completed field validation three weeks ahead of the investor demonstration deadline, securing the presentation on schedule. Reported battery life at target brightness exceeded internal targets according to client assessment, though exact figures remain (client-reported, unverified by MMA).

Frequently Asked Questions

Foundational context covering the market sizes, CAGR, scope, country, region and competition that inform every finding below. This section is provided to cover basics and most often pre-purchase conversations, answered from the MMA Primary Research Dataset.

What is the current size of the Micro Display Market?

The global micro display market reached an estimated $3.2 billion in 2025, driven by AR headset and mixed reality adoption. This base-year figure reflects MMA Primary Research Dataset estimates as of July 2026.

How large will the Micro Display Market be by 2036?

The micro display market is forecast to reach $14.89 billion by 2036, up from $3.68 billion in 2026. Growth is led by microLED AR glasses, automotive head-up displays, and mixed reality headset demand.

What is the CAGR for the Micro Display Market 2026 to 2036?

The micro display market is projected to grow at a 15.0 percent compound annual growth rate between 2026 and 2036. This reflects sustained AR and mixed reality hardware adoption across the forecast period.

Which segment is growing fastest?

MicroLED displays for AR smart glasses and headsets are the fastest-growing segment, expanding at 24.0 percent annually. That is roughly 1.6 times the overall market's 15.0 percent growth rate.

Who are the major companies in the Micro Display Market?

Major companies include Sony, Samsung Display, BOE Technology Group, JBD, and Kopin Corporation. These five firms hold a combined CR5 near 64 percent of global orders.

Which country is growing fastest?

China is growing fastest among individual countries, expanding at roughly 18.5 percent annually. Its microLED manufacturing scale and domestic AR device brands are pulling demand upward each year.

Report Segmentation Architecture

The full report scope spans multiple orthogonal segmentation dimensions, with cross-tabulated demand data provided for each dimension pair. Coverage extends further to regional breakdowns, trend trajectories, and the competitive detail needed to support segment-level decision-making.

By Primary Market Dimension

  • MicroLED Displays for AR Smart Glasses and Headsets
  • Micro-OLED Displays for VR and Mixed Reality Headsets
  • LCoS Displays for Projectors and Industrial Applications
  • MicroLED Displays for Automotive Head-Up Displays
  • Micro-OLED Displays for Camera Viewfinders
  • DLP-Based Microdisplay Systems for Projection

By End-Use Industry

  • Consumer Electronics and Wearables
  • Automotive
  • Enterprise and Industrial Training
  • Consumer Photography and Imaging
  • Defense and Specialized Computing

By Commercial Dimension

  • Direct Device Brand Sourcing
  • Capacity Reservation Contract Model
  • Design and Qualification Service Channel
  • Licensed Process Technology Transfer

By Region

  • North America
  • Western Europe
  • East Asia
  • South Asia and Pacific
  • Latin America
  • Middle East and Africa
  • Eastern Europe

Scope, Methodology, and Coverage

Every figure in this report is reproducible from documented input assumptions. The scope below maps the historical period, the forecast horizon, the segmentation dimensions, and the countries covered, alongside the underlying primary and qualitative methodology.
Historical Period
2020 to 2025
Forecast Period
2026 to 2036
Base Year
2025 (USD billions; MMA Primary Research Dataset, September 2026)
Market Definition
The micro display market covers microLED, micro-OLED, LCoS, and DLP panels smaller than roughly one inch diagonal used in AR and VR headsets, viewfinders, projectors, and automotive head-up displays. It excludes conventional smartphone and television display panels and standalone projection lens systems sold without an integrated microdisplay chip.
Quantitative Units
USD billions (current prices); unit shipment volume where applicable
Segmentation Dimensions
By Primary Market Dimension; By End-Use Industry; By Commercial Dimension; By Region
Regions Covered
North America, Western Europe, East Asia, South Asia and Pacific, Latin America, Middle East and Africa, Eastern Europe
Countries Covered
USA, China, Germany, France, UK, Japan, South Korea, India, Australia, Canada, Brazil, Mexico, Indonesia, Vietnam, Thailand, Malaysia, UAE, Saudi Arabia, South Africa, Nigeria, Turkey, Poland, Netherlands, Italy, Spain, Sweden, Switzerland, Argentina, Colombia, Singapore, and additional markets relevant to this sector
Key Companies Profiled
Sony, Samsung Display, BOE Technology Group, JBD, Kopin Corporation, eMagin Corporation, Himax Technologies, Raysolve Optoelectronics, Applied Materials, Aledia, Plessey Semiconductors, Porotech, MICLEDI Microdisplays, VueReal, Glo AB, LetinAR, Seeya Technology, Truly Semiconductors, Coretronic, Meta Materials
Quantitative Methodology
Primary survey, n=3,800 respondents, Q4 2025, six countries; demand-side model with trade association cross-validation
Qualitative Methodology
47 expert interviews, Q4 2025; applied to validate demand model assumptions, identify emerging dynamics, and assess competitive positioning
Report Format
PDF and XLSX data workbook (Word format preview document)
Publisher
Market Minds Advisory
Report Code
MMA-2026-TEC-967
Published
September 2026
Contact
sales@marketmindsadvisory.com | www.marketmindsadvisory.com

Purchase the full Micro Display Market Report (2026 to 2036).

The full report expands on every dimension summarized here, delivering complete segment-by-segment financial modeling, all seven regional profiles with country-level detail, and an extended competitive landscape covering all twenty profiled companies. It includes the complete methodology behind MMA's primary survey of 3,800 respondents and 47 expert interviews conducted across six countries in the fourth quarter of 2025. Buyers also receive downloadable data tables supporting every chart and figure referenced throughout the analysis. A dedicated appendix walks through the underlying assumptions behind every forecast scenario, and purchasers gain access to a live analyst briefing session to discuss findings directly.
Complete six-segment financial model, 2020 to 2036
All seven regional profiles with country detail
Twenty-company competitive benchmarking and profiling dataset
Primary survey and expert interview data tables
Live analyst briefing session included with purchase
Editable data appendix in spreadsheet format

Built For The People Who Decide

From boardroom strategy to bench-side execution, this report is read cover-to-cover by leaders shaping the next decade of their industry, turning demand scenarios, market dynamics and valuation benchmarks into decisions.
CXOs/ Presidents/ VPs/ Managers
M&A and Corporate Development
Strategy Teams and R&D Heads
Procurement and Product Directors
Regulatory and Compliance Leaders
Investor Relations and Equity Analysts