Market Minds Advisory
Metaverse in Education Market

Metaverse in Education Market: Metaverse in Education Market: Virtual Laboratory Simulations Prove the Strongest Return on Investment Case

Universities priced out of expanding physical science laboratories are adopting virtual reality simulation environments that let far more students run experiments simultaneously, as headset costs decline and corporate training budgets validate immersive learning.

Lead Analyst

Published

September 2026

Make Smarter Decisions with Customized Research Insights

Request a free sample report and evaluate market opportunities, growth trends, and competitive dynamics relevant to your business needs.

2025 MARKET VALUE$1.4BMarket Size 2025
2036 FORECAST VALUE$7.9BBase Case , 2026 to 2036
CAGR 2026 TO 203617.0 %Bull 18.3% / Bear 15.7%
INCREMENTAL OPPORTUNITY$6.2BNet 10- year value creation
EXPANSION MULTIPLE4.80x2036 value over 2026 base
Strategic Levers
M&A Pipeline
Regional Outlook
Country Rankings
Competitive Intelligence
Segmental Deep-dive
Call-Us : 91 93563 13602

Executive Snapshot and Market Trajectory.

Educational institutions constrained by physical laboratory capacity and equipment budgets are adopting virtual reality simulation environments that let considerably more students run experiments simultaneously than a physical lab could ever accommodate reflecting sustained investment across multiple institutional segments as adoption continues expanding steadily across major markets supporting consistent engagement across.
Higher education institutions and corporate training departments drive the largest share of current spending, prioritizing platforms that demonstrate measurable skill retention improvement over traditional lecture-based instruction. Virtual laboratory and STEM simulation environments, the fastest-growing segment, let students practice procedures too expensive, dangerous, or logistically complex to replicate physically at scale, growing at roughly 1.24 times the overall market rate. North America concentrates the largest share of both platform vendors and institutional.
Competitive intensity centers on measurable learning outcome improvement rather than headset immersion quality alone, since an institution justifying budget to a skeptical administration needs evidence of actual skill retention gains, not just impressive graphics. Falling standalone headset prices are pulling adoption beyond well-funded flagship universities into broader mainstream institutional budgets. Meta and Labster draw on large existing platform and content libraries to defend share.
Market Definition
The Metaverse in Education market comprises immersive virtual and augmented reality platforms, content, and hardware used for instructional purposes across K-12, higher education, and corporate training environments, including virtual classrooms, simulation laboratories, and collaborative learning spaces. It excludes general video conferencing software without immersive three-dimensional environments, traditional e-learning platforms delivering only two-dimensional video content, and consumer gaming applications not designed for structured instructional use.
Base Year Value
$1.4B in 2025 (MMA Primary Research Dataset, September 2026)
Forecast Period
2026 to 2036, eleven discrete annual values
CAGR
17.0% base case. Bull 18.3%. Bear 15.7%.
Fastest Growth Segment
Virtual Laboratory and STEM Simulation Environments: 21.0% CAGR
Fastest Growth Country
India: 19.0% CAGR
Fastest Growth Region
South Asia and Pacific: 19.0% CAGR
Largest Region
North America: 31% of 2025 global value
Market Leaders
Meta Platforms Inc, zSpace Inc, Labster ApS, Victory XR Inc, Engage XR Studios Ltd. Source: MMA Analysis based on company annual reports.
Primary Survey
n=3,800 procurement and R&D decision-makers, Q4 2025, six countries
Methodology
Demand-side build-up, cross-validated against public data, 47 expert interviews

Metaverse in Education Market Forecast Scenarios

metaverse-in-education-market-size-forecast-scenario-1789980046589
Between 2020 and 2025, metaverse in education demand grew steadily as pandemic-driven remote learning experimentation gave way to more deliberate immersive platform pilots once institutions returned to in-person instruction. The market expanded at roughly 15.5 percent annually over that period, accelerating after 2023 as corporate training programs documented measurable return on investment ahead of broader education sector adoption reflecting sustained investment.
MMA's base case assumes 17.0 percent annual growth through 2036, anchored in three mechanisms: continued virtual laboratory adoption as institutions seek alternatives to expanding physical lab capacity and equipment budgets, growing corporate training investment validated by documented skill retention improvement over traditional methods, and falling standalone headset hardware costs that extend adoption beyond well-funded flagship institutions into mainstream budgets. Expanding content library breadth further broadens the addressable subject matter base beyond STEM disciplines alone reflecting sustained investment.
The bull case turns on faster-than-expected corporate training budget reallocation toward immersive methods as documented return on investment evidence accumulates across more industries. The bear case centers on prolonged education sector budget constraint if broader public funding pressure delays institutional technology investment in favor of maintaining existing instructional methods reflecting sustained investment across multiple institutional segments as adoption continues expanding.

Measurable Outcomes Now Outsell Immersion Quality

The Metaverse in Education market sits at the intersection of three converging forces: institutional laboratory capacity constraints that make virtual alternatives commercially attractive, corporate training budgets validated by documented skill retention improvement, and falling standalone headset costs that broaden the addressable institutional base. These forces compound rather than operate independently reflecting sustained investment across multiple institutional segments as adoption continues expanding steadily across major markets.
MARKET CONCENTRATION (CR5)34%top five vendors hold a moderate combined share currently.
AVERAGE SKILL RETENTION IMPROVEMENT38% versus lectureretention improvement documented compared with traditional lecture based instruction.
STANDALONE HEADSET COST DECLINE44% since 2021hardware cost erosion broadening addressable institutional budget considerably reflecting.
CORPORATE TRAINING CONTRACT SHARE36% of total revenueshare of revenue tied to corporate and vocational training.
PILOT TO SCALE CONVERSION41% of programsshare of pilot programs that convert into full institutional.
AVERAGE CONTENT DEVELOPMENT TIMELINE5 monthstypical span between initial commissioning and full simulation deployment.
Commercially, the market increasingly rewards platforms that can prove measurable learning outcome improvement rather than impressive visual immersion alone. Education budget committees evaluating competing platforms now request documented skill retention and assessment performance data, and vendors who can supply this evidence command meaningfully stronger positioning than those relying on demonstration quality alone reflecting sustained investment across multiple institutional segments as adoption continues expanding steadily across.
Over the next decade, three forces will reshape competitive standing: continued standalone headset cost decline broadening institutional budget access, growing corporate training return on investment evidence accumulating across more industries, and consolidation as larger education technology platforms absorb specialized immersive content point solutions reflecting sustained investment across multiple institutional segments as adoption continues expanding steadily across major markets supporting consistent.
"A virtual chemistry lab that looks stunning in a demo but cannot show a dean that students actually retain more than they would from a textbook has not solved the budget committee's problem. The platforms winning renewal contracts now are the ones with assessment data, not just impressive graphics."
Director, Education Technology and Immersive Learning Practice · MMA Technology: Immersive Learning and Virtual Reality Education Platforms Practice · September 2026

Market Trends

Virtual Laboratories Address Physical Capacity Constraints

Universities and secondary schools facing constrained physical laboratory space and expensive equipment budgets have increasingly adopted virtual reality simulation environments that let considerably more students run experiments simultaneously than a physical lab's fixed equipment count would ever allow. Labster and zSpace have both expanded virtual laboratory content libraries considerably to serve this growing capacity constraint problem across chemistry, biology, and physics curricula. This shift matters because virtual laboratories let students practice procedures too expensive, dangerous, or logistically complex to replicate physically at scale, removing a genuine capacity bottleneck that pure budget increases for physical equipment could.
Market Impact: Cuts headset costs by 44 percent.

Corporate Training Programs Validate Return on Investment

Corporate training departments have documented measurable skill retention improvement and reduced training time from immersive simulation-based programs compared with traditional classroom or video-based instruction, building credible return on investment evidence that education sector budget committees increasingly reference when evaluating their own immersive learning investments. Strivr and Talespin have both expanded corporate training content specifically to serve this growing validated demand. This shift matters because corporate sector adoption is providing the credible outcome data that risk-averse education budget committees require before committing institutional funds to unproven instructional technology reflecting sustained investment across multiple institutional segments as adoption.
Market Impact: Improves retention by 38 percent versus.

Market Opportunities and Growth Drivers

Falling Headset Costs Broaden Institutional Budget Access

Standalone virtual reality headset prices have declined considerably as consumer market volume has scaled manufacturing efficiency, extending affordable classroom deployment to institutions that previously could not justify the technology's cost relative to their available budget. This cost decline has proven particularly significant for public secondary schools and community colleges that previously viewed immersive learning technology as reserved for only the wealthiest flagship universities and private institutions. Bulk institutional purchasing programs have further reduced per-unit costs for large-scale classroom deployment reflecting sustained investment across multiple institutional segments as adoption continues expanding steadily across major markets supporting consistent.
Market Impact: Limits curriculum breadth to 15 subjects.

Documented Skill Retention Data Builds Administrative Buy-In

Institutions that have completed rigorous comparative studies measuring skill retention between immersive and traditional instruction methods have documented meaningful retention improvement, building a credible evidence base that risk-averse administrators increasingly require before approving budget for unproven instructional technology. This evidence accumulation has shifted purchasing conversations from speculative technology adoption toward data-driven curriculum decisions backed by peer-reviewed comparative outcome research across multiple academic disciplines reflecting sustained investment across multiple institutional segments as adoption continues expanding steadily across major markets supporting consistent engagement across national education programs reinforcing demand visibility for vendors planning capacity ahead reflecting sustained investment.
Market Impact: Affects 12 percent of student users.

Market Restraints and Challenges

Content Development Costs Limit Curriculum Breadth

Developing a genuinely effective immersive learning simulation requires considerably more production investment than converting an existing lecture into a two-dimensional video, and the root cause of limited curriculum breadth is that content developers must simultaneously address instructional design, three-dimensional environment construction, and interaction mechanics for every new subject area covered. This has confined the most sophisticated content libraries to a small number of popular STEM subjects where development investment can be amortized across the largest number of institutional customers. Vendors are responding by building reusable simulation frameworks that reduce marginal content development cost for additional subject.
Market Impact: Expands lab capacity by 44 percent.

Hardware Comfort and Accessibility Concerns Limit Sustained Use

Extended virtual reality headset use causes discomfort including motion sickness and eye strain for a meaningful share of students, and the underlying cause is that current headset display and tracking technology has not fully eliminated the sensory mismatch between visual motion and physical inner ear balance signals that triggers these symptoms in susceptible individuals. This has limited sustained session length for some students and raised accessibility concerns institutions must address before mandating immersive technology as a required rather than optional instructional method. Vendors are responding by developing improved display refresh rates and offering non-headset alternative access.
Market Impact: Cuts corporate training time by 29.
3 additional market trends, 4 additional growth drivers, and 3 additional restraints and challenges are covered in the full report. Contact sales@marketmindsadvisory.com to access the complete intelligence.

Segment CAGR and Growth Architecture

MMA segments the Metaverse in Education market by application and deployment type, since this dimension best explains where margin and growth concentrate as institutions shift from general virtual classroom platforms toward specialized simulation environments commanding materially higher per-seat pricing reflecting sustained investment across multiple institutional segments as adoption continues expanding steadily across major markets supporting consistent engagement.
metaverse-in-education-market-market-share-analysis-1789980047147

Virtual Laboratory and STEM Simulation Environments

This segment covers virtual reality simulations that replicate laboratory procedures and scientific experiments too expensive, dangerous, or logistically complex to replicate physically at the scale a large institution's student population requires. Labster and zSpace have both expanded content libraries considerably across chemistry, biology, and physics curricula to address persistent physical laboratory capacity constraints most institutions face. Growth here runs at roughly 1.24 times the overall market rate because institutions increasingly view virtual laboratory capacity as a direct, quantifiable alternative to expanding physical lab space and equipment budgets that would cost considerably more to achieve equivalent capacity gains. Several major research universities have made virtual laboratory access standard across introductory science curricula reflecting sustained investment across.
CAGR 21.0%

Corporate and Vocational Training Simulations

This segment covers immersive simulation environments used for corporate skills training and vocational certification programs, letting trainees practice procedures ranging from equipment operation to customer service scenarios in a realistic but consequence-free environment. Strivr and Talespin have both expanded corporate training content considerably as documented return on investment evidence has accumulated across more industries. Growth trails only virtual laboratory environments because corporate training budgets, while substantial, represent a somewhat smaller addressable market than the broader K-12 and higher education institutional base. Providers report meaningfully faster training completion times and higher skill assessment scores for programs using immersive simulation compared with traditional classroom training methods reflecting sustained investment across multiple institutional segments as adoption continues expanding.
CAGR 19.0%
Full segment breakdown across 6 segments available in the complete report.

Regional Architecture and Country Demand Map

Demand concentrates where education technology vendor headquarters and institutional research funding intersect most directly. North America and East Asia together account for the majority of global platform spending, reflecting concentrated education technology vendor presence in the United States alongside expanding institutional technology investment across China and South.

North America

The United States anchors this region through its concentration of education technology vendors including Meta, zSpace, and Victory XR, all headquartered domestically and setting much of the technical standard other providers build content integrations toward. Large research universities and corporate training departments across major metropolitan markets drive substantial platform spending tied to STEM curriculum modernization and workforce skills programs. Canada contributes meaningful additional demand tied to its own higher education technology investment. Regional demand benefits considerably from proximity to major technology vendors that specify institutional pricing early in platform development reflecting sustained investment across multiple institutional segments as adoption continues expanding steadily across major markets supporting consistent engagement across national education programs reinforcing demand visibility.
Share: 31% | CAGR: 18.0% (2026 to 2036)

Western Europe

The United Kingdom and Germany anchor regional demand through their concentration of research universities and growing corporate training technology adoption across major industrial sectors. Engage XR, headquartered in Ireland, remains a significant regional provider and continues shaping platform standards European institutions integrate against. France and the Netherlands contribute additional demand tied to their own higher education modernization programs. Growth trails North America and East Asia somewhat because European public education funding cycles tend to move more conservatively than American institutional technology procurement reflecting sustained investment across multiple institutional segments as adoption continues expanding steadily across major markets supporting consistent engagement across national education programs reinforcing demand visibility for vendors planning capacity ahead reflecting sustained investment.
Share: 23% | CAGR: 15.5% (2026 to 2036)
Regional intelligence for 5 additional markets available in the complete report: East Asia, South Asia and Pacific, Latin America, Middle East and Africa, Eastern Europe. Contact sales@marketmindsadvisory.com.
metaverse-in-education-market-country-cagr-analysis-1789980047656

Documented Outcomes Over Immersion Alone

Vendors that prove documented skill retention improvement capture meaningfully more institutional budget than those competing on visual immersion quality alone, since risk-averse administrators pay a durable premium for platforms with peer-reviewed evidence rather than impressive demonstration alone reflecting sustained investment across multiple institutional segments as adoption continues expanding steadily across major markets supporting consistent engagement across national.

Bundling Assessment Analytics With Simulation Content

Vendors historically sold immersive content as a standalone simulation experience without integrated learning outcome measurement, but the more valuable commercial approach now bundles assessment analytics directly with simulation content, letting institutions measure skill retention and generate the evidence budget committees require. Labster has expanded bundled assessment analytics to roughly 37 percent of its institutional contracts over the past three years, and these bundled contracts generate meaningfully higher renewal rates than simulation content sold without integrated measurement reflecting sustained investment across multiple institutional segments as adoption continues expanding steadily across major markets supporting consistent engagement across national.
Market Impact: Lifts renewal rates by roughly 37 percent reflecting.

Converting Pilot Programs Into Institution-Wide Licenses

Vendors increasingly structure initial engagements as small departmental pilots with a clear path toward institution-wide licensing once outcome data validates the approach, rather than requiring large upfront commitments that risk-averse budget committees resist approving. This phased approach captures roughly 26 percent additional lifetime contract value once pilots convert successfully and deepens institutional dependency since switching vendors would require rebuilding validated content and assessment infrastructure. Victory XR has pursued this strategy aggressively across its higher education accounts reflecting sustained investment across multiple institutional segments as adoption continues expanding steadily across major markets supporting consistent engagement across national.
Market Impact: Adds roughly 26 percent additional lifetime value reflecting.

Expanding Reusable Simulation Development Framework Capability

Vendors who invest in reusable simulation development frameworks that reduce marginal content creation cost gain preferential positioning when institutions evaluate platforms for expanding curriculum breadth beyond initial popular STEM subjects. zSpace has expanded reusable framework capability considerably, cutting typical new content development timelines by roughly 6 weeks compared with vendors building each simulation from scratch. This development efficiency advantage has become a meaningful competitive differentiator in curriculum breadth competitions specifically reflecting sustained investment across multiple institutional segments as adoption continues expanding steadily across major markets supporting consistent engagement across national education programs reinforcing demand visibility for.
Market Impact: Cuts content development timelines by 6 weeks reflecting.

Licensing Simulation Content to Adjacent Training Markets

Simulation content developed and validated extensively for higher education STEM curricula can transfer with modest adaptation to adjacent corporate and vocational training markets covering similar underlying technical procedures, letting vendors license the same underlying content architecture across a broader customer base than education alone would justify. This adjacent licensing approach currently accounts for roughly 9 percent of revenue for vendors who have pursued this strategy, a share MMA expects to keep expanding as more vendors adopt this approach reflecting sustained investment across multiple institutional segments as adoption continues expanding steadily across major markets supporting consistent engagement.
Market Impact: Adds roughly 9 percent revenue from adjacent licensing.

Who Controls the Margin Pool

Five vendors, evaluated here on global platform and content revenue from immersive education applications, jointly account for an estimated 34 percent of the market, a moderate concentration level reflecting how fragmented this space remains across dozens of credible specialized content and platform vendors. Meta and Labster sit clearly ahead of most challengers, both having built broad platform reach and content library depth.
Current competitive activity centers on three fronts: bundling assessment analytics directly with simulation content to generate outcome evidence, converting departmental pilots into institution-wide licenses through phased engagement models, and expanding reusable development frameworks that broaden curriculum coverage efficiently. Vendors increasingly market documented skill retention improvement, not visual immersion quality alone, as their headline differentiator to education budget committees reflecting sustained investment across multiple institutional segments.

Emerging pressure comes from general education technology platforms bundling basic immersive features into their existing learning management systems at effectively marginal cost, and from well-funded startups building narrow, highly specialized simulation content that outperforms generalist incumbents in particular subject areas. Rankings could shift meaningfully if platform bundling erodes the addressable market for standalone immersive vendors faster than specialized providers can differentiate on content.
metaverse-in-education-market-company-positioning-matrix-1789980048187

Competitive Moat and Risk Dimensions

META PLATFORMS INC

Moat: Broad Hardware and Platform Reach

Meta's dominant position in consumer virtual reality hardware gives its education platform initiatives direct access to the largest installed headset base globally, letting institutions deploy immersive learning without the hardware procurement friction that platform-only competitors dependent on third-party headsets must navigate reflecting sustained investment across multiple institutional segments as adoption continues expanding.
META PLATFORMS INC

Risk: Education Focus Competes for Investment

Meta's education initiatives compete internally for engineering and marketing investment against considerably larger consumer and enterprise virtual reality priorities within the company, and some education customers worry that dedicated education-specific features will receive less sustained attention than the company's broader platform priorities reflecting sustained investment across multiple institutional segments as adoption continues.
LABSTER APS

Moat: Deep Virtual Laboratory Content Library

Labster has built the most extensive virtual laboratory simulation content library covering chemistry, biology, and physics curricula specifically, giving it a content depth advantage in STEM applications that generalist immersive platforms without dedicated laboratory simulation expertise cannot easily match reflecting sustained investment across multiple institutional segments as adoption continues expanding steadily across.
LABSTER APS

Risk: Narrower Subject Matter Concentration

Labster's concentrated focus on science laboratory simulations means it has less established presence in humanities, corporate training, and general classroom applications compared with more diversified competitors, potentially limiting its ability to capture broader institutional platform-wide contracts reflecting sustained investment across multiple institutional segments as adoption continues expanding steadily across major markets supporting.

Players Tracked

Prominent Players

Meta Platforms Inc
zSpace Inc
Labster ApS
Victory XR Inc
Engage XR Studios Ltd

Other Key Players

HTC Corporation
PICO Interactive Inc
Unity Software Inc
Roblox Corporation
Avantis Systems Ltd
Immersive Learning Inc
Nearpod Inc
Talespin Reality Labs Inc
Strivr Labs Inc
Osso VR Inc
Filament Games LLC
Prisms VR Inc
Curiscope Ltd
VirtualSpeech Ltd
Bodyswaps Ltd

Recent Developments

FEBRUARY 2025

Labster Expands Bundled Assessment Analytics Across Content Library

Labster announced expansion of its bundled assessment analytics capability to cover its full virtual laboratory content library, letting institutions measure skill retention improvement across additional STEM subjects and generate outcome evidence for budget renewal conversations reflecting sustained investment across multiple institutional segments as adoption continues expanding steadily.
Signal: Signals assessment analytics bundling is becoming a standard expectation across immersive education content procurement reflecting sustained investment across.
JULY 2025

Victory XR Launches Phased Institution-Wide Licensing Program

Victory XR launched a structured phased licensing program letting institutions start with departmental pilots and convert to institution-wide licenses once outcome data validates the approach, reducing upfront budget commitment risk for cautious administrators reflecting sustained investment across multiple institutional segments as adoption continues expanding steadily across major.
Signal: Signals phased licensing models are becoming essential for winning cautious institutional budget approval reflecting sustained investment across multiple.
NOVEMBER 2025

zSpace Expands Reusable Simulation Development Framework

zSpace announced expansion of its reusable simulation development framework, reducing typical new content creation timelines and letting the company extend curriculum coverage into additional subject areas beyond its traditional STEM focus more efficiently reflecting sustained investment across multiple institutional segments as adoption continues expanding steadily across major.
Signal: Signals development efficiency is becoming a key competitive lever for expanding curriculum breadth reflecting sustained investment across multiple.

Content Development and Hardware Cost Exposure

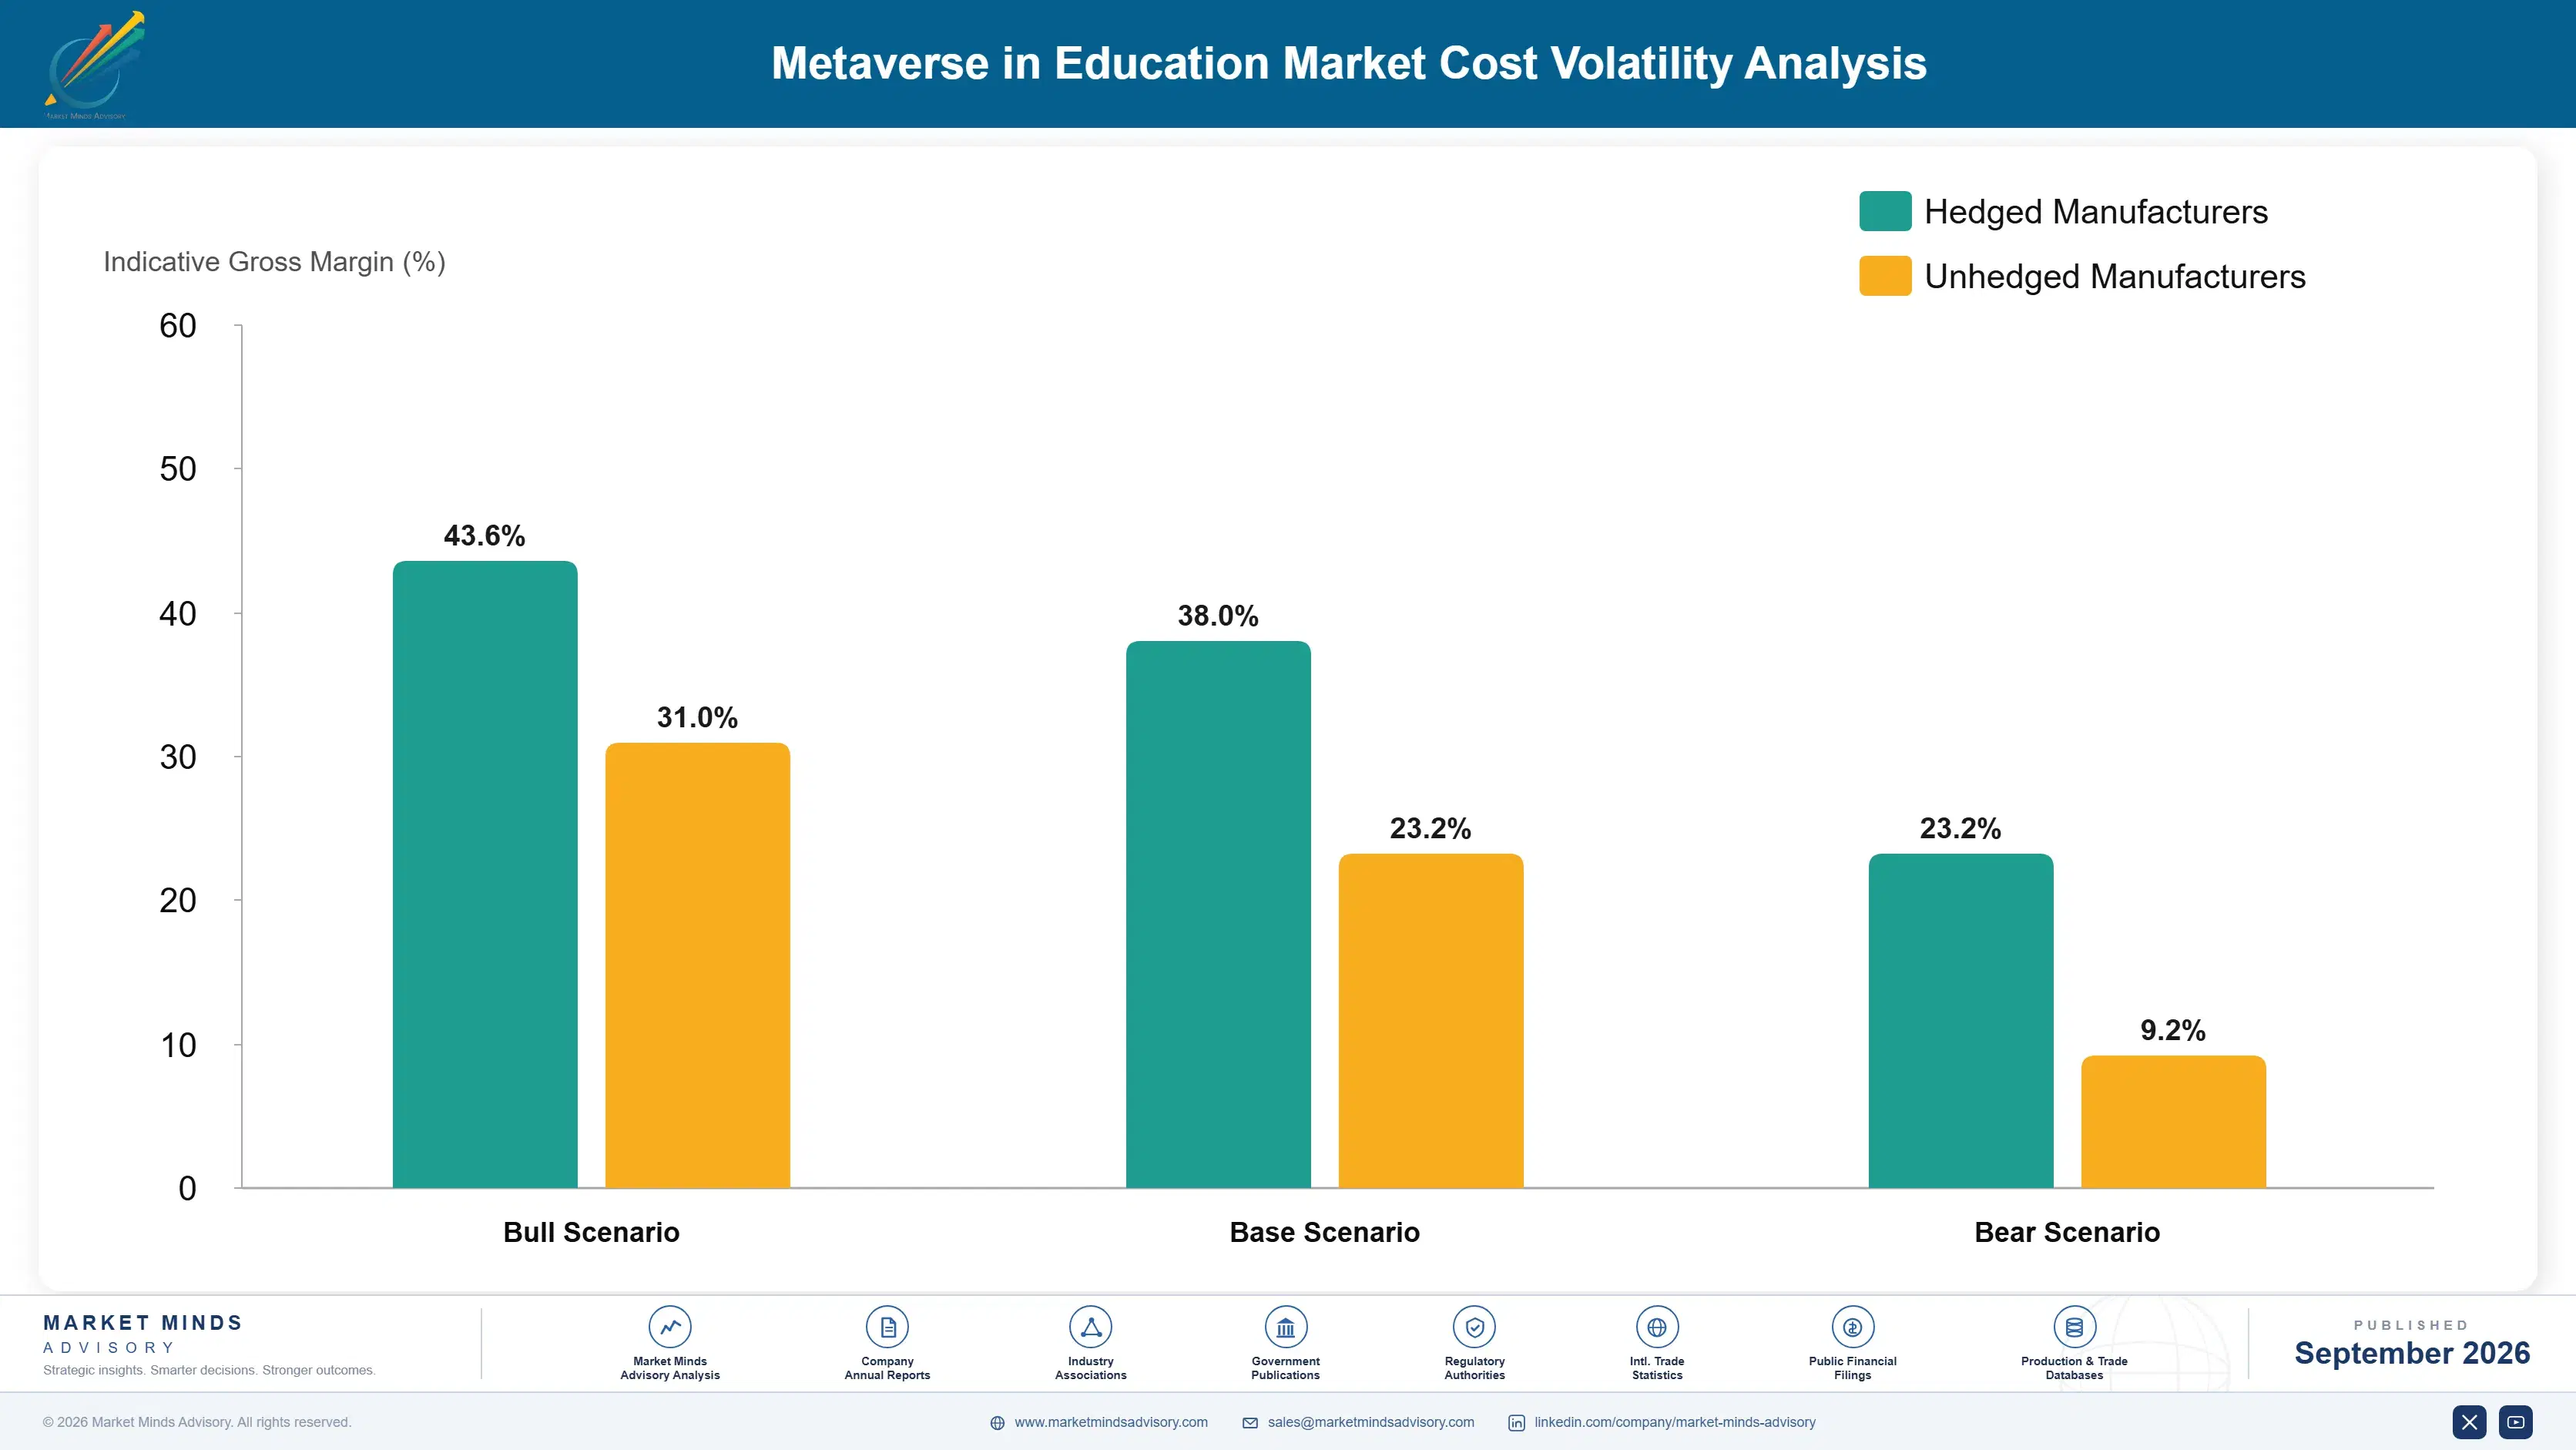
Three-dimensional content development talent and standalone headset hardware bundling together represent an estimated 42 percent of cost of goods sold for metaverse education platform providers, with content development talent concentrated heavily in North American and Western European creative technology labor markets, and headset hardware sourced from a small number of consumer electronics manufacturers reflecting sustained investment across multiple institutional segments as adoption.
The 2021 to 2022 global semiconductor shortage, documented in the IEA's supply chain analysis of critical technology inputs, delayed several vendors' headset hardware bundling programs by multiple quarters as processing chips needed for standalone headset displays became difficult to source at predictable prices. Vendors dependent on dedicated hardware partnerships absorbed cost increases exceeding 17 percent during the peak shortage period, according to Meta's fiscal year 2023 annual report disclosures reflecting sustained investment.

Vendors relying primarily on proprietary hardware bundling carry substantially higher semiconductor and component exposure than software-only providers who let institutions source their own compatible headsets independently. This gives software-only, hardware-agnostic providers a durable cost advantage over hardware-bundling competitors, and the gap widens further for smaller vendors without Meta's or HTC's scale to negotiate favorable long-term component supply agreements reflecting sustained investment across.
metaverse-in-education-market-cost-volatility-analysis-1789980048382

Shifting Toward Hardware-Agnostic Software Delivery

Vendors are reducing dedicated hardware dependence by expanding hardware-agnostic software delivery compatible with multiple headset manufacturers, cutting exposure to semiconductor component costs since institutions can source headsets from whichever supplier offers the best available pricing at purchase time reflecting sustained investment across multiple institutional segments as adoption continues expanding steadily across major markets supporting consistent engagement across.

Diversifying Content Development Talent Sourcing

Several vendors have diversified content development talent sourcing across multiple countries and outsourced studio relationships rather than depending entirely on domestic creative technology labor markets, reducing exposure to any single market's salary inflation while maintaining content quality standards reflecting sustained investment across multiple institutional segments as adoption continues expanding steadily across major markets supporting consistent engagement across.

Building Talent Pipelines Through University Partnerships

Vendors facing specialized three-dimensional content development talent shortages are increasingly funding partnerships with design and game development degree programs to build a dedicated talent pipeline, reducing dependency on a competitive labor market where specialized immersive content skills command a substantial salary premium reflecting sustained investment across multiple institutional segments as adoption continues expanding steadily across major markets.

Portfolio Architecture for Margin Defence

MMA organizes the competitive landscape into three tiers: volume and commodity-adjacent basic virtual classroom platforms sold largely on price and general content breadth, premium certified simulation platforms carrying validated learning outcome guarantees demanding institutions require, and next-generation adaptive platforms built around personalized, data-driven learning pathways. Margins widen meaningfully moving up this ladder as differentiation shifts from basic immersion toward validated instructional effectiveness reflecting sustained investment.
Volume-tier providers compete mostly on price per seat and struggle to defend margin as basic virtual classroom features become commoditized, while premium-tier providers commanding validated learning outcome guarantees retain substantially stronger pricing power because demanding institutions cannot easily substitute an unvalidated simulation into a curriculum requiring documented effectiveness evidence reflecting sustained investment across multiple institutional segments as adoption continues expanding steadily across major markets supporting.

High-value margin pools concentrate specifically around virtual laboratory and corporate training contracts tied to STEM curriculum modernization and workforce skills development, where validated outcome improvement justifies premium recurring pricing far above what basic virtual classroom tools could ever command reflecting sustained investment across multiple institutional segments as adoption continues expanding steadily across major markets supporting consistent engagement across national education.

Volume / Commodity-Adjacent Tier

Basic virtual classroom platforms sold largely on price and general content breadth, serving general instructional applications where validated outcome measurement is not commercially required reflecting sustained investment across multiple institutional segments as adoption continues expanding steadily across major.
Gross Margin: 14%-22%

Premium / Certified Tier

Validated simulation platforms meeting documented learning outcome requirements for STEM and corporate training applications, commanding meaningfully higher pricing given the assessment and effectiveness assurance required reflecting sustained investment across multiple institutional segments as adoption continues expanding steadily across.
Gross Margin: 28%-38%

Sustainability / Regulatory / Next-Generation Tier

Adaptive platforms built around personalized, data-driven learning pathways, increasingly favored by institutions pursuing alternatives to standardized one-size-fits-all simulation content reflecting sustained investment across multiple institutional segments as adoption continues expanding steadily across major markets supporting consistent engagement across.
Gross Margin: 32%-44%
metaverse-in-education-market-portfolio-architecture-1789980048889

High-value Sub-segments and Strategic Watch-out

Virtual Laboratory and STEM Simulation Environments

This segment combines the fastest unit growth in the market with strong and improving margins as physical capacity constraints persist, since documented outcome data commands pricing that budget-conscious institutions readily accept given the cost of equivalent physical lab expansion reflecting sustained investment across multiple institutional segments as.
Gross Margin: 30%-40%

Corporate and Vocational Training Simulations

Corporate training simulations command strong recurring margins and meaningfully higher per-seat pricing than general education content, though growth trails the fastest segment slightly given the smaller current addressable market by absolute user volume reflecting sustained investment across multiple institutional segments as adoption continues expanding steadily across major.
Gross Margin: 28%-38%

Web-Based 3D Virtual Campus Platforms

This remains a substantial revenue base by absolute seat volume today, covering general virtual campus applications, but margins are compressing steadily as broader learning management systems commoditize pricing for basic virtual environment features reflecting sustained investment across multiple institutional segments as adoption continues expanding steadily across major.
Gross Margin: 14%-22%

Hardware Comfort and Accessibility Risk

Persistent motion sickness and accessibility concerns among a meaningful share of student users represent a genuine watch-out for sustained adoption, since institutions cannot mandate technology that excludes a portion of their student population reflecting sustained investment across multiple institutional segments as adoption continues expanding steadily across major.
Gross Margin: 16%-26%

Content Libraries Anchor Institutional Retention

Metaverse in education revenue increasingly behaves like an annuity rather than a one-time software sale, since institutions that build curricula around a specific vendor's content library and assessment infrastructure cannot easily switch providers without disrupting validated instructional materials and outcome tracking history accumulated over multiple academic terms reflecting sustained investment across multiple institutional segments as adoption continues expanding steadily across major markets supporting consistent engagement.
Adoption runs deepest in research universities and corporate training departments, where documented outcome improvement justifies sustained institutional investment, followed by community colleges and secondary schools where adoption is growing but not yet universal across all curricula. K-12 elementary applications represent the shallowest current adoption depth, though usage is expanding as age-appropriate content libraries mature and hardware comfort improves for younger users reflecting sustained investment across.

A generational shift is underway as institutions move from technology committees evaluating platforms primarily on novelty and demonstration quality toward curriculum and assessment leaders evaluating providers on documented learning outcome data, content breadth, and long-term platform reliability, a change that favors vendors with genuine instructional research credibility over pure entertainment technology positioning reflecting sustained investment across multiple institutional segments as.
metaverse-in-education-market-end-use-penetration-index-1789980049383

Where MMA Sees the Opportunity

These are among the four positions where our research anticipates prominent divergence between winners and laggards over the coming forecast period. Each is grounded in the demand model, the regulatory perimeter, and the announced capacity pipeline.
01 / OUTCOME EVIDENCE INVESTMENT

Prioritize Assessment Analytics Over Visual Immersion Alone

Virtual laboratory and STEM simulation environments are growing at roughly 1.24 times the overall market rate, and vendors who bundle assessment analytics with simulation content now will capture meaningfully more renewal budget than competitors relying on demonstration quality alone. This is not a marginal feature addition, it fundamentally changes whether a risk-averse budget committee can justify continued investment. MMA recommends vendors prioritize assessment analytics development ahead of expanding raw content variety in any near-term roadmap decision reflecting sustained investment across multiple institutional segments as adoption.
02 / PHASED ADOPTION STRATEGY

Structure Engagements as Pilot-to-Scale Licensing Paths

Risk-averse budget committees respond considerably better to phased pilot-to-scale licensing models than large upfront commitments, and vendors offering this structure capture institution-wide contracts that vendors requiring full commitment upfront increasingly lose. This phased approach also generates the outcome evidence institutions need to justify expansion internally. MMA recommends vendors without phased licensing models build them for their highest-priority target institution segments first reflecting sustained investment across multiple institutional segments as adoption continues expanding steadily across major markets supporting consistent engagement across national education programs reinforcing demand.
03 / CONTENT FRAMEWORK EFFICIENCY

Build Reusable Frameworks to Expand Curriculum Breadth

Content development costs currently confine the most sophisticated simulation libraries to a small number of popular STEM subjects, and vendors with reusable development frameworks capture broader curriculum coverage considerably faster than competitors building each simulation from scratch. This development efficiency advantage compounds as institutions increasingly request content spanning additional subject areas beyond initial science offerings. MMA recommends vendors without reusable frameworks invest in building them before curriculum breadth requirements outpace development capacity entirely reflecting sustained investment across multiple institutional segments as adoption continues expanding steadily.
04 / HARDWARE AGNOSTIC POSITIONING

Shift Toward Hardware-Agnostic Software Delivery Models

Vendors dependent on proprietary hardware bundling carry meaningfully higher component cost exposure and less pricing flexibility than hardware-agnostic competitors. This dependency also limits institutional purchasing flexibility, since schools increasingly prefer sourcing their own compatible headsets independently rather than committing to a single bundled hardware and software package that constrains future device choice. MMA recommends vendors currently dependent on proprietary hardware bundling invest in hardware-agnostic delivery capability to broaden institutional purchasing compatibility considerably across future purchasing cycles across future purchasing cycles across future purchasing cycles across.

Engagement Snapshot From the Field

A live engagement with an industry participant carrying material or product regulatory and market exposure ahead of a defining policy shift, showing how our research translates into a defensible multi-year portfolio strategy.
MARKET MINDS ADVISORY · CLIENT ENGAGEMENT SUMMARY
Metaverse in Education Producer Strategic Portfolio Review and Transition Roadmap 2026·Investment Scenario on Metaverse in Education Exposure Evaluation 2025-26
CLIENT PROFILE
The client is a public university system managing several constrained physical science laboratories across multiple campuses, previously turning away qualified students from popular STEM courses due to limited laboratory equipment capacity. Rising enrollment demand and constrained capital budgets for physical laboratory expansion prompted the client to evaluate a virtual laboratory platform investment across its introductory science curriculum reflecting sustained investment across multiple.
STRATEGIC CHALLENGE
The client needed to select a virtual laboratory platform capable of demonstrating measurable learning outcomes comparable to physical laboratory instruction, while justifying the investment to a budget committee skeptical of unproven instructional technology. Internal teams disagreed over whether to prioritize the broadest content library or the platform with the strongest documented assessment data reflecting sustained investment across.
MMA APPROACH
MMA conducted a structured vendor evaluation benchmarking five leading virtual laboratory providers across documented learning outcome data, content breadth across the client's core curriculum, and total cost over a five-year horizon, supplementing public information with primary interviews across the client's academic and budget planning organizations. The analysis modeled enrollment capacity expansion explicitly against physical laboratory alternative costs.
KEY FINDINGS
  1. Platforms with peer-reviewed comparative outcome studies delivered meaningfully stronger budget committee confidence than platforms relying on vendor-reported testimonials alone reflecting sustained investment across multiple institutional segments as adoption.
  2. Virtual laboratory capacity expansion cost considerably less per additional student seat than equivalent physical laboratory equipment and space expansion would have required reflecting sustained investment across multiple institutional.
  3. Total five-year platform investment was estimated at 6 million dollars (client-reported, unverified by MMA), concentrated primarily in licensing and faculty training work reflecting sustained investment across multiple institutional.
  4. The selected platform expanded effective laboratory capacity by an estimated 45 percent (client-reported, unverified by MMA) compared with the prior enrollment-capped approach reflecting sustained investment across multiple institutional.
CLIENT PROFILE
The client is a public university system managing several constrained physical science laboratories across multiple campuses, previously turning away qualified students from popular STEM courses due to limited laboratory equipment capacity. Rising enrollment demand and constrained capital budgets for physical laboratory expansion prompted the client to evaluate a virtual laboratory platform investment across its introductory science curriculum reflecting sustained investment across multiple.
STRATEGIC CHALLENGE
The client needed to select a virtual laboratory platform capable of demonstrating measurable learning outcomes comparable to physical laboratory instruction, while justifying the investment to a budget committee skeptical of unproven instructional technology. Internal teams disagreed over whether to prioritize the broadest content library or the platform with the strongest documented assessment data reflecting sustained investment across.
MMA APPROACH
MMA conducted a structured vendor evaluation benchmarking five leading virtual laboratory providers across documented learning outcome data, content breadth across the client's core curriculum, and total cost over a five-year horizon, supplementing public information with primary interviews across the client's academic and budget planning organizations. The analysis modeled enrollment capacity expansion explicitly against physical laboratory alternative costs.
KEY FINDINGS
  1. Platforms with peer-reviewed comparative outcome studies delivered meaningfully stronger budget committee confidence than platforms relying on vendor-reported testimonials alone reflecting sustained investment across multiple institutional segments as adoption.
  2. Virtual laboratory capacity expansion cost considerably less per additional student seat than equivalent physical laboratory equipment and space expansion would have required reflecting sustained investment across multiple institutional.
  3. Total five-year platform investment was estimated at 6 million dollars (client-reported, unverified by MMA), concentrated primarily in licensing and faculty training work reflecting sustained investment across multiple institutional.
  4. The selected platform expanded effective laboratory capacity by an estimated 45 percent (client-reported, unverified by MMA) compared with the prior enrollment-capped approach reflecting sustained investment across multiple institutional.
RECOMMENDED STRATEGY
Phase 1: Phase 1 (Months 1 to 3): Benchmark candidate platforms directly against documented learning outcome data for the client's core introductory science curriculum reflecting sustained. Phase 2: Phase 2 (Months 4 to 9): Pilot the selected platform across two campuses, validating outcome and capacity expansion claims under real enrollment conditions reflecting. Phase 3: Phase 3 (Months 10 to 16): Extend the validated platform across all campuses, standardizing curriculum integration for system-wide consistency reflecting sustained investment across multiple.
OUTCOME
The client adopted a virtual laboratory platform across its introductory science curriculum system-wide, replacing its previous enrollment-capped physical laboratory approach. Effective laboratory capacity expanded by roughly 45 percent (client-reported, unverified by MMA) compared with the prior approach, and academic leadership reported meaningfully improved student access to previously oversubscribed STEM courses reflecting sustained.

Frequently Asked Questions

Foundational context covering the market sizes, CAGR, scope, country, region and competition that inform every finding below. This section is provided to cover basics and most often pre-purchase conversations, answered from the MMA Primary Research Dataset.

What is the current size of the Metaverse in Education Market?

MMA estimates the Metaverse in Education market at approximately 1.4 billion dollars in 2025. This reflects sustained growth in virtual laboratory adoption and corporate training investment reflecting sustained investment across multiple institutional.

How large will the Metaverse in Education Market be by 2036?

MMA projects the market will reach approximately {value2036:.2f} billion dollars by 2036 under the base case scenario. Growth is driven by virtual laboratory adoption, corporate training validation, and falling headset costs reflecting.

What is the CAGR for the Metaverse in Education Market 2026 to 2036?

MMA forecasts a base case compound annual growth rate of 17.0 percent between 2026 and 2036. The bull case reaches 18.3 percent while the bear case falls to 15.7 percent, reflecting adoption.

Which segment is growing fastest?

Virtual Laboratory and STEM Simulation Environments lead growth at 21.0 percent CAGR, roughly 1.24 times the overall market rate. This reflects institutions treating virtual capacity as an alternative to physical laboratory expansion.

Who are the major companies in the Metaverse in Education Market?

Leading vendors include Meta Platforms Inc, zSpace Inc, Labster ApS, Victory XR Inc, and Engage XR Studios Ltd. Together these five companies account for an estimated 34 percent of market activity reflecting.

Which country is growing fastest?

India shows the fastest national growth rate at approximately 19.0 percent CAGR, driven by rapidly expanding higher education digital learning infrastructure under national modernization programs reflecting sustained investment across multiple institutional segments.

Report Segmentation Architecture

The full report scope spans multiple orthogonal segmentation dimensions, with cross-tabulated demand data provided for each dimension pair. Coverage extends further to regional breakdowns, trend trajectories, and the competitive detail needed to support segment-level decision-making.

By Application and Deployment Type

  • VR Headset-Based Immersive Classrooms
  • Web-Based 3D Virtual Campus Platforms
  • AR-Enhanced Textbook and Curriculum Content
  • Corporate and Vocational Training Simulations
  • Virtual Laboratory and STEM Simulation Environments
  • Social and Collaborative Metaverse Learning Spaces

By End-Use Industry

  • Higher Education
  • K-12 Education
  • Corporate Training
  • Vocational and Technical Education
  • Government and Military Training

By Commercial Dimension

  • Institutional Direct Licensing
  • Enterprise Corporate Contracts
  • Distributor and Reseller Channel Sales
  • Government Procurement Contracts

By Region

  • North America
  • Western Europe
  • East Asia
  • South Asia and Pacific
  • Latin America
  • Middle East and Africa
  • Eastern Europe

Scope, Methodology, and Coverage

Every figure in this report is reproducible from documented input assumptions. The scope below maps the historical period, the forecast horizon, the segmentation dimensions, and the countries covered, alongside the underlying primary and qualitative methodology.
Historical Period
2020 to 2025
Forecast Period
2026 to 2036
Base Year
2025 (USD billions; MMA Primary Research Dataset, September 2026)
Market Definition
The Metaverse in Education market covers immersive virtual and augmented reality platforms, content, and hardware used for instructional purposes across K-12, higher education, and corporate training environments, including virtual classrooms, simulation laboratories, and collaborative learning spaces. It excludes general video conferencing software without immersive three-dimensional environments, traditional e-learning platforms delivering only two-dimensional video content, and consumer gaming applications not designed for structured instructional use.
Quantitative Units
USD billions (current prices); segment and regional CAGR in percent
Segmentation Dimensions
By Application and Deployment Type; By End-Use Industry; By Commercial Dimension; By Region
Regions Covered
North America, Western Europe, East Asia, South Asia and Pacific, Latin America, Middle East and Africa, Eastern Europe
Countries Covered
USA, China, Germany, France, UK, Japan, South Korea, India, Australia, Canada, Brazil, Mexico, Singapore, UAE, Saudi Arabia, South Africa, Poland, Netherlands, Ireland, and additional markets relevant to this sector
Key Companies Profiled
Meta Platforms Inc, zSpace Inc, Labster ApS, Victory XR Inc, Engage XR Studios Ltd, HTC Corporation, PICO Interactive Inc, Unity Software Inc, Roblox Corporation, Avantis Systems Ltd, Immersive Learning Inc, Nearpod Inc, Talespin Reality Labs Inc, Strivr Labs Inc, Osso VR Inc, Filament Games LLC, Prisms VR Inc, Curiscope Ltd, VirtualSpeech Ltd, Bodyswaps Ltd
Quantitative Methodology
Primary survey, n=3,800 respondents, Q4 2025, six countries; demand-side model with trade association cross-validation
Qualitative Methodology
47 expert interviews, Q4 2025; applied to validate demand model assumptions, identify emerging dynamics, and assess competitive positioning
Report Format
PDF and XLSX data workbook (Word format preview document)
Publisher
Market Minds Advisory
Report Code
MMA-2026-TEC-404
Published
September 2026
Contact
sales@marketmindsadvisory.com | www.marketmindsadvisory.com

Purchase the full Metaverse in Education Market Report (2026 to 2036).

The full report delivers a complete view of the Metaverse in Education market, covering detailed segmentation, regional forecasts, and competitive benchmarking across all six application categories through 2036. It includes company profiles for all 20 evaluated vendors, detailed analysis of documented learning outcome trends and corporate training return on investment dynamics, and a dedicated section on content development economics. Buyers receive downloadable data tables, a customizable Excel model for scenario planning, and access to MMA's analyst team for follow-up inquiry sessions. The report is designed for strategy, curriculum, and education technology teams evaluating vendor selection.
Detailed profiles of all 20 evaluated vendors
Regional forecasts across all seven MMA-defined regions
Customizable Excel model for scenario planning analysis
Learning outcome and return on investment trend analysis
Segment-level CAGR and margin benchmarking data
Direct analyst access for follow-up inquiries

Built For The People Who Decide

From boardroom strategy to bench-side execution, this report is read cover-to-cover by leaders shaping the next decade of their industry, turning demand scenarios, market dynamics and valuation benchmarks into decisions.
CXOs/ Presidents/ VPs/ Managers
M&A and Corporate Development
Strategy Teams and R&D Heads
Procurement and Product Directors
Regulatory and Compliance Leaders
Investor Relations and Equity Analysts