Market Minds Advisory
Metal Replacement Market

Metal Replacement Market: Electrification function, circularity penalties and tooling economics to 2036

Polymers won the weight argument decisively and are now quietly losing a recycling argument that simply did not exist when anybody made the original substitution decisions in the first place.

Lead Analyst

Bilal Shaikh

Published

September 2026

Make Smarter Decisions with Customized Research Insights

Request a free sample report and evaluate market opportunities, growth trends, and competitive dynamics relevant to your business needs.

2025 MARKET VALUE$32.4BMarket Size 2025
2036 FORECAST VALUE$74.0BBase Case , 2026 to 2036
CAGR 2026 TO 20367.8 %Bull 9.0% / Bear 6.5%
INCREMENTAL OPPORTUNITY$39.1BNet 10- year value creation
EXPANSION MULTIPLE2.12x2036 value over 2026 base
Strategic Levers
M&A Pipeline
Regional Outlook
Country Rankings
Competitive Intelligence
Segmental Deep-dive
Call-Us : 91 93563 13602

Executive Snapshot and Market Trajectory

A polymer component saves roughly 45% of the mass and recovers at about 9% into any useful material, against automotive metal recovering at 76%. European end-of-life rules are starting to price that gap, which puts a settled argument back into contention. Very few suppliers have prepared for it.
Electrically functional polymers grow at 11.7%, half again the market rate of 7.8%, because a high-voltage vehicle needs electrical isolation, flame retardancy and thermal runaway containment that metal cannot provide at any weight. East Asia holds 30% of value on Chinese and Japanese engineering polymer production together. Tooling recovers only above roughly 180,000 units. Below that threshold, machining a metal part remains cheaper regardless of how well the polymer performs technically.
Five suppliers hold 36% of material supply into these applications and the concentration follows compounding capability rather than base resin scale, since the value sits in glass loading, flame retardancy and heat stabilisation packages. The interesting development is that electrification creates polymer applications with no metal predecessor at all. Substitution stops being a comparison and becomes the only available answer to a new problem. That is a stronger position than anything weight ever gave them.
Market Definition
This report covers polymer and composite materials supplied specifically to replace metal in functional and mechanical components across automotive, industrial, electrical, consumer and medical applications, spanning glass-reinforced engineering thermoplastics, long fibre thermoplastic composites, high-temperature polymers, thermoset composites, electrically functional polymers, and recyclable and mono-material systems. Value is measured at material supplier level. Excluded are exterior automotive body panels, commodity packaging polymers, metal-for-metal substitution, and finished component manufacture.
Base Year Value
$32.4B in 2025 (MMA Primary Research Dataset, August 2026)
Forecast Period
2026 to 2036, eleven discrete annual values
CAGR
7.8% base case. Bull 9.0%. Bear 6.5%.
Fastest Growth Segment
Electrically Functional Polymers: 11.7% CAGR
Fastest Growth Country
India: 11.4% CAGR
Fastest Growth Region
South Asia and Pacific: 10.0% CAGR
Largest Region
East Asia: 30% of 2025 global value
Market Leaders
BASF, Celanese, SABIC, Solvay and Envalior lead the market. Source: MMA Primary Research Dataset, July 2026.
Primary Survey
n=3,800 procurement and R&D decision-makers, Q4 2025, six countries
Methodology
Demand-side build-up, cross-validated against public data, 47 expert interviews

Metal Replacement Market Forecast Scenarios

metal-replacement-market-trends-size-forecast-scenario-1787555535302
Growth ran at 6.6% between 2020 and 2025 and the period was less one-directional than the industry usually admits. Weight-driven substitution continued across automotive and industrial applications. Petrochemical price inflation through 2021 and 2022 raised engineering polymer costs sharply while aluminium fell back, which reversed several substitution cases temporarily. High-pressure die casting improved considerably and took back applications polymers had been expected to win.
The 7.8% base case rests on three mechanisms. Electrification keeps creating applications requiring electrical isolation, flame retardancy and thermal containment that no metal provides, which is substitution on function rather than on mass. Asian manufacturing volume keeps expanding and consumes reinforced polymer at scale across industrial and consumer components. And lead regulation on brass fittings keeps pushing plumbing and valve applications toward high-performance polymer systems. None of that turns on mass at all.
The 9.0% bull case is recyclable and mono-material polymer systems reaching cost parity with conventional reinforced grades, which would remove the circularity objection now gathering regulatory weight. The 6.5% bear case is European end-of-life vehicle recycled content requirements applying strictly enough that reinforced polymers become a liability in exactly the applications where substitution had gone furthest.

The Argument That Reopened

Metal replacement spent forty years winning an argument about weight and cost, and it won it comprehensively. A reinforced polymer component saves around 45% of the mass, consolidates several parts into one moulding and needs no corrosion protection. Nobody seriously disputes any of that. What has changed is that a criterion nobody was measuring has become a regulatory obligation, and on that criterion the polymer loses badly rather than narrowly.
TOP-FIVE CONCENTRATION36%Combined position across metal replacement material supply held by leaders
WEIGHT REDUCTION ACHIEVED45%Typical mass saving when polymer replaces a metal component
REINFORCED POLYMER RECYCLING RATE9%Portion of glass-reinforced components recovered into any useful material
METAL RECYCLING RATE76%Portion of automotive metal recovered and returned to production
RESIN COST SHARE63%Portion of component cost attributable to the polymer itself
TOOLING INVESTMENT RECOVERY180,000 unitsVolume needed before injection tooling pays back against machining
Glass-reinforced components recover at roughly 9% into any useful material because the fibre and the polymer cannot be separated economically and the mixture degrades on reprocessing. Automotive metal recovers at around 76% through infrastructure built over a century, and the recovered material is worth something. European end-of-life rules are beginning to price that difference into design decisions, which reopens substitutions made on a basis nobody was measuring.
Electrification is the counterweight and it is a stronger one than the industry realises. A high-voltage vehicle requires electrical isolation, flame retardancy and thermal runaway containment, and metal provides none of those at any mass. Those applications have no metal predecessor to be compared against at all. There is nothing to displace and no comparison to argue.
"This industry keeps presenting weight savings to customers who already agreed about weight fifteen years ago and are now being asked by regulators what happens to the part afterwards. Nobody has a good answer, and the first supplier with one takes a great deal of business."
Director, Engineering Polymers and Advanced Materials Practice · MMA Chemicals and Materials Practice · August 2026

Market Trends

Circularity requirements reopen settled substitution decisions

Glass-reinforced polymer components recover at roughly 9% into any useful material, since fibre and matrix cannot be separated economically and reprocessing degrades both. Automotive metal recovers at around 76% through infrastructure built across a century and the recovered material carries real value. European end-of-life vehicle rules and recycled content obligations are pricing that gap into design decisions for the first time. Commercially this puts substitutions made purely on weight back into review on a criterion that did not exist when they were originally decided, and suppliers presenting mass savings are answering a question nobody is asking.
Market Impact: Replaces lead in 100% of fittings

Electrification creates applications metal never occupied

A high-voltage vehicle requires electrical isolation across busbars, connectors and battery enclosures, flame retardancy meeting requirements that did not previously exist in vehicles, and containment structures capable of surviving thermal runaway. Metal provides none of those properties regardless of how it is formed or how much of it is used. Growth at 11.7% therefore reflects substitution on function rather than on mass, which is a fundamentally different and considerably stronger commercial position. There is no incumbent metal solution to be compared against, no weight argument to make and no circularity objection that any alternative material answers better.
Market Impact: Delivers 30% of global value

Market Opportunities and Growth Drivers

Lead regulation pushes plumbing away from brass fittings

Lead content limits in drinking water contact applications have tightened across North America and Europe, and traditional brass fittings contain lead as a machinability aid that manufacturers cannot simply remove without changing how the alloy behaves. Lead-free brass costs considerably more and machines worse. High-performance polymer systems avoid the question entirely while resisting chlorine, scale and thermal cycling in ways that satisfy plumbing codes. Copper price levels reinforce the same direction independently. This is substitution driven by a contaminant rule rather than by weight, and it applies to an installed base measured in billions of fittings.
Market Impact: Requires 180,000 units minimum

Asian manufacturing volume consumes reinforced polymer at scale

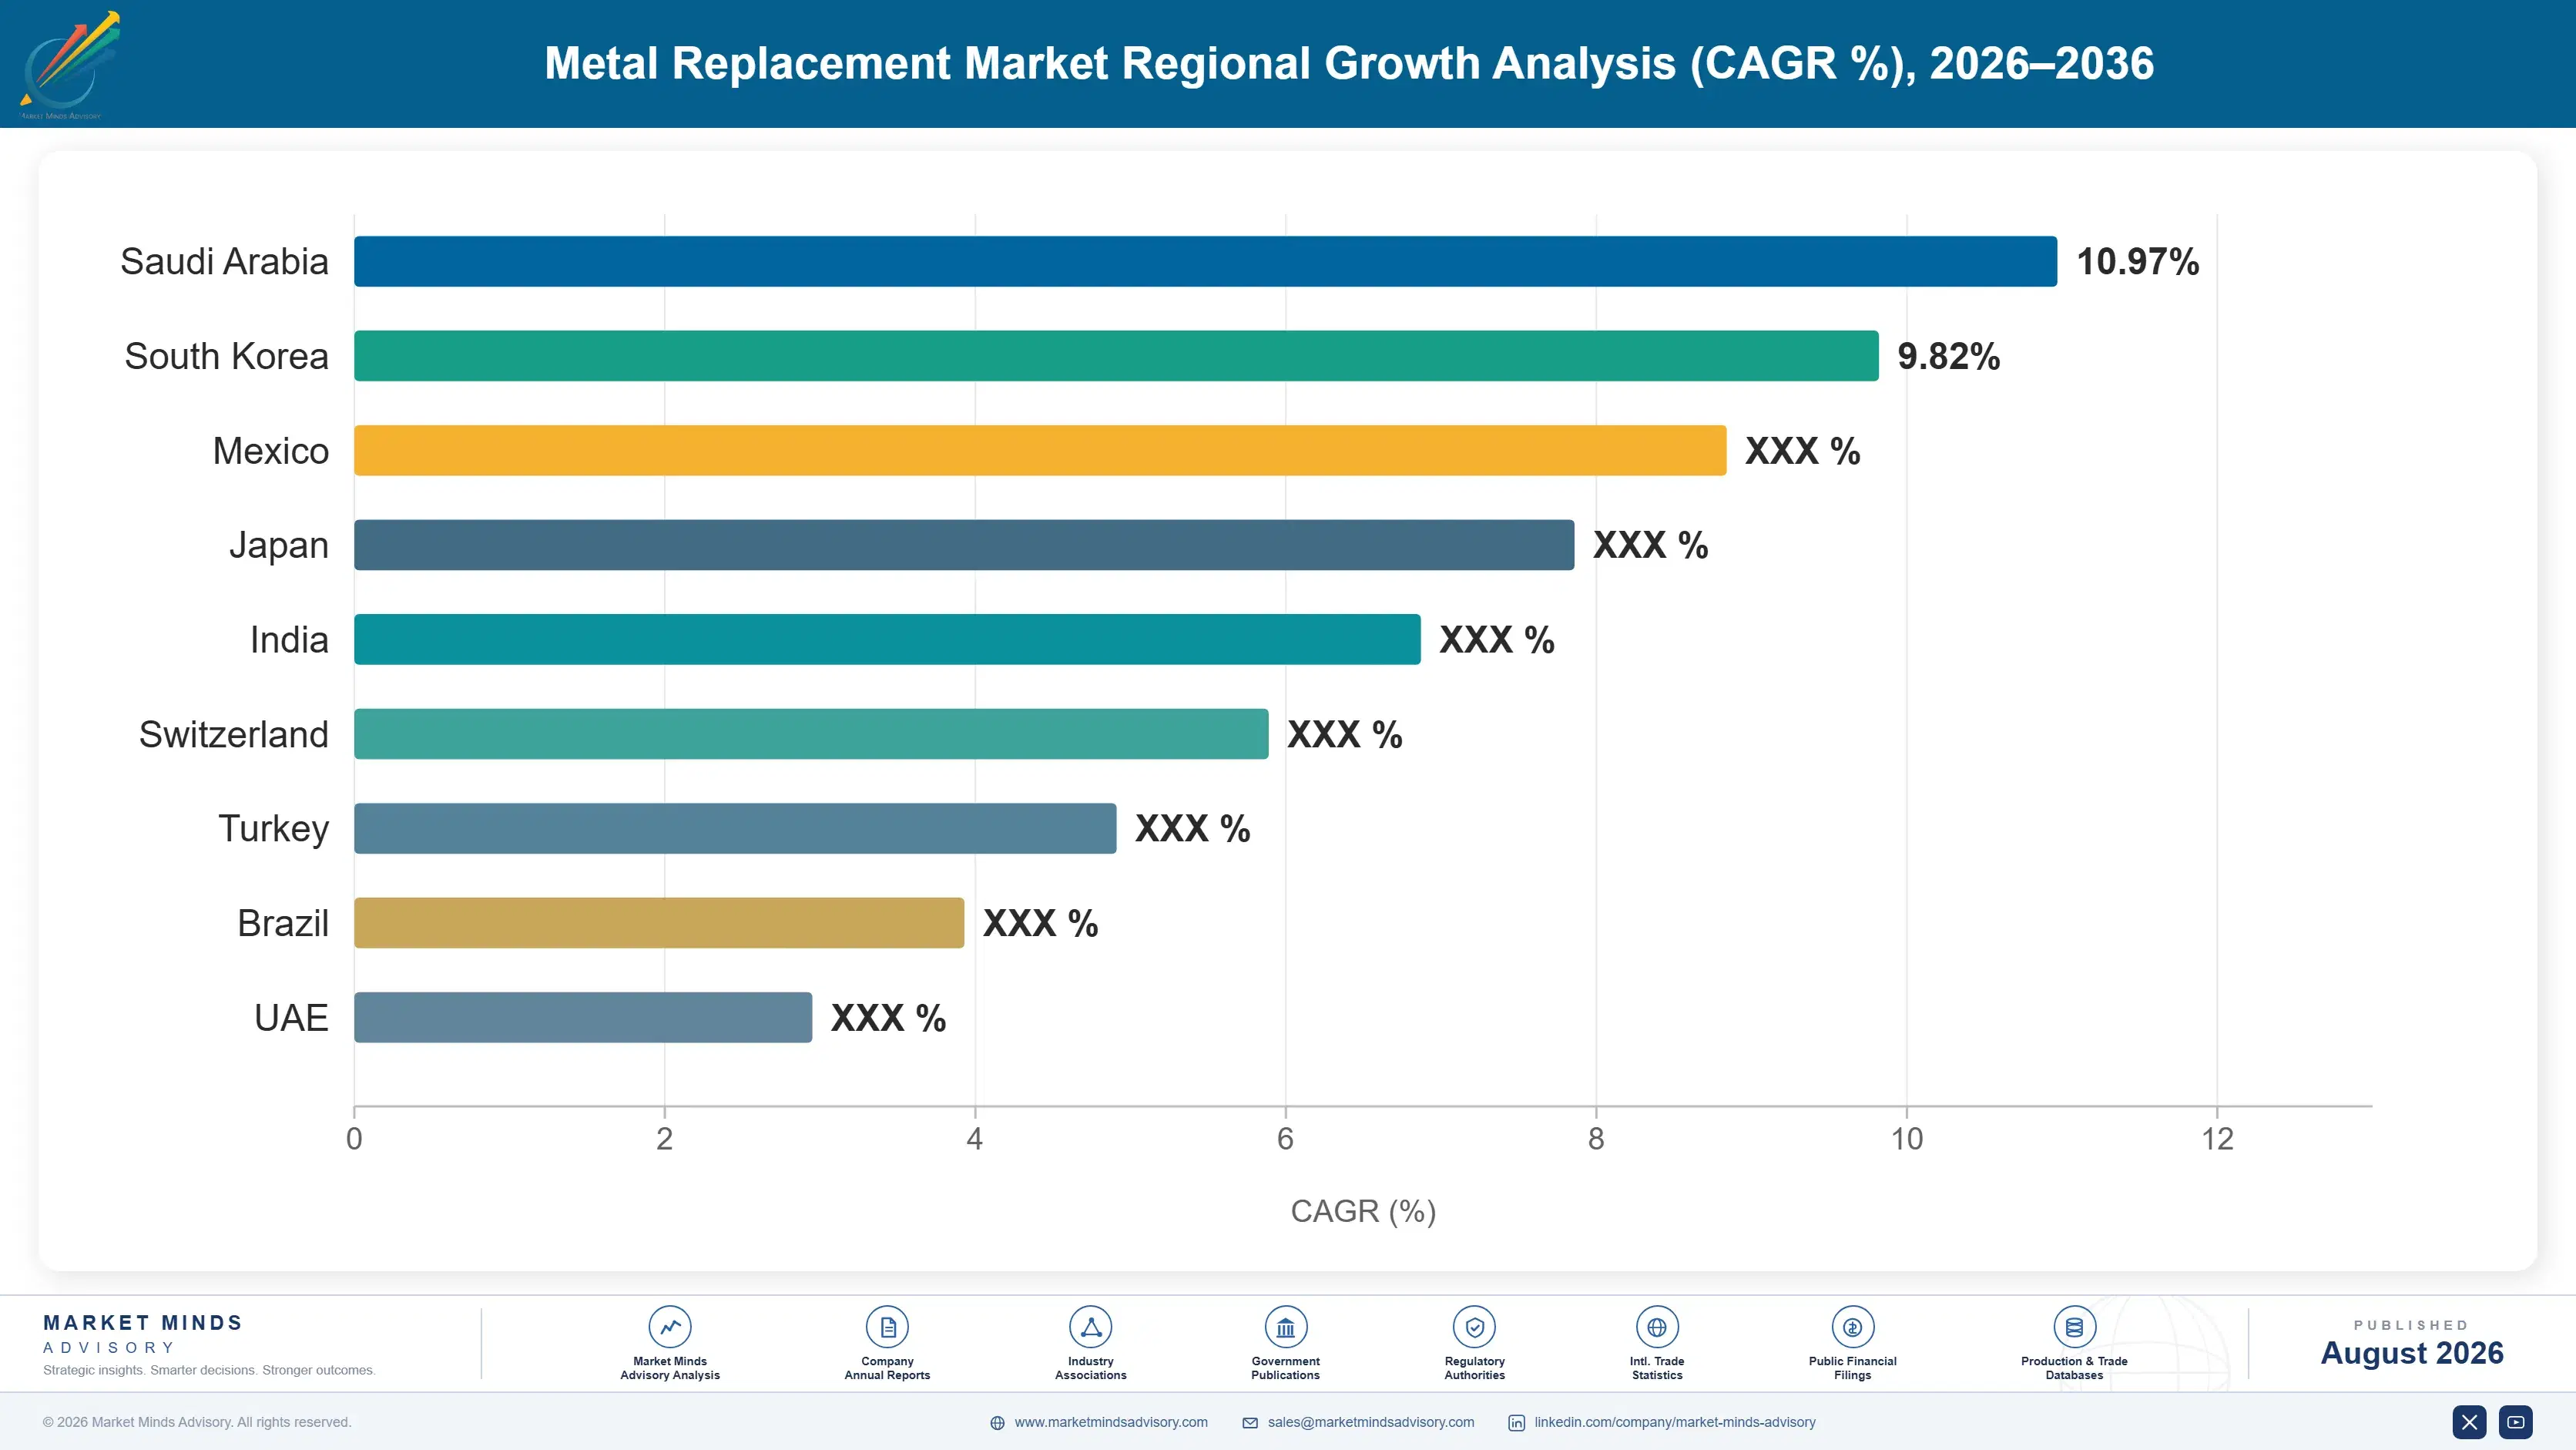
Chinese and Indian manufacturing output across industrial equipment, consumer appliances, electrical components and vehicles consumes reinforced engineering polymer in quantities nothing elsewhere approaches, and that consumption grows with production rather than with any material decision. Domestic compounders serve much of it and have improved specification capability considerably over a decade. Indian growth at 11.4% is the fastest of any country here and rests on manufacturing expansion alongside electrification programmes arriving simultaneously. The demand is unglamorous, follows industrial activity directly and is considerably larger than the specialty applications attracting most technical attention.
Market Impact: Sets 63% of component cost

Market Restraints and Challenges

Tooling economics exclude low-volume applications entirely

Injection tooling recovers its cost only above roughly 180,000 units, below which machining a metal part remains cheaper regardless of how much better the polymer performs. The root cause is that a mould is a fixed cost incurred before a single part exists, while machining cost is almost entirely variable. Commercially this confines metal replacement to high-volume applications and stalls it completely in industrial and capital equipment where volumes are hundreds rather than thousands. Suppliers are pursuing additive manufacturing and machinable stock shapes for those applications, neither of which reaches injection moulding economics.
Market Impact: Recovers only 9% against 76%

Resin cost dominates and moves on petrochemical markets

The polymer itself represents around 63% of component cost, which is unusually high and leaves little conversion margin to absorb movement. The root cause is that engineering resins price on petrochemical feedstock and specialty monomer availability, both of which move for reasons entirely unconnected to whether a metal part is being replaced. Commercially this made several substitution cases uneconomic during the 2021 and 2022 price spike, and some reverted to aluminium permanently. Suppliers are indexing contracts to published benchmarks and developing grades with lower specialty monomer content where performance permits.
Market Impact: Segment compounds at 11.7% annually
3 additional market trends, 4 additional growth drivers, and 2 additional restraints and challenges are covered in the full report. Contact sales@marketmindsadvisory.com to access the complete intelligence.

Segment CAGR and Growth Architecture

Materials are classified here by polymer class, since that determines the properties achievable, the temperature and load limits and the applications a supplier can address at all. End industry, component function and supply arrangement are handled separately in the framework, because one polymer class serves automotive, industrial and electrical applications without any change to the material.
metal-replacement-market-trends-market-share-analysis-1787555535861

Electrically Functional Polymers

Growing at 11.7%, half again the market rate, this segment occupies applications metal never held and cannot enter. A high-voltage vehicle requires electrical isolation across busbars and connectors, flame retardancy at levels vehicles never previously needed, and battery enclosure materials capable of containing thermal runaway long enough for occupants to leave. Metal offers none of those properties however it is formed. That makes this substitution on function rather than on mass, which is a considerably stronger commercial position because there is no incumbent to displace, no weight comparison to argue and no circularity objection that any alternative answers better. Comparative tracking index, glow wire performance and flame ratings decide specification rather than density.
CAGR 11.7%

High-Temperature Polymers

Polyetheretherketone, polyphenylene sulphide and polyphthalamide occupy the space where engineering thermoplastics stop working and metal historically had no competition at all. Growth at 10.4% follows electrification thermal loads, semiconductor process equipment, medical implants and oil and gas applications where the operating environment excludes almost everything else. These materials cost many multiples of commodity engineering resins, which means the application must genuinely require them rather than merely benefit. The supplier field is narrow because polymerisation capability rather than compounding decides who participates, and capacity additions take years. That narrowness supports pricing that reinforced grades never approach anywhere. Any customer who finds a cheaper material that just survives the environment leaves permanently, which makes application selection unusually important here.
CAGR 10.4%
Full segment breakdown across 6 segments available in the complete report.

Regional Architecture and Country Demand Map

East Asia holds 30% of value on Chinese and Japanese engineering polymer production alongside the largest manufacturing base anywhere. North America follows at 25% on electrification and plumbing regulation. Manufacturing volume rather than material innovation decides most of this map. Regulation increasingly decides the rest of it.

East Asia

Chinese manufacturing output across vehicles, appliances, electrical equipment and industrial machinery consumes reinforced engineering polymer at volumes nothing elsewhere approaches, and domestic compounders serve most of it at prices international suppliers do not attempt to match on standard grades. Japanese producers hold the deepest capability in high-temperature polymers and specialty compounding, exporting widely at premium specification. Korean electrical and battery component manufacture consumes electrically functional grades in growing quantity. Chinese electric vehicle production creates isolation and flame retardancy demand at scale nobody else generates. Growth at 8.8% combines manufacturing volume with electrification arriving faster here than anywhere else on this table. Domestic compounders keep taking the standard grade volume. Volume follows manufacture.
Share: 30% | CAGR: 8.8% (2026 to 2036)

North America

Electrification and plumbing regulation are the two active drivers here and neither has anything to do with weight. Lead content limits in drinking water applications have pushed brass fittings toward polymer systems across an installed base measured in billions of components. Battery and high-voltage component manufacture is expanding with domestic content requirements, consuming electrically functional grades that carry no metal predecessor. Compounding capability across the region is strong and specialty resin production substantial. Growth at 8.2% sits above the market average and reflects regulation and electrification rather than any continuation of the weight-driven substitution that defined earlier decades. Weight-driven conversion has largely finished here and regulation now does the work instead.
Share: 25% | CAGR: 8.2% (2026 to 2036)
Regional intelligence for 5 additional markets available in the complete report: Western Europe, South Asia and Pacific, Latin America, Middle East and Africa, Eastern Europe. Contact sales@marketmindsadvisory.com.
metal-replacement-market-trends-country-cagr-analysis-1787555536385

Where Substitution Margin Actually Sits

Four moves matter for a supplier whose central argument was settled fifteen years ago and whose customers are now being asked a question nobody prepared for. Two are about the applications electrification created from nothing, and two are about answering the circularity objection before it removes business. Presenting weight savings is not among them.

Sell function where metal has no answer

Electrical isolation, flame retardancy and thermal runaway containment are properties metal does not provide at any mass or in any form, and a high-voltage vehicle requires all three. That makes electrically functional grades a substitution on function rather than on weight, compounding at 11.7% with no incumbent to displace and no comparison to argue. Suppliers still leading with mass savings are competing in a conversation that concluded years ago against customers who agreed then. The functional applications carry better margins, face no circularity objection and grow faster, which is an unusually clean combination.
Market Impact: Enters a segment now compounding at 11.7% annually

Answer the recycling question before it costs business

Glass-reinforced components recover at roughly 9% against metal at 76%, and European end-of-life and recycled content rules are pricing that difference into design decisions for the first time. Suppliers with no answer are watching settled substitutions reopen on a criterion they never had to address. Mono-material and recyclable reinforced systems compound at 9.8% and cost more than conventional grades, which customers facing regulation will pay. Whoever brings a credible circular answer to a design review reaches a conversation competitors cannot join, and very few suppliers currently have one at all.
Market Impact: Closes a 9% against 76% material recovery gap

Take the plumbing conversion lead regulation forces

Lead limits in drinking water contact applications catch traditional brass fittings, where lead serves as a machinability aid that cannot simply be removed without changing the alloy. Lead-free brass costs more and machines worse, while high-performance polymer systems avoid the question entirely and meet plumbing codes on chlorine, scale and thermal cycling. The installed base runs to billions of fittings and conversion follows regulatory timetables rather than any commercial persuasion. Copper price levels reinforce the direction independently, and suppliers positioned before the deadlines take positions competitors reach afterwards. Roughly 2 billion fittings sit in the addressable installed base.
Market Impact: Converts an installed base of 2 billion fittings

Serve applications below the tooling threshold differently

Injection tooling recovers only above roughly 180,000 units, which excludes industrial and capital equipment where volumes run in hundreds regardless of how much better the polymer performs technically. That leaves a substantial addressable population untouched by an industry organised entirely around high-volume moulding. Machinable stock shapes, additive manufacturing and compression moulding all reach lower volumes at higher unit cost that these applications can absorb, since the metal alternative was being machined anyway. Suppliers organised only for injection grades are ignoring applications where the technical case is strongest. That population is genuinely large.
Market Impact: Reaches applications below the 180,000 unit tooling threshold

Who Controls the Margin Pool

Five suppliers hold 36% of material supply into metal replacement applications, measured on material revenue at supplier level, the basis used throughout this section. That concentration follows compounding capability rather than base resin scale, since the commercial value sits in glass loading, flame retardancy packages, heat stabilisation and colour rather than in the polymer backbone. The gap between leaders and everybody else is application engineering rather than any production advantage. Backbone chemistry defends almost nothing.
Competition runs on three dimensions. Application engineering, since a customer replacing a metal part needs the design reworked rather than the material substituted. Specification breadth across temperature, flame and electrical requirements. And increasingly circularity credentials, which European design reviews now raise directly. Price competes hardest in standard glass-reinforced grades where domestic compounders participate. Design reviews now raise recovery routes unprompted.

Rankings shift as electrification creates functional applications with no incumbent, which rewards electrical and flame specialists over general reinforcement suppliers. Chinese compounders keep taking standard grade volume. Circularity capability is redistributing European positions in ways that have nothing to do with mechanical performance at all. Mechanical performance decides less than it used to.
metal-replacement-market-trends-company-positioning-matrix-1787555536920

Competitive Moat and Risk Dimensions

BASF

Moat: Application engineering breadth

BASF supports metal replacement with simulation, part design and processing capability rather than merely supplying compound, which matters because converting a metal part means redesigning it rather than substituting material into the same geometry. That engineering resource is expensive to maintain and it embeds the company inside customer development programmes years before any material ships.
BASF

Risk: Standard grade cost exposure

A substantial share of volume sits in standard glass-reinforced grades where Chinese and Indian compounders compete on price and meet the specification adequately for most applications. Application engineering justifies a premium on difficult parts and not on straightforward ones. That erodes the volume base underneath the specialty business steadily rather than suddenly.
VICTREX

Moat: High-temperature polymerisation capability

Victrex polymerises polyetheretherketone rather than compounding somebody else's polymer, which places it in a supply position that compounders cannot reach at any investment level below a new plant. Those materials serve applications where nothing else survives the operating environment, and capacity additions take years, which keeps the competitive field genuinely narrow.
VICTREX

Risk: Narrow application dependence

High-temperature polymers cost many multiples of engineering thermoplastics, which means the application must genuinely require them rather than merely benefit from the properties. Any customer finding a cheaper material that just survives the environment leaves permanently. Suppliers across broader grade ranges can follow a customer down in specification where this position cannot.

Players Tracked

Prominent Players

BASF
Celanese
SABIC
Solvay
Envalior

Other Key Players

Covestro
Evonik Industries
LyondellBasell
Mitsubishi Chemical
Toray Industries
Teijin
Asahi Kasei
Kingfa Science and Technology
Avient
RTP Company
Victrex
Arkema
Lotte Chemical
LG Chem
Daicel Corporation

Recent Developments

FEBRUARY 2025

A European manufacturer required recycled content in polymer components

A European vehicle manufacturer specified minimum recycled content across polymer components, applying obligations to reinforced grades that recover poorly and have no established recovery route. This was a procurement specification rather than any transaction, and it puts several established substitutions under active review. Several programmes are now under review.
Signal: Recycled content requirements now reach reinforced polymers directly, which reopens substitutions everybody had considered permanently settled
JULY 2025

A supplier launched mono-material reinforced systems for recovery

An engineering polymer supplier introduced mono-material reinforced systems designed for mechanical recovery rather than energy recovery, addressing end-of-life requirements that conventional glass-reinforced grades cannot satisfy. This was organic product development rather than any acquisition or partnership arrangement. Conventional glass-reinforced grades cannot satisfy mechanical recovery requirements in any form at all.
Signal: Circularity is becoming a product specification rather than a corporate claim, which favours whoever developed the chemistry first
DECEMBER 2025

A plumbing manufacturer converted a fitting range from brass

A plumbing component manufacturer converted a fitting range from leaded brass to high-performance polymer, citing drinking water lead limits and the cost and machinability penalty of lead-free brass alternatives. This was a product conversion rather than any commercial transaction between the parties. Copper prices reinforced the decision.
Signal: Contaminant regulation rather than weight is now driving substitution in applications nobody was targeting on mass grounds

What Moves Material Cost

The polymer itself accounts for around 63% of component cost, which is unusually high and reflects how little conversion adds beyond the material. Glass fibre, flame retardant packages, heat stabilisers and pigments make up most of the remainder. Compounding energy and extrusion cost are modest. Specialty monomer availability rather than price is the binding constraint on high-temperature grades specifically.
Engineering resin prices moved sharply through 2021 and 2022 on petrochemical feedstock and European energy costs, and IEA data show European industrial gas far above American and Asian levels throughout. BASF recorded raw material and energy cost pressure across its performance materials operations in its Annual Report 2022. Aluminium fell relative to polymer over the same period, which made several substitution cases uneconomic and reversed some of them permanently rather than temporarily.

Relative rather than absolute cost is what actually governs this market and most analysis ignores it. A polymer competing against aluminium wins or loses on the ratio between them, and that ratio moved violently against polymers during the petrochemical spike while aluminium was cheap. Suppliers who lost applications then rarely recovered them, because nobody retools back for a price movement they distrust.
metal-replacement-market-trends-cost-volatility-analysis-1787555537120

Index component contracts to published polymer benchmarks

Resin at 63% of cost prices on petrochemical feedstock moving for reasons unconnected to whether a metal part is being replaced, and fixed programme pricing against that transfers the whole exposure. Indexing to published engineering resin benchmarks with quarterly reset removes it cleanly. Customers accept it because their metal alternatives price on exchanges anyway.

Reduce specialty monomer content where performance permits

Many grades carry specialty monomer content specified years ago against requirements that have since relaxed or were conservative from the start. Reformulating toward broader-production monomers cuts cost and improves availability simultaneously, at the price of requalification work the customer must accept. Suppliers who never revisit legacy formulations are paying premiums for decisions nobody has examined in a decade.

Track the aluminium ratio rather than absolute resin price

Substitution wins or loses on the price ratio between polymer and the metal it replaces, and that ratio moved violently against polymers during the petrochemical spike while aluminium stayed cheap. Suppliers monitoring only their own input costs miss the variable that actually decides applications. Watching the ratio identifies at-risk programmes before a customer starts requoting them in die-cast aluminium.

Portfolio Architecture for Margin Defence

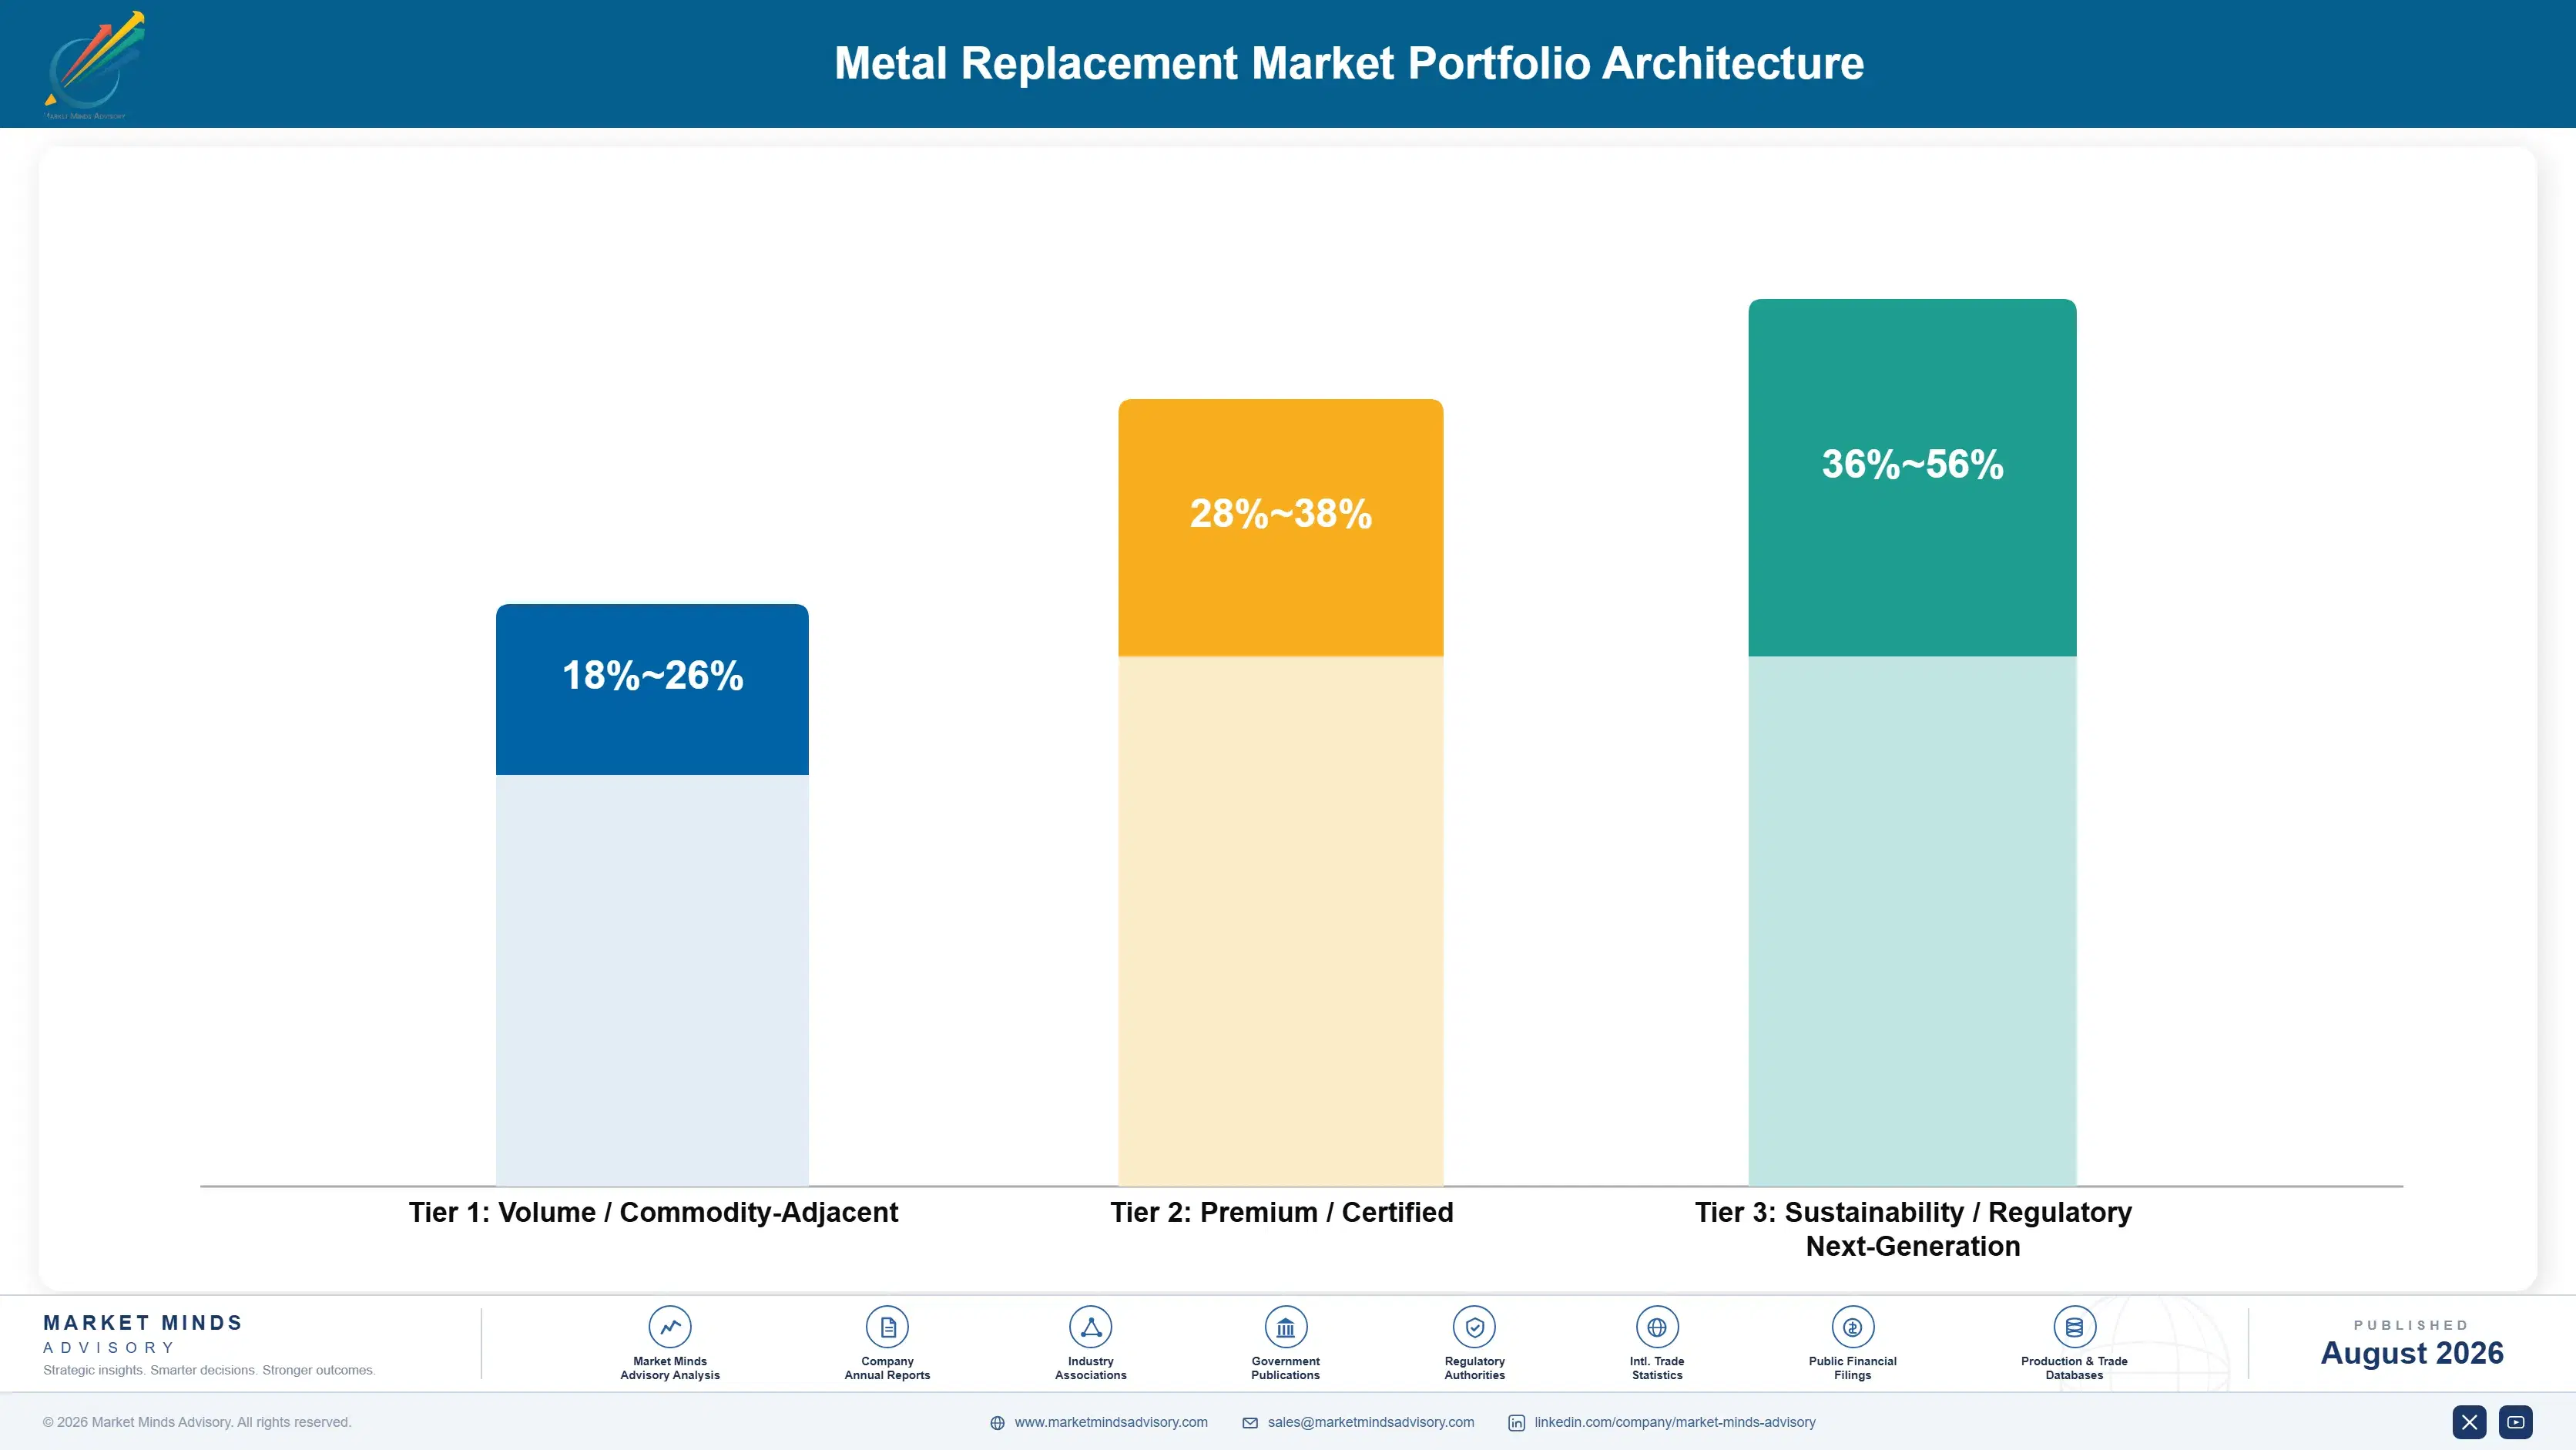
Margin here tracks whether an application has an alternative rather than how sophisticated the compound is. Standard glass-reinforced grades run at gross margins in the low twenties against Chinese and Indian compounders meeting the specification adequately. Flame retardant and heat stabilised grades run considerably better on formulation difficulty. High-temperature polymers and electrically functional grades run higher again, because the application requires the property and nothing cheaper survives the environment. Alternatives decide pricing here.
The tension is that standard grades carry the volume that keeps compounding lines loaded while specialty grades carry the returns, and the two need different technical service and different customer relationships. A commodity buyer comparing datasheets and a development engineer redesigning a metal part share almost nothing. Suppliers serving both from one organisation have generally found the volume business consuming the application engineering that specialty conversion required, which shows up as lost development programmes.

High-value pools sit in electrically functional grades, high-temperature polymers and recyclable mono-material systems. None of the three competes primarily on weight. Compounding capacity by itself defends very little where the formulations are well understood. Application engineering defends considerably more.

Volume / Commodity-Adjacent

Standard glass-reinforced polyamide and polyester grades where Chinese and Indian compounders meet the specification adequately and customers compare datasheets on price. The eight-point range separates suppliers with integrated resin positions from those buying polymer on merchant terms.
Gross Margin: 18%-26%

Premium / Certified

Flame retardant, heat stabilised and hydrolysis resistant grades where formulation difficulty and qualification testing narrow the supplier field considerably. The ten-point spread reflects application engineering depth, since the same compound sells very differently with and without design support.
Gross Margin: 28%-38%

Sustainability / Regulatory / Next-Generation

High-temperature polymers, electrically functional grades and recyclable mono-material systems. The twenty-point range is wide because these price against the absence of any alternative rather than against a competing compound anybody could benchmark.
Gross Margin: 36%-56%
metal-replacement-market-trends-portfolio-architecture-1787555537624

High-value Sub-segments and Strategic Watch-out

Electrically Functional Grades

Compounding at 11.7% on properties metal cannot provide at any mass, which removes the weight argument, the incumbent comparison and the circularity objection simultaneously. No other segment in this market escapes all three problems at once. That combination is genuinely rare and worth defending. Nothing else does.
Gross Margin: 38%-54%

Recyclable Mono-Material Systems

Growing at 9.8% and answering the 9% recovery rate that European end-of-life rules are now pricing into design reviews directly. Very few suppliers have a credible answer, which makes the conversation itself a competitive position. Having the conversation at all is currently a competitive advantage.
Gross Margin: 34%-48%

Standard Reinforced Grades

The volume that keeps compounding lines loaded and the segment domestic Asian compounders are steadily taking on price. Manage for utilisation and resin integration rather than margin, because differentiation is genuinely not available here. Cost reduction will not close that gap at any level. Utilisation is all.
Gross Margin: 18%-26%

Sub-Threshold Volume Applications

Injection tooling recovers only above roughly 180,000 units, which leaves industrial and capital equipment untouched despite the strongest technical case anywhere. Machinable stock and additive routes reach them at costs those customers absorb comfortably. The technical case there is strongest and nobody serves it. Nobody has tried.
Gross Margin: 30%-44%

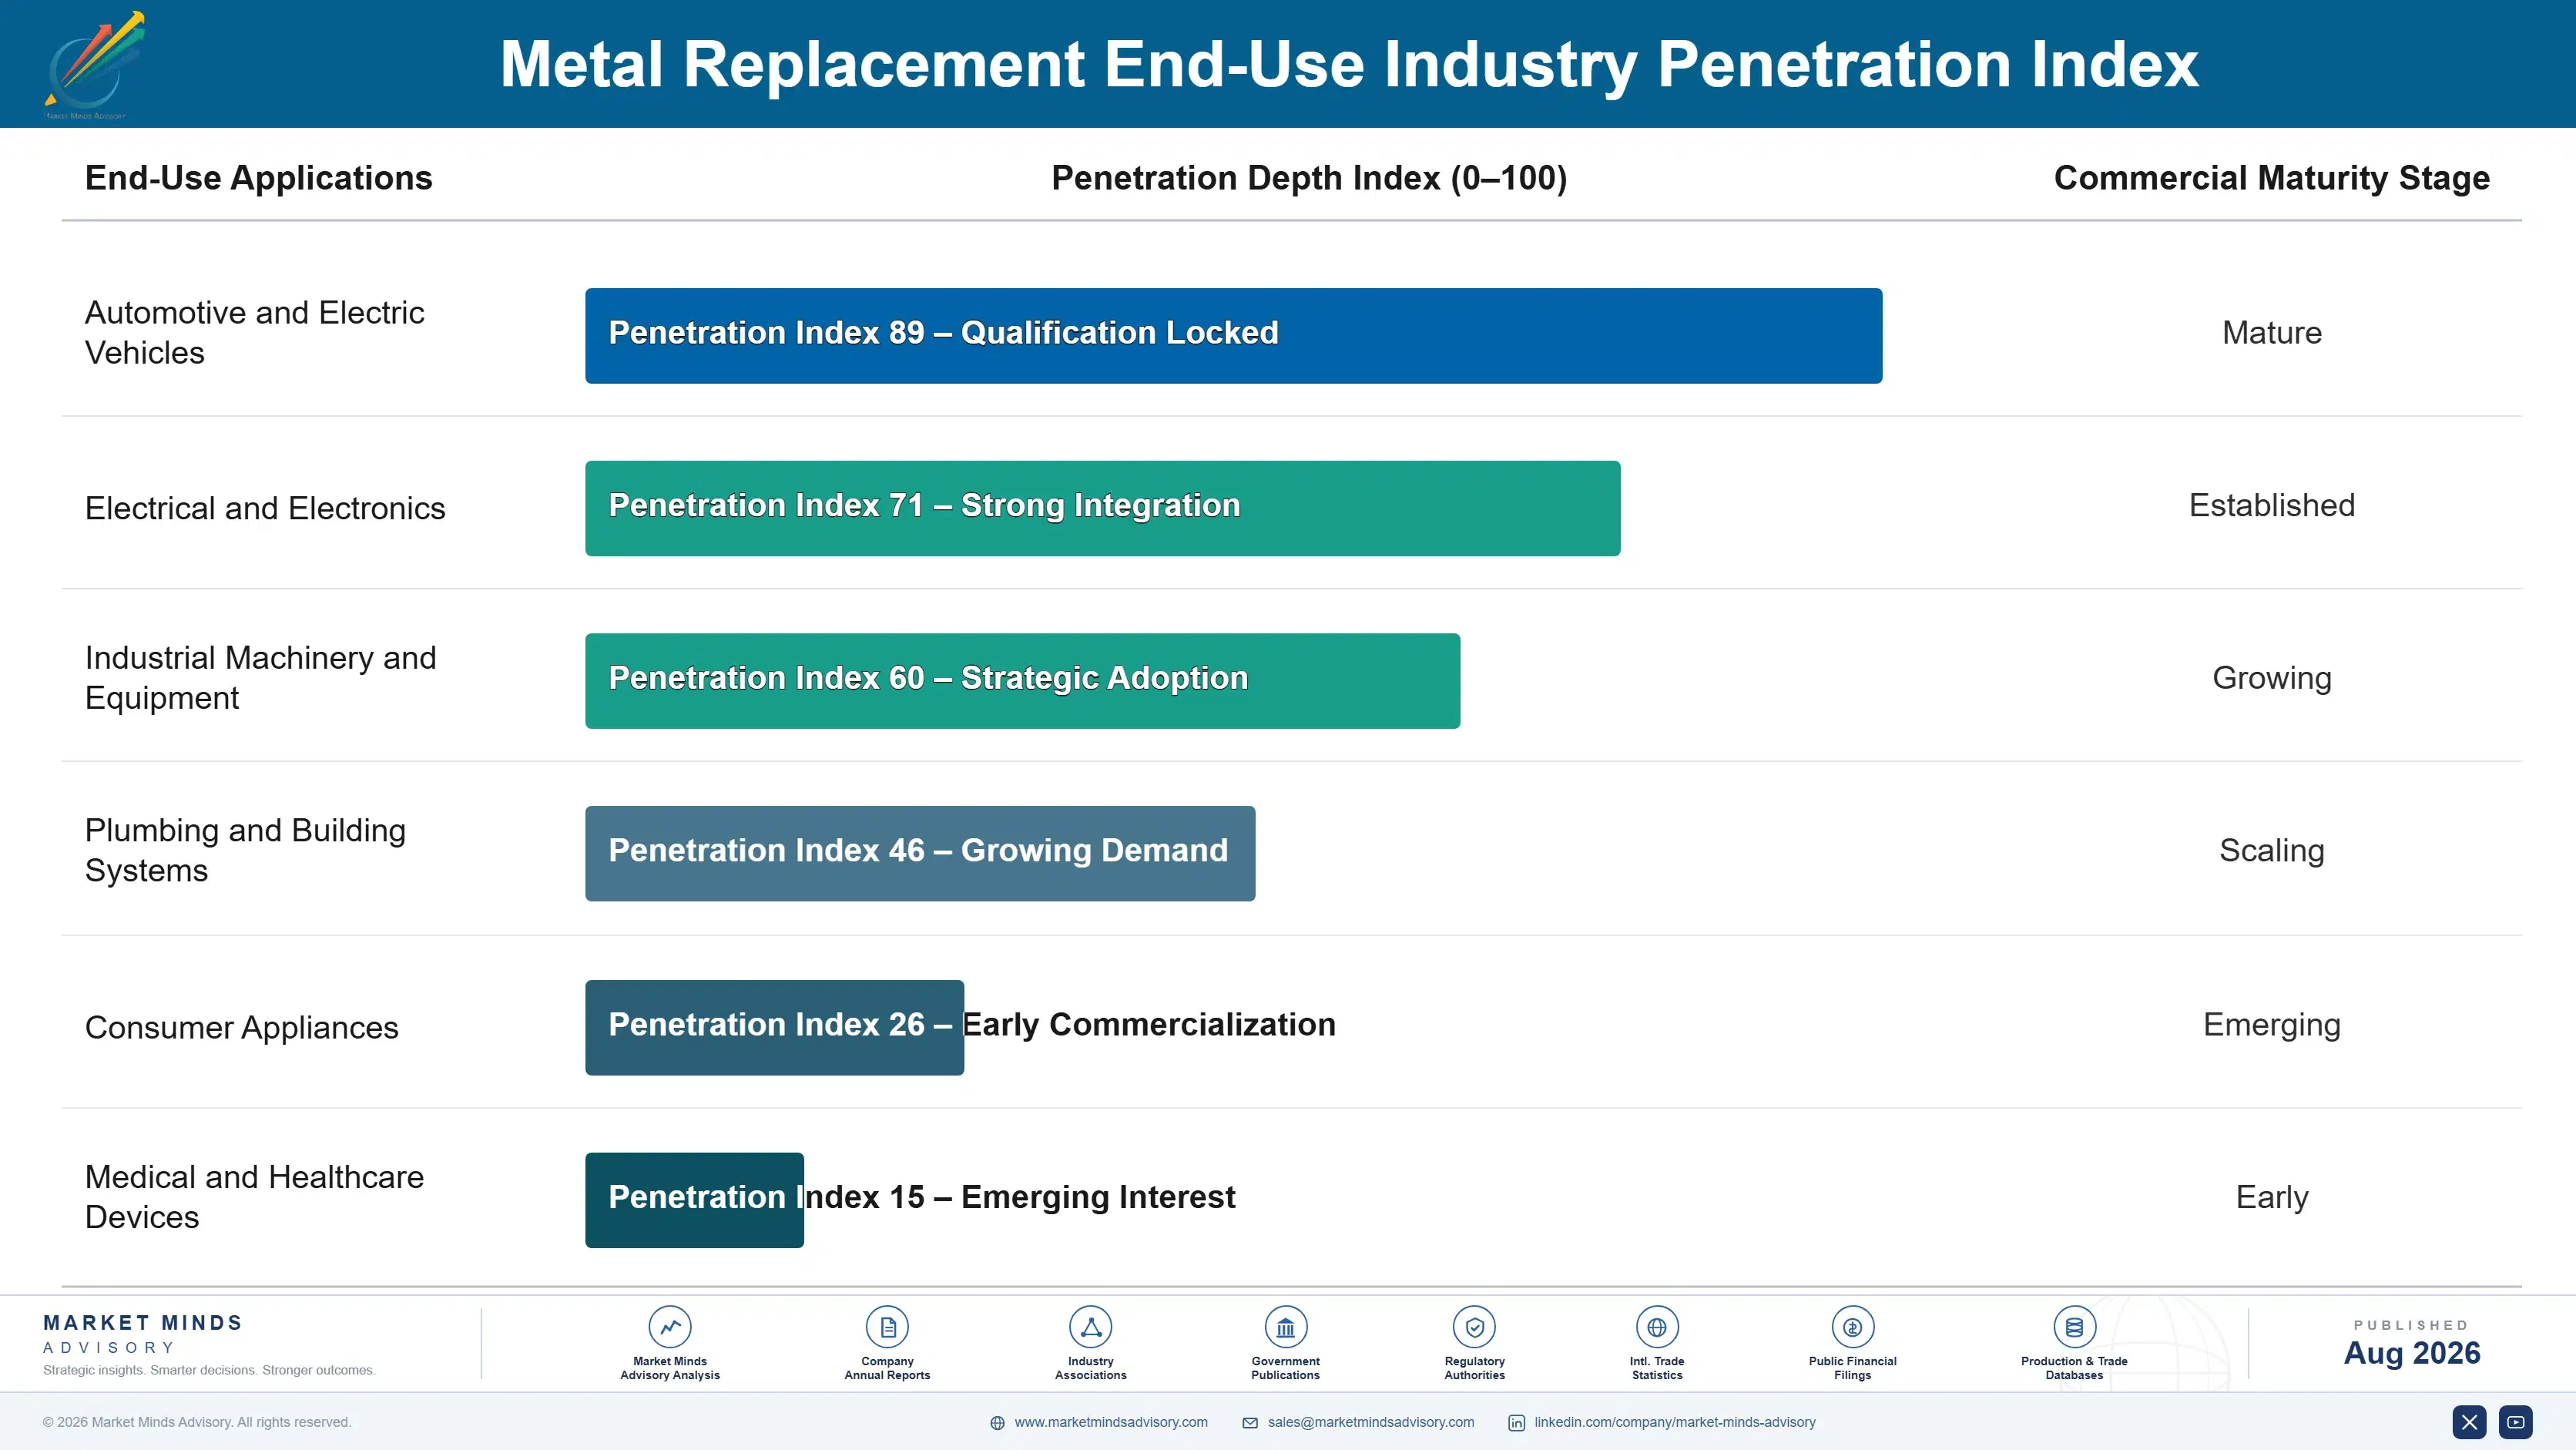
How Substitution Demand Renews

Demand renews on the design decision rather than on any purchasing cycle, and design decisions are made once per component generation. A material specified into a moulded part ships continuously for the programme life with no repurchasing conversation, and changing means new tooling as well as requalification. That makes the specification moment enormously valuable and everything afterwards nearly automatic, which is why suppliers invest application engineering years before revenue appears anywhere.
Stickiness is high and it is now being tested from an unexpected direction. Tooling cost means nobody changes material casually, and requalification adds further resistance. What is reopening positions is regulation rather than commerce, since recycled content obligations force a review that no competitor could have triggered. Standard grades change supplier at contract renewal where the specification is generic enough to permit it.

The buyer has widened in a way suppliers built for engineers have handled badly. Material selection sat with design engineers weighing mechanical properties, processing and cost per part. It now includes sustainability functions asking about recovery routes and recycled content, and those people are entirely unmoved by a tensile modulus comparison.
metal-replacement-market-trends-end-use-penetration-index-1787555538116

Where To Place The Bet

These are among the four positions where our research anticipates prominent divergence between winners and laggards over the coming forecast period. Each is grounded in the demand model, the regulatory perimeter, and the announced capacity pipeline.
01 / FUNCTIONAL APPLICATION FOCUS

Sell what metal cannot do at all

Electrical isolation, flame retardancy and thermal runaway containment are properties metal simply does not provide at any mass or in any manufactured form, and a high-voltage vehicle requires every one of them. That makes electrically functional grades a substitution on function rather than on weight, compounding at 11.7% with no incumbent material to displace and no comparison anybody needs to argue. Suppliers still leading with mass savings are prosecuting a case that concluded fifteen years ago in front of customers who agreed with them at the time.
02 / CIRCULARITY ANSWER DEVELOPMENT

Have a recovery story before the review happens

Glass-reinforced components recover at roughly 9% into any useful material while automotive metal recovers at around 76%, and European end-of-life and recycled content obligations are pricing that difference into design decisions for the first time in this industry's history. Suppliers with no answer are watching substitutions everybody considered permanently settled reopen on a criterion they never had to address before. Mono-material and recyclable reinforced systems compound at 9.8%, cost more, and customers facing those regulations will pay the difference willingly.
03 / REGULATED CONVERSION CAPTURE

Follow contaminant rules into plumbing fittings

Lead content limits in drinking water contact applications catch traditional brass fittings directly, where lead functions as a machinability aid that cannot be removed without fundamentally changing how the alloy behaves in production. Lead-free brass costs considerably more and machines worse, while high-performance polymer systems sidestep the question entirely and satisfy plumbing codes on chlorine resistance, scale and thermal cycling. The installed base runs to billions of fittings and conversion follows published regulatory deadlines rather than any commercial persuasion effort at all.
04 / LOW VOLUME ROUTE DEVELOPMENT

Reach applications injection moulding cannot serve

Injection tooling recovers its cost only above roughly 180,000 units, which excludes industrial and capital equipment applications where annual volumes run in the hundreds regardless of how strong the technical case for substitution genuinely is. That leaves a substantial addressable population entirely untouched by an industry organised around high-volume moulding economics. Machinable stock shapes, compression moulding and additive routes all reach lower volumes at unit costs those customers absorb comfortably, since the metal alternative these customers currently use was being machined anyway.

Engagement Snapshot From the Field

A live engagement with an industry participant carrying material or product regulatory and market exposure ahead of a defining policy shift, showing how our research translates into a defensible multi-year portfolio strategy.
MARKET MINDS ADVISORY · CLIENT ENGAGEMENT SUMMARY
Metal Replacement Producer Strategic Portfolio Review and Transition Roadmap 2026·Investment Scenario on Metal Replacement Exposure Evaluation 2025-26
CLIENT PROFILE
A European engineering polymer supplier with annual revenue around EUR 290 million (client-reported, unverified by MMA), compounding reinforced polyamide and polyester grades for automotive and industrial customers. Roughly 70% of volume sat in standard glass-reinforced grades. The business held limited flame retardant capability and no recyclable mono-material development. Application engineering was thinly staffed. Specialty mix was declining steadily.
STRATEGIC CHALLENGE
Volume had been lost across two years to Asian compounders on standard grades (client-reported, unverified by MMA) and management proposed cutting compounding cost to compete. Nobody had asked whether the standard grade business was defensible at any cost level, or what the recycled content requirements arriving from customers would do to the remaining portfolio.
MMA APPROACH
MMA assessed the client's standard grade positions against Asian compounder cost structures to establish whether any cost reduction could close the gap. Recycled content requirements were mapped across the customer base with timing. Electrically functional grade requirements were benchmarked against the client's existing capability, and application engineering resource was compared with competitors winning specialty conversions.
KEY FINDINGS
  1. No achievable cost reduction closed the gap to Asian compounders on standard grades, which meant the proposed programme would have consumed capital defending an indefensible position.
  2. Recycled content obligations were reaching roughly 40% of the client's automotive volume within four years, and the client had no mono-material development under way at all.
  3. Electrically functional grade requirements sat close to the client's existing flame retardant capability, needing qualification investment rather than any fundamentally new chemistry.
  4. Competitors winning specialty conversions employed several times the application engineering resource, which explained the loss pattern better than any material or price comparison did.
CLIENT PROFILE
A European engineering polymer supplier with annual revenue around EUR 290 million (client-reported, unverified by MMA), compounding reinforced polyamide and polyester grades for automotive and industrial customers. Roughly 70% of volume sat in standard glass-reinforced grades. The business held limited flame retardant capability and no recyclable mono-material development. Application engineering was thinly staffed. Specialty mix was declining steadily.
STRATEGIC CHALLENGE
Volume had been lost across two years to Asian compounders on standard grades (client-reported, unverified by MMA) and management proposed cutting compounding cost to compete. Nobody had asked whether the standard grade business was defensible at any cost level, or what the recycled content requirements arriving from customers would do to the remaining portfolio.
MMA APPROACH
MMA assessed the client's standard grade positions against Asian compounder cost structures to establish whether any cost reduction could close the gap. Recycled content requirements were mapped across the customer base with timing. Electrically functional grade requirements were benchmarked against the client's existing capability, and application engineering resource was compared with competitors winning specialty conversions.
KEY FINDINGS
  1. No achievable cost reduction closed the gap to Asian compounders on standard grades, which meant the proposed programme would have consumed capital defending an indefensible position.
  2. Recycled content obligations were reaching roughly 40% of the client's automotive volume within four years, and the client had no mono-material development under way at all.
  3. Electrically functional grade requirements sat close to the client's existing flame retardant capability, needing qualification investment rather than any fundamentally new chemistry.
  4. Competitors winning specialty conversions employed several times the application engineering resource, which explained the loss pattern better than any material or price comparison did.
RECOMMENDED STRATEGY
Phase 1: Phase one: stop defending standard grade volume on cost and redirect that capital toward application engineering headcount instead of compounding efficiency. Phase 2: Phase two: begin mono-material recyclable development immediately, well ahead of the recycled content obligations reaching that affected automotive customer volume. Phase 3: Phase three: qualify electrically functional grades from the existing flame retardant base, targeting battery and high-voltage vehicle component applications directly.
OUTCOME
The cost reduction programme was cancelled and application engineering headcount roughly doubled. Mono-material development is running with first grades expected in 2027. Electrically functional qualification is under way with two customers, and the client reports specialty mix improving materially (client-reported, unverified by MMA). Standard grade volume keeps falling.

Frequently Asked Questions

Foundational context covering the market sizes, CAGR, scope, country, region and competition that inform every finding below. This section is provided to cover basics and most often pre-purchase conversations, answered from the MMA Primary Research Dataset.

What is the current size of the Metal Replacement Market?

The market was valued at USD 32.4 billion in 2025, rising to an estimated USD 34.93 billion in 2026. East Asia holds the largest regional share at 30% of value.

How large will the Metal Replacement Market be by 2036?

MMA forecasts USD 74.02 billion by 2036 under the base case, an expansion multiple of 2.12 times the 2026 value. That represents USD 39.09 billion of incremental value.

What is the CAGR for the Metal Replacement Market 2026 to 2036?

The base case runs at 7.8% compound annual growth between 2026 and 2036, with a bull case at 9.0% and a bear case at 6.5%. Historical growth from 2020 to 2025 was 6.6%.

Which segment is growing fastest?

Electrically functional polymers lead at 11.7%, half again the market rate, delivering isolation and flame properties metal cannot provide anywhere. High-temperature polymers follow at 10.4%.

Who are the major companies in the Metal Replacement Market?

BASF, Celanese, SABIC, Solvay and Envalior hold 36% of supply between them. Application engineering and compounding capability rather than base resin scale sustain those positions.

Which country is growing fastest?

India leads at 11.4%, driven by manufacturing expansion across appliances, electrical equipment and vehicles, alongside electrification programmes that keep arriving at exactly the same time.

Report Segmentation Architecture

The full report scope spans multiple orthogonal segmentation dimensions, with cross-tabulated demand data provided for each dimension pair. Coverage extends further to regional breakdowns, trend trajectories, and the competitive detail needed to support segment-level decision-making.

By Polymer Class

  • Glass-Reinforced Engineering Thermoplastics
  • Long Fibre Thermoplastic Composites
  • High-Temperature Polymers
  • Thermoset Composites and Sheet Moulding Compound
  • Electrically Functional Polymers
  • Recyclable and Mono-Material Polymer Systems

By End-Use Industry

  • Automotive and Electric Vehicles
  • Electrical and Electronics
  • Industrial Machinery and Equipment
  • Plumbing and Building Systems
  • Consumer Appliances
  • Medical and Healthcare Devices

By Supply Arrangement

  • Direct Moulder Supply
  • Original Equipment Specification
  • Compounder Toll Arrangement
  • Distributor Channel
  • Development Partnership Supply

By Region

  • North America
  • Western Europe
  • East Asia
  • South Asia and Pacific
  • Latin America
  • Middle East and Africa
  • Eastern Europe

Scope, Methodology, and Coverage

Every figure in this report is reproducible from documented input assumptions. The scope below maps the historical period, the forecast horizon, the segmentation dimensions, and the countries covered, alongside the underlying primary and qualitative methodology.
Historical Period
2020 to 2025
Forecast Period
2026 to 2036
Base Year
2025 (USD billions; MMA Primary Research Dataset, August 2026)
Market Definition
The market comprises polymer and composite materials supplied specifically to replace metal in functional and mechanical components across automotive, electrical, industrial, plumbing, consumer and medical applications, covering glass-reinforced engineering thermoplastics, long fibre thermoplastic composites, high-temperature polymers, thermoset composites, electrically functional polymers, and recyclable and mono-material systems. Value is measured at material supplier level. Exterior automotive body panels, commodity packaging polymers, metal-for-metal substitution, finished component manufacture and tooling supply fall outside scope.
Quantitative Units
USD billions (current prices); thousand tonnes of material supplied annually; USD per kilogram by polymer class
Segmentation Dimensions
By Polymer Class; By End-Use Industry; By Supply Arrangement; By Region
Regions Covered
North America, Western Europe, East Asia, South Asia and Pacific, Latin America, Middle East and Africa, Eastern Europe
Countries Covered
China, Japan, South Korea, Taiwan, India, Thailand, Vietnam, Indonesia, Australia, United States, Canada, Mexico, Germany, Netherlands, France, Italy, Belgium, United Kingdom, Spain, Switzerland, Poland, Czechia, Slovakia, Hungary, Brazil, Argentina, Colombia, Saudi Arabia, Turkey, South Africa
Key Companies Profiled
BASF, Celanese, SABIC, Solvay, Envalior, Covestro, Evonik Industries, LyondellBasell, Mitsubishi Chemical, Toray Industries, Teijin, Asahi Kasei, Kingfa Science and Technology, Avient, RTP Company, Victrex, Arkema, Lotte Chemical, LG Chem, Daicel Corporation
Quantitative Methodology
Primary survey, n=3,800 respondents, Q4 2025, six countries; demand-side model with trade association cross-validation
Qualitative Methodology
47 expert interviews, Q4 2025; applied to validate demand model assumptions, identify emerging dynamics, and assess competitive positioning
Report Format
PDF and XLSX data workbook (Word format preview document)
Publisher
Market Minds Advisory
Report Code
MMA-2026-CHM-646
Published
August 2026
Contact
sales@marketmindsadvisory.com | www.marketmindsadvisory.com

Purchase the full Metal Replacement Market Report (2026 to 2036).

The full report sizes the global metal replacement materials market to 2036 across six polymer classes and seven regions, measured on material revenue at supplier level. It treats circularity regulation as a reopening of settled substitution decisions rather than a compliance detail, and quantifies recovery rates against metal directly. Competitive analysis covers 20 participants evaluated on material revenue, with moat and risk assessment for the two leaders. Electrification applications with no metal predecessor are sized separately from weight-driven substitution, since the commercial logic differs entirely. Four quantified revenue levers close the analysis.
Six-class segment sizing with segment-level growth rates
Seven-region share and growth breakdown to 2036
Twenty-participant competitive map on one revenue basis
Recovery rates compared directly against metal recycling infrastructure
Functional substitution sized separately from weight-driven conversion
Four quantified revenue levers with commercial impact ranges

Built For The People Who Decide

From boardroom strategy to bench-side execution, this report is read cover-to-cover by leaders shaping the next decade of their industry, turning demand scenarios, market dynamics and valuation benchmarks into decisions.
CXOs/ Presidents/ VPs/ Managers
M&A and Corporate Development
Strategy Teams and R&D Heads
Procurement and Product Directors
Regulatory and Compliance Leaders
Investor Relations and Equity Analysts