Market Minds Advisory
Metabolic Cookies Market

Metabolic Cookies Market: Metabolic Cookies Market. Glycaemic Control, GLP-1 Companion Snacking, and Protein-Dense Formats Reshape Blood Sugar Aware Baking.

Metabolic cookies promise steadier blood sugar and satiety in a treat, but claim rules, taste parity, glucose evidence, and GLP-1 driven portion habits decide which bakers turn metabolic health interest into repeat purchase across channels.

Lead Analyst

Published

September 2026

Make Smarter Decisions with Customized Research Insights

Request a free sample report and evaluate market opportunities, growth trends, and competitive dynamics relevant to your business needs.

2025 MARKET VALUE$0.8BMarket Size 2025
2036 FORECAST VALUE$2.3BBase Case , 2026 to 2036
CAGR 2026 TO 203610.2 %Bull 11.5% / Bear 8.9%
INCREMENTAL OPPORTUNITY$1.4BNet 10- year value creation
EXPANSION MULTIPLE2.64x2036 value over 2026 base
Strategic Levers
M&A Pipeline
Regional Outlook
Country Rankings
Competitive Intelligence
Segmental Deep-dive
Call-Us : 91 93563 13602

Executive Snapshot and Market Trajectory.

Most metabolic health advice ends with eat less sugar, and a cookie is the last product anyone expects to help. Metabolic cookies try anyway, using slow-release carbohydrate, protein, and fibre to blunt the glucose spike, and they sell only if a shopper trusts the claim and likes the bite.
GLP-1 companion protein cookies grow fastest, because users of appetite-suppressing drugs eat less and want small, protein-dense portions, while low-glycaemic cookies follow as blood sugar awareness spreads beyond diabetes. North America holds the largest share, since GLP-1 use, continuous glucose monitor culture, and wellness retail concentrate there, with Western Europe and East Asia following. India leads country growth. Subscriptions add trial. Claims stay cautious.
The industry is fragmented but consolidating, as nutrition groups, snack majors, and specialist bakers compete on glycaemic evidence, taste parity, and retail placement. Health claim rules in the European Union and the United States limit what packs can say about blood sugar, while sweetener labelling and allulose approvals reshape recipes. Small brands struggle to fund clinical studies. Larger groups buy them instead, which is how the leading five keep their position. Deals follow.
Market Definition
Metabolic cookies comprise baked cookies and biscuits formulated and marketed for blood sugar management, satiety, or metabolic health, including low-glycaemic, ketogenic and low-carb, GLP-1 companion protein, slow-release carbohydrate, botanical-enriched, and collagen and amino acid-enriched cookies, sold through retail, online, pharmacy, and subscription channels. The scope excludes meal-replacement bars, medical foods, diabetic bakery sold under prescription, and general low calorie cookies without a metabolic claim.
Base Year Value
$0.8B in 2025 (MMA Primary Research Dataset, September 2026)
Forecast Period
2026 to 2036, eleven discrete annual values
CAGR
10.2% base case. Bull 11.5%. Bear 8.9%.
Fastest Growth Segment
GLP-1 Companion Protein Cookies: 14.6% CAGR
Fastest Growth Country
India: 12.8% CAGR
Fastest Growth Region
South Asia and Pacific: 12.3% CAGR
Largest Region
North America: 44% of 2025 global value
Market Leaders
Simply Good Foods, The Hershey Company, Flowers Foods, Mondelez International, Kellanova. Source: MMA Analysis, company annual reports.
Primary Survey
n=3,800 procurement and R&D decision-makers, Q4 2025, six countries
Methodology
Demand-side build-up, cross-validated against public data, 47 expert interviews

Metabolic Cookies Market Forecast Scenarios

metabolic-cookies-market-size-forecast-scenario-1789788721268
From 2020 to 2025, metabolic cookies moved from a keto and diabetic niche toward a wider blood sugar aware category. Continuous glucose monitors reached healthy consumers, sugar reduction rules spread, and protein snacking grew quickly, while taste complaints and thin clinical evidence kept repeat purchase uneven. Growth ran slightly below today's pace, and specialist online brands supplied most of the early volume.
The base case rests on three commercial mechanisms. First, GLP-1 drug adoption creates a large group of shoppers who eat smaller portions and want protein and fibre in every bite. Second, retailers open dedicated metabolic health shelves that group cookies with bars and shakes. Third, sweetener approvals, including allulose in more countries, lower the taste penalty that once limited repeat purchase. Each mechanism compounds slowly, so the base case needs no breakout year.
The bull case needs published clinical results showing lower glucose response from a cookie format, which would let brands make firmer claims and win pharmacy listings. The bear case is a regulatory crackdown on glucose claims or a sweetener safety scare, which would force reformulation and cut repeat purchase among shoppers who already doubt the category.

Glucose Evidence and Taste Parity Decide Metabolic Cookie Winners

Metabolic cookies reach their claims by four routes: replacing sugar with allulose, erythritol, and stevia, swapping wheat flour for almond, seed, or pulse flours, adding protein and fibre to slow absorption, and shrinking the portion itself. Each route trades away something, whether spread, browning, or price, and winning recipes hide the trade well enough that shoppers judge the cookie on taste alone, not on the label.
MARKET CONCENTRATION31% CR5Leading five brands hold a moderate combined share
NET CARBOHYDRATE CONTENT5 gTypical net carbohydrate per serving in leading metabolic cookies
PRICE PREMIUM85%Metabolic cookies sell above conventional cookies per kilogram
PROTEIN PER SERVING10 gTypical protein content per serving in companion cookie lines
ONLINE CHANNEL SHARE38%Portion of category sales through e-commerce and subscriptions
REPEAT PURCHASE RATE46%Share of first-time buyers who purchase again within ninety days
Evidence separates the leaders from the rest. Brands that publish glucose response data, run studies with university partners, or cite recognised glycaemic index testing win pharmacy and dietitian support, while brands that rely on keto language alone face scepticism. Studies cost between $100,000 and $500,000 per product, so large groups and well-funded specialists hold an advantage that small bakers cannot easily match or copy.
Retail buyers judge these cookies on repeat rates, claim compliance, and shelf velocity. Supermarkets want proof that a premium price does not cause returns, and pharmacy chains want clear wording that passes regulator review. Private labels enter slowly because formulation and claim risk are high, which protects branded margins for now, though copies will arrive as sweetener supply widens.
"A metabolic cookie sells a promise about what happens two hours after the last bite. The brands that win will be the ones that can prove that promise with data, because shoppers who track their glucose will notice within days if it is false."
Practice Lead, Functional Bakery Snacks Practice · MMA Functional Biscuits and Cookies Practice · September 2026

Market Trends

GLP-1 Companion Snacks Reshape Portion and Protein Targets

Surveys suggest roughly one in eight United States adults have used a GLP-1 drug, and users report smaller appetites, protein shortfalls, and cravings for sweet treats. Brands now sell cookies of 100 to 140 calories with 10 to 15 grams of protein and fibre, marketed as companion snacks that fit small meals. Dietitians recommend protein first, so these lines sit beside shakes and bars in pharmacies and online storefronts, and across most channels. Repeat purchase rises when brands publish nutrient tables and portion guidance, and subscription offers keep users supplied during dose changes.
Market Impact: 590 million adults live with diabetes
Continuous Glucose Monitors Push Blood Sugar Awareness Into Snack Choices

Over-the-counter continuous glucose monitors reached United States consumers in 2024, and apps now show how each snack moves blood sugar within minutes. Shoppers who see a spike from a standard cookie look for lower-glycaemic options, and brands respond with slow-release starches, fibre, and fat systems. Some bakers publish sample glucose curves and partner with app developers. The trend is small but fast, and it rewards brands that measure results rather than copy keto recipes, since informed shoppers test claims against their own data. Early adopters share their results on social media.
Market Impact: sugar rules cover 20+ countries

Market Opportunities and Growth Drivers

Rising Diabetes and Prediabetes Prevalence Widen the Buyer Base

The International Diabetes Federation estimates about 590 million adults live with diabetes worldwide, and prediabetes affects far more. Doctors advise limiting refined sugar, and patients search for snacks that fit meal plans. Pharmacies and health retailers now stock lower-glycaemic cookies beside test strips and supplements, and insurers in some markets fund nutrition counselling. Brands that show net carbohydrate content, fibre, and sweetener type clearly earn trust, while those with vague claims lose repeat buyers, because patients read labels closely and share feedback in online communities. Online patient forums amplify feedback very quickly.
Market Impact: claim studies cost $100,000 or more

Sugar Reduction Rules and Sweetener Approvals Improve Recipe Options

The United States FDA excludes allulose from added sugar labelling, and several Asian markets have approved it, which gives bakers a sugar-like sweetener with fewer calories. Sugar taxes and warning label laws in more than 20 countries push large brands to reformulate, and each reformulation spreads knowledge about blends, fibres, and bulking agents. Better ingredients improve taste and browning, so metabolic cookies lose the chalky texture that kept early products in a niche and repeat purchase gradually improves. Retailers also ask suppliers to show sweetener content, which helps informed brands win reviews and larger listings.
Market Impact: repeat rates trail by 10-20 points

Market Restraints and Challenges

Health Claim Rules Restrict Blood Sugar Marketing on Cookie Packs

The European Union authorises only specific glycaemic wording, and the United States FDA limits disease claims, so cookies cannot say they treat or prevent diabetes. Brands rely on phrases such as low sugar, low net carb, or supports steady energy, which weakens the promise shoppers want. The root cause is thin clinical evidence for baked products, and regulators require product-specific data. Mitigations include glycaemic index testing, dietitian partnerships, and notified claims, though each costs $100,000 or more and delays launches by 12 to 18 months. Legal review adds cost at every launch.
Market Impact: companion cookies carry 10-15 g protein

Taste, Texture, and Sweetener Tolerance Limit Repeat Purchase

Replacing sugar and wheat removes bulk, browning, and moisture, and sweeteners add cooling, bitterness, or gastric effects at high doses. Shoppers who try a metabolic cookie and dislike it rarely return, so repeat rates trail standard cookies by 10 to 20 points among casual buyers. The root cause is that sugar and wheat perform several technical jobs at once. Brands respond with blended sweeteners, pulse flours, and sensory panels, though each fix adds cost and lengthens development by six to nine months. Casual buyers also compare price against standard cookies at the shelf.
Market Impact: over-the-counter monitors launched in 2024
3 additional market trends, 2 additional growth drivers, and 3 additional restraints and challenges are covered in the full report. Contact sales@marketmindsadvisory.com to access the complete intelligence.

Segment CAGR and Growth Architecture

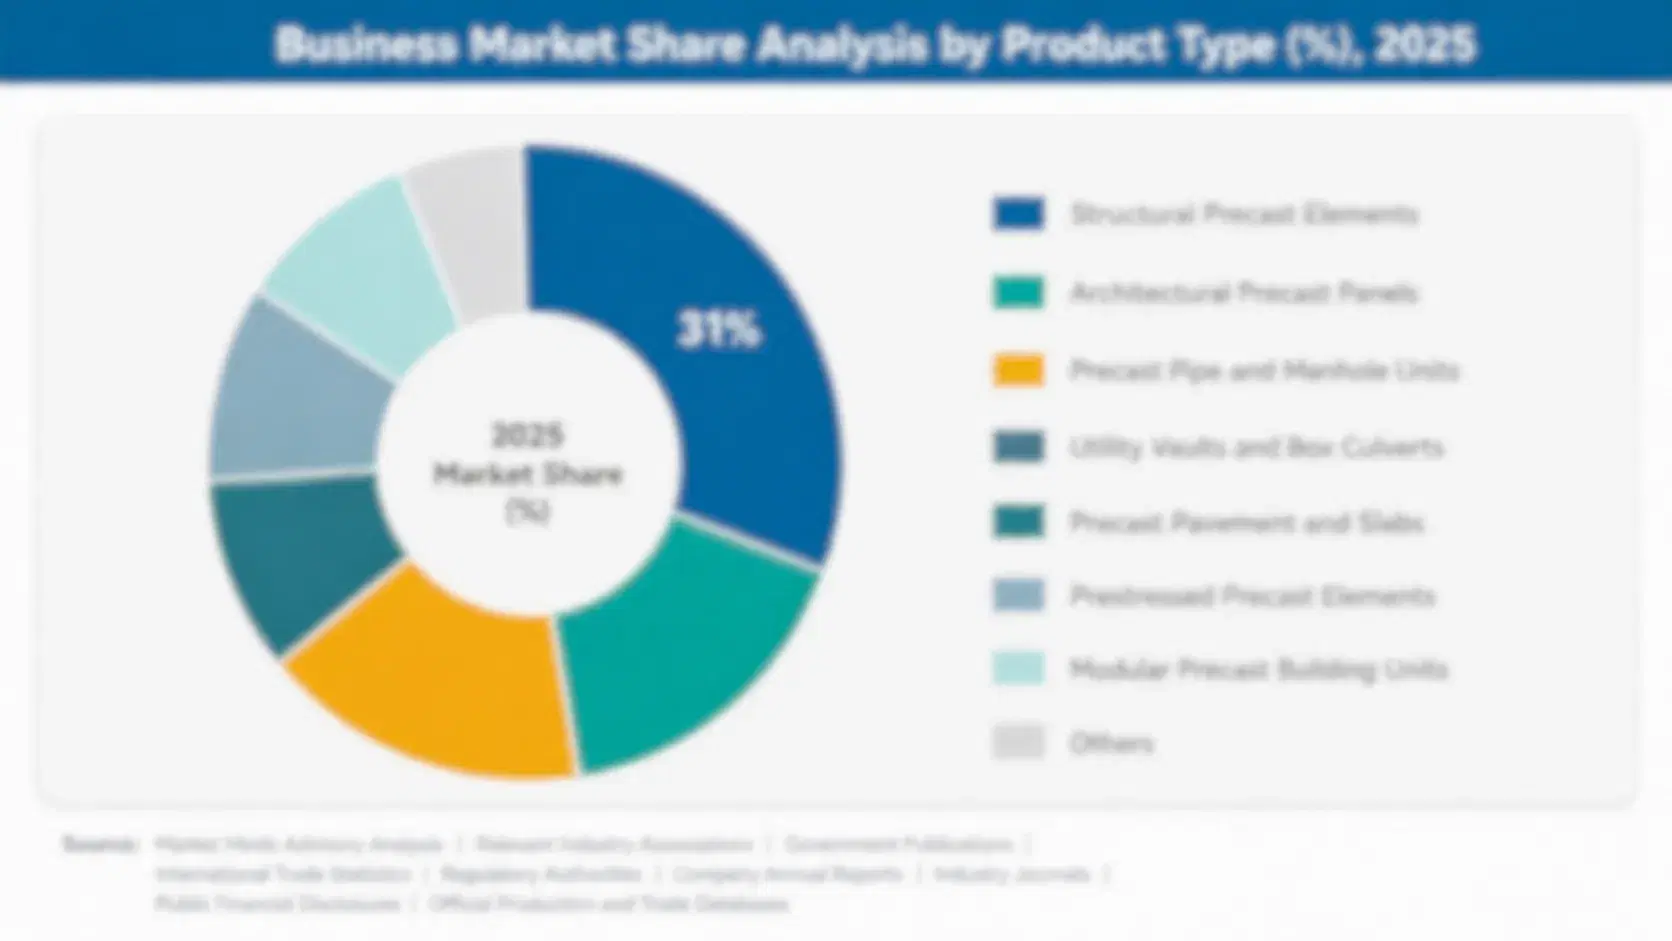
Metabolic cookies are segmented by the metabolic claim mechanism built into the recipe, which shows where evidence and pricing power sit. Six segments cover low-glycaemic, ketogenic and low-carb, GLP-1 companion protein, slow-release carbohydrate, botanical-enriched, and collagen and amino acid-enriched cookies. Two segments grow fastest, and each depends on a different motive, either appetite support or glucose awareness.
metabolic-cookies-market-market-share-analysis-1789788721575

GLP-1 Companion Protein Cookies

GLP-1 companion protein cookies are the fastest-growing segment, at 14.6% a year, about 1.43 times the overall market rate. Users of appetite-suppressing drugs eat smaller meals, need protein and fibre, and still crave sweet treats, so brands sell 100 to 140 calorie cookies with 10 to 15 grams of protein. Prices run 90% to 140% above standard cookies. Pharmacies, subscription services, and clinic partnerships add channels, while taste and chalky texture remain the constraint. Brands with dietitian support and clear nutrient tables win repeat purchase, and co-manufacturers with protein baking experience set supply and pricing power in the segment. Clinics and telehealth providers also give starter packs to new patients, which builds trial before shoppers reach retail shelves.
CAGR 14.6%

Low-Glycaemic Cookies

Low-glycaemic cookies grow at 11.8% a year, because rising diabetes awareness and glucose monitor use push shoppers toward snacks that show a lower blood sugar response. Brands use slow-release starches, fibre, and allulose blends, and some publish glycaemic index test results. Pharmacies, health retailers, and online stores are the main channels, and prices run 60% to 100% above standard cookies. The risk is claim scrutiny, since regulators require product-specific evidence. Brands with third-party testing win dietitian recommendations and stable shelf space in supermarkets that group these cookies beside diabetic-friendly foods. Sample glucose curves from app partners appear on packs and product pages. Pharmacy staff recommend tested lines to patients, and repeat rates beat those of untested rivals.
CAGR 11.8%
Full segment breakdown across 6 segments available in the complete report.

Regional Architecture and Country Demand Map

Metabolic cookie value follows GLP-1 use, glucose monitor culture, and wellness retail. North America leads on drug adoption and online subscriptions, Western Europe on pharmacy and dietitian channels, and East Asia on functional snack habits, while South Asia and Pacific grows fastest from a smaller base.

North America

North America holds 44% share, above its usual band, because the United States has the highest GLP-1 drug use, the earliest over-the-counter glucose monitors, and the largest online subscription and natural grocer network for functional snacks, so per-capita spending on metabolic cookies is the highest in the world. Simply Good Foods, Hershey, Flowers Foods, and specialist online brands lead. Pharmacies and warehouse clubs add reach, and dietitian endorsements build trust. Claim scrutiny, taste complaints, and price resistance restrain returns. North America and Western Europe hold the top two positions because both combine large nutrition groups with active metabolic health consumers. Canada adds a smaller pharmacy channel. Costco lists multipacks near the pharmacy aisle.
Share: 44% | CAGR: 10.0% (2026 to 2036)

Western Europe

Western Europe holds 20% share, with the United Kingdom, Germany, France, Italy, and the Nordic countries leading through pharmacy channels, dietitian recommendations, and high diabetes awareness. Strict health claim rules under European Union regulation limit marketing, so brands use nutrient claims such as high protein and high fibre instead of blood sugar wording. Danone, Nestle, Lotus Bakeries, and Bahlsen compete with specialist brands and private labels, and allulose remains unapproved, so polyols and fibres dominate recipes. Nutri-Score grades reward lighter recipes in France and Germany. Growth stays below the global rate because claim rules are strict and pharmacy listings move slowly. Boots and DM stock tested lines beside supplements for shoppers who ask pharmacists.
Share: 20% | CAGR: 8.9% (2026 to 2036)
Regional intelligence for 5 additional markets available in the complete report: East Asia, South Asia and Pacific, Latin America, Middle East and Africa, Eastern Europe. Contact sales@marketmindsadvisory.com.
metabolic-cookies-market-country-cagr-analysis-1789788721907

Four Margin Routes for Metabolic Cookie Brands

Margin in metabolic cookies comes from clinical evidence, protein content, subscription economics, and ingredient cost control rather than volume alone. The routes below apply to specialist brands, snack majors, and contract manufacturers, and each can be started inside one planning cycle, with clear measures in gross margin points, repeat purchase rates, and price per kilogram across channels.

Selling GLP-1 Companion Cookies Through Pharmacies and Clinic Partners

GLP-1 companion protein cookies sell at 90% to 140% above standard cookies, and pharmacies, telehealth clinics, and dietitian networks give brands access to users at the moment of need. Brands that offer 10 to 15 grams of protein, publish nutrient tables, and provide clinic starter packs report margin gains of 6 to 9 points on those lines. Pharmacy listings also lend credibility, while subscription offers keep users supplied through dose changes and lift repeat purchase across the following year for most participating brands. Clinics often bundle packs with written dietitian advice.
Market Impact: companion lines lift blended margin 6 to 9 points

Funding Glucose Response Studies to Support Premium Pricing

Brands that fund glycaemic index or glucose response studies, at $100,000 to $500,000 per product, can defend prices 60% to 100% above standard cookies and win dietitian recommendations. Studies also support notified claims and pharmacy listings, which private labels cannot easily copy. Payback typically runs 18 to 30 months, and results can be reused across a product family, so brands should test a base recipe first and then extend claims to flavour variants at lower incremental cost. Regulators also respond better to claims that cite named tests, which shortens review and reduces legal costs.
Market Impact: evidence supports 60-100% price premiums over standard cookies

Building Subscription Programmes That Convert Trial Into Repeat Orders

Online subscriptions account for roughly 38% of category sales, and brands that offer sampler boxes, flexible delivery, and glucose or protein tracking guides lift 90-day repeat purchase from about 46% toward 60%. Subscription revenue also gives predictable volume for co-manufacturers and lowers marketing cost per active customer by 20% to 30%. Brands should limit discounting, track churn monthly, and add small recipe rotations so that subscribers do not tire of a single flavour or format. Data from subscribers also shows which flavours retain buyers, which guides range planning and reduces waste from slow lines.
Market Impact: subscriptions lift 90-day repeat purchase by 14 points

Hedging Protein, Sweetener, and Nut Flour Costs Under Annual Contracts

Whey protein, allulose, erythritol, and almond flour costs can move 20% to 40% within a year, so forward contracts protect margin more than price increases do. Brands that fix volumes for 12 to 18 months and dual-source sweeteners from Asia and North America reduce cost swings by roughly half. Retailers accept price changes slowly, so hedging avoids the squeeze between input costs and fixed shelf prices, and it stabilises gross margin at 38% to 44% across ranges. Smaller brands can join buying groups or co-manufacturer purchasing pools to reach volume pricing without holding all the inventory risk.
Market Impact: hedging halves ingredient cost swings and protects 38-44% margin

Who Controls the Margin Pool

The metabolic cookie industry is moderately concentrated, with a CR5 of 31%, and specialist online brands and private labels sit outside the leading five. This assessment measures participants on estimated metabolic and low-carb cookie sales, held constant across all players. Simply Good Foods leads through Quest and Atkins, while Hershey, Flowers Foods, Mondelez International, and Kellanova follow, and a clear gap separates the leader from the challengers.
Competition runs on four dimensions today: net carbohydrate and protein content, taste parity against standard cookies, evidence behind glucose claims, and retailer placement in pharmacy and wellness aisles. Large groups buy specialist brands rather than build them, while smaller brands win on subscription loyalty and community trust. Private labels are slow to enter because claim risk is high, so premiums hold longer here than in ordinary cookies.

Emerging pressure comes from GLP-1 focused snack brands, pharmacy private labels, and pharmaceutical nutrition groups that already sell to patients. Rankings shift where a brand secures allulose access, funds clinical studies, or signs clinic partnerships. Regional brands in India and East Asia can move up quickly, since local taste knowledge and diabetes awareness matter more than global scale.
metabolic-cookies-market-company-positioning-matrix-1789788722229

Competitive Moat and Risk Dimensions

SIMPLY GOOD FOODS

Moat: Quest and Atkins Brand Platform

Simply Good Foods owns Quest and Atkins, two of the best-known low-carb and high-protein brands, with strong positions in supermarkets, warehouse clubs, and online stores. Its protein cookie and bar experience gives it formulation skill and co-manufacturer relationships, while long-standing brand awareness among diabetic and weight-conscious shoppers supports repeat purchase.
SIMPLY GOOD FOODS

Risk: Keto Image and Claim Scrutiny

Simply Good Foods relies on low-carb positioning that some shoppers now see as dated as GLP-1 and glucose-aware buyers seek protein and fibre balance. Sweetener safety headlines and regulator scrutiny of net carbohydrate claims also threaten trust, while private label and new entrants compete on price.
THE HERSHEY COMPANY

Moat: Lily's and ONE Brands Reach

Hershey owns Lily's, a stevia-sweetened chocolate brand, and ONE Brands, a protein bar business, and it distributes through supermarkets, convenience stores, and club channels across North America. Its scale funds sweetener research and sensory testing, and its retail relationships give new lines strong placement in confectionery and wellness aisles before rivals can respond.
THE HERSHEY COMPANY

Risk: Cocoa Costs and Taste Perception

Hershey faces cocoa and sugar cost inflation across its global portfolio, which leaves less room to invest in metabolic lines. Shoppers also judge sugar-free versions against familiar chocolate cookies, so taste complaints and sweetener tolerance issues can damage repeat purchase in a category that depends on trust.

Players Tracked

Prominent Players

Simply Good Foods
The Hershey Company
Flowers Foods
Mondelez International
Kellanova

Other Key Players

General Mills
Nestle
Danone
Abbott Laboratories
Glanbia
Grupo Bimbo
Pladis
Lotus Bakeries
Britannia Industries
Yamazaki Baking
Lotte Wellfood
Orion
Bahlsen
Barilla
Mars

Recent Developments

JANUARY 2026

Quest Launches GLP-1 Companion Protein Cookie Range in United States Retail

Simply Good Foods announced a Quest protein cookie range with 12 grams of protein and reduced portion size, marketed to users of appetite-suppressing drugs through pharmacies and supermarkets. It is a product launch, and it tests whether companion positioning can earn premiums beyond existing low-carb buyers.
Signal: Confirms leading nutrition groups now target GLP-1 users directly with portion-sized protein cookies in mainstream retail.
FEBRUARY 2026

Hershey Expands Lily's Cookie Range With Allulose and Fibre Blends

Hershey expanded Lily's into cookies using an allulose and fibre blend that cuts net carbohydrate to about five grams per serving, sold through supermarkets and club stores. It is a product line extension, and it tests whether stevia-based chocolate shoppers will follow the brand into baked snacks.
Signal: Shows confectionery majors now extend low-sugar brands into cookies rather than build new metabolic labels from scratch.
MARCH 2026

Flowers Foods Adds Glucose Response Testing to Simple Mills Cookie Claims

Flowers Foods announced glucose response testing with a university partner for selected Simple Mills cookie products, aiming to support shelf communications with measured data. It is a research partnership, not an acquisition, and it tests whether evidence can lift pharmacy and dietitian recommendations. Results were not disclosed.
Signal: Indicates leading wellness brands now treat clinical evidence as a competitive asset rather than an optional marketing extra.

What Drives Metabolic Cookie Ingredient Costs

Protein ingredients and nut or seed flours account for roughly 24% of cost of goods, sweeteners and fibres about 16%, fats and oils 12%, and cocoa or inclusions 8%. Packaging takes 16% because portion packs need individual wrapping. Whey protein comes from the United States and the European Union, almond flour from California, and allulose and erythritol mainly from China, South Korea, and the United States.
The clearest recent shock came from protein. United States Department of Agriculture dairy reports showed whey protein concentrate prices rising sharply during 2024 and 2025 as demand from protein snacks and beverages outran supply. Brands raised prices by 6% to 12%, cut protein per serving in several lines, or moved to pulse and collagen blends, which squeezed gross margin by two to four points through the year.

The competitive disadvantage falls on small specialist brands, which buy protein and sweeteners in small lots at spot prices and cannot hedge. Large groups sign annual contracts and spread costs across many products, while private labels pass costs to retailers. Exposure also varies by geography, since Asian brands source sweeteners locally and North American brands pay import duties on some ingredients.
metabolic-cookies-market-cost-volatility-analysis-1789788722578

Contracting Protein, Sweeteners, and Nut Flours Under Forward Agreements

Brands sign annual and multi-year agreements for protein isolates, sweeteners, and almond flour, fixing volumes and price bands ahead of demand peaks. Dual sourcing of allulose from Asia and North America reduces disruption risk. Forward contracts cut annual cost swings by roughly half, though they need working capital that only larger groups usually provide. Terms usually run one year.

Blending Pulse, Collagen, and Whey Proteins to Cut Cost

Bakers replace part of whey protein with pulse protein, collagen, and milk protein blends that cost less per gram and behave differently in dough. Blending lowers protein cost by 10% to 20% per kilogram when done carefully. The main risk is taste and texture change, so sensory panels and staged launches protect repeat purchase. Sales data guides the mix.

Standardising Pack Formats Across Portion and Multipack Ranges

Brands standardise wrapper formats, films, and tray sizes across ranges to lower packaging cost, and some shrink portions rather than raise shelf prices. Standardisation saves one to two points of cost of goods on portion lines. Retailers accept smaller packs more easily than price increases, though shoppers notice and complain quickly online and in reviews.

Portfolio Architecture for Margin Defence

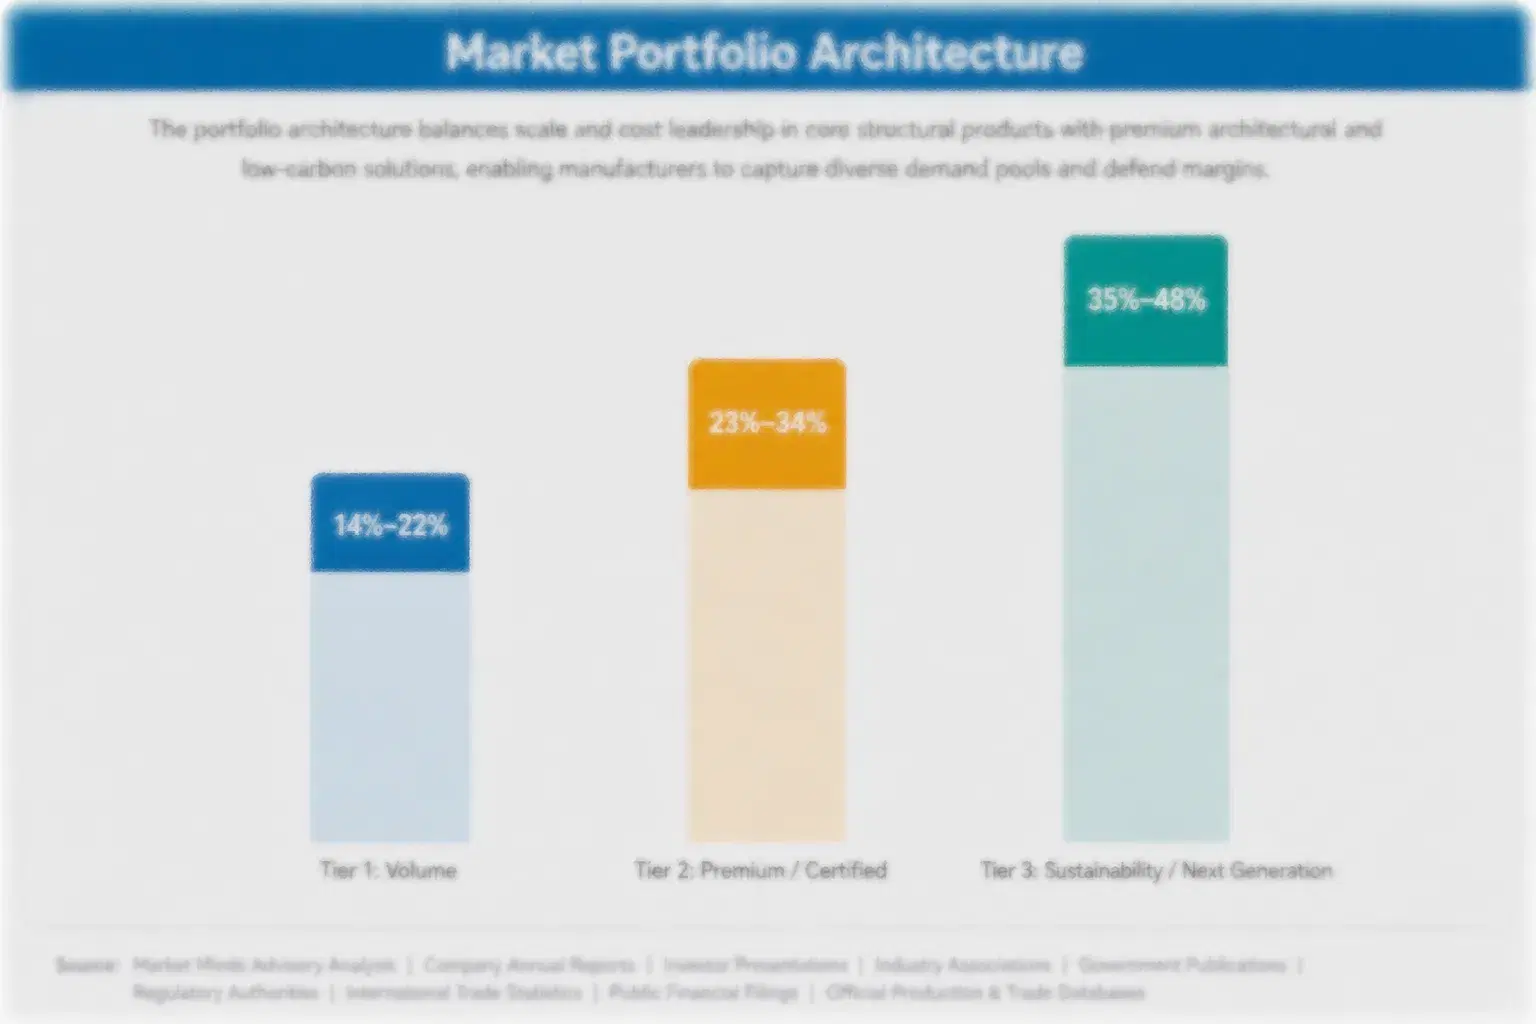
Margins run from thin returns on standard low-sugar cookies sold to supermarkets and private label programmes to strong returns on protein cookies with published glucose data sold through pharmacies, clinics, and subscriptions. Three tiers separate volume products, evidence-backed premium lines, and next-generation formats, and each tier draws on different buyer groups, sweetener systems, and channel terms.
The tension between volume and premium is sharp. Volume lines protect plant utilisation and retailer relationships but face price pressure from private labels and conventional low-sugar biscuits, while premium lines earn higher margins on smaller volumes and depend on sensory quality and claim evidence. Brands that run only volume struggle to fund studies, while brands that run only premium lack the scale to hold shelf space beside the largest snack groups.

High-value pools concentrate in GLP-1 companion protein cookies, low-glycaemic lines with third-party test data, and subscription programmes sold directly to consumers. They gather where shoppers pay for control, satiety, or trust rather than weight of product. Pharmacies, telehealth clinics, and dietitian networks add further value, since these buyers ask for documented nutrition, stable supply, and clear claim wording, and they reorder without shopping on price.

Volume / Commodity-Adjacent Tier

Standard low-sugar and low-carb cookies sold in bulk to supermarkets and private label programmes, with thin margins, flour and sweetener cost exposure, and constant price competition from conventional low-sugar biscuits, where shoppers switch on price and promotion frequency.
Gross Margin: 24%-34%

Premium / Certified Tier

Protein-enriched and low-glycaemic cookies with published nutrient data, allergen controls, and consistent taste, sold through pharmacies, natural grocers, and online stores that require documented nutrition, clear labelling, reliable delivery, and stable supply across seasons.
Gross Margin: 36%-48%

Sustainability / Regulatory / Next-Generation Tier

GLP-1 companion and clinically tested cookies backed by glucose response studies and notified claims, sold through subscriptions, clinics, and pharmacies to buyers who pay premiums for evidence, convenience, and personalised nutrition guidance from dietitians and apps.
Gross Margin: 42%-58%
metabolic-cookies-market-portfolio-architecture-1789788722927

High-value Sub-segments and Strategic Watch-out

GLP-1 Companion Protein Cookies

GLP-1 companion protein cookies combine the fastest growth with strong pricing, since users pay 90% to 140% premiums for protein-dense portions with familiar taste. Clinic partnerships and nutrient data limit competition, and brands with dietitian support win pharmacy shelves. Repeat purchase compounds across subscriptions. Prices hold.
Gross Margin: 42%-58%

Low-Glycaemic Cookies

Low-glycaemic cookies deliver strong growth and healthy pricing, since diabetes awareness and glucose monitors push shoppers toward lower blood sugar response. Testing and claim compliance form the entry barrier, and brands with third-party data gain dietitian support and steady shelf space. Repeat purchase compounds. Trials scale fast.
Gross Margin: 36%-48%

Ketogenic and Low-Carb Cookies

Ketogenic and low-carb cookies form the volume core, sold through supermarkets, online stores, and private label at moderate margins. Growth is steady, about 10% a year, as the keto trend matures. Almond flour costs, sweetener supply, and plant scale decide profit, and brands rely on loyal followers.
Gross Margin: 24%-34%

Botanical-Enriched Cookies

Botanical-enriched cookies are the strategic watch-out, since cinnamon, berberine-like extracts, and green tea claims face weak evidence and tight regulator scrutiny. Brands should test claims with clinical partners and avoid disease wording before scaling in Europe and North America, because enforcement actions can damage the whole brand.
Gross Margin: 30%-44%

Why Metabolic Cookie Buyers Keep Ordering

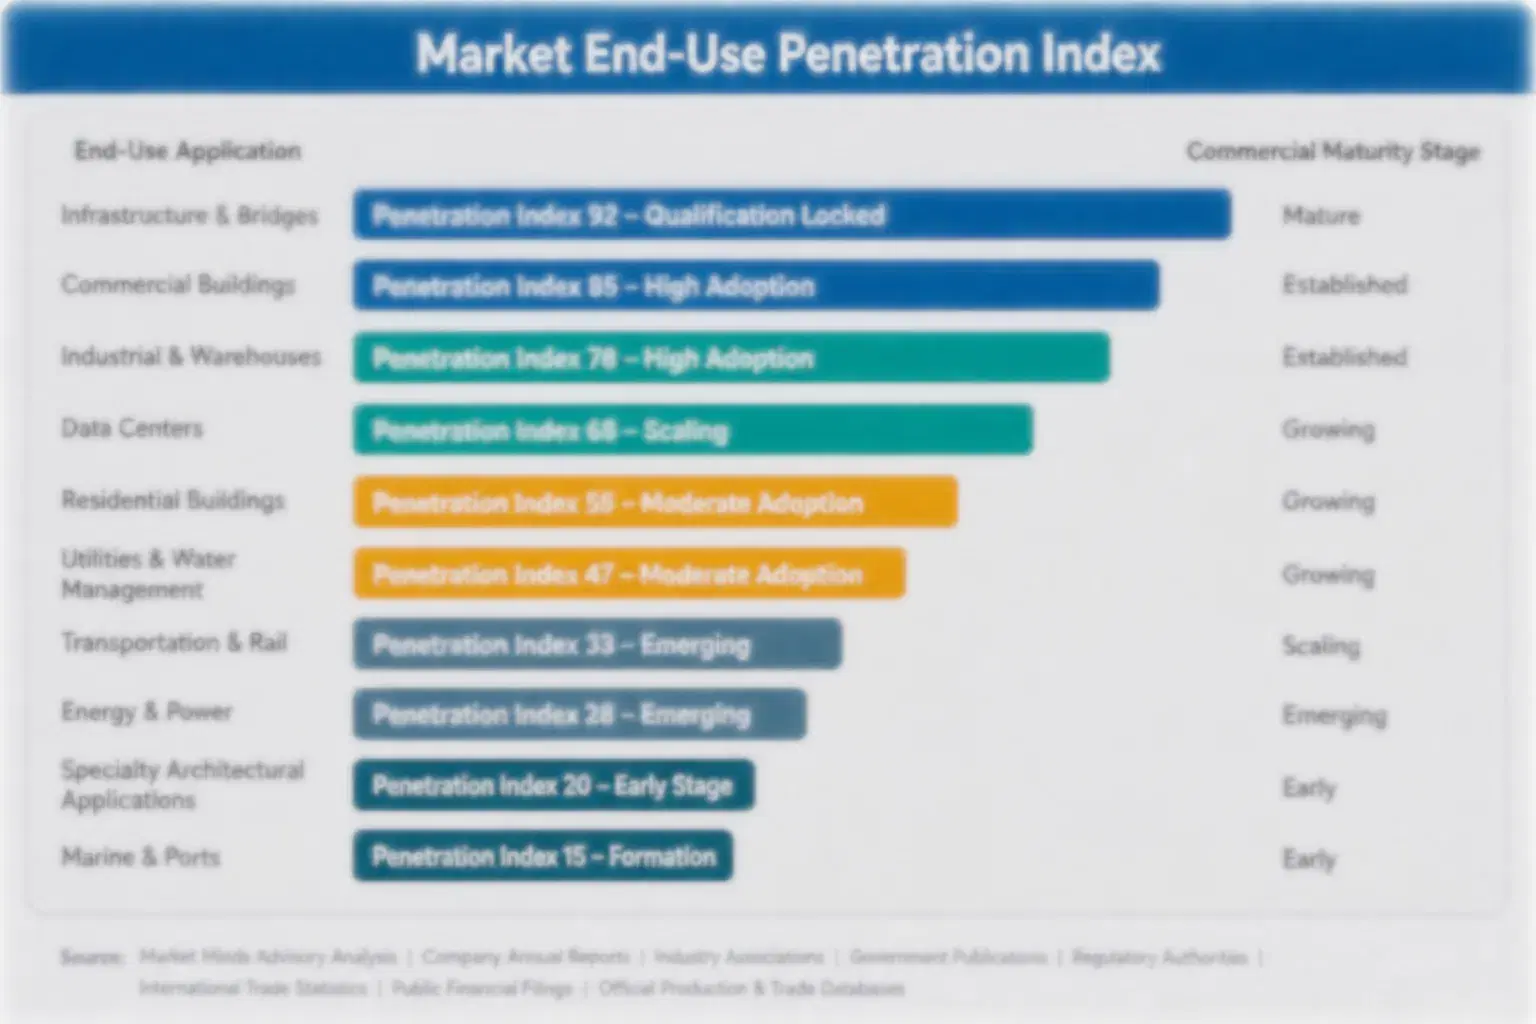
Metabolic cookie demand behaves like an annuity once a shopper finds a product that fits a routine. Subscribers reorder monthly, and a satisfied buyer typically stays with the brand for 12 months or more. Subscription and loyalty programmes add predictability, and retailers use repeat data to fix shelf space, so successful lines earn steadier volume than launches driven by promotion or influencer campaigns alone.
Adoption stickiness differs by vertical. Diabetes and prediabetes management is the deepest, since patients follow dietitian advice and rarely switch trusted products. GLP-1 users are almost as loyal, because protein and portion needs continue for as long as they use the drug. Fitness and weight-conscious consumers are shallower but faster, rotating brands with each trend, while pharmacy shoppers repeat purchase when staff recommend a product.

Buyer profiles are shifting between generations. Older buyers purchase for diabetes and cardiovascular concerns and trust pharmacies, while younger buyers care about glucose monitor data, protein, sweetener type, and ingredient lists. GLP-1 users add a third group that wants small, protein-dense portions. Brands that publish test results, share sweetener sources, and use social media for feedback win younger buyers and keep them as they age into medical needs.
metabolic-cookies-market-end-use-penetration-index-1789788723223

MMA Verdict on Metabolic Cookie Strategy

These are among the four positions where our research anticipates prominent divergence between winners and laggards over the coming forecast period. Each is grounded in the demand model, the regulatory perimeter, and the announced capacity pipeline.
01 / GLP-1 COMPANION STRATEGY

Launch Portion-Sized Protein Cookies for GLP-1 Users Before Pharmacies Fill Shelves

GLP-1 companion protein cookies grow at 14.6% a year, about 1.43 times the market rate, and they carry the strongest price premiums in the category, so early clinic and pharmacy partnerships pay back inside roughly three years on most contracts. Winners publish nutrient tables, secure protein baking capacity, and offer subscription starter packs that follow dose changes and portion needs. Brands that wait will find pharmacy shelves allocated and private labels already copying formats at lower price points across major markets and channels.
02 / GLUCOSE EVIDENCE STRATEGY

Fund Glucose Response Studies to Defend Premium Prices and Pharmacy Listings

Studies cost $100,000 to $500,000 per product, yet they support price premiums of 60% to 100% and win dietitian recommendations and pharmacy listings that advertising cannot buy. Brands should test a base recipe first, reuse results across flavour variants, and agree claim wording with regulators before launch in Europe, North America, and Asia. Those that rely on keto language alone will lose credibility as glucose monitor users test claims against their own data and share findings online within days of every launch.
03 / SUBSCRIPTION ECONOMICS STRATEGY

Convert Trial Into Repeat Orders Through Subscription and Tracking Programmes

Online subscriptions carry roughly 38% of category sales, and brands with sampler boxes and tracking guides lift 90-day repeat purchase rates from about 46% toward 60%. Subscription revenue also lowers marketing cost per active customer by 20% to 30% and gives co-manufacturers predictable volume for capacity planning and raw material purchasing. Brands that skip subscriptions will pay ever higher advertising costs to acquire the same buyers repeatedly each year while competitors compound loyalty and collect data on which flavours retain customers.
04 / INPUT COST DISCIPLINE STRATEGY

Hedge Protein and Sweeteners and Blend Sources to Protect Margin

Protein, allulose, and almond flour costs can move 20% to 40% within a year, so unhedged brands lose several margin points when shelf prices are already fixed. Producers should sign forward contracts for protein and sweeteners, blend pulse and collagen proteins into lower tiers, and dual-source from Asia and North America. Those that delay will absorb cost spikes, shrink portions, or lose retailer trust before their next range review arrives and competitors already hold stable supply for the following year.

Engagement Snapshot From the Field

A live engagement with an industry participant carrying material or product regulatory and market exposure ahead of a defining policy shift, showing how our research translates into a defensible multi-year portfolio strategy.
MARKET MINDS ADVISORY · CLIENT ENGAGEMENT SUMMARY
Metabolic Cookies Producer Strategic Portfolio Review and Transition Roadmap 2026·Investment Scenario on Metabolic Cookies Exposure Evaluation 2025-26
CLIENT PROFILE
The client is a mid-sized North American snack manufacturer with annual sales near $310 million (client-reported, unverified by MMA), three plants, and a portfolio led by standard cookies and bars sold through supermarkets and club stores. It had one low-sugar cookie line, no pharmacy presence, and no direct-to-consumer channel, while retailers asked for metabolic health options.
STRATEGIC CHALLENGE
Standard cookie volumes were flat, private label pressure was cutting margins, and the client's single low-sugar line lost many first-time buyers to aftertaste and weak evidence. Management needed to decide whether to invest in GLP-1 companion cookies, glucose studies, or subscription sales, with limited capital and only one plant able to run new protein formats.
MMA APPROACH
MMA analysed sales and cost data across 55 products, interviewed 12 retail buyers, six dietitians, and eight co-manufacturers, and ran a shopper survey on protein, portion, and glucose preferences across three regions. It modelled margin by segment and channel, tested sweetener blends against competitor benchmarks, and ranked investments by payback period and execution risk.
KEY FINDINGS
  1. GLP-1 companion cookies with 12 grams of protein could reach 11% of sales within two years at margins 10 points above the core range (client-reported, unverified by MMA).
  2. A glucose response study on the lead recipe could support a 70% price premium and open pharmacy listings in three regions within 18 months of results.
  3. The existing low-sugar line lost 45% of first-time buyers because of aftertaste, and a blended allulose and fibre recipe could halve that loss.
  4. Subscription sales could reach 15% of revenue in three years, lowering acquisition cost per active customer by about a quarter compared with retail promotion.
CLIENT PROFILE
The client is a mid-sized North American snack manufacturer with annual sales near $310 million (client-reported, unverified by MMA), three plants, and a portfolio led by standard cookies and bars sold through supermarkets and club stores. It had one low-sugar cookie line, no pharmacy presence, and no direct-to-consumer channel, while retailers asked for metabolic health options.
STRATEGIC CHALLENGE
Standard cookie volumes were flat, private label pressure was cutting margins, and the client's single low-sugar line lost many first-time buyers to aftertaste and weak evidence. Management needed to decide whether to invest in GLP-1 companion cookies, glucose studies, or subscription sales, with limited capital and only one plant able to run new protein formats.
MMA APPROACH
MMA analysed sales and cost data across 55 products, interviewed 12 retail buyers, six dietitians, and eight co-manufacturers, and ran a shopper survey on protein, portion, and glucose preferences across three regions. It modelled margin by segment and channel, tested sweetener blends against competitor benchmarks, and ranked investments by payback period and execution risk.
KEY FINDINGS
  1. GLP-1 companion cookies with 12 grams of protein could reach 11% of sales within two years at margins 10 points above the core range (client-reported, unverified by MMA).
  2. A glucose response study on the lead recipe could support a 70% price premium and open pharmacy listings in three regions within 18 months of results.
  3. The existing low-sugar line lost 45% of first-time buyers because of aftertaste, and a blended allulose and fibre recipe could halve that loss.
  4. Subscription sales could reach 15% of revenue in three years, lowering acquisition cost per active customer by about a quarter compared with retail promotion.
RECOMMENDED STRATEGY
Phase 1: Phase 1 (Months 1-6): Reformulate the low-sugar line with blended sweeteners, contract protein and sweetener supply, and begin a glucose response study. Phase 2: Phase 2 (Months 7-18): Launch GLP-1 companion cookies through pharmacies and a subscription site, using one converted plant line and co-manufacturing support. Phase 3: Phase 3 (Months 19-30): Reduce low-margin private label volume, expand protein capacity, and add clinic partnerships and retailer listings in two new regions.
OUTCOME
Within 30 months, companion and subscription products reached 19% of sales, low-sugar repeat purchase rose by 21 points, and gross margin improved by six points (client-reported, unverified by MMA). The client secured listings with two pharmacy chains and signed a clinic partnership, while retail buyers named it a preferred supplier for metabolic cookies.

Frequently Asked Questions

Foundational context covering the market sizes, CAGR, scope, country, region and competition that inform every finding below. This section is provided to cover basics and most often pre-purchase conversations, answered from the MMA Primary Research Dataset.

What is the current size of the Metabolic Cookies Market?

The global metabolic cookies market was valued at $0.8 billion in 2025. Growth is supported by GLP-1 drug adoption, glucose monitor use, and rising diabetes awareness across major markets.

How large will the Metabolic Cookies Market be by 2036?

The market is projected to reach $2.33 billion by 2036, up from $0.88 billion in 2026. The increase of $1.45 billion reflects companion protein lines, clinical evidence, and pharmacy distribution.

What is the CAGR for the Metabolic Cookies Market 2026 to 2036?

The market is forecast to grow at a 10.2% CAGR from 2026 to 2036. The bull case reaches 11.5% and the bear case 8.9%, depending on clinical evidence and claim rules.

Which segment is growing fastest?

GLP-1 Companion Protein Cookies is the fastest-growing segment at 14.6% CAGR, roughly 1.43 times the overall market rate. Low-Glycaemic Cookies follows as the second-fastest segment at 11.8% CAGR each year.

Who are the major companies in the Metabolic Cookies Market?

Major companies include Simply Good Foods, The Hershey Company, Flowers Foods, Mondelez International, and Kellanova. General Mills, Nestle, Danone, Abbott Laboratories, and specialist online brands also hold meaningful positions.

Which country is growing fastest?

India is the fastest-growing country at a 12.8% CAGR, driven by rising diabetes prevalence, urban health concern, and packaged snack growth. China and South Korea follow through functional food and zero-sugar launches.

Report Segmentation Architecture

The full report scope spans multiple orthogonal segmentation dimensions, with cross-tabulated demand data provided for each dimension pair. Coverage extends further to regional breakdowns, trend trajectories, and the competitive detail needed to support segment-level decision-making.

By Primary Market Dimension

  • Low-Glycaemic Cookies
  • Ketogenic and Low-Carb Cookies
  • GLP-1 Companion Protein Cookies
  • Slow-Release Carbohydrate Cookies
  • Botanical-Enriched Cookies
  • Collagen and Amino Acid-Enriched Cookies

By End-Use Industry

  • Diabetes and Prediabetes Management
  • GLP-1 and Weight Management Programmes
  • Sports and Fitness Nutrition
  • Household Snacking
  • Pharmacy and Health Retail

By Commercial Dimension

  • Online and Subscription
  • Pharmacies and Clinics
  • Supermarkets and Hypermarkets
  • Natural and Specialty Grocers
  • Private Label Programmes

By Region

  • North America
  • Western Europe
  • East Asia
  • South Asia and Pacific
  • Latin America
  • Middle East and Africa
  • Eastern Europe

Scope, Methodology, and Coverage

Every figure in this report is reproducible from documented input assumptions. The scope below maps the historical period, the forecast horizon, the segmentation dimensions, and the countries covered, alongside the underlying primary and qualitative methodology.
Historical Period
2020 to 2025
Forecast Period
2026 to 2036
Base Year
2025 (USD billions; MMA Primary Research Dataset, September 2026)
Market Definition
Metabolic cookies comprise baked cookies and biscuits formulated and marketed for blood sugar management, satiety, or metabolic health, including low-glycaemic, ketogenic and low-carb, GLP-1 companion protein, slow-release carbohydrate, botanical-enriched, and collagen and amino acid-enriched cookies, sold through retail, online, pharmacy, and subscription channels. The scope excludes meal-replacement bars, medical foods, diabetic bakery sold under prescription, and general low calorie cookies without a metabolic claim.
Quantitative Units
USD billions (current prices); kilotonnes for volume references
Segmentation Dimensions
By Metabolic Claim Mechanism; By End-Use Industry; By Commercial Dimension; By Region
Regions Covered
North America, Western Europe, East Asia, South Asia and Pacific, Latin America, Middle East and Africa, Eastern Europe
Countries Covered
USA, Canada, Mexico, Brazil, Argentina, Chile, UK, Germany, France, Italy, Sweden, Poland, Romania, Turkey, Israel, South Africa, UAE, Japan, South Korea, China, India, Australia, and additional markets relevant to this sector
Key Companies Profiled
Simply Good Foods, The Hershey Company, Flowers Foods, Mondelez International, Kellanova, General Mills, Nestle, Danone, Abbott Laboratories, Glanbia, Grupo Bimbo, Pladis, Lotus Bakeries, Britannia Industries, Yamazaki Baking, Lotte Wellfood, Orion, Bahlsen, Barilla, Mars
Quantitative Methodology
Primary survey, n=3,800 respondents, Q4 2025, six countries; demand-side model with trade association cross-validation
Qualitative Methodology
47 expert interviews, Q4 2025; applied to validate demand model assumptions, identify emerging dynamics, and assess competitive positioning
Report Format
PDF and XLSX data workbook (Word format preview document)
Publisher
Market Minds Advisory
Report Code
MMA-2026-AGR-371
Published
September 2026
Contact
sales@marketmindsadvisory.com | www.marketmindsadvisory.com

Purchase the full Metabolic Cookies Market Report (2026 to 2036).

The full report delivers a detailed assessment of global metabolic cookies through 2036, covering segment, regional, and country forecasts, competitive benchmarking of leading brands, and input cost analysis. It combines MMA primary research, including a six-country survey of 3,800 respondents and 47 expert interviews, with public regulatory and company data. Analysts also model GLP-1 adoption scenarios, claim rule changes, and subscription economics. Clients receive segment margin ranges, channel maps, and a case study on portfolio strategy. Supplier and retailer contact frameworks are also included for negotiation planning.
Ten-year segment and regional demand forecasts
Protein, sweetener, and nut flour price tracking
Competitive benchmarking of top twenty brands
Blood sugar health claim rule tracker by country
Regional demand mechanism comparative analysis included
Quarterly primary survey data update access

Built For The People Who Decide

From boardroom strategy to bench-side execution, this report is read cover-to-cover by leaders shaping the next decade of their industry, turning demand scenarios, market dynamics and valuation benchmarks into decisions.
CXOs/ Presidents/ VPs/ Managers
M&A and Corporate Development
Strategy Teams and R&D Heads
Procurement and Product Directors
Regulatory and Compliance Leaders
Investor Relations and Equity Analysts