Market Minds Advisory
Medical Rehabilitation Robotics Market

Medical Rehabilitation Robotics Market: Reimbursement Now Decides Adoption Speed

A commercial reading of rehabilitation robotics, where reimbursement coverage expansion pulls exoskeleton adoption forward, therapist shortages push hospitals toward robotic-assisted therapy, and high capital cost still gates access for smaller clinics.

Lead Analyst

Alice Ballenger

Published

September 2026

Make Smarter Decisions with Customized Research Insights

Request a free sample report and evaluate market opportunities, growth trends, and competitive dynamics relevant to your business needs.

2025 MARKET VALUE$2.6BMarket Size 2025
2036 FORECAST VALUE$8.5BBase Case , 2026 to 2036
CAGR 2026 TO 203611.4 %Bull 12.7% / Bear 10.1%
INCREMENTAL OPPORTUNITY$5.6BNet 10- year value creation
EXPANSION MULTIPLE2.94x2036 value over 2026 base
Strategic Levers
M&A Pipeline
Regional Outlook
Country Rankings
Competitive Intelligence
Segmental Deep-dive
Call-Us : 91 93563 13602

Executive Snapshot and Market Trajectory

A hospital short two physical therapists does not simply see fewer patients treated, it sees a robot doing the repetitive gait cycles a human would otherwise supervise one patient at a time, and that staffing reality is reshaping procurement decisions faster than any single clinical trial could.
The market stands at USD 2.6 billion in 2025 and reaches USD 8.53 billion by 2036 at an 11.4% CAGR. Lower limb exoskeletons and gait training systems grow fastest at 14.0%, about 1.23 times the overall rate, pulled forward by reimbursement coverage expansion for robotic-assisted stroke rehabilitation. North America holds 30% of value on established rehabilitation hospital infrastructure, while China posts the fastest national growth at 13.5% on aging demographics and government healthcare investment.
Concentration sits at a moderate 42% among the top five, led by Hocoma's clinical installed base and Ekso Bionics' exoskeleton category leadership built over more than a decade. Two forces reshape the field now. Reimbursement coverage expansion is pulling robotic-assisted therapy into standard care pathways across more payers, and AI-driven adaptive therapy algorithms are personalizing treatment protocols in ways manual therapy sessions simply cannot replicate at comparable cost or scale.
Market Definition
The medical rehabilitation robotics market covers robotic and robot-assisted devices designed for physical rehabilitation of motor function following stroke, spinal cord injury, orthopedic surgery, or neurological disease, including exoskeletons, upper and lower limb trainers, and balance training systems sold to hospitals, rehabilitation clinics, and home care settings. General mobility aids, prosthetics, and surgical robots are excluded.
Base Year Value
$2.6B in 2025 (MMA Primary Research Dataset, August 2026)
Forecast Period
2026 to 2036, eleven discrete annual values
CAGR
11.4% base case. Bull 12.7%. Bear 10.1%.
Fastest Growth Segment
Lower Limb Exoskeletons and Gait Training Systems: 14.0% CAGR
Fastest Growth Country
China: 13.5% CAGR
Fastest Growth Region
South Asia and Pacific: 13.4% CAGR
Largest Region
North America: 30% of 2025 global value
Market Leaders
Hocoma, Ekso Bionics, ReWalk Robotics, Fourier Intelligence, Bionik Laboratories. Source: MMA Analysis based on company annual reports and industry association data.
Primary Survey
n=3,800 procurement and R&D decision-makers, Q4 2025, six countries
Methodology
Demand-side build-up, cross-validated against public data, 47 expert interviews

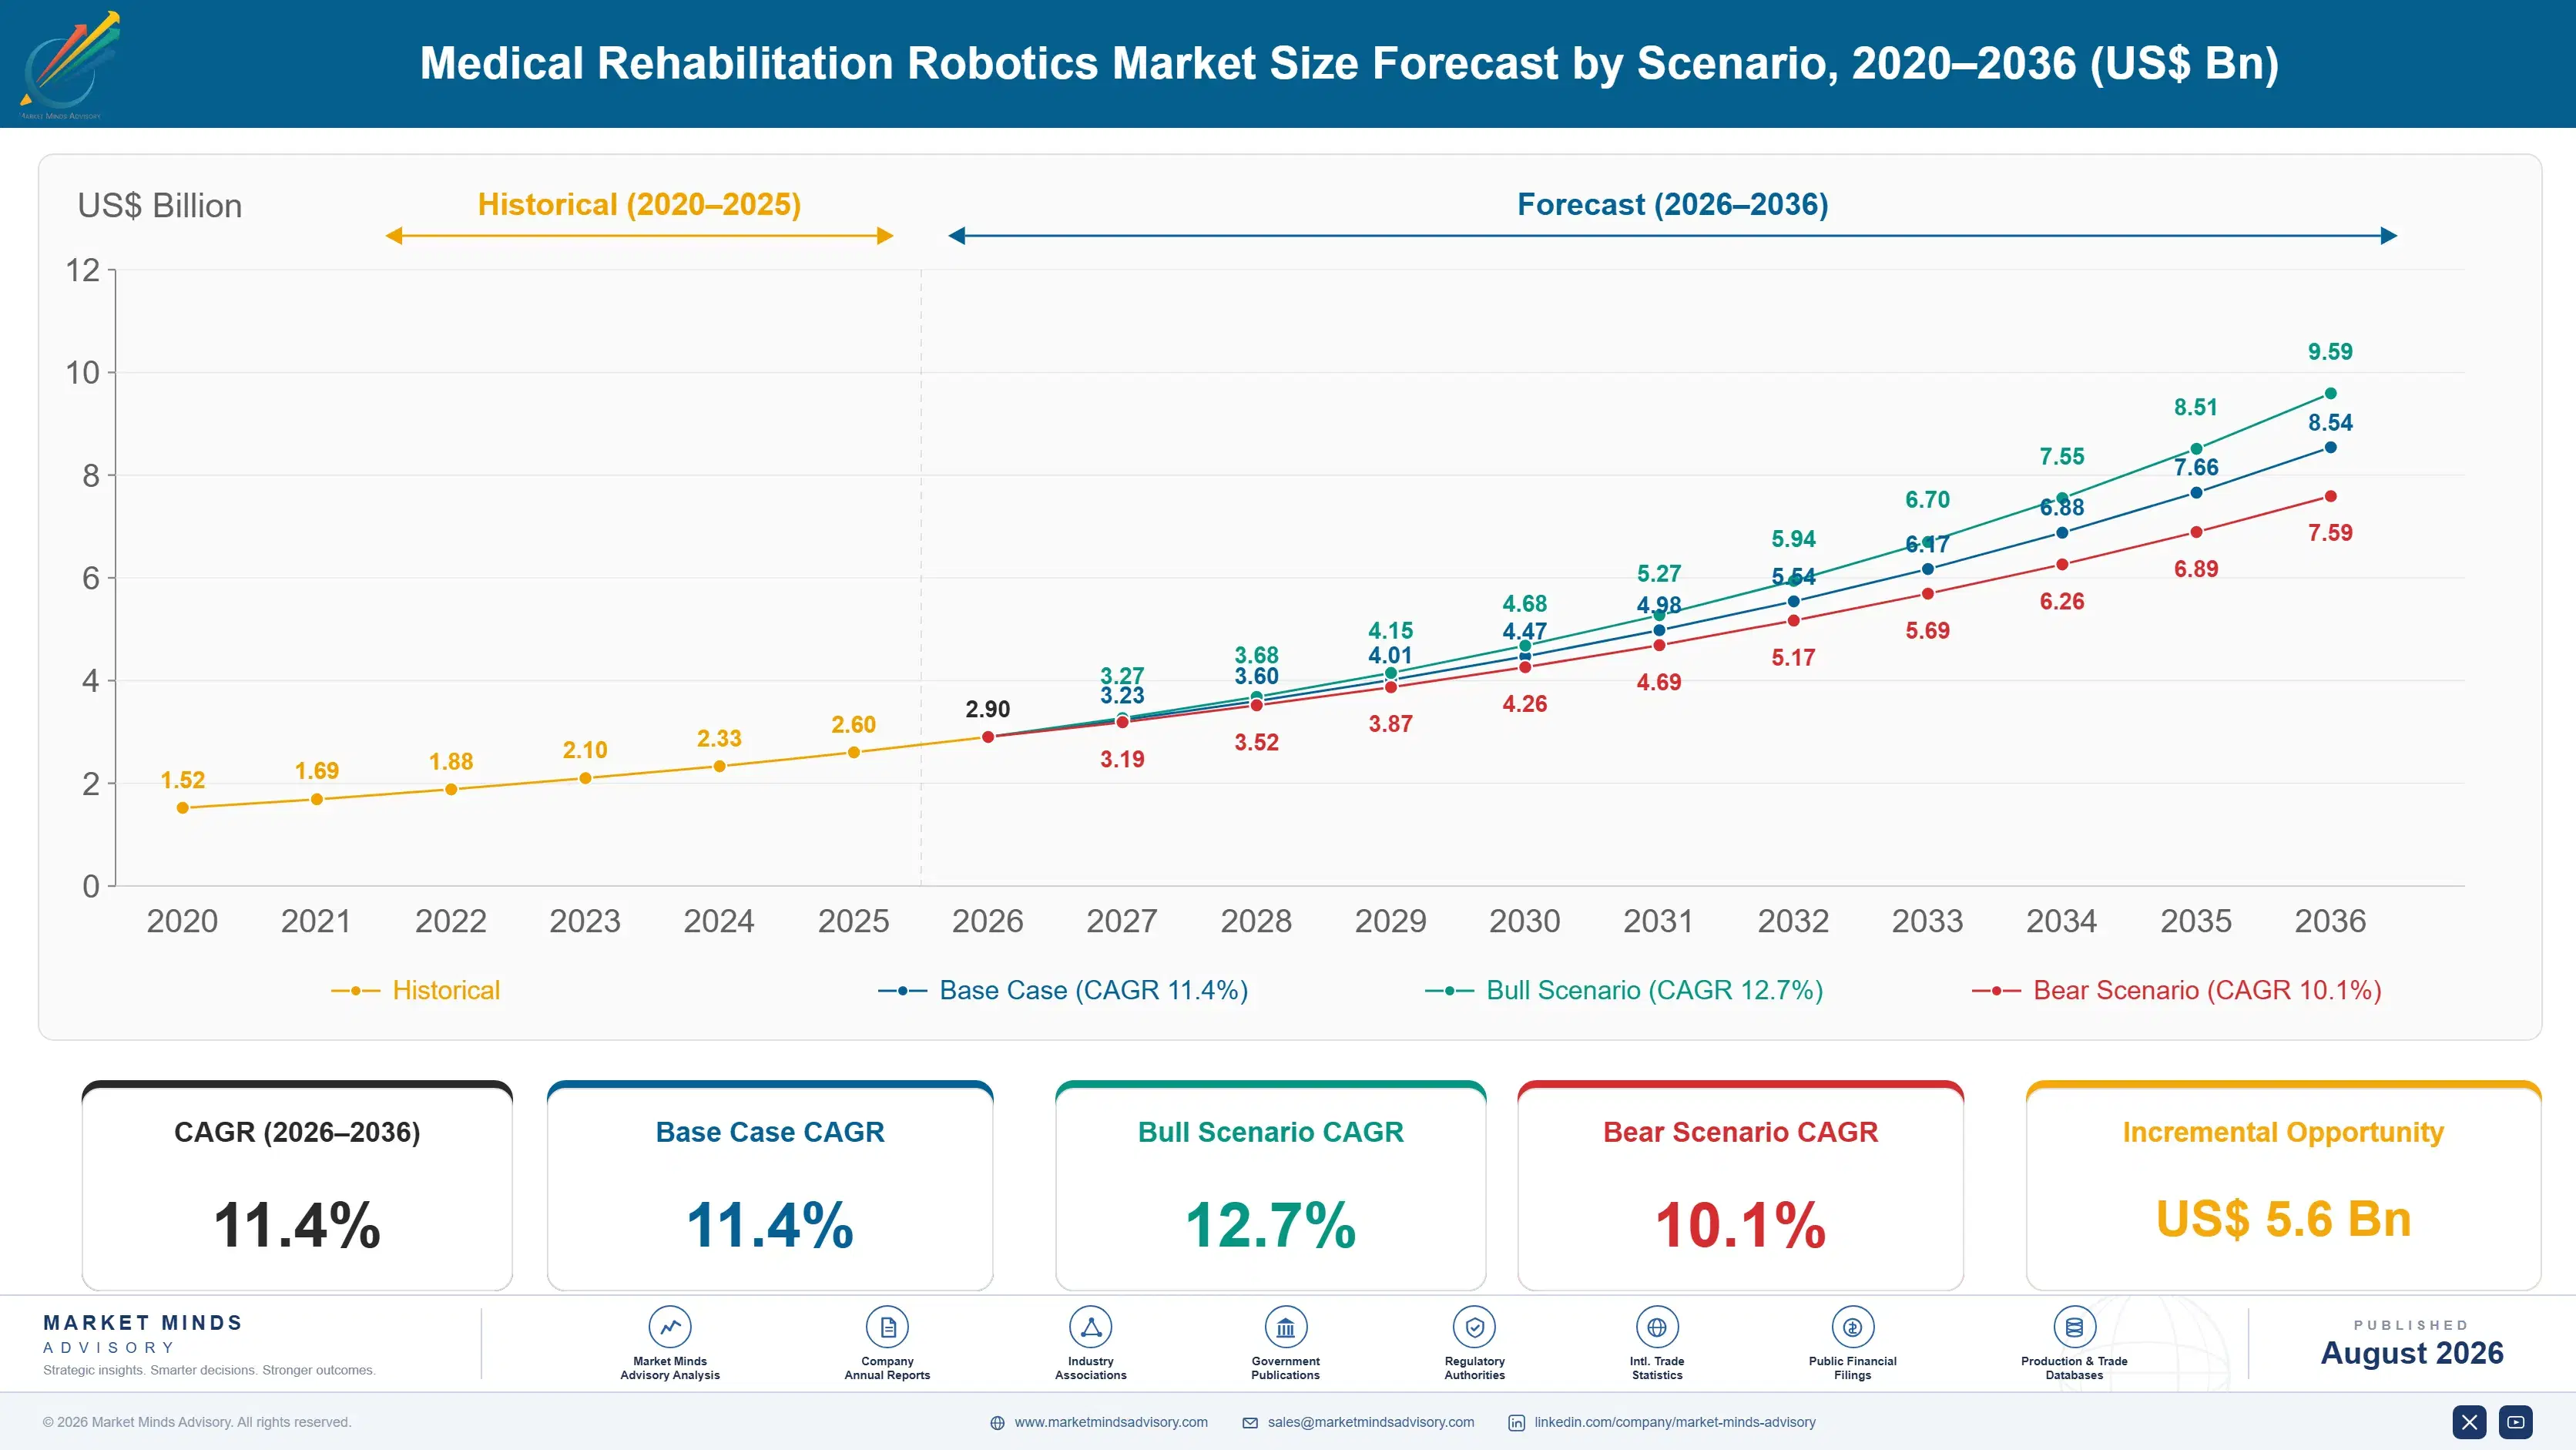
Medical Rehabilitation Robotics Market Forecast Scenarios

medical-rehabilitation-robotics-market-size-forecast-scenario-1787325520216
Growth from 2020 to 2025 compounded near 10.3%, supported by steady clinical adoption in leading rehabilitation hospitals before accelerating from 2023 onward as reimbursement coverage expanded across more payers and hospital staffing shortages pushed procurement decisions toward robotic-assisted therapy more urgently than before, particularly across large urban hospital networks facing acute therapist vacancy rates nationally.
Three mechanisms carry the base case to 11.4%. First, reimbursement coverage expansion, as more public and private payers add robotic-assisted therapy codes to standard rehabilitation care pathways across more jurisdictions each year. Second, hospital staffing shortages, which push adoption of robotic-assisted therapy that lets one therapist supervise multiple patients simultaneously rather than one at a time. Third, aging population growth, which sustains rising post-stroke and post-surgical rehabilitation caseloads across most developed healthcare systems worldwide.
The bull case at 12.7% assumes reimbursement coverage expands faster than current payer timelines suggest and AI-driven adaptive therapy algorithms demonstrate clinical outcomes strong enough to accelerate hospital procurement. The bear case at 10.1% assumes high capital cost continues limiting adoption among smaller rehabilitation clinics and inconsistent reimbursement policies across regions keep creating adoption uncertainty for hospital administrators.

Why the Therapist Shortage Is Actually the Sales Driver

Three forces set demand. Hospital and rehabilitation clinic capital procurement provides the steadiest layer, since large rehabilitation networks continue expanding robotic therapy capacity across existing facilities. Reimbursement coverage expansion adds a second layer, as more payers add codes that make procurement financially viable for smaller institutions. Aging population growth adds a third layer, sustaining rising post-stroke caseloads that manual therapy staffing alone increasingly cann
MARKET CONCENTRATIONCR5: 42%Moderately fragmented behind a handful of clinical technology leaders
AVERAGE SELLING PRICEUSD 85,000 to 350,000 per unitVaries considerably by device category and clinical capability tier
TOP CONSUMING REGIONNorth America: 30% of global valueReflects established rehabilitation hospital and reimbursement infrastructure depth
REIMBURSEMENT COVERAGE RATERoughly 45% of eligible proceduresRising steadily as more payers add robotic therapy codes
REPLACEMENT CYCLE LENGTH7 to 10 years typicalReflects durable mechatronic hardware with periodic software upgrades
INSTALLED BASE GROWTHAbout 18% annuallyTracks accelerating hospital and clinic procurement across most regions
The commercial character rewards clinical outcome evidence and installed base depth over price competition alone. A hospital administrator choosing between comparable systems weighs published outcome data and staff familiarity as heavily as price, since a device sitting unused because therapists were never properly trained delivers no return regardless of its list price. Hocoma's clinical installed base and Ekso Bionics' exoskeleton track record give both a trust advantage newer entrants must earn.
The next decade turns on two things. Whether reimbursement coverage expands quickly enough across more payers to make robotic-assisted therapy the default rather than the exception for eligible patients. And whether AI-driven adaptive therapy algorithms can demonstrate outcome improvements strong enough to justify premium pricing against increasingly capable lower-cost competitors entering from East Asia.
"Every rehab robot sold this year is really a staffing decision wearing a capital equipment label. The hospitals buying fastest are not the ones with the biggest budgets, they are the ones who cannot hire enough therapists."
Director, Rehabilitation Technology Practice · MMA Medical Devices / Rehabilitat

Market Trends

Reimbursement Coverage Expansion Accelerates Adoption Speed

Public and private payers are increasingly adding robotic-assisted therapy billing codes to standard rehabilitation care pathways, a shift that has pushed reimbursement coverage to roughly 45 percent of eligible procedures from a considerably lower base a few years ago. This matters commercially because hospitals that previously could not justify capital procurement without reliable reimbursement now find the economics considerably more favourable across a broader range of patient conditions. Ekso Bionics and Hocoma have both invested heavily in clinical evidence generation to support payer coverage decisions. Manufacturers without strong reimbursement advocacy increasingly struggle to convert clinical interest into orders.
Market Impact: Stroke caseloads rise 20% by 2036
AI-Driven Adaptive Therapy Now Personalizes Treatment

Rehabilitation robots increasingly incorporate AI-driven adaptive algorithms that adjust resistance, assistance, and repetition patterns in real time based on individual patient performance data collected each session. This capability lets a single device serve a considerably broader range of patient conditions and recovery stages than fixed-protocol systems could previously manage, extending the addressable clinical use case per unit purchased. Fourier Intelligence and Hocoma have both expanded adaptive algorithm capability considerably across their most recent product generations. Manufacturers without genuine adaptive software capability increasingly compete only on hardware specifications that have largely converged across credible competitors already.
Market Impact: One therapist now covers 3x patient

Market Opportunities and Growth Drivers

Aging Population Drives Post-Stroke Rehabilitation Demand

Global populations aged 65 and older continue expanding considerably across most developed and several major emerging healthcare markets, directly sustaining rising post-stroke and post-surgical rehabilitation caseloads that manual therapy staffing alone increasingly cannot absorb. Stroke incidence rises meaningfully with age, and survivors increasingly require intensive, repetitive gait and motor function training that robotic systems can deliver more consistently across longer daily sessions than manual therapy typically allows. Japan, South Korea, and several Western European countries already face this demographic pressure most acutely today. This driver continues strengthening as life expectancy rises further.
Market Impact: Units cost USD 85,000 to 350,000

Staffing Shortages Push Robotic-Assisted Therapy Adoption

Physical therapist shortages across major healthcare systems, with vacancy rates reaching double digits in several countries, are pushing hospital administrators to adopt robotic-assisted therapy that lets one therapist supervise multiple patients simultaneously rather than delivering fully manual one-on-one sessions throughout the day. This capability directly addresses a persistent staffing gap that hiring alone cannot close quickly enough given multi-year training pipelines for licensed physical therapists. Hospitals report meaningfully higher patient throughput per therapist shift after adopting robotic-assisted systems across several documented case studies. This driver continues strengthening as therapist shortages persist across most developed healthcare markets tracked currently.
Market Impact: Coverage varies 10-45% by market

Market Restraints and Challenges

High Capital Cost Limits Adoption Among Smaller Clinics

Rehabilitation robots cost USD 85,000 to 350,000 per unit depending on category and capability tier, a capital outlay that remains genuinely difficult for smaller independent rehabilitation clinics to justify against uncertain reimbursement and patient volume. The root cause is complex mechatronic and sensor engineering combined with relatively low production volumes compared with mass-market medical devices, keeping unit manufacturing cost elevated across the category broadly. Commercially this concentrates adoption among larger hospital networks and well-funded rehabilitation chains, leaving smaller clinics underserved. Manufacturers are responding with leasing and subscription pricing models that spread capital cost across a longer payment period specifically.
Market Impact: Coverage reaches 45% of procedures

Inconsistent Reimbursement Creates Adoption Uncertainty Everywhere

Reimbursement policy for robotic-assisted therapy varies considerably across payers and jurisdictions, with coverage reaching roughly 45 percent of eligible procedures in leading markets but remaining minimal or entirely absent in many others globally. The root cause is a fragmented payer landscape where each insurer and national health system evaluates robotic therapy evidence independently, without a unified reimbursement framework most manufacturers could rely upon. Commercially this creates genuine forecasting uncertainty for hospital administrators weighing multi-year capital investment decisions against unpredictable future reimbursement. Manufacturers are responding by funding real-world evidence generation studies specifically designed to support broader payer coverage decisions over time.
Market Impact: Adaptive units treat 30% more condi
3 additional market trends, 4 additional growth drivers, and 3 additional restraints and challenges are covered in the full report. Contact sales@marketmindsadvisory.com to access the complete intelligence.

Segment CAGR and Growth Architecture

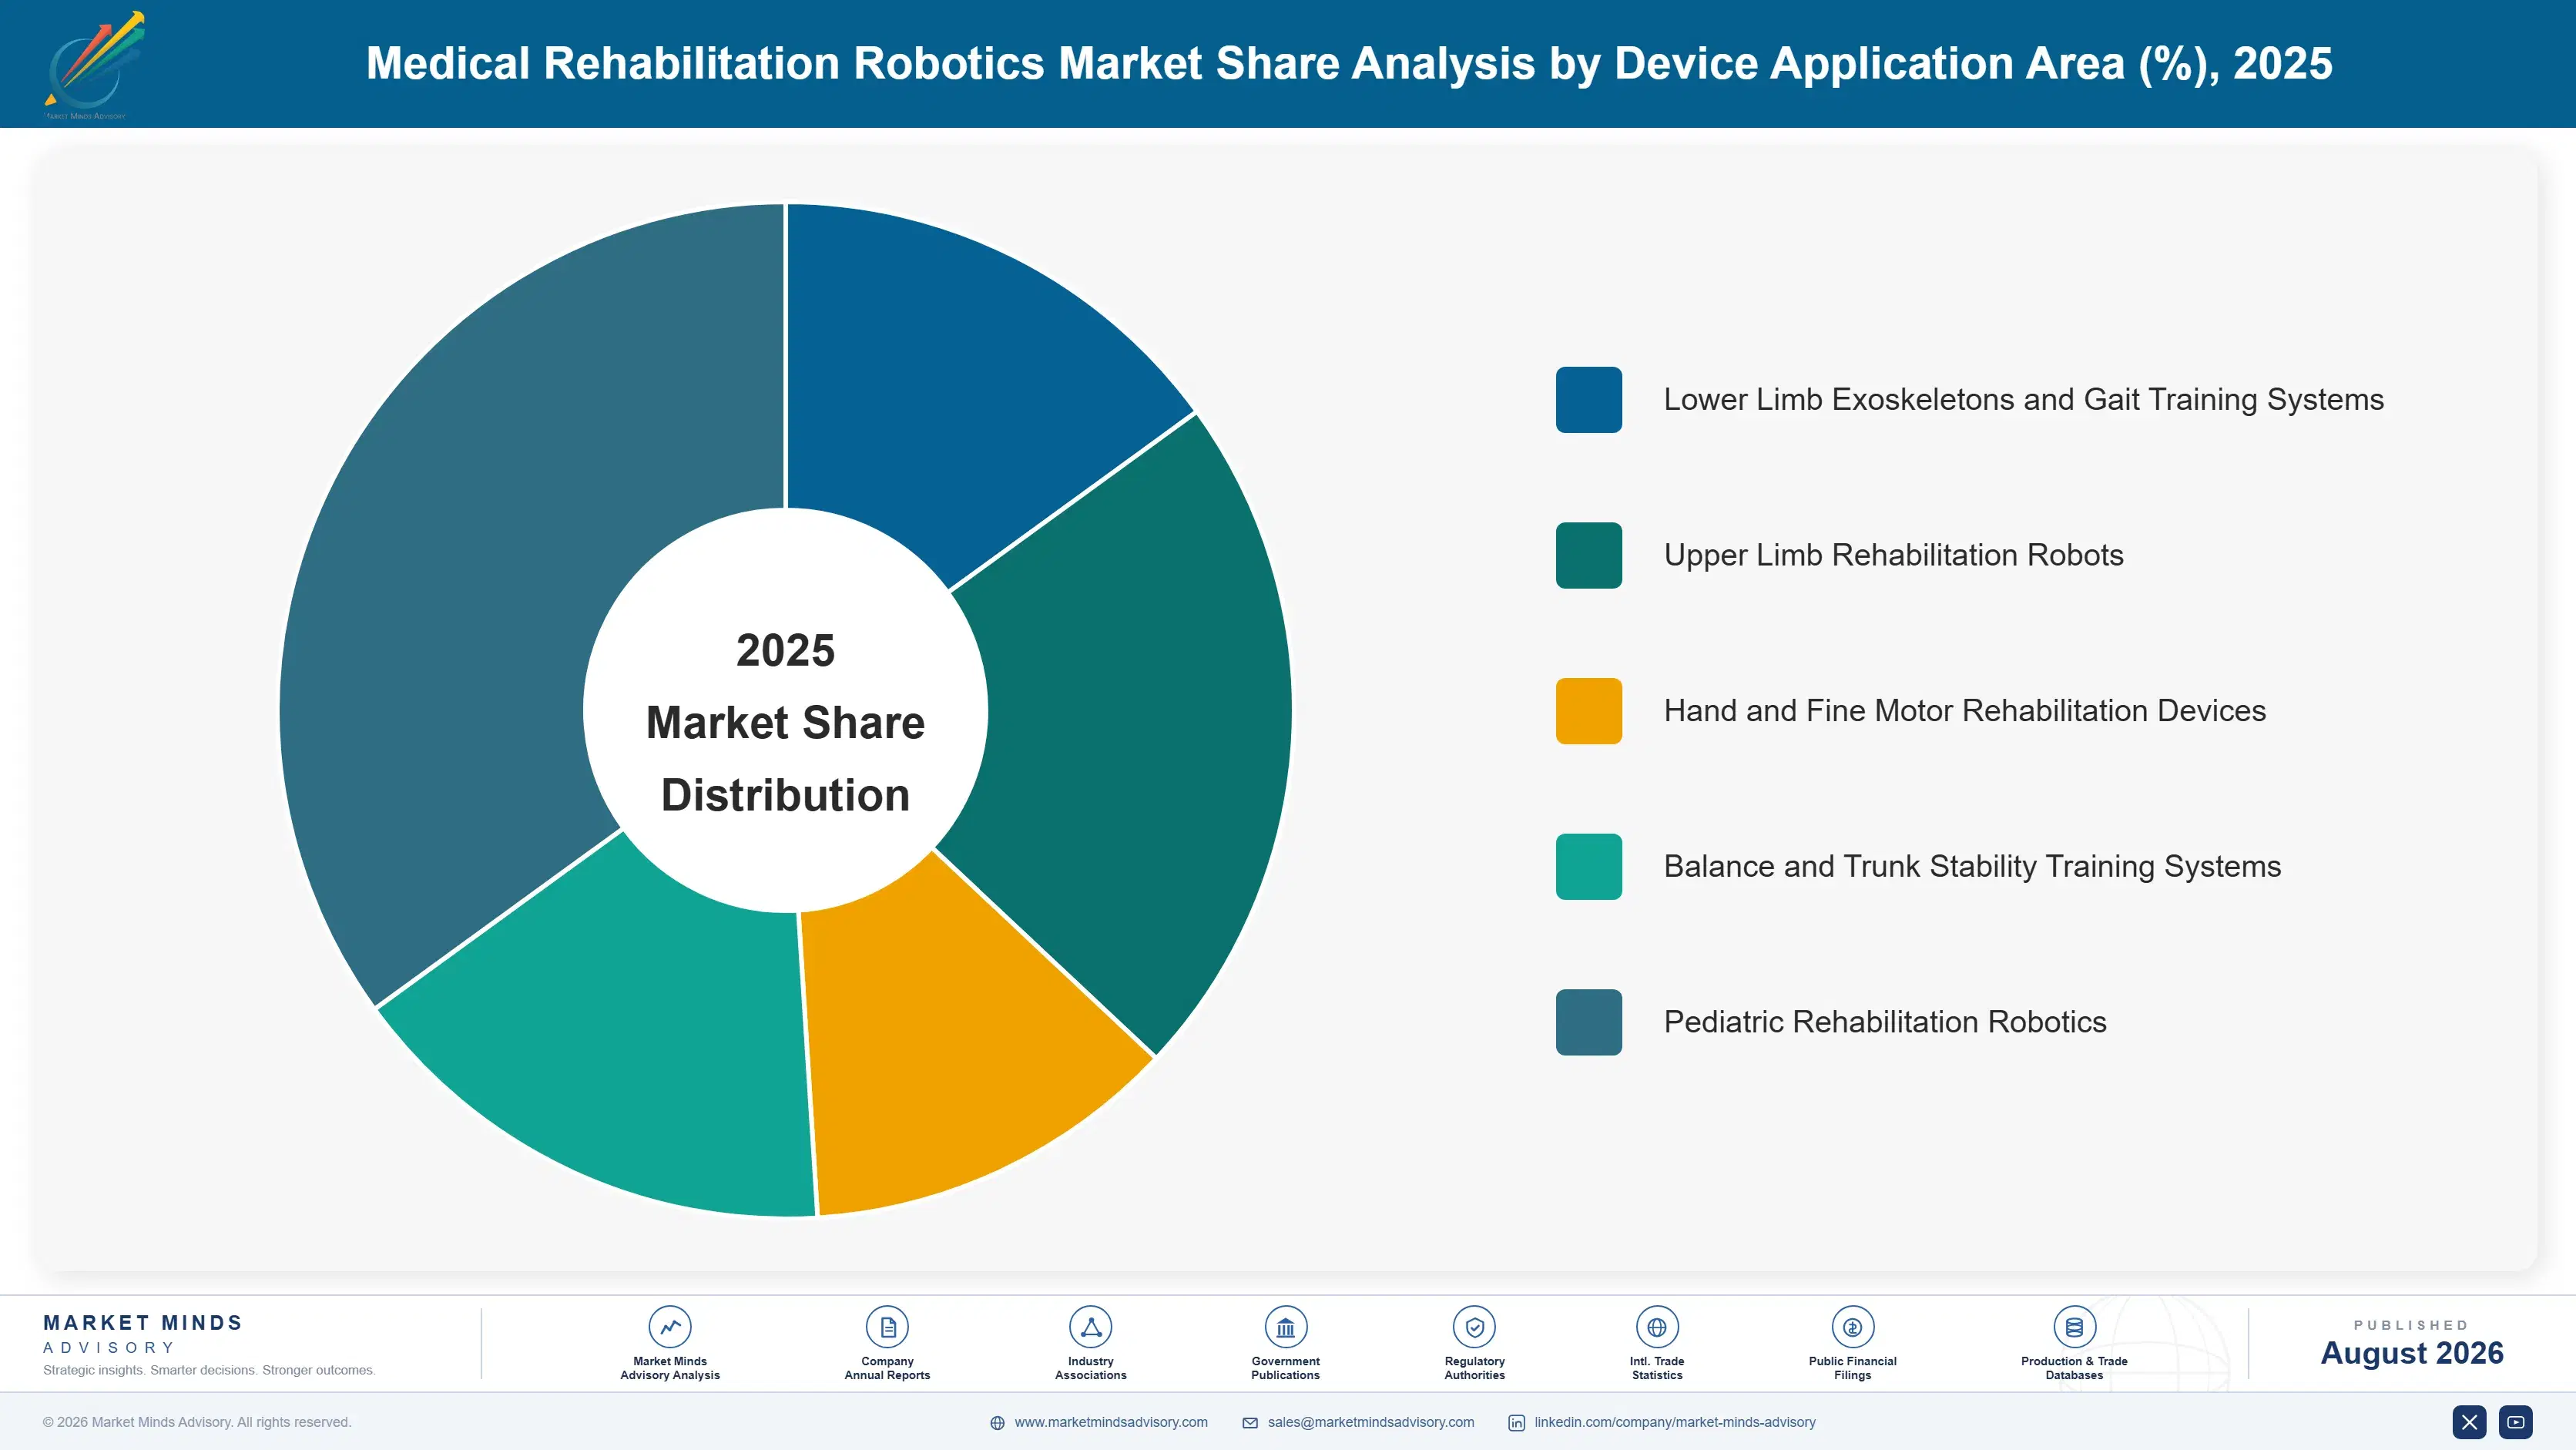
Segmentation follows the body region and clinical function each device is designed to treat, a single application logic used consistently across the category. Each application carries distinct clinical evidence requirements and reimbursement pathways, so commercial position tracks application rather than underlying robotic technology, which appears separately within the framework below. Two applications lead current growth.
medical-rehabilitation-robotics-market-market-share-analysis-1787325520750

Lower Limb Exoskeletons and Gait Training Systems

Lower limb exoskeletons and gait training systems grow fastest at 14.0%, about 1.23 times the overall 11.4% rate, pulled forward by reimbursement coverage expansion for robotic-assisted stroke and spinal cord injury rehabilitation across more payers each year. This category commands the highest average selling prices in the market, reflecting the mechanical complexity of devices that must safely bear patient body weight while executing precise, repeatable gait cycles across extended daily sessions. Ekso Bionics and ReWalk Robotics both hold particularly strong positions here given years of clinical evidence generation supporting payer coverage decisions. Hospital rehabilitation networks increasingly specify this category first when expanding robotic therapy capacity given its broad applicability across recovery pathways.
CAGR 14.0%

Pediatric Rehabilitation Robotics

Pediatric rehabilitation robotics grows at 13.0%, the second-fastest application, as growing clinical awareness of early intervention benefits for children with cerebral palsy and other developmental motor conditions drives specialized device adoption across children's hospitals nationally and internationally each year without exception anywhere. This category requires devices scaled and calibrated specifically for pediatric anatomy and engagement patterns, a technical distinction that favours manufacturers with dedicated pediatric engineering programmes over adult-focused device makers retrofitting smaller components hastily and without proper testing. Fourier Intelligence has expanded its pediatric product line considerably in response to growing children's hospital demand. Early intervention funding initiatives in several countries are expanding the addressable patient population meaningfully each year.
CAGR 13.0%
Full segment breakdown across 5 segments available in the complete report.

Regional Architecture and Country Demand Map

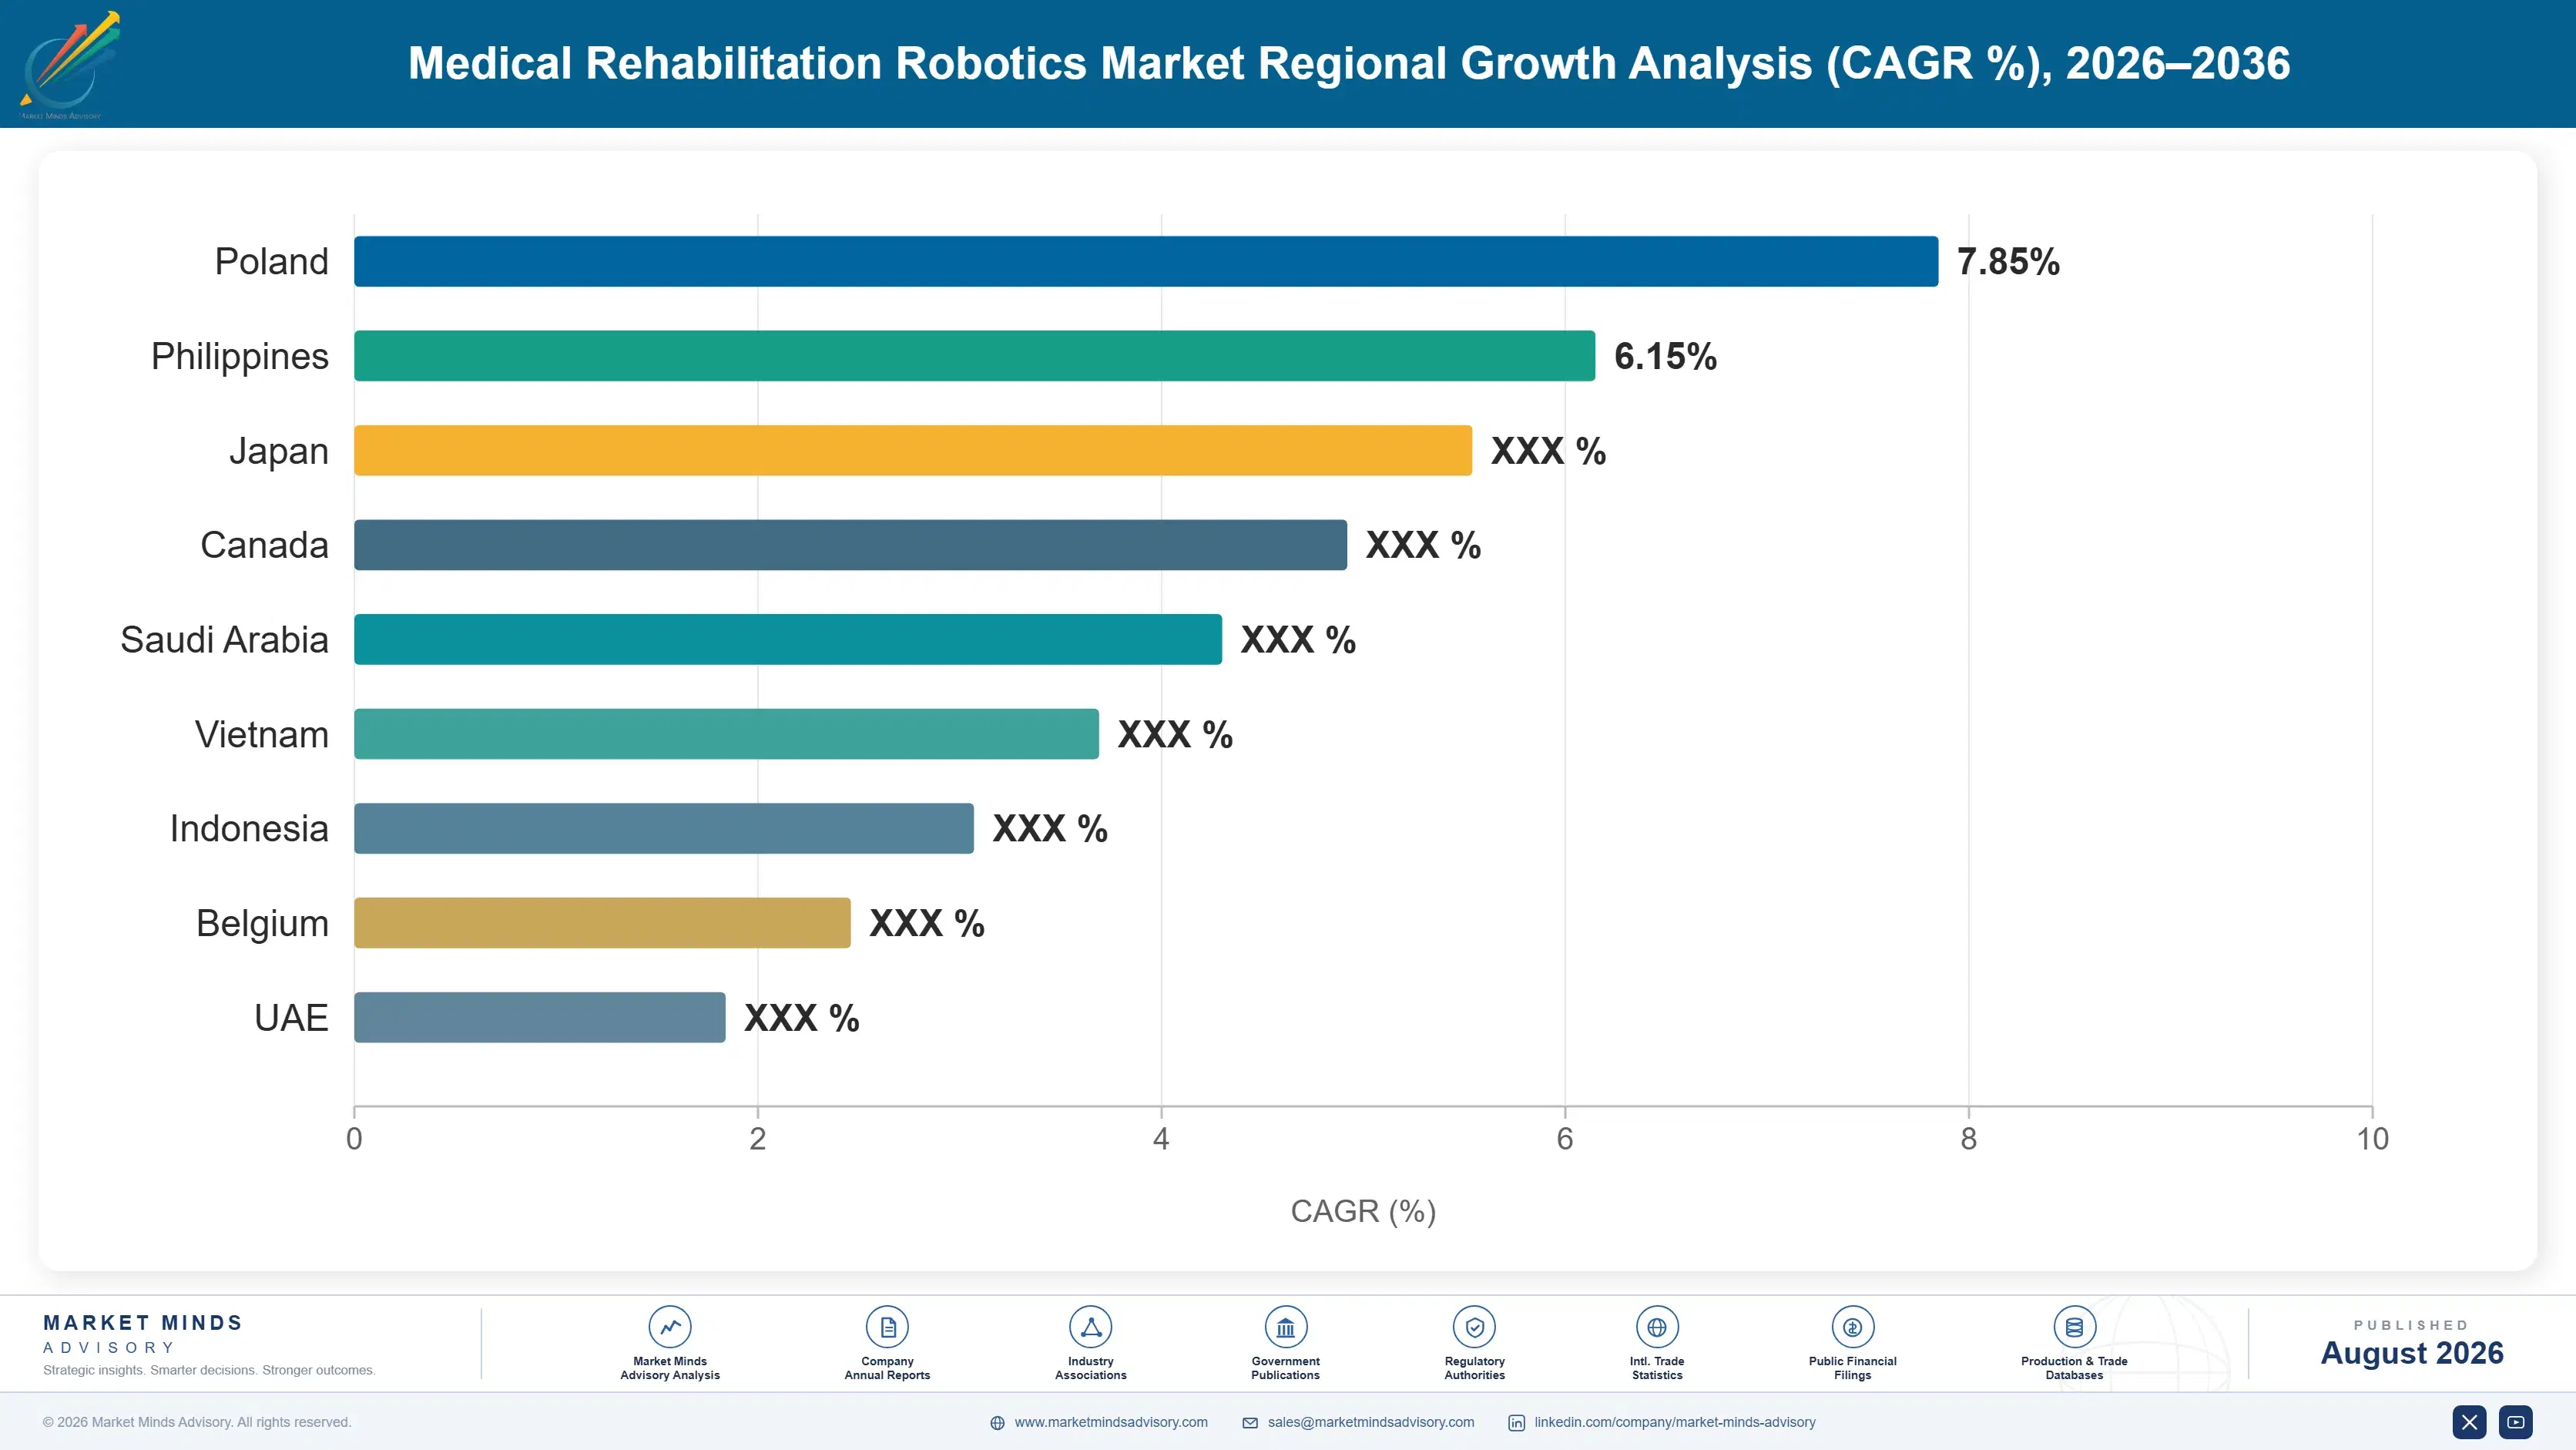
Rehabilitation hospital infrastructure and reimbursement maturity together set this distribution, since procurement tracks where payer coverage makes robotic therapy financially viable across most healthcare systems worldwide. North America leads on established infrastructure, while South Asia and Pacific posts the fastest regional growth of all seven regions.

North America

Established rehabilitation hospital infrastructure and reimbursement maturity anchor North American demand more than any other single factor. North America holds 30% of value, the largest single share, with United States rehabilitation hospital networks and Medicare coverage decisions setting adoption pace for the broader region considerably. Physical therapist shortages across the country have pushed hospital administrators toward robotic-assisted therapy procurement more urgently in recent years than clinical interest alone would explain. Canadian provincial health systems follow similar adoption patterns, though reimbursement frameworks vary meaningfully by province. Growth of 10.8% reflects mature market dynamics tempered by continued reimbursement coverage expansion across more eligible procedures. Veterans Affairs rehabilitation facilities represent a particularly steady procurement channel nationally.
Share: 30% | CAGR: 10.8% (2026 to 2036)

Western Europe

National health system procurement and aging demographics together define this market above any other single factor. Western Europe holds 22% of value, with German, British, and French national health systems funding rehabilitation robotics through centralized procurement processes that differ considerably from the more fragmented American payer landscape. Aging populations across the region sustain rising post-stroke rehabilitation caseloads that national health systems increasingly cannot staff through manual therapy alone. Reimbursement frameworks here tend toward slower but more comprehensive coverage decisions once adopted nationally. Growth of 9.8%, the slowest of the seven, reflects mature market penetration in the region's largest national health systems specifically. Scandinavian countries lead in per-capita adoption given strong public healthcare funding commitments.
Share: 22% | CAGR: 9.8% (2026 to 2036)
Regional intelligence for 5 additional markets available in the complete report: East Asia, South Asia and Pacific, Latin America, Middle East and Africa, Eastern Europe. Contact sales@marketmindsadvisory.com.
medical-rehabilitation-robotics-market-country-cagr-analysis-1787325521267

Where Rehabilitation Robotics Manufacturer Margin Concentrates

Competing purely on hardware price concentrates margin in exactly the segment where East Asian manufacturers now offer comparable specifications at lower cost and thinner support. The four moves below shift value toward positions clinical evidence and payer relationships genuinely protect: reimbursement advocacy depth, adaptive software capability, installed base training programmes, and real-world outcome data generation.

Invest in Reimbursement Advocacy Programmes Directly

Reimbursement coverage has reached roughly 45 percent of eligible procedures, a share that has risen steadily as manufacturers investing in clinical evidence generation and payer advocacy programmes convert coverage decisions into standard care pathway inclusion across more jurisdictions worldwide each year. Manufacturers without dedicated reimbursement advocacy capability increasingly struggle to convert strong clinical interest into actual purchase orders, since hospital administrators will not commit capital without reasonable reimbursement certainty in place. Building this capability requires sustained investment in health economics research and payer relationship management beyond pure product engineering expertise entirely, a commitment most smaller competitors avoid.
Market Impact: Coverage now reaches roughly 45% of

Build Genuine AI-Driven Adaptive Software Capability

Rehabilitation robots with adaptive algorithms treat roughly 30 percent more patient conditions per unit than fixed-protocol systems, extending the addressable clinical use case and revenue per device considerably over a comparable installed base lifetime and clinical relationship built over years. Manufacturers with genuine adaptive software capability capture specification that hardware-only competitors increasingly cannot match as clinical buyers weigh personalization capability more heavily each purchasing cycle they undertake. This software investment compounds over time as patient outcome data accumulates and algorithm performance improves with each additional clinical deployment recorded across the installed base.
Market Impact: Adaptive units now treat roughly 30

Deepen Clinical Training and Support Programmes

A rehabilitation robot that sits unused because therapists were never properly trained delivers no return regardless of list price, making installed base training depth a genuine competitive moat that hardware specifications alone cannot overcome quickly or cheaply anywhere. Manufacturers investing in comprehensive clinical training and ongoing support programmes capture utilization rates roughly 25 percent higher than competitors offering minimal onboarding support after initial installation completes. This relationship depth compounds over years as trained clinical staff default to familiar systems across repeat procurement decisions at their institution and across affiliated facilities.
Market Impact: Trained clinics reach roughly 25% h

Generate Real-World Outcome Evidence Continuously Over Time

Reimbursement policy for robotic-assisted therapy varies considerably across payers, with coverage reaching roughly 45 percent in leading markets but remaining minimal in many others where evidence remains genuinely insufficient for payer confidence to expand further right now across most jurisdictions and geographies. Manufacturers funding real-world evidence generation studies capture broader payer coverage decisions over time that competitors relying solely on smaller clinical trials cannot achieve as quickly. This evidence generation investment, sustained continuously rather than treated as a one-time regulatory hurdle, increasingly determines which manufacturers win expanded reimbursement decisions first.
Market Impact: Evidence programmes now cover rough

Who Controls the Margin Pool

Concentration sits at a moderate 42% among the top five, led by Hocoma's clinical installed base depth and Ekso Bionics' exoskeleton category leadership built over a decade of clinical evidence generation. The gap between leaders and challengers is reimbursement advocacy and clinical training infrastructure rather than raw hardware specification, which has converged considerably across credible competitors. All participants are assessed on global installed base unit count as disclosed in company
Competition runs along four lines. First, reimbursement advocacy depth, increasingly the fastest-growing purchase consideration among hospital administrators. Second, adaptive software capability that extends addressable clinical use cases per unit. Third, clinical training infrastructure that determines device utilization after installation. Fourth, real-world outcome evidence generation that shapes future payer coverage decisions.

Pressure is building from two directions. East Asian manufacturers including Fourier Intelligence have built substantial engineering capability and are converting cost advantages into meaningful share gains in price-sensitive emerging markets. Meanwhile established leaders continue defending position through sustained reimbursement advocacy and clinical training investment that smaller competitors struggle to match. Rankings should favour manufacturers combining clinical evidence depth with genuine adaptive software capability over those competing on price alone.
medical-rehabilitation-robotics-market-company-positioning-matrix-1787325521793

Competitive Moat and Risk Dimensions

HOCOMA

Moat: Clinical installed base depth

Hocoma maintains one of the deepest clinical installed bases in the category, built over more than two decades of rehabilitation hospital relationships and accumulated outcome data. Its evidence generation programmes support payer coverage decisions across more jurisdictions than most competitors currently achieve. Strong hospital training infrastructure sustains high device utilization rates across its installed base globally.
HOCOMA

Risk: East Asian price competition rising

East Asian manufacturers now offer comparable hardware specifications at meaningfully lower prices, eroding the premium Hocoma has historically commanded in cost-sensitive emerging markets specifically. Its legacy product architecture requires ongoing investment to match newer competitors' adaptive software capability. Smaller, more agile competitors are moving faster on AI-driven personalization features currently.
EKSO BIONICS

Moat: Exoskeleton category leadership

Ekso Bionics built the lower limb exoskeleton category and maintains the deepest clinical evidence base supporting reimbursement coverage decisions across multiple major payers. Its brand recognition among rehabilitation hospital administrators exceeds most competitors given years of category-defining clinical publications. Established relationships with leading rehabilitation hospital networks provide considerable specification advantage.
EKSO BIONICS

Risk: Narrow product portfolio concentration

Ekso Bionics' concentration in lower limb exoskeletons exposes it more directly to reimbursement policy changes in that specific category than more diversified competitors face. Newer entrants with broader product portfolios can bundle offerings in ways Ekso's narrower focus cannot easily match. Capital constraints relative to larger diversified medical device competitors limit its research and development pace somewhat.

Players Tracked

Prominent Players

Hocoma
Ekso Bionics
ReWalk Robotics
Fourier Intelligence
Bionik Laboratories

Other Key Players

Myomo
Tyromotion
Reha Technology
AlterG
Rex Bionics
Cyberdyne
Motorika
Kinova Robotics
Restorative Therapies
Bioxtreme
Barrett Technology
MOTEK Medical
Gogoa Mobility Robots
Rehab-Robotics Company
Egzotech

Recent Developments

APRIL 2025

Ekso Bionics receives expanded reimbursement coverage decision

Ekso Bionics received an expanded reimbursement coverage decision from a major private payer covering robotic-assisted gait training for a broader range of stroke and spinal cord injury patients. This was a coverage decision rather than any acquisition, directly expanding the addressable patient population for its exoskeleton product line.
Signal: Payer coverage decisions are increasingly
SEPTEMBER 2024

Fourier Intelligence expands manufacturing capacity in China

Fourier Intelligence announced expanded manufacturing capacity in China to meet rising domestic and export demand for its rehabilitation robotics product line across multiple device categories and clinical applications. This was an organic capacity expansion rather than any acquisition, reflecting confidence in sustained East Asian demand growth.
Signal: East Asian manufacturers are scaling produ
JANUARY 2025

Hocoma acquires adaptive software startup

Hocoma acquired a specialist adaptive therapy software startup to strengthen its AI-driven personalization capability across its existing rehabilitation robotics product line and its future development roadmap. This was an acquisition rather than a joint venture, adding proprietary software talent directly into Hocoma's existing product development organization.
Signal: Established manufacturers are buying softw

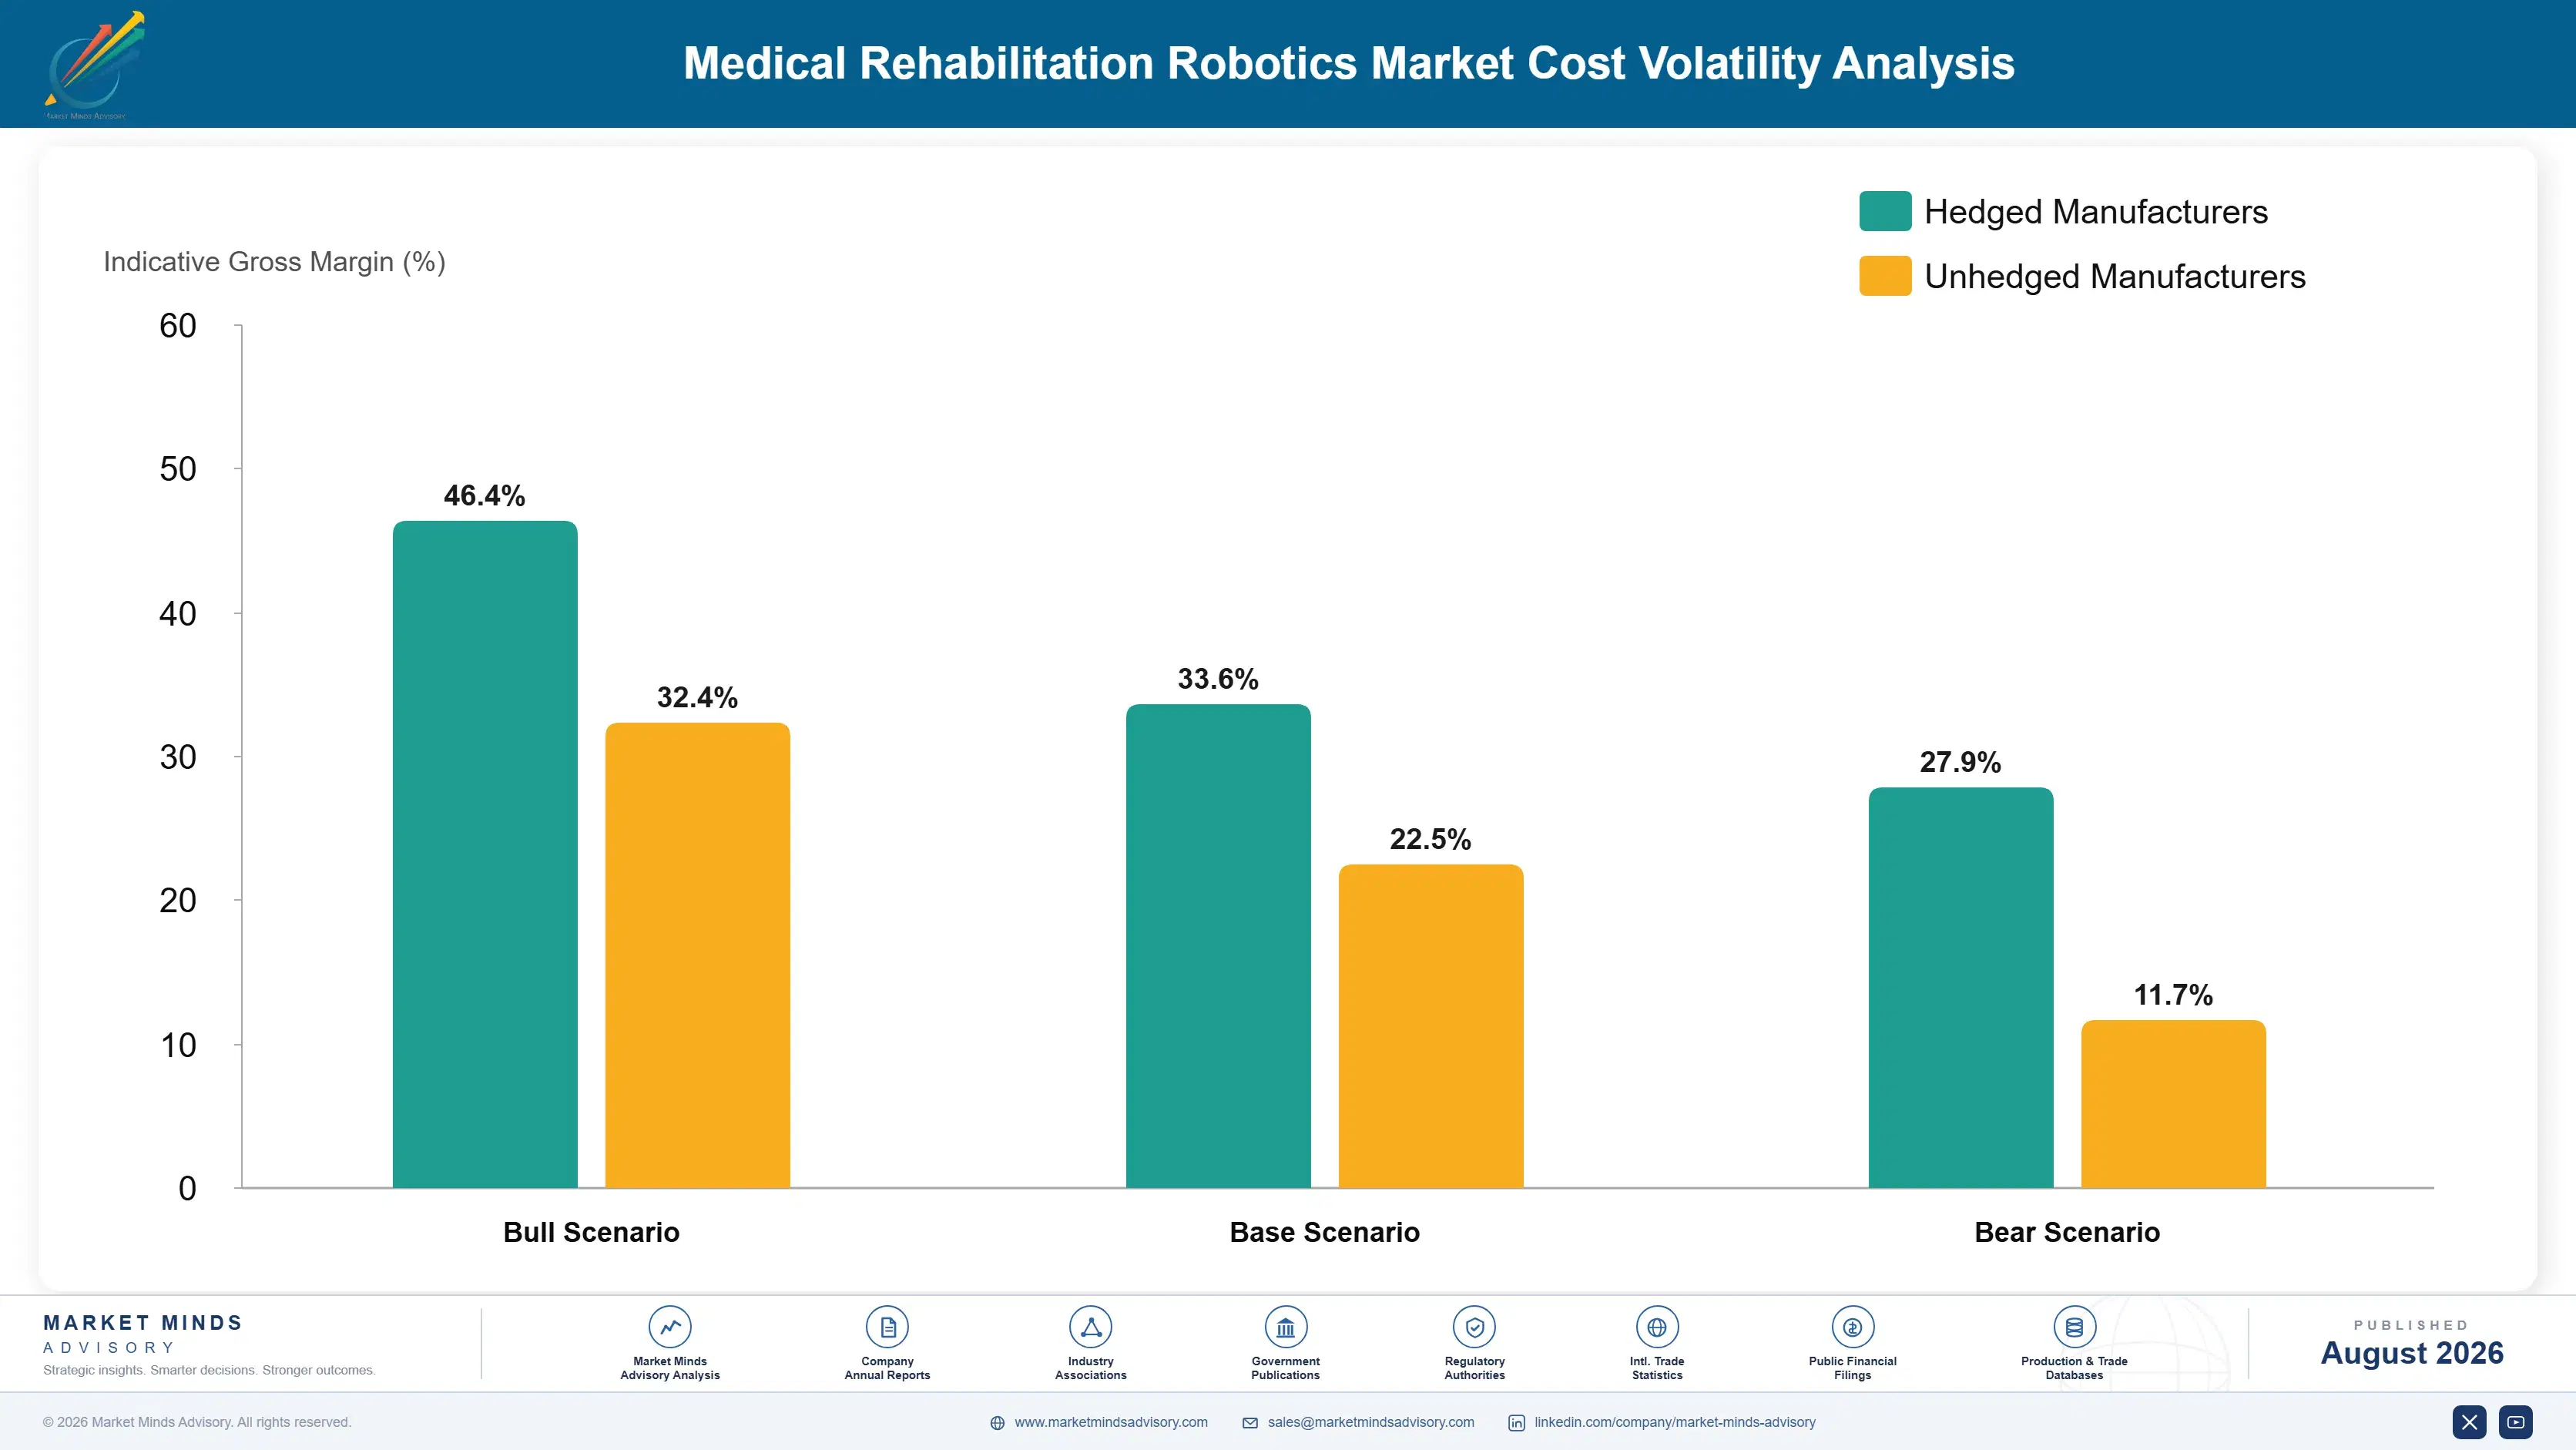
Precision Actuators and Sensor Systems

Precision actuators, motors, and sensor systems together account for 42% to 55% of cost of goods sold, reflecting the mechatronic engineering complexity rehabilitation robots require for safe, repeatable patient interaction across extended daily clinical duty cycles. These components are sourced predominantly from specialty motion control suppliers based in Japan, Germany, and the United States directly.
Semiconductor and precision component supply tightened considerably through 2021 and 2022 amid the broader global chip shortage, with several rehabilitation robotics manufacturers disclosing extended lead times on servo motors and control electronics specifically, per company annual report commentary covering that period. Several manufacturers delayed product shipments and, in some cases, redesigned control systems around available components as a direct result of that scarcity. Supply has since eased, though lead times remain longer than pre-2021 norms for certain specialist sensor components.

Exposure separates clearly by component sourcing strategy and manufacturing scale. Larger manufacturers with diversified precision component supplier relationships absorbed less disruption than smaller competitors dependent on single-source components during the tightest shortage periods. East Asian manufacturers increasingly source components domestically, which has reduced their exposure to the international supply constraints that affected Western competitors more heavily during recent shortages.
medical-rehabilitation-robotics-market-cost-volatility-analysis-1787325521987

Diversify precision component supplier relationships

Single-source precision component dependence exposed several manufacturers to extended lead times during the 2021 and 2022 chip shortage specifically and repeatedly across the industry. Qualifying multiple component suppliers reduces this concentration risk considerably across future disruption cycles ahead. The trade-off is additional qualification and regulatory testing cost that smaller manufacturers sometimes cannot justify economically.

Localise component sourcing where feasible

East Asian manufacturers sourcing components domestically faced meaningfully less disruption than competitors dependent on international supply during recent shortages and price spikes. Localising precision motion control sourcing reduces exposure to cross-border supply disruption considerably over time and across cycles. This requires manufacturing investment that only larger manufacturers can typically justify given current production volumes.

Invest in software to offset hardware pressure

Precision component cost pressure compresses hardware margin regardless of manufacturer scale, while adaptive software and outcome data platform capability, once developed, carries meaningfully higher margin and genuine differentiation value over time across most product lines tracked. Software investment shifts manufacturer economics away from pure hardware competition entirely and durably across successive product generations launched.

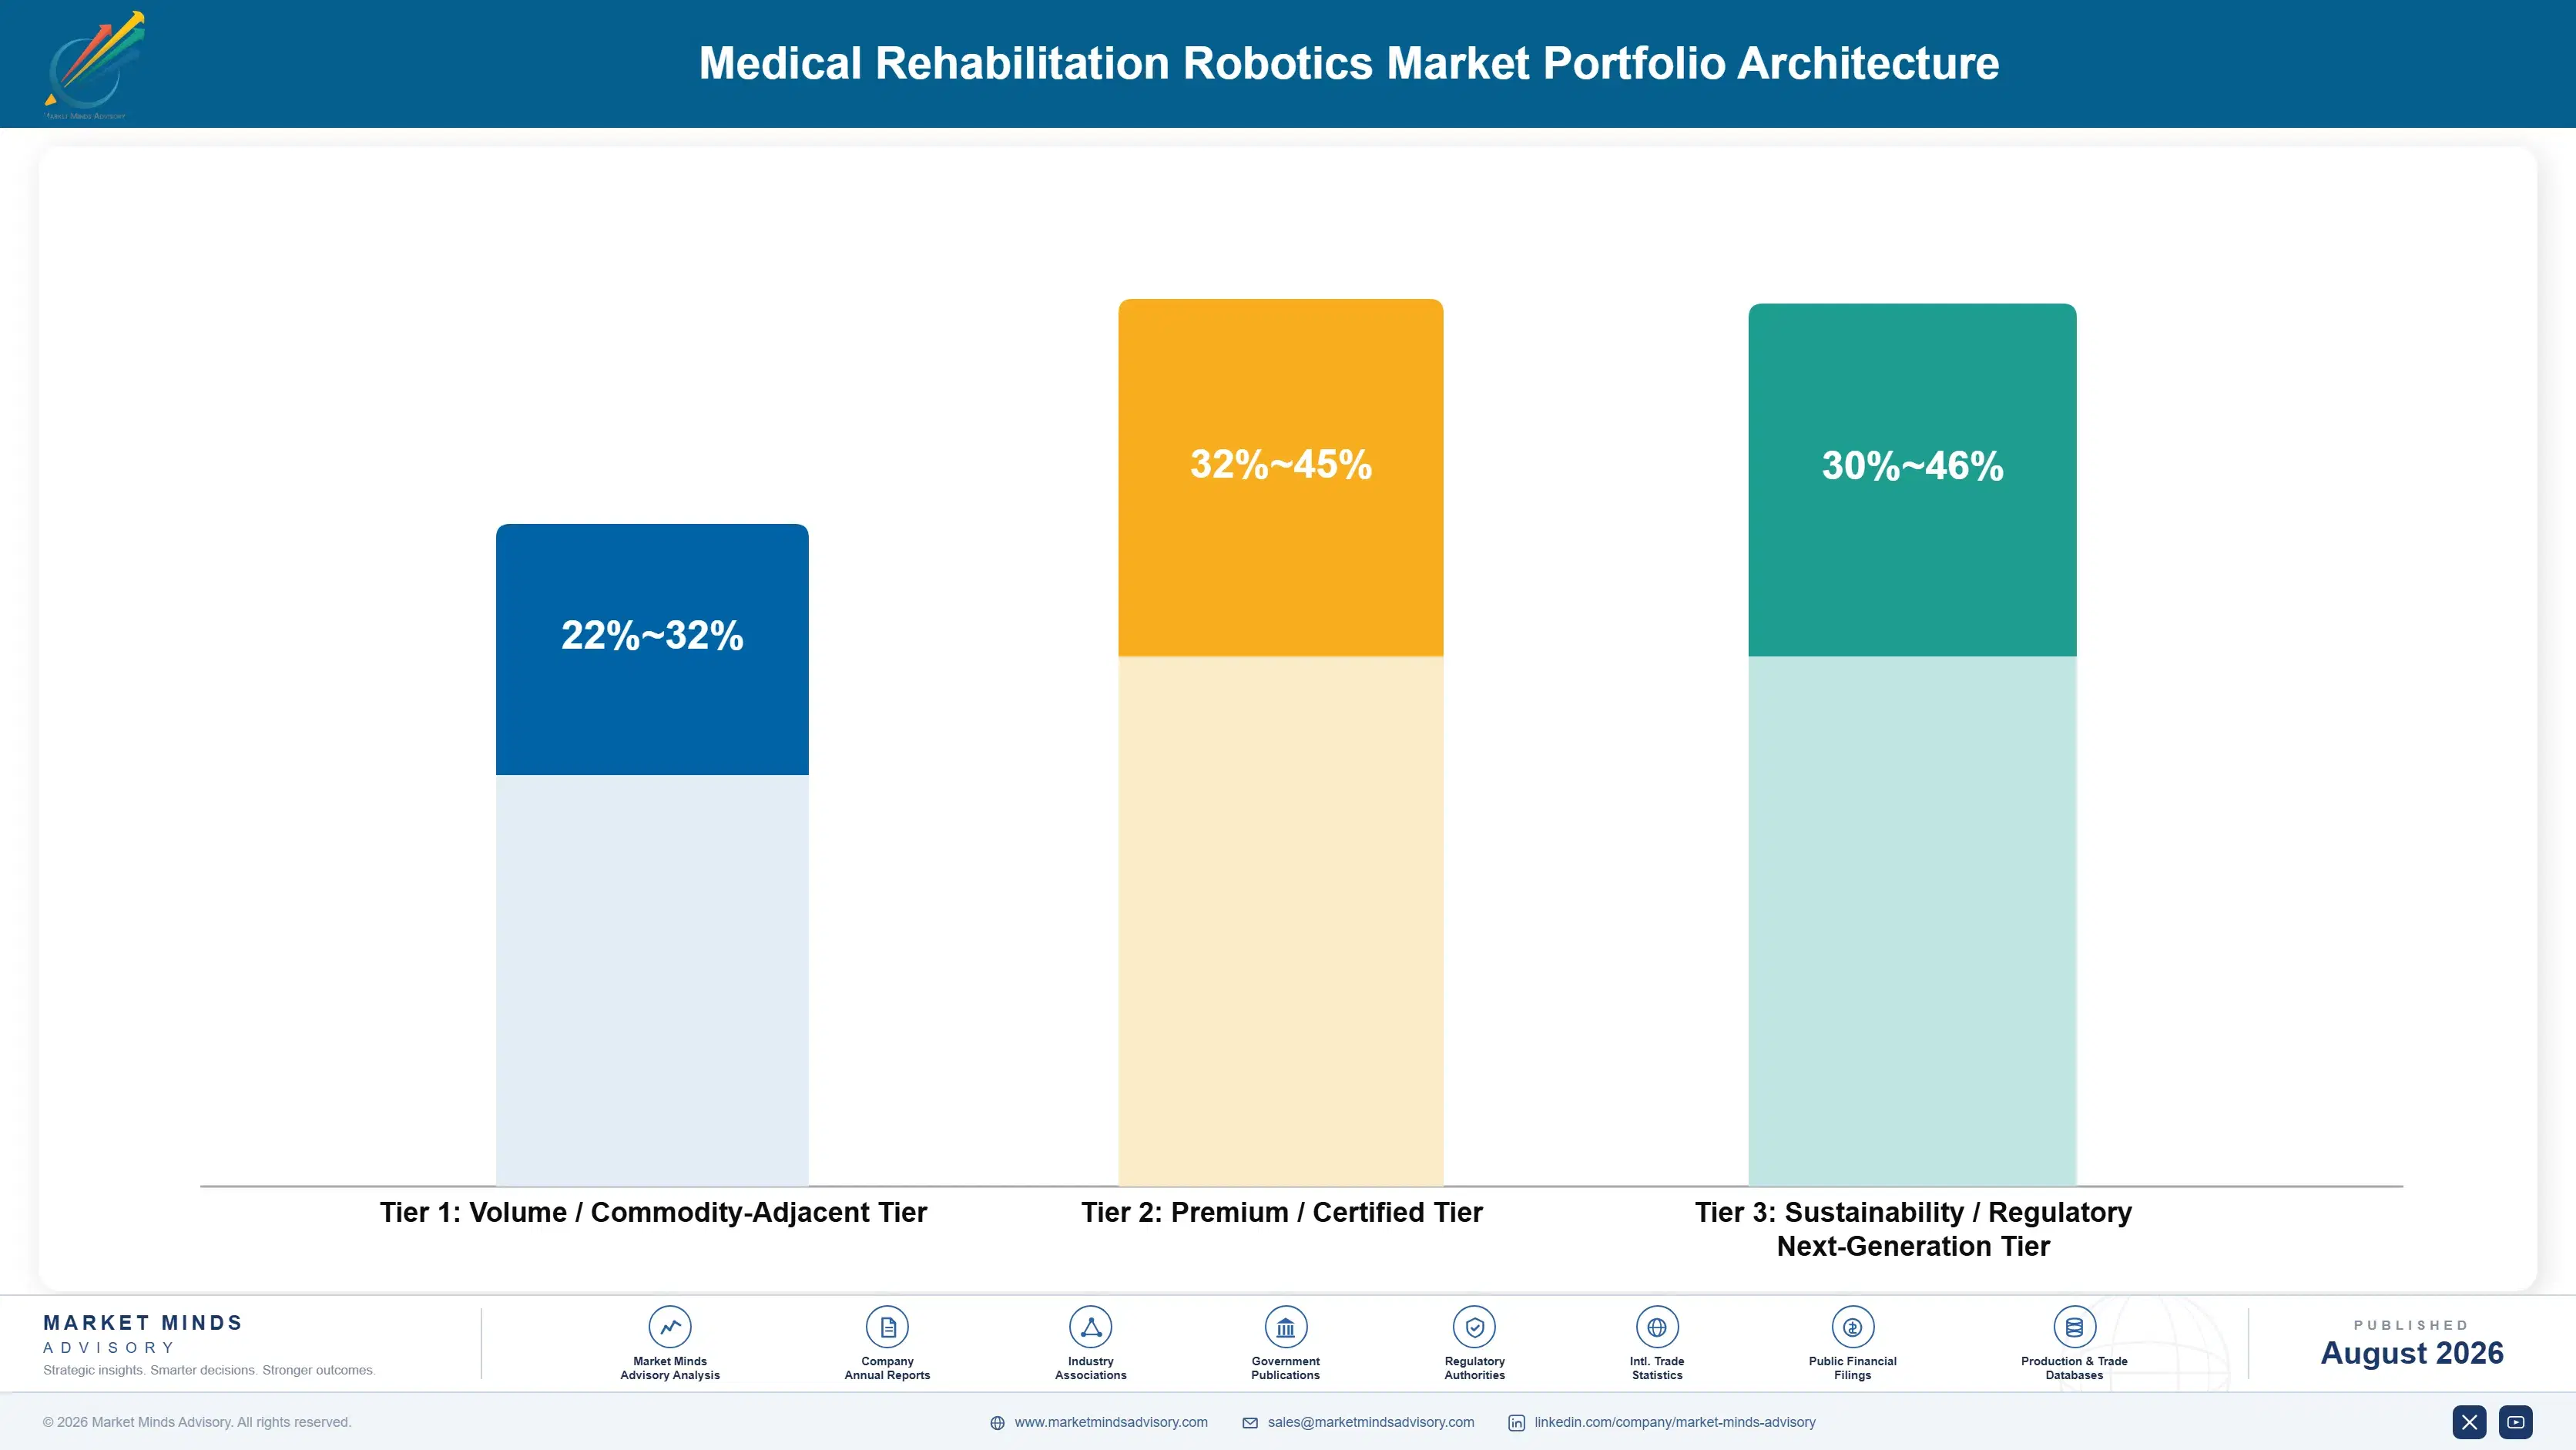
Portfolio Architecture for Margin Defence

The portfolio splits into three tiers with distinct economics. Standard fixed-protocol rehabilitation devices form the volume tier, competing increasingly on price against East Asian manufacturing scale with margin set by component cost and production efficiency. Adaptive AI-driven exoskeletons and gait trainers earn considerably more since software depth and clinical evidence breadth deter competitors lacking comparable technical investment. Reimbursement advocacy and clinical training services
The tension runs between standard device revenue that funds the business today and adaptive software and evidence generation investment that positions it for the next decade. A manufacturer defending standard device volume too aggressively against East Asian price competition cedes the highest-margin adaptive and service segments to competitors investing there directly and consistently. Companies managing this well use standard device cash flow to fund software development rather than treating them as competing priorities.

High-value pools concentrate where software depth, clinical evidence breadth, or reimbursement relationships limit competition: adaptive AI-driven exoskeletons, outcome data platforms, and reimbursement advocacy service relationships. Standard fixed-protocol devices sold without differentiated capability sit at the other end, competing almost entirely on price against every credible East Asian manufacturer now serving cost-sensitive institutional buyers.

Volume / Commodity-Adjacent Tier

Standard fixed-protocol rehabilitation devices competing increasingly on price against East Asian manufacturing scale, with margin set overwhelmingly by component cost and production efficiency across most categories tracked and monitored across the industry.
Gross Margin: 22-32%

Premium / Certified Tier

Adaptive AI-driven exoskeletons and gait trainers supporting meaningfully stronger margin than standard fixed-protocol production, reflecting genuine software and clinical evidence differentiation earned over years of trials, studies, and payer negotiations.
Gross Margin: 32-45%

Sustainability / Regulatory / Next-Generation Tier

Reimbursement advocacy platforms, real-world outcome data services, and pediatric-specific device lines developed ahead of expanding payer coverage decisions across multiple jurisdictions currently under active regulatory review and ongoing revision processes.
Gross Margin: 30-46%
medical-rehabilitation-robotics-market-portfolio-architecture-1787325522485

High-value Sub-segments and Strategic Watch-out

Lower Limb Exoskeletons and Gait Training Systems

High value and high growth at 14.0%, the fastest category in the market, driven by reimbursement coverage expansion for robotic-assisted stroke rehabilitation across more payers and jurisdictions currently under active review each year, a genuine and sustained regulatory tailwind few competitors can afford to ignore for long.
Gross Margin: 32-45%

Pediatric Rehabilitation Robotics

High value with strong growth at 13.0%, the second-fastest category, driven by growing clinical awareness of early intervention benefits for children with developmental motor conditions across major children's hospital networks worldwide, an increasingly funded clinical and public health priority nationally, regionally, and internationally right now.
Gross Margin: 32-45%

Upper Limb Rehabilitation Robots

The volume core by revenue, growing near 11.0% as this remains a well-established application across nearly every major rehabilitation hospital tracked currently worldwide, though growth has moderated meaningfully as penetration matures across most developed markets over the coming decade and well beyond that forecast horizon.
Gross Margin: 22-32%

Balance and Trunk Stability Training Systems

The strategic watch-out, growing near 10.0% and facing commoditization pressure from lower-cost East Asian manufacturers offering comparable specifications across most standard institutional procurement categories currently under budget pressure everywhere, eroding margin gradually each year across most established Western hospital markets and their affiliated purchasing institutions.
Gross Margin: 22-32%

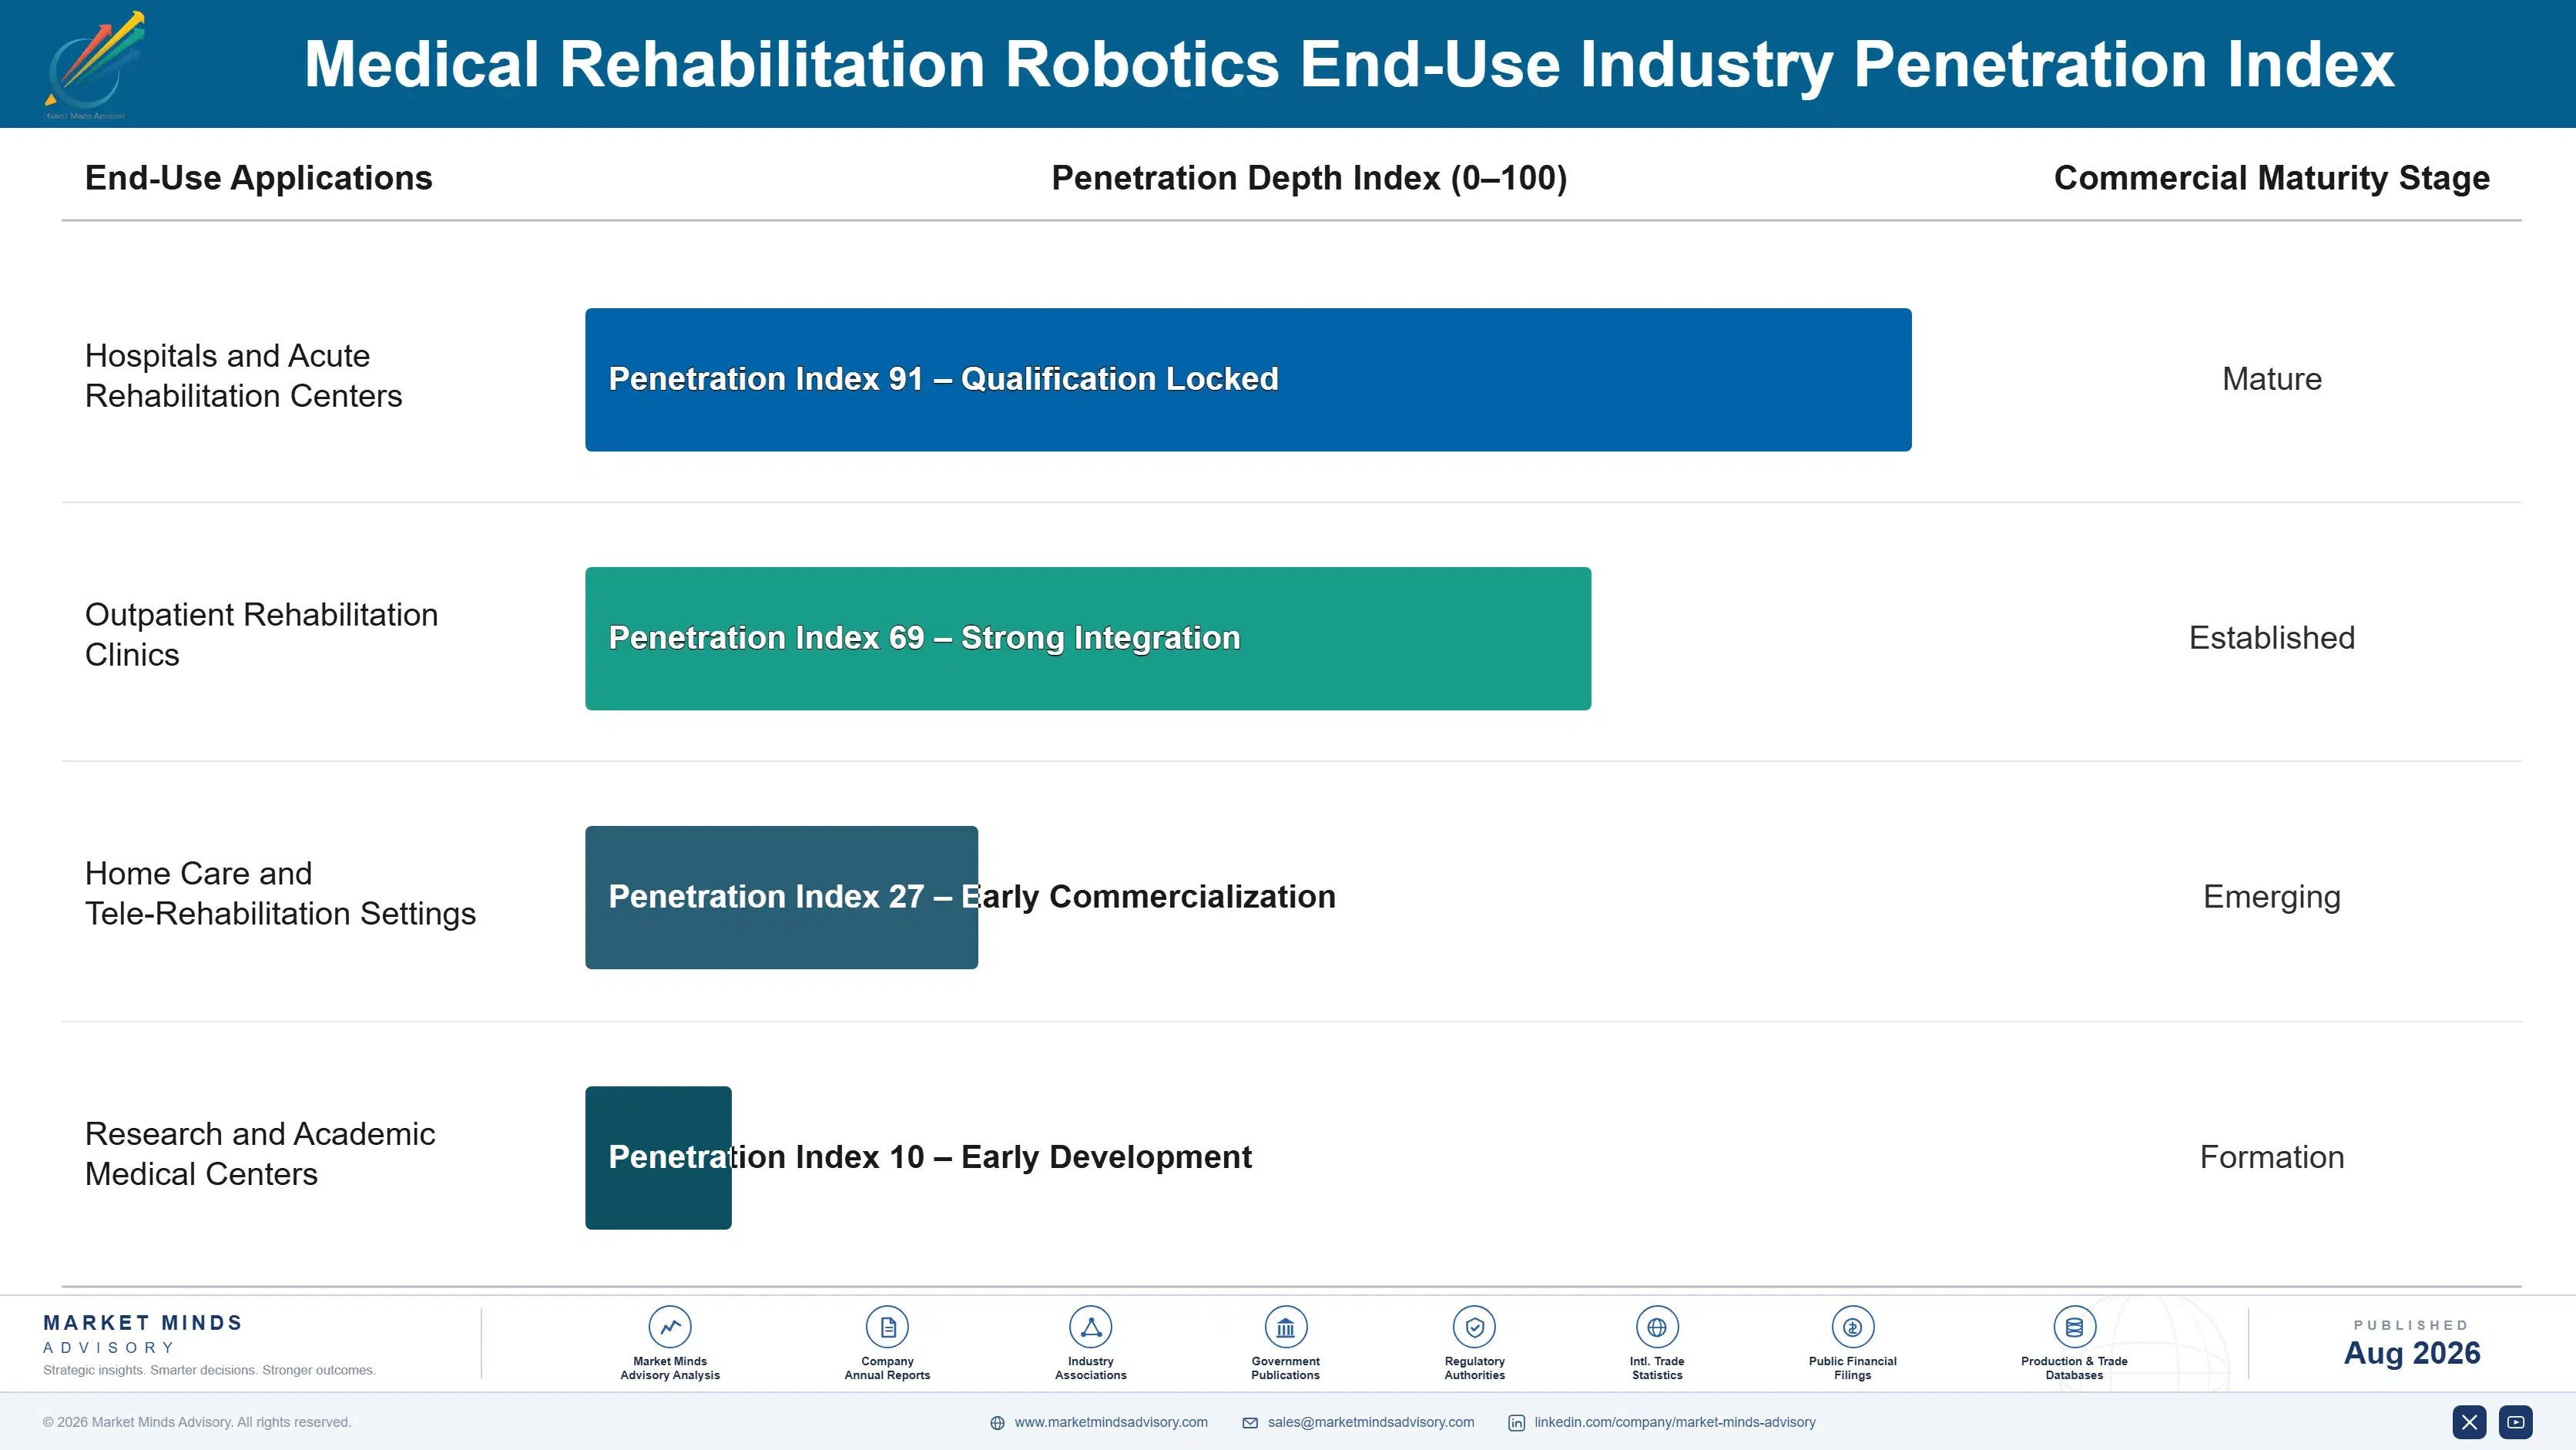
How Clinical Training Locks In Utilization

Revenue depends on clinical training depth and institutional specification loyalty, and a manufacturer's default status with a hospital network generates years of repeat procurement across every facility that network operates. Switching manufacturers requires retraining clinical staff on new device protocols, a cost that deters displacement even when a competitor offers marginally better pricing.
Adoption depth varies sharply by application. Lower limb exoskeleton buyers commit hardest, given the training complexity and reimbursement interdependence between device and billing code once installed and put into regular clinical use. Upper limb rehabilitation buyers sit in the middle, balancing vendor relationships against periodic competitive retendering on facility expansions. Standard balance training buyers switch most readily, since differentiation between qualified manufacturers remains genuinely minimal.

Buyer profiles have shifted from procurement officers evaluating unit price alone toward clinical directors weighing outcome data, reimbursement certainty, and staff training burden together across the full purchasing decision. Adaptive software capability has introduced a new buyer consideration around personalization depth that fixed-protocol economics never required previously. Younger clinical directors also weigh data integration and analytics access more heavily than predecessors did, favouring manufacturers with genuinely open platforms and transparent data-sharing practices.
medical-rehabilitation-robotics-market-end-use-penetration-index-1787325522974

Our Call on Medical Rehabilitation Robotics

These are among the four positions where our research anticipates prominent divergence between winners and laggards over the coming forecast period. Each is grounded in the demand model, the regulatory perimeter, and the announced capacity pipeline.
01 / REIMBURSEMENT ADVOCACY DEPTH

Payer coverage now decides procurement pace

Reimbursement coverage has reached roughly 45 percent of eligible procedures, a share that has risen steadily as manufacturers investing in clinical evidence generation and payer advocacy programmes convert coverage decisions into standard care pathway inclusion across more jurisdictions worldwide. Manufacturers without dedicated reimbursement advocacy capability increasingly struggle to convert strong clinical interest into actual purchase orders, since hospital administrators will not commit capital without reasonable certainty. Companies should build advocacy capability now, since this requirement increasingly gates access to the broadest addressable patient population.
02 / ADAPTIVE SOFTWARE DEPTH

Personalization capability decides specification

Rehabilitation robots with adaptive algorithms treat roughly 30 percent more patient conditions per unit than fixed-protocol systems, extending the addressable clinical use case and revenue per device considerably over a comparable installed base lifetime and clinical relationship built over time. Manufacturers with genuine adaptive software capability capture specification that hardware-only competitors increasingly cannot match as clinical buyers weigh personalization more heavily each cycle. Companies should invest in software depth as seriously as mechanical engineering, since data quality increasingly determines competitive positioning.
03 / CLINICAL TRAINING DEPTH

Training quality decides actual utilization

A rehabilitation robot that sits unused because therapists were never properly trained delivers no return regardless of list price, making installed base training depth a genuine competitive moat that hardware specifications alone cannot overcome quickly or cheaply anywhere. Manufacturers investing in comprehensive clinical training and support programmes capture utilization rates roughly 25 percent higher than competitors offering minimal onboarding support after installation completes fully. Companies should prioritise training infrastructure as a strategic asset, not an afterthought bundled into the initial sale.
04 / REAL-WORLD EVIDENCE GENERATION

Outcome data determines future coverage decisions

Reimbursement policy for robotic-assisted therapy varies considerably across payers, with coverage reaching roughly 45 percent in leading markets but remaining minimal in many others where evidence remains genuinely insufficient for payer confidence to expand further right now across most jurisdictions. Manufacturers funding real-world evidence generation studies capture broader payer coverage decisions over time that competitors relying solely on smaller clinical trials cannot achieve as quickly or as reliably. Companies should treat evidence generation as continuous, since it increasingly determines which manufacturers win expanded coverage first.

Engagement Snapshot From the Field

A live engagement with an industry participant carrying material or product regulatory and market exposure ahead of a defining policy shift, showing how our research translates into a defensible multi-year portfolio strategy.
MARKET MINDS ADVISORY · CLIENT ENGAGEMENT SUMMARY
Medical Rehabilitation Robotics Producer Strategic Portfolio Review and Transition Roadmap 2026·Investment Scenario on Medical Rehabilitation Robotics Exposure Evaluation 2025-26
CLIENT PROFILE
A regional rehabilitation hospital network operating twelve facilities engaged MMA ahead of a multi-year capital procurement decision covering robotic-assisted therapy expansion across its full network of hospitals, outpatient clinics, and affiliated satellite treatment locations statewide. The client reported persistent physical therapist staffing shortages limiting patient throughput across several of its busiest facilities (client-reported, unverified by MMA).
STRATEGIC CHALLENGE
Leadership faced a choice between concentrating robotic therapy investment in its largest flagship facility or distributing smaller deployments across all twelve facilities network-wide. The board worried that concentrated investment would leave smaller facilities unable to address staffing shortages, while distributed investment risked insufficient scale at any single site to justify dedicated training.
MMA APPROACH
MMA modelled patient throughput and reimbursement recovery under both concentrated and distributed procurement scenarios across the network's twelve facilities and multiple device categories. We benchmarked clinical training requirements and staffing impact for each scenario against the network's existing therapist headcount and turnover patterns. We then assessed reimbursement variation across the network's operating states to identify where coverage most reliably supported near-term financial return.
KEY FINDINGS
  1. A distributed deployment across the four highest-volume facilities was projected to relieve staffing pressure for roughly 60 percent of the network's total eligible patient population.
  2. Reimbursement coverage varied from 30 to 55 percent across the network's operating states, meaningfully shifting projected payback periods by facility location and patient mix.
  3. Concentrated investment in the flagship facility alone would have left eight facilities without any staffing relief despite comparable underlying patient demand and clinical need.
  4. Clinical training costs were roughly 20 percent lower per facility under the distributed approach given shared training resources across nearby affiliated sites.
CLIENT PROFILE
A regional rehabilitation hospital network operating twelve facilities engaged MMA ahead of a multi-year capital procurement decision covering robotic-assisted therapy expansion across its full network of hospitals, outpatient clinics, and affiliated satellite treatment locations statewide. The client reported persistent physical therapist staffing shortages limiting patient throughput across several of its busiest facilities (client-reported, unverified by MMA).
STRATEGIC CHALLENGE
Leadership faced a choice between concentrating robotic therapy investment in its largest flagship facility or distributing smaller deployments across all twelve facilities network-wide. The board worried that concentrated investment would leave smaller facilities unable to address staffing shortages, while distributed investment risked insufficient scale at any single site to justify dedicated training.
MMA APPROACH
MMA modelled patient throughput and reimbursement recovery under both concentrated and distributed procurement scenarios across the network's twelve facilities and multiple device categories. We benchmarked clinical training requirements and staffing impact for each scenario against the network's existing therapist headcount and turnover patterns. We then assessed reimbursement variation across the network's operating states to identify where coverage most reliably supported near-term financial return.
KEY FINDINGS
  1. A distributed deployment across the four highest-volume facilities was projected to relieve staffing pressure for roughly 60 percent of the network's total eligible patient population.
  2. Reimbursement coverage varied from 30 to 55 percent across the network's operating states, meaningfully shifting projected payback periods by facility location and patient mix.
  3. Concentrated investment in the flagship facility alone would have left eight facilities without any staffing relief despite comparable underlying patient demand and clinical need.
  4. Clinical training costs were roughly 20 percent lower per facility under the distributed approach given shared training resources across nearby affiliated sites.
RECOMMENDED STRATEGY
Phase 1: Phase 1 (0 to 4 months): Deploy robotic therapy systems at the four highest-volume, highest-reimbursement facilities in the network first. Phase 2: Phase 2 (4 to 12 months): Build a shared clinical training programme serving all deployed facilities within the network jointly. Phase 3: Phase 3 (12 to 24 months): Expand deployment to remaining facilities based on documented outcome and device utilization data collected earlier.
OUTCOME
The client deployed robotic therapy systems across its four highest-volume facilities first, relieving staffing pressure for the majority of its eligible patient population within the first year of the rollout. Patient throughput per therapist shift improved meaningfully at deployed facilities following implementation (client-reported, unverified by MMA).

Frequently Asked Questions

Foundational context covering the market sizes, CAGR, scope, country, region and competition that inform every finding below. This section is provided to cover basics and most often pre-purchase conversations, answered from the MMA Primary Research Dataset.

What is the current size of the Medical Rehabilitation Robotics Market?

The global medical rehabilitation robotics market is valued at USD 2.6 billion in 2025, covering exoskeletons, upper and lower limb trainers, and balance training systems for motor function rehabilitation. Surgical robots and prosthetics are excluded.

How large will the Medical Rehabilitation Robotics Market be by 2036?

The market is forecast to reach USD 8.53 billion by 2036 in the base case, about 2.94 times the 2026 level. That represents incremental value of roughly USD 5.63 billion across the decade.

What is the CAGR for the Medical Rehabilitation Robotics Market 2026 to 2036?

The market grows at an 11.4% CAGR in the base case, with bull and bear scenarios at 12.7% and 10.1%. The spread turns mainly on reimbursement coverage expansion and clinical evidence generation.

Which segment is growing fastest?

Lower limb exoskeletons and gait training systems grow fastest at 14.0%, about 1.23 times the overall rate, pulled forward by reimbursement coverage expansion. Pediatric rehabilitation robotics follows at 13.0%.

Who are the major companies in the Medical Rehabilitation Robotics Market?

Leading companies include Hocoma, Ekso Bionics, ReWalk Robotics, Fourier Intelligence, and Bionik Laboratories. Concentration sits at a moderate 42%, led by Hocoma's clinical installed base.

Which country is growing fastest?

China grows fastest at a 13.5% CAGR, driven by aging demographics and government healthcare modernization investment across major provinces. India follows on expanding private hospital infrastructure.

Report Segmentation Architecture

The full report scope spans multiple orthogonal segmentation dimensions, with cross-tabulated demand data provided for each dimension pair. Coverage extends further to regional breakdowns, trend trajectories, and the competitive detail needed to support segment-level decision-making.

By Device Application Area

  • Lower Limb Exoskeletons and Gait Training Systems
  • Upper Limb Rehabilitation Robots
  • Hand and Fine Motor Rehabilitation Devices
  • Balance and Trunk Stability Training Systems
  • Pediatric Rehabilitation Robotics

By End-Use Industry

  • Hospitals and Acute Rehabilitation Centers
  • Outpatient Rehabilitation Clinics
  • Home Care and Tele-Rehabilitation Settings
  • Research and Academic Medical Centers

By Commercial Dimension

  • Direct Capital Equipment Purchase
  • Leasing and Subscription Models
  • Reimbursement-Linked Service Agreements
  • Group Purchasing Organization Contracts

By Region

  • North America
  • Western Europe
  • East Asia
  • South Asia and Pacific
  • Latin America
  • Middle East and Africa
  • Eastern Europe

Scope, Methodology, and Coverage

Every figure in this report is reproducible from documented input assumptions. The scope below maps the historical period, the forecast horizon, the segmentation dimensions, and the countries covered, alongside the underlying primary and qualitative methodology.
Historical Period
2020 to 2025
Forecast Period
2026 to 2036
Base Year
2025 (USD billions; MMA Primary Research Dataset, August 2026)
Market Definition
The medical rehabilitation robotics market comprises robotic and robot-assisted devices designed for physical rehabilitation of motor function following stroke, spinal cord injury, orthopedic surgery, or neurological disease, valued at manufacturer revenue for devices sold to hospitals, rehabilitation clinics, and home care settings. General mobility aids, prosthetics, and surgical robots are excluded from this scope.
Quantitative Units
USD billions (current prices); installed unit base where applicable
Segmentation Dimensions
By Device Application Area; By End-Use Industry; By Commercial Dimension; By Region
Regions Covered
North America, Western Europe, East Asia, South Asia and Pacific, Latin America, Middle East and Africa, Eastern Europe
Countries Covered
USA, Canada, Germany, UK, France, Switzerland, Japan, South Korea, China, India, Australia, Brazil, Mexico, UAE, Saudi Arabia, Turkey, South Africa, Nigeria, Poland, Czech Republic, Sweden, Netherlands, Italy, Spain, Singapore, Vietnam, Indonesia, Philippines, Argentina, Colombia, and additional markets relevant to this sector
Key Companies Profiled
Hocoma, Ekso Bionics, ReWalk Robotics, Fourier Intelligence, Bionik Laboratories, Myomo, Tyromotion, Reha Technology, AlterG, Rex Bionics, Cyberdyne, Motorika, Kinova Robotics, Restorative Therapies, Bioxtreme, Barrett Technology, MOTEK Medical, Gogoa Mobility Robots, Rehab-Robotics Company, Egzotech
Quantitative Methodology
Primary survey, n=3,800 respondents, Q4 2025, six countries; demand-side model with trade association cross-validation
Qualitative Methodology
47 expert interviews, Q4 2025; applied to validate demand model assumptions, identify emerging dynamics, and assess competitive positioning
Report Format
PDF and XLSX data workbook (Word format preview document)
Publisher
Market Minds Advisory
Report Code
MMA-2026-MED-204
Published
August 2026
Contact
sales@marketmindsadvisory.com | www.marketmindsadvisory.com

Purchase the full Medical Rehabilitation Robotics Market Report (2026 to 2036).

The full MMA Medical Rehabilitation Robotics report sizes the market across five device application areas, four end-use settings, four commercial channels, and seven regions through 2036. It profiles 20 companies on a consistent installed base unit basis, scoring each on reimbursement advocacy depth, adaptive software capability, clinical training infrastructure, and real-world evidence generation. Scenario models quantify how reimbursement expansion, staffing shortages, and aging demographic trends move both procurement volume and achievable margin by application. The report also includes payer coverage mapping and hospital network procurement benchmarking for manufacturer and investor strategy teams.
Five-application and four-channel market sizing to 2036
Twenty-company benchmark on installed base unit basis
Reimbursement advocacy and payer coverage mapping analysis
Adaptive software capability competitive benchmarking review
Clinical training infrastructure and utilization tracking
Hospital network procurement and capital planning analysis

Built For The People Who Decide

From boardroom strategy to bench-side execution, this report is read cover-to-cover by leaders shaping the next decade of their industry, turning demand scenarios, market dynamics and valuation benchmarks into decisions.
CXOs/ Presidents/ VPs/ Managers
M&A and Corporate Development
Strategy Teams and R&D Heads
Procurement and Product Directors
Regulatory and Compliance Leaders
Investor Relations and Equity Analysts