Market Minds Advisory
Medical Implants Market

Medical Implants Market: The Surgeon Chooses, The Hospital Pays, The Registry Decides

A commercial reading of implantable devices, where the operating surgeon still chooses the brand, the hospital pays the invoice, and a fifteen-year revision record decides which claim either of them believes.

Lead Analyst

Alice Ballenger

Published

September 2026

Make Smarter Decisions with Customized Research Insights

Request a free sample report and evaluate market opportunities, growth trends, and competitive dynamics relevant to your business needs.

2025 MARKET VALUE$128.4BMarket Size 2025
2036 FORECAST VALUE$248.8BBase Case , 2026 to 2036
CAGR 2026 TO 20366.2 %Bull 7.4% / Bear 5.0%
INCREMENTAL OPPORTUNITY$112.5BNet 10- year value creation
EXPANSION MULTIPLE1.82x2036 value over 2026 base
Strategic Levers
M&A Pipeline
Regional Outlook
Country Rankings
Competitive Intelligence
Segmental Deep-dive
Call-Us : 91 93563 13602

Executive Snapshot and Market Trajectory

Two people decide an implant purchase and they want different things. The surgeon chooses on feel, training, and revision data from a register; the hospital pays and sees a line item it cannot easily compare. That gap is where the margin lives. Everything else in this market follows from it.
The market stands at USD 128.4 billion in 2025 and reaches USD 248.85 billion by 2036 at a 6.2% CAGR. Neurostimulation and neurological implants grow fastest at 10.6%, about 1.71 times the overall rate, as indications widen from movement disorders into pain, epilepsy, and depression. North America holds 31% of value on procedure volume and reimbursement levels, while India posts the quickest national growth at 10.4%.
Concentration is high, with the top five holding roughly 42% of implant revenue and a long tail of specialists below them. Two forces pull against each other. Surgeon preference still drives brand selection in most categories, while hospital purchasing organisations covering about 68% of implant spend push toward standardised contracts, price bands, and a shrinking list of approved suppliers. Both sides invoke clinical evidence, and both read the same registry data differently.
Market Definition
The medical implants market covers devices surgically placed inside the body for permanent or long-term function, spanning orthopaedic and joint reconstruction implants, cardiovascular implants, spinal implants, dental implants, and neurostimulation and neurological implants. External prosthetics and orthotics, surgical instruments and capital equipment sold separately, diagnostic devices, tissue-engineered products regulated as biologics, and hospital service contracts are excluded.
Base Year Value
$128.4B in 2025 (MMA Primary Research Dataset, August 2026)
Forecast Period
2026 to 2036, eleven discrete annual values
CAGR
6.2% base case. Bull 7.4%. Bear 5.0%.
Fastest Growth Segment
Neurostimulation and Neurological Implants: 10.6% CAGR
Fastest Growth Country
India: 10.4% CAGR
Fastest Growth Region
South Asia and Pacific: 8.4% CAGR
Largest Region
North America: 31% of 2025 global value
Market Leaders
Medtronic, Stryker, Johnson & Johnson MedTech, Zimmer Biomet, Abbott. Source: MMA Analysis based on company annual reports.
Primary Survey
n=3,800 procurement and R&D decision-makers, Q4 2025, six countries
Methodology
Demand-side build-up, cross-validated against public data, 47 expert interviews

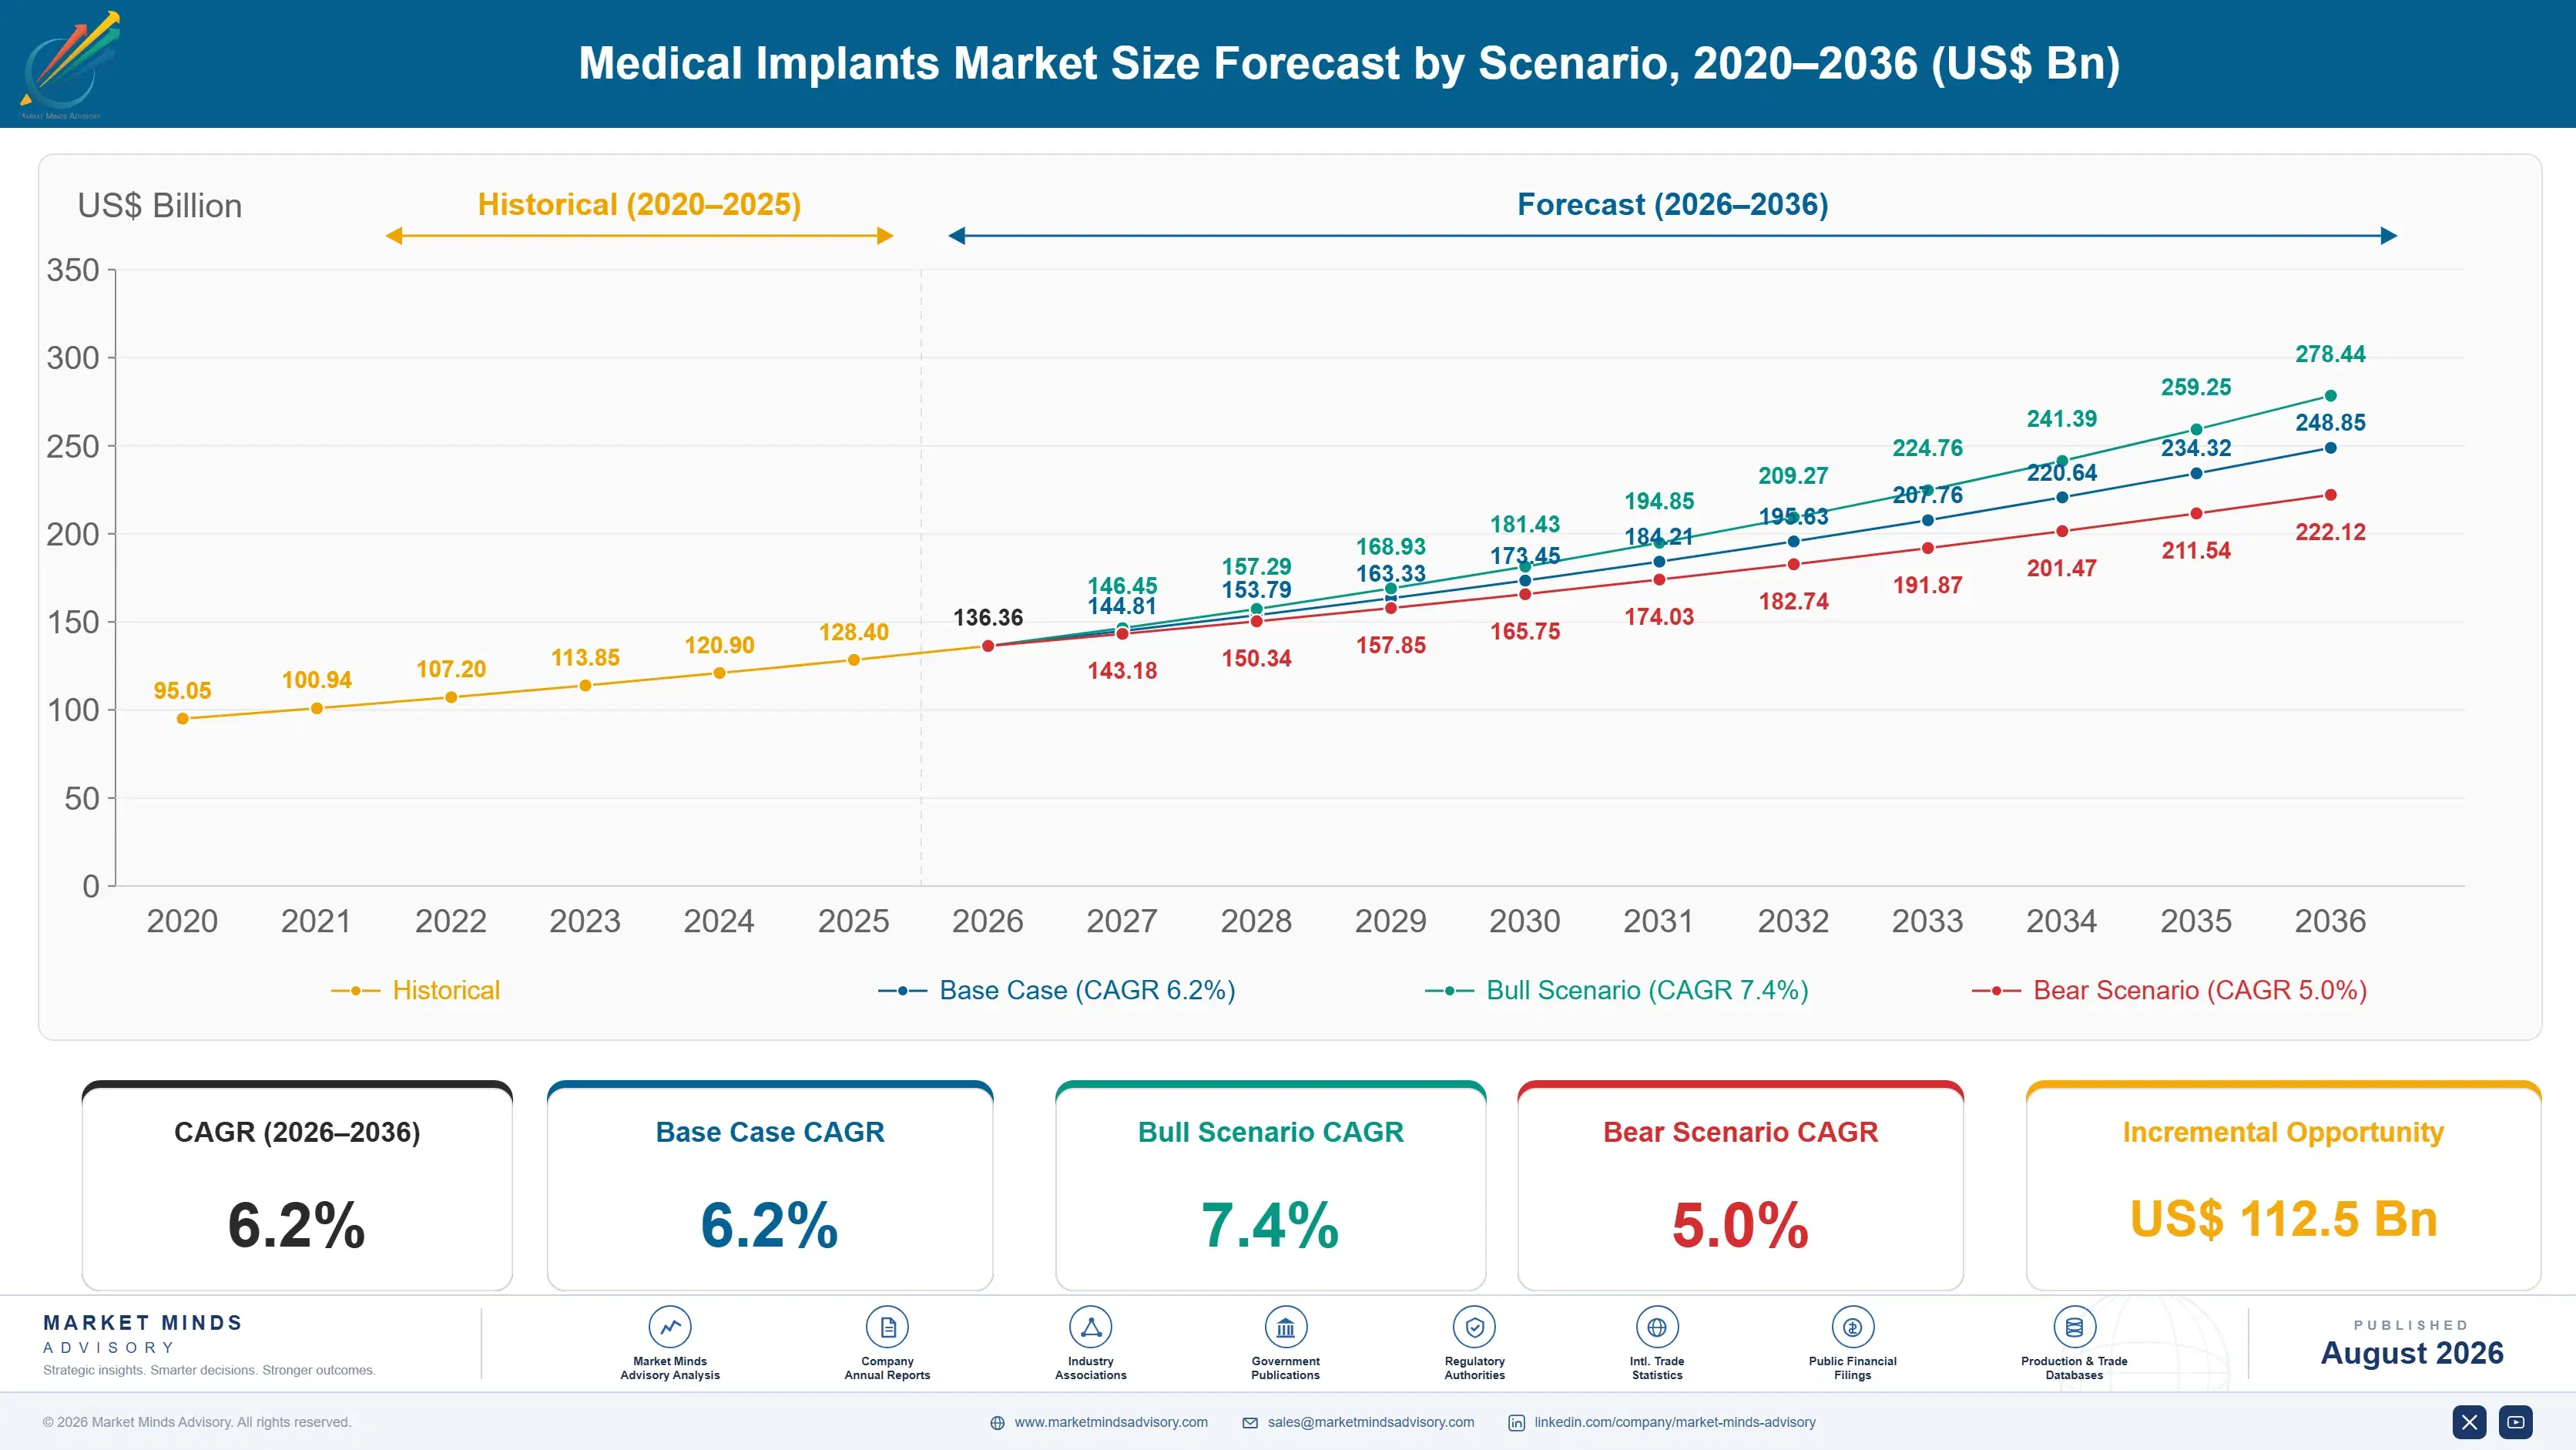
Medical Implants Market Forecast Scenarios

medical-implants-market-size-forecast-scenario-1787324625129
Growth from 2020 to 2025 compounded near 5.2%, and elective surgery cancellations rather than demand explain the shape. Joint replacement and spinal procedures were deferred heavily through 2020, then ran above trend as backlogs cleared through 2022 and 2023. Cardiovascular and neurostimulation volumes held up better because the procedures were harder to postpone. Underneath it, ageing populations kept adding procedures.
Three mechanisms carry the base case to 6.2%. First, demographic procedure volume, as joint, cardiac, and spinal caseloads rise with populations over sixty-five across developed markets. Second, indication expansion in neurostimulation, where devices approved for movement disorders are reaching pain, epilepsy, and treatment-resistant depression. Third, dental implant penetration, which continues converting bridge and denture patients into implant patients across middle-income markets. All three run on caseload rather than price, which is why volume matters more than pricing.
The bull case at 7.4% assumes neurostimulation indication approvals arrive faster than expected and outpatient joint replacement expands the addressable caseload considerably. The bear case at 5.0% assumes hospital purchasing organisations force implant price bands down across orthopaedics, reimbursement bundling shifts revision cost onto providers, and elective procedure funding tightens in European systems already running long waiting lists.

Two Buyers, One Invoice, Fifteen Years Of Evidence

Demand rests on three foundations. Procedure volume provides the growth, since implant sales track caseload almost exactly and caseload tracks population age. Surgeon preference provides the pricing, because a surgeon trained on one system will defend it against a cheaper equivalent with clinical arguments the hospital cannot easily rebut. And purchasing organisations provide the counterweight, covering roughly 68% of implant spend and pushing toward price bands and shorter approved supplier lis
MARKET CONCENTRATIONCR5: 42%Consolidated at the top across most implant categories
TEN-YEAR REVISION RATEAbout 6%Share of joint implants requiring surgical revision eventually
PURCHASING CONTRACT COVERAGEAbout 68%Implant spend routed through group purchasing agreements today
SURGEON PREFERENCE WEIGHTAbout 55%Selection influence held by the operating surgeon personally
APPROVAL TIMELINE3 to 7 yearsClinical and regulatory work behind a novel implant
IMPLANT SERVICE LIFE15 to 25 yearsExpected functional life before a revision becomes likely
Commercially, the striking feature is how long the evidence horizon runs. A novel implant takes three to seven years through clinical and regulatory work before first sale, and its commercial reputation then rests on registry data accumulating over fifteen to twenty-five years of service life. Revision rates near 6% at ten years decide which products surgeons will still recommend a decade later.
The decade ahead turns on where the procedure happens and who signs for it. Outpatient migration in joint replacement changes the buyer from a hospital committee to an ambulatory centre watching every dollar of implant cost. Bundled payment shifts revision liability onto the provider, which makes long-term registry performance a financial argument rather than a clinical one. Both favour suppliers with published outcome data.
"Every implant company says it sells clinical outcomes. What most of them actually sell is a surgeon's muscle memory, and the ones who understand that spend their money on training programmes rather than on comparative brochures nobody in theatre reads."
Director, Medical Devices and Implantables Practice · MMA Medical Devices / Impl

Market Trends

Neurostimulation Indications Widen Beyond Movement Disorders

Neurostimulation grows at 10.6% against a market at 6.2%, and indication expansion rather than device improvement drives most of it. Deep brain stimulation approved for Parkinson's disease and essential tremor is reaching epilepsy, obsessive-compulsive disorder, and treatment-resistant depression, while spinal cord stimulation has moved from last-resort pain management into earlier treatment pathways. Each new indication requires its own clinical evidence and its own reimbursement decision, which is why approvals arrive slowly. Closed-loop devices that sense and respond rather than stimulate on a fixed schedule are the current technical frontier. Evidence, not engineering, sets the pace here.
Market Impact: Rates rise sharply after 65
Joint Replacement Moves Into Ambulatory Surgery Centres

Hip and knee replacement has shifted steadily out of inpatient hospitals into ambulatory surgery centres, driven by reimbursement decisions that removed these procedures from inpatient-only lists and by anaesthesia and recovery protocols that make same-day discharge routine. The commercial consequence is a different buyer. An ambulatory centre has no purchasing committee, thinner working capital, and a direct interest in implant cost per case, so it negotiates harder and stocks fewer options than a hospital does. Suppliers built around hospital contracting are finding that reach considerably more difficult. About half of primary knee cases now qualify.
Market Impact: Dental implants grow at 7.4%

Market Opportunities and Growth Drivers

Ageing Populations Add Procedures Every Single Year

Joint replacement, cardiac valve, pacemaker, and spinal procedure rates all rise sharply with age, and the population over sixty-five is growing in every developed market and most middle-income ones. This is the most predictable volume in medical devices because it does not depend on policy, consumer sentiment, or clinical fashion. Primary hip and knee caseloads in the United States and Western Europe have compounded steadily for two decades on this basis alone. Revision procedures add a second wave, since implants placed fifteen years ago are now reaching the end of service life.
Market Impact: Contracts cover 68% of spend

Dental Implants Displace Bridges And Dentures

Dental implants grow at 7.4% as patients who would previously have accepted a bridge or a denture choose a fixed titanium fixture instead. Cost is the gate rather than clinical preference, since implants are rarely reimbursed and patients pay directly, which makes penetration track disposable income closely. Middle-income markets are converting fastest for exactly that reason. Digital workflows using intraoral scanning and guided surgery have cut chair time and widened the pool of general dentists placing implants rather than referring them onward. Premium and value brands now sit in the same practice.
Market Impact: Dossiers cost 4 times more

Market Restraints and Challenges

Purchasing Organisations Compress Orthopaedic Implant Pricing

Group purchasing organisations and integrated hospital networks now cover roughly 68% of implant spend, and they contract on price bands across a whole category rather than on individual surgeon preference. The root cause is that orthopaedic implants reached clinical parity years ago, so a purchasing committee sees several equivalent options and treats the difference as commercial. Commercially this has compressed pricing across hips, knees, and standard spinal hardware. Suppliers mitigate through outcome data that justifies premium bands, service bundling around instrumentation and logistics, and moving mix toward categories where parity does not yet hold.
Market Impact: Indications now span 6 conditions

European Device Regulation Raised Certification Cost Sharply

The European Medical Device Regulation reclassified implantable devices into higher risk categories requiring notified body assessment and clinical evidence far beyond what the previous directive accepted. The root cause is a deliberate tightening after implant failures, combined with notified body capacity that has never matched submission volume. Commercially this has cost manufacturers heavily and pushed several to withdraw low-volume implants and sizes rather than fund the dossiers, which narrows surgical choice. Participants mitigate through phased transition provisions, portfolio rationalisation by revenue, and pooling clinical evidence across product families where the regulation permits it.
Market Impact: About 50% of knees qualify
4 additional market trends, 3 additional growth drivers, and 2 additional restraints and challenges are covered in the full report. Contact sales@marketmindsadvisory.com to access the complete intelligence.

Segment CAGR and Growth Architecture

Segmentation follows implant category, a single classification describing the anatomical system the device is placed into. Each category carries its own surgical specialty, regulatory class, evidence base, and purchasing route, so commercial position tracks the category rather than the material used. End-use setting and purchasing channel appear separately within the framework as their own distinct dimensions.
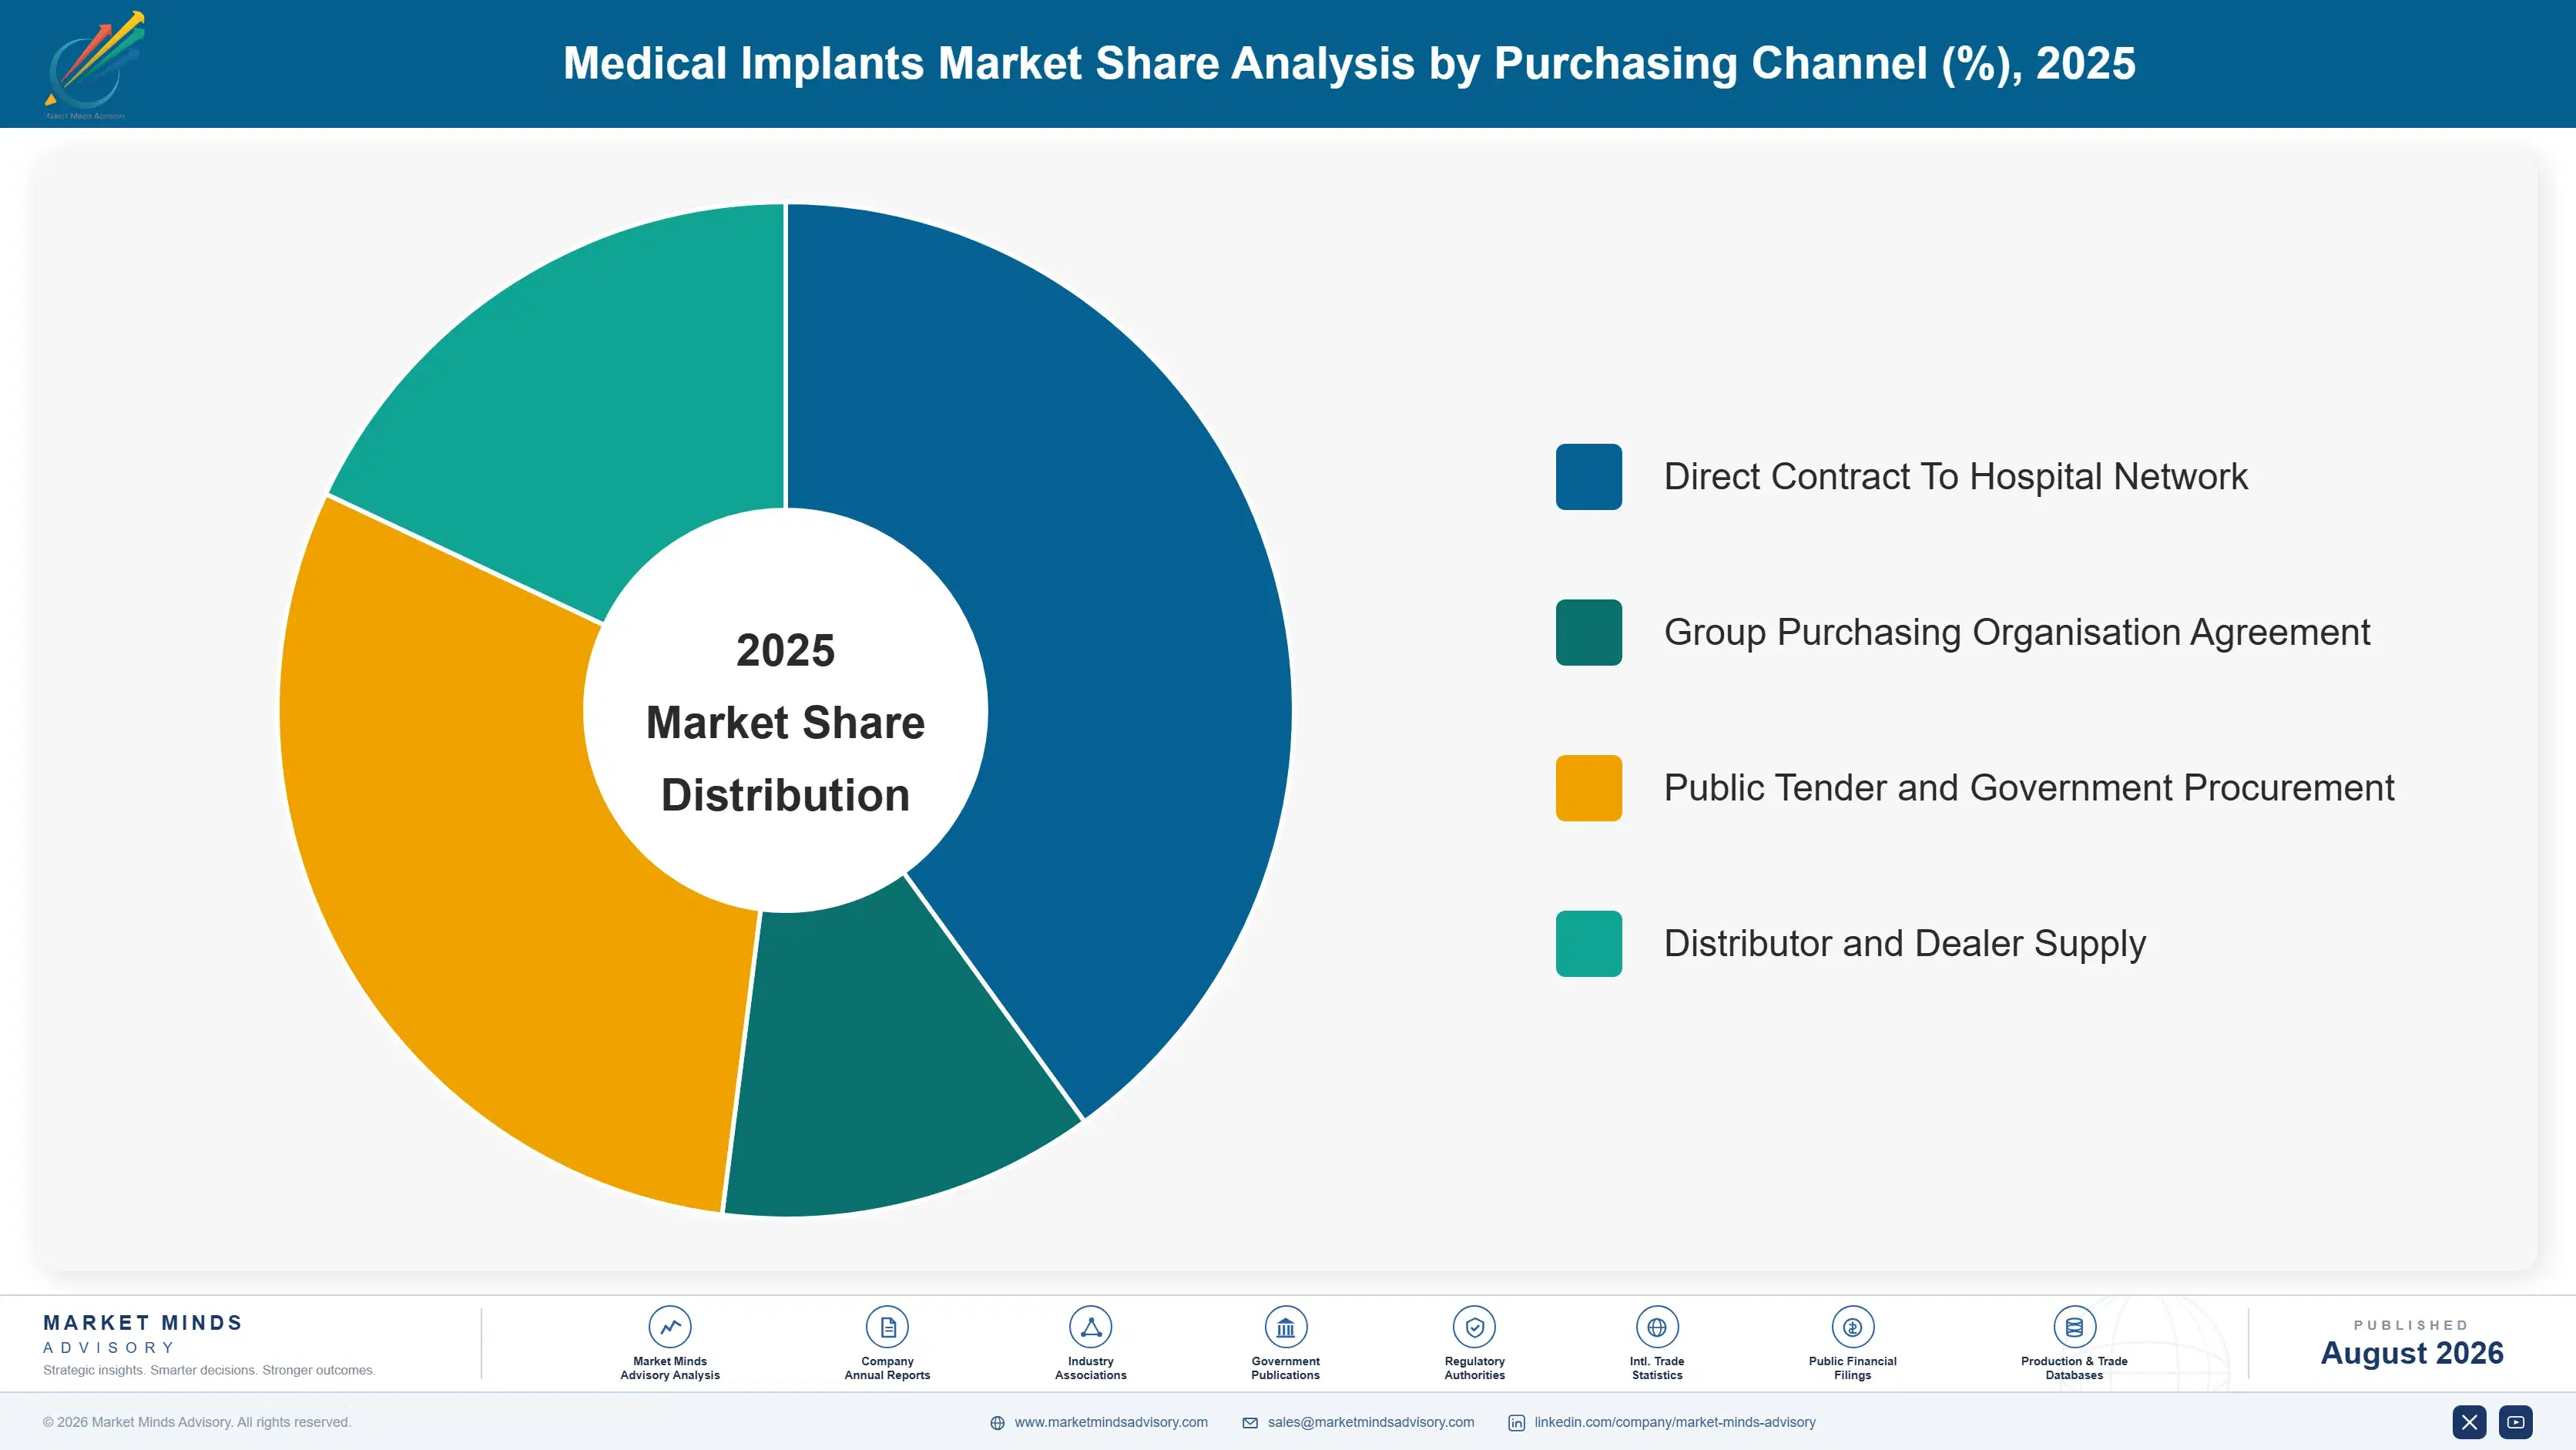
medical-implants-market-market-share-analysis-1787324625715

Neurostimulation and Neurological Implants

Neurostimulation and neurological implants grow fastest at 10.6%, about 1.71 times the overall 6.2% rate, and indication expansion rather than device engineering explains it. Deep brain stimulation, spinal cord stimulation, vagus nerve stimulation, and sacral neuromodulation all started in narrow populations and have been reaching wider ones as clinical evidence accumulates. Each expansion needs its own trial and its own reimbursement decision, which slows the pace but also protects the position once won. Device pricing here is the highest in implantables and holds up better than orthopaedics because clinical parity has not arrived. Closed-loop sensing systems are the current development front, and evidence generation is the binding limit. Capacity is not the constraint here.
CAGR 10.6%

Dental Implants

Dental implants grow at 7.4%, the second-fastest category, and they behave less like a medical device market than any other segment here. Patients pay directly in most systems because reimbursement is limited or absent, which makes volume track disposable income rather than clinical need or health budgets. Middle-income markets are therefore converting fastest, and value brands from Korea and Israel have taken meaningful share from European premium suppliers on that basis. Digital workflows using intraoral scanning and guided surgery have cut chair time and let general dentists place implants they would once have referred. Chains buying centrally are changing that in several markets. Reimbursement remains limited almost everywhere outside a handful of systems.
CAGR 7.4%
Full segment breakdown across 5 segments available in the complete report.

Regional Architecture and Country Demand Map

Procedure access and reimbursement together set this distribution far more than population does. North America leads on caseload per capita and implant pricing, while South Asia and Pacific grows quickest as surgical capacity and insurance coverage expand from a low base. Concentration follows payment, not headcount.

North America

North America holds 31% of value, and implant pricing rather than caseload explains how far its share exceeds its share of procedures. Per-implant payment sits well above other regions, supported by a reimbursement structure that pays separately for the device in many settings. Group purchasing organisations and integrated networks contract across hundreds of sites and push hard on price bands, which is the main countervailing force. Outpatient migration in joint replacement has moved faster here than anywhere, shifting purchasing toward ambulatory centres with no committee and thinner capital. Growth of 5.6% reflects strong procedure volume against persistent contracting pressure on orthopaedic pricing. Revision caseloads are also building quickly from implants placed fifteen years ago.
Share: 31% | CAGR: 5.6% (2026 to 2036)

Western Europe

Regulation and waiting lists together define this market. Western Europe holds 24% of value while operating the strictest implant certification regime of any region, with the Medical Device Regulation pushing several manufacturers to withdraw low-volume implants and sizes rather than fund new clinical dossiers. National tendering in Nordic and Iberian systems weights price heavily, while German and French purchasing retains more surgeon influence. Elective surgery waiting lists across the United Kingdom, Italy, and Spain constrain caseload independently of demand or funding. National joint registries here produce the outcome data that suppliers use commercially worldwide. Growth of 4.8% is the slowest of the seven regions. Certification cost falls hardest on smaller specialists.
Share: 24% | CAGR: 4.8% (2026 to 2036)
Regional intelligence for 5 additional markets available in the complete report: East Asia, South Asia and Pacific, Latin America, Middle East and Africa, Eastern Europe. Contact sales@marketmindsadvisory.com.
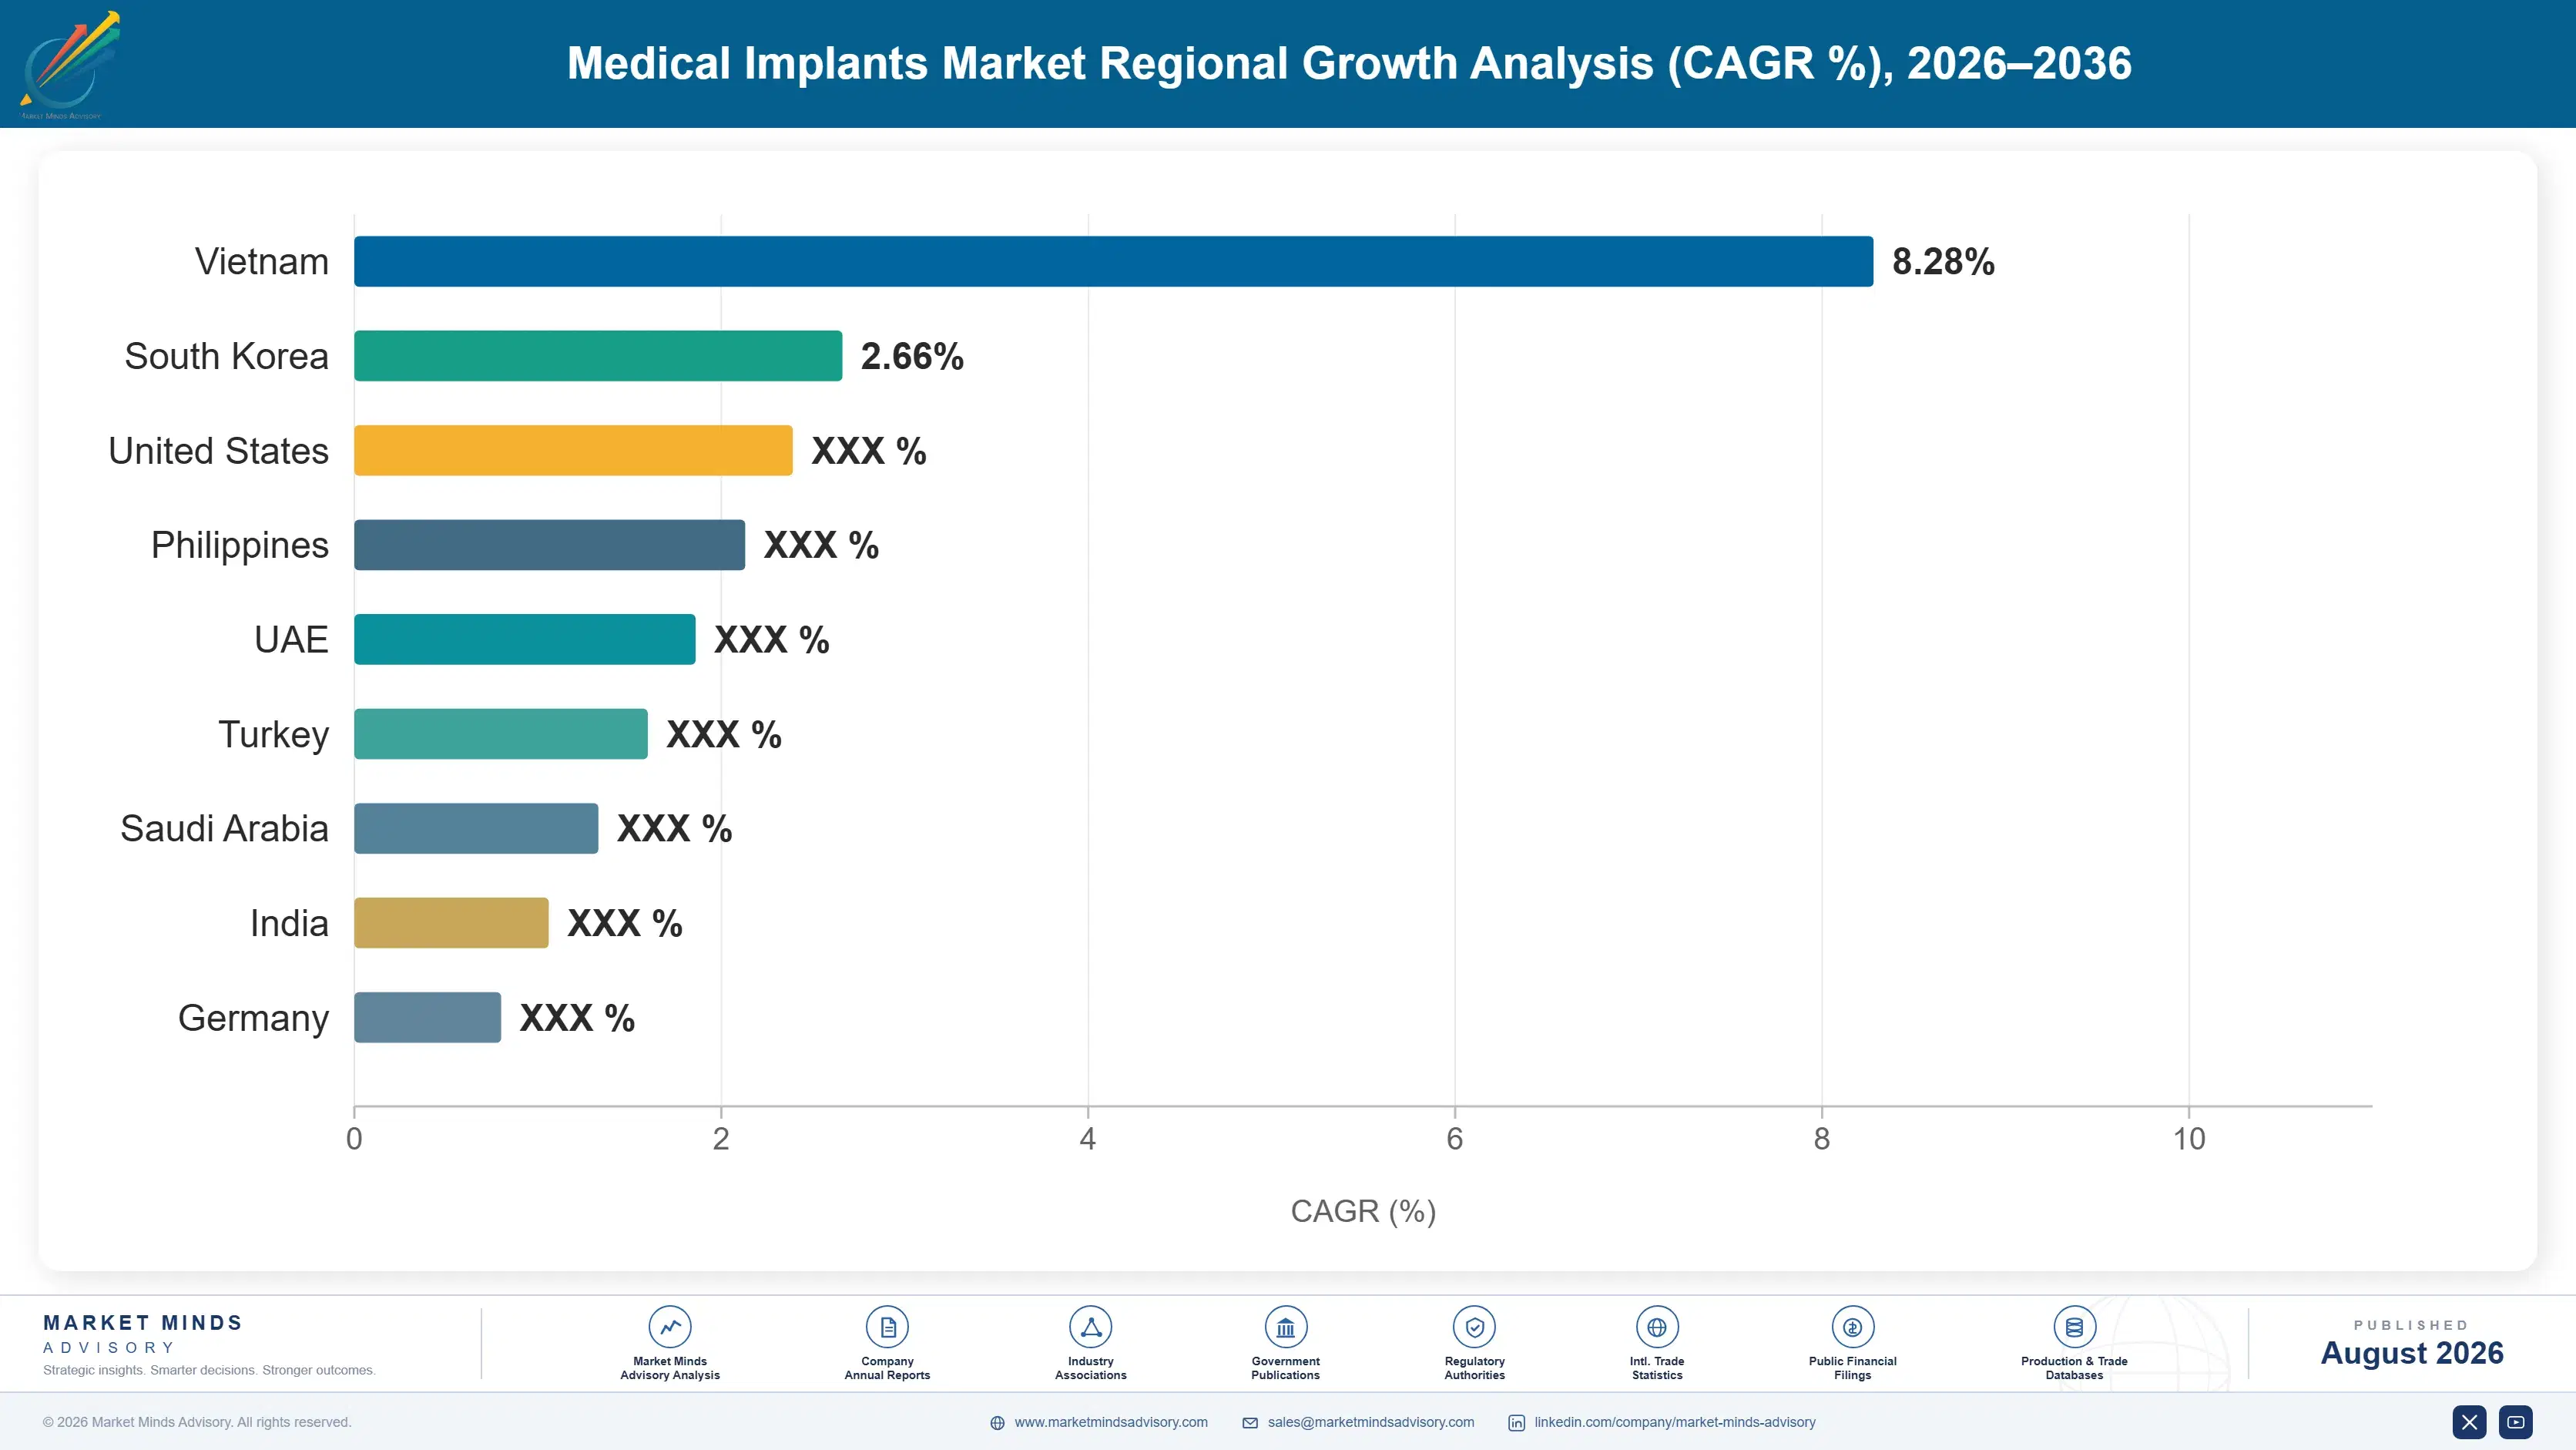
medical-implants-market-country-cagr-analysis-1787324626226

Where Implant Margin Is Actually Defended

Selling a hip on specification against three clinically equivalent alternatives is how orthopaedic pricing collapsed. The four moves below concentrate on ground a purchasing committee cannot commoditise: surgeon training, registry evidence that justifies a premium band, the ambulatory channel, and instrument logistics that a price comparison never captures. None of the four responds to a discount.

Train The Surgeon Before The Contract Opens

Surgeon preference still carries roughly 55% of the selection decision in most implant categories, and preference is built during residency and fellowship training on a specific instrument set. A surgeon who learned a system defends it against a cheaper equivalent with clinical arguments a purchasing committee struggles to rebut. Training programmes, cadaver labs, and fellowship sponsorship therefore reach the decision years before any tender is issued. Suppliers treating this as marketing spend rather than as commercial investment consistently lose accounts they were technically well placed to hold. The spend lands a decade before the revenue does.
Market Impact: Surgeon preference carries about 55

Publish Registry Outcomes To Hold Premium Bands

National joint registries in Australia, the United Kingdom, and the Nordic countries publish revision rates by brand, and a product showing revision near 3% at ten years against a category average nearer 6% has an argument no discount can answer. That argument works on the hospital finance side as well as the clinical side, particularly where bundled payment makes the provider carry revision cost. Suppliers without published comparative data are left arguing on specification. Building the evidence requires committing to registries early and accepting that the data may not favour you.
Market Impact: Revision near 3% against a 6% categ

Build The Ambulatory Channel Before Volume Shifts

About 50% of primary knee cases now qualify for outpatient treatment, and ambulatory surgery centres buy quite differently from hospitals. There is no purchasing committee, working capital is thinner, consignment inventory is unwelcome, and implant cost per case is watched directly by people who own the business. Suppliers built around hospital contracting are finding that channel genuinely hard to reach. Simplified instrument trays, lower sterilisation burden, and commercial terms suited to a small business win here, and the centres being opened now will still be buying in a decade. Winning 20 centres now beats winning one hospital later.
Market Impact: About 50% of knee cases qualify for

Charge For Instrument Logistics Instead Of Absorbing It

An orthopaedic implant arrives with instrument trays that must be delivered, sterilised, tracked, and returned, and most suppliers absorb that cost entirely inside the implant price. A single knee system can require 12 to 20 trays per case, which is real logistics expense that a price-per-implant comparison never shows. Unbundling it, or reducing tray count through single-use and simplified instrumentation, converts hidden cost into either margin or a genuine competitive difference. Ambulatory centres in particular value fewer trays because sterilisation capacity, not implant price, is often their real constraint. Tray reduction of 30% changes the conversation immediately.
Market Impact: A knee system needs 12 to 20 trays

Who Controls the Margin Pool

Concentration is high: the top five hold roughly 42% of implant revenue, with a long tail of specialists beneath them. The gap between leaders and challengers is surgeon relationship depth and registry evidence rather than manufacturing quality, which is comparable across established suppliers. All participants here are assessed on one basis, revenue from implantable device sales, excluding capital equipment, surgical instruments sold separately, external prosthetics, and hospital service contra
Competition runs along four dimensions. First, surgeon training reach, since preference formed in fellowship carries most of the selection decision. Second, registry outcome data, which is the only argument that survives a purchasing committee intact. Third, category breadth, because networks increasingly contract across whole portfolios rather than single products. Fourth, instrument logistics and consignment terms, which decide whether an ambulatory centre can stock you at all.

Pressure is building from two directions. Chinese volume-based procurement has cut implant prices steeply and moved share toward domestic manufacturers, and comparable price interventions have followed in India. Outpatient migration is opening a channel where hospital contracting strength counts for little. Rankings should favour suppliers holding published registry evidence and credible ambulatory positions over those defending inpatient orthopaedic contracts on relationship alone.
medical-implants-market-company-positioning-matrix-1787324626745

Competitive Moat and Risk Dimensions

MEDTRONIC

Moat: Neurostimulation breadth and clinical depth

Medtronic holds leading positions across cardiac rhythm, neuromodulation, and spinal implants, with the deepest clinical evidence base in neurostimulation where indication expansion is driving the fastest growth in implantables. Its surgeon training infrastructure reaches specialists across several disciplines simultaneously. Scale across categories also matters as hospital networks contract on whole portfolios rather than single products.
MEDTRONIC

Risk: Procurement reform and portfolio breadth

Chinese volume-based procurement has cut pricing steeply across several categories where the company competes, and domestic manufacturers now hold cost positions it cannot match. Breadth across many device families dilutes focus against specialists competing in single categories. Cardiac rhythm management also faces slower growth than the neurostimulation lines carrying the story.
STRYKER

Moat: Surgeon relationships and robotic pull-through

Stryker has built unusually deep orthopaedic surgeon relationships through training investment and a robotic platform that pulls implant selection with it, since a centre committed to the robot buys the implants designed around it. Its trauma and extremities breadth reaches specialists that competitors serve thinly. Commercial execution in ambulatory surgery centres has also been quicker than most.
STRYKER

Risk: Orthopaedic pricing and capital exposure

Revenue is weighted toward hips, knees, and spinal hardware where clinical parity arrived years ago and purchasing organisations contract on price bands. The robotic platform strength depends on continued capital spending by hospitals and centres that tightens quickly when budgets do. Chinese procurement reform also removes pricing that the orthopaedic base previously relied on.

Players Tracked

Prominent Players

Medtronic
Stryker
Johnson & Johnson MedTech
Zimmer Biomet
Abbott

Other Key Players

Boston Scientific
B. Braun
Smith+Nephew
Straumann
Dentsply Sirona
Envista
Edwards Lifesciences
LivaNova
Globus Medical
Integra LifeSciences
Enovis
Terumo
Nipro
Osstem Implant
MicroPort Scientific

Recent Developments

FEBRUARY 2025

European Medical Device Regulation transition deadlines advance again

Further transition provisions under the device regulation took effect for higher risk classes, with notified body capacity still well short of submission volume across implantable categories. This was European regulation reaching its next phase rather than a commercial transaction, and it kept certification cost central to portfolio decisions.
Signal: Implants withdrawn on European economics q
OCTOBER 2024

Chinese volume-based procurement extends to further implant categories

Centralised tendering in China widened to additional orthopaedic and cardiovascular implant groups, cutting prices materially and shifting listed share toward domestic manufacturers able to supply at those levels. This was government procurement reform rather than a corporate event, and multinational suppliers rebuilt local cost structures to remain listed.
Signal: Procurement reform converts a clinically d
JUNE 2024

Outpatient joint replacement coverage widens across payer schedules

Additional joint replacement procedures were confirmed as payable in ambulatory settings across several payer schedules, accelerating a shift that anaesthesia and recovery protocols had already made clinically routine. These were reimbursement decisions rather than transactions, and they moved purchasing toward centres that contract quite differently from hospitals.
Signal: Each coverage decision opens a channel whe

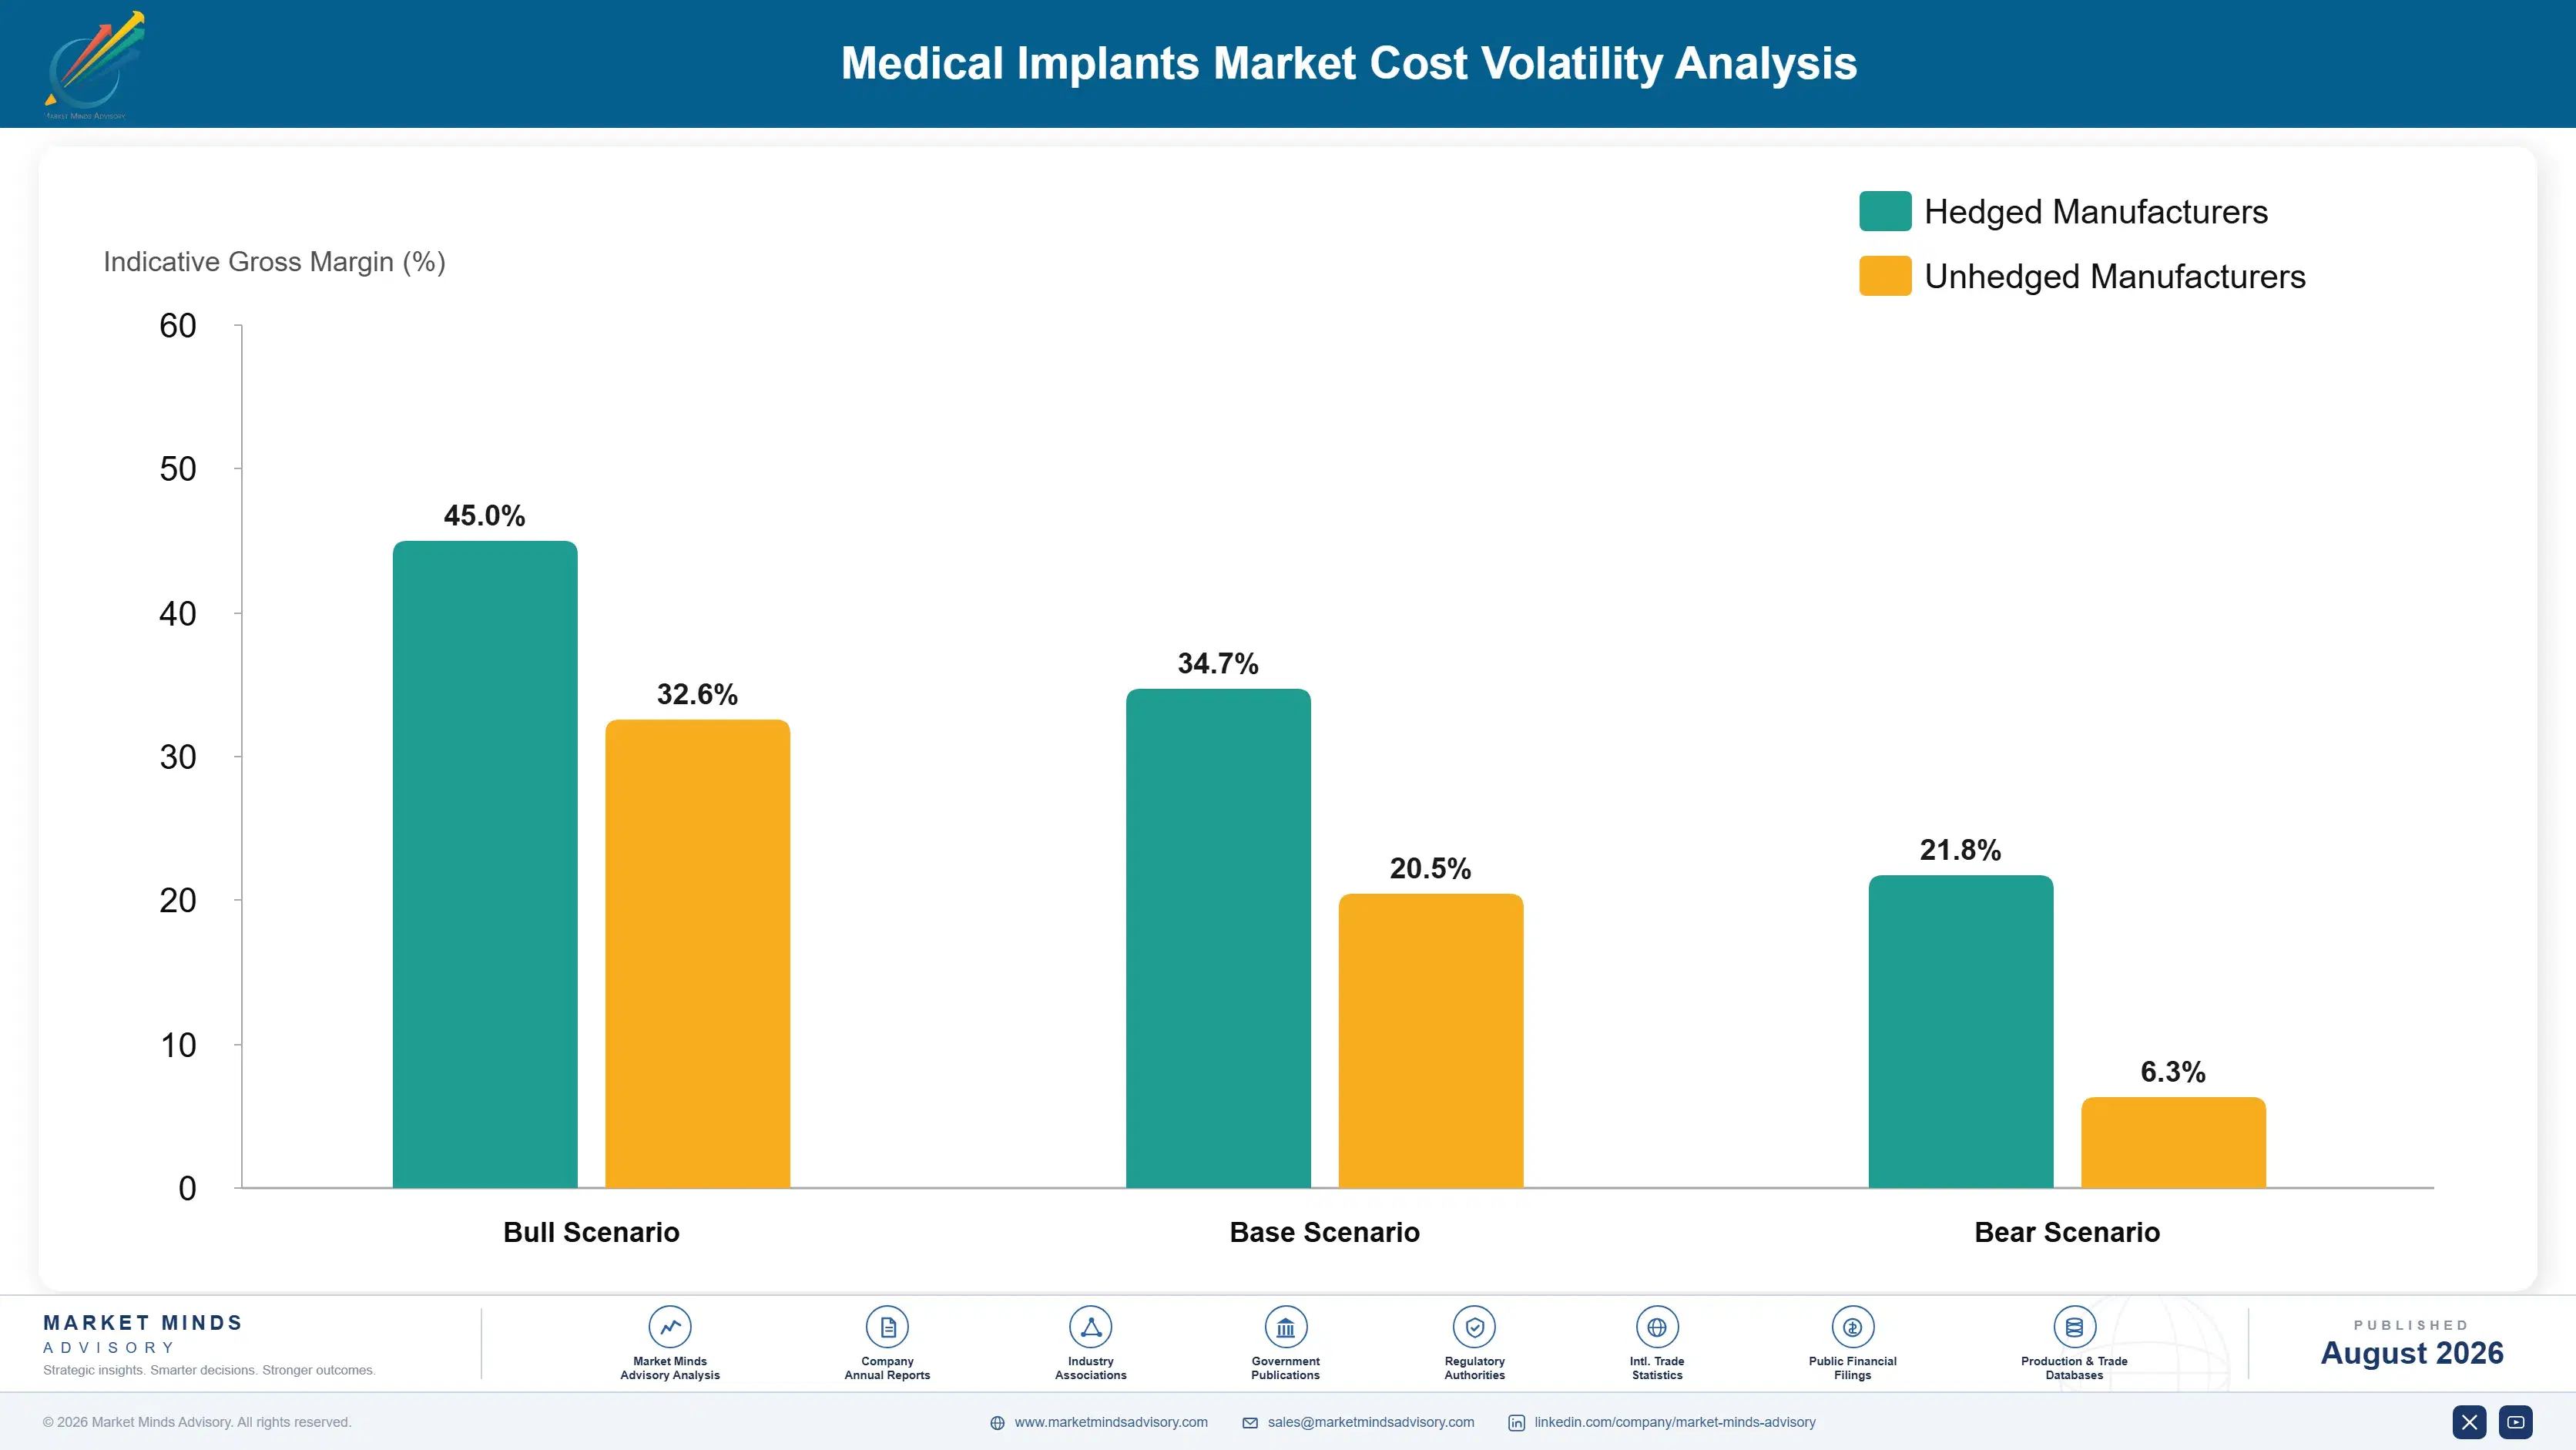
Titanium, Cobalt-Chrome, Polyethylene, Instrument Logistics

Materials are a smaller share of implant cost than most expect. Medical-grade titanium, cobalt-chrome, and stainless steel together run 14% to 22% of cost, sourced from a narrow set of qualified mills mostly in the United States, Germany, and Japan. Machining and finishing add 20% to 28%, sterilisation and packaging 8% to 12%, and instrument logistics a further 10% to 16%.
Ethylene oxide sterilisation capacity became the binding constraint in 2019 and 2020 when regulatory action closed several American facilities, and implant suppliers had to requalify sterilisation at alternative sites, a process measured in months per family. Stryker and Zimmer Biomet both disclosed sterilisation and supply chain cost pressure across subsequent reporting. Energy costs then rose sharply through 2022, with IEA analysis recording European industrial gas at several times prior-year levels, which hit machining and sterilisation operations directly.

Exposure separates by manufacturing integration and scale, not by size of catalogue. A supplier machining in-house across high volumes absorbs a titanium move inside yield and utilisation gains, while one buying finished components from contract manufacturers carries the full pass-through with no offset. Geography compounds it, since European machining and sterilisation carry energy costs that American and Asian production does not.
medical-implants-market-cost-volatility-analysis-1787324626940

Qualify a second mill for every implant alloy

Medical-grade alloys come from a narrow set of qualified mills, and requalifying an alternative requires material testing and often regulatory notification. A single-sourced alloy is therefore an unmanaged risk rather than a purchasing choice. Qualifying a second mill costs testing time once and provides continuity permanently, and regulators increasingly expect documented supply continuity planning in technical files anyway.

Reduce instrument tray count per procedure

A single knee system can require 12 to 20 trays per case, each of which must be delivered, sterilised, tracked, and returned at the supplier's expense. Cutting tray count through single-use instruments and simplified sets removes logistics cost directly and makes the system far easier for an ambulatory centre with limited sterilisation capacity to accept.

Dual-source sterilisation capacity across separate facilities

Ethylene oxide capacity closures showed how quickly a single validated sterilisation site can halt supply of an entire product family. Validating a second facility takes months per family and costs real money, but it converts a shutdown from a stockout into a routing decision. Hospital networks and regulators now ask about this directly during qualification.

Portfolio Architecture for Margin Defence

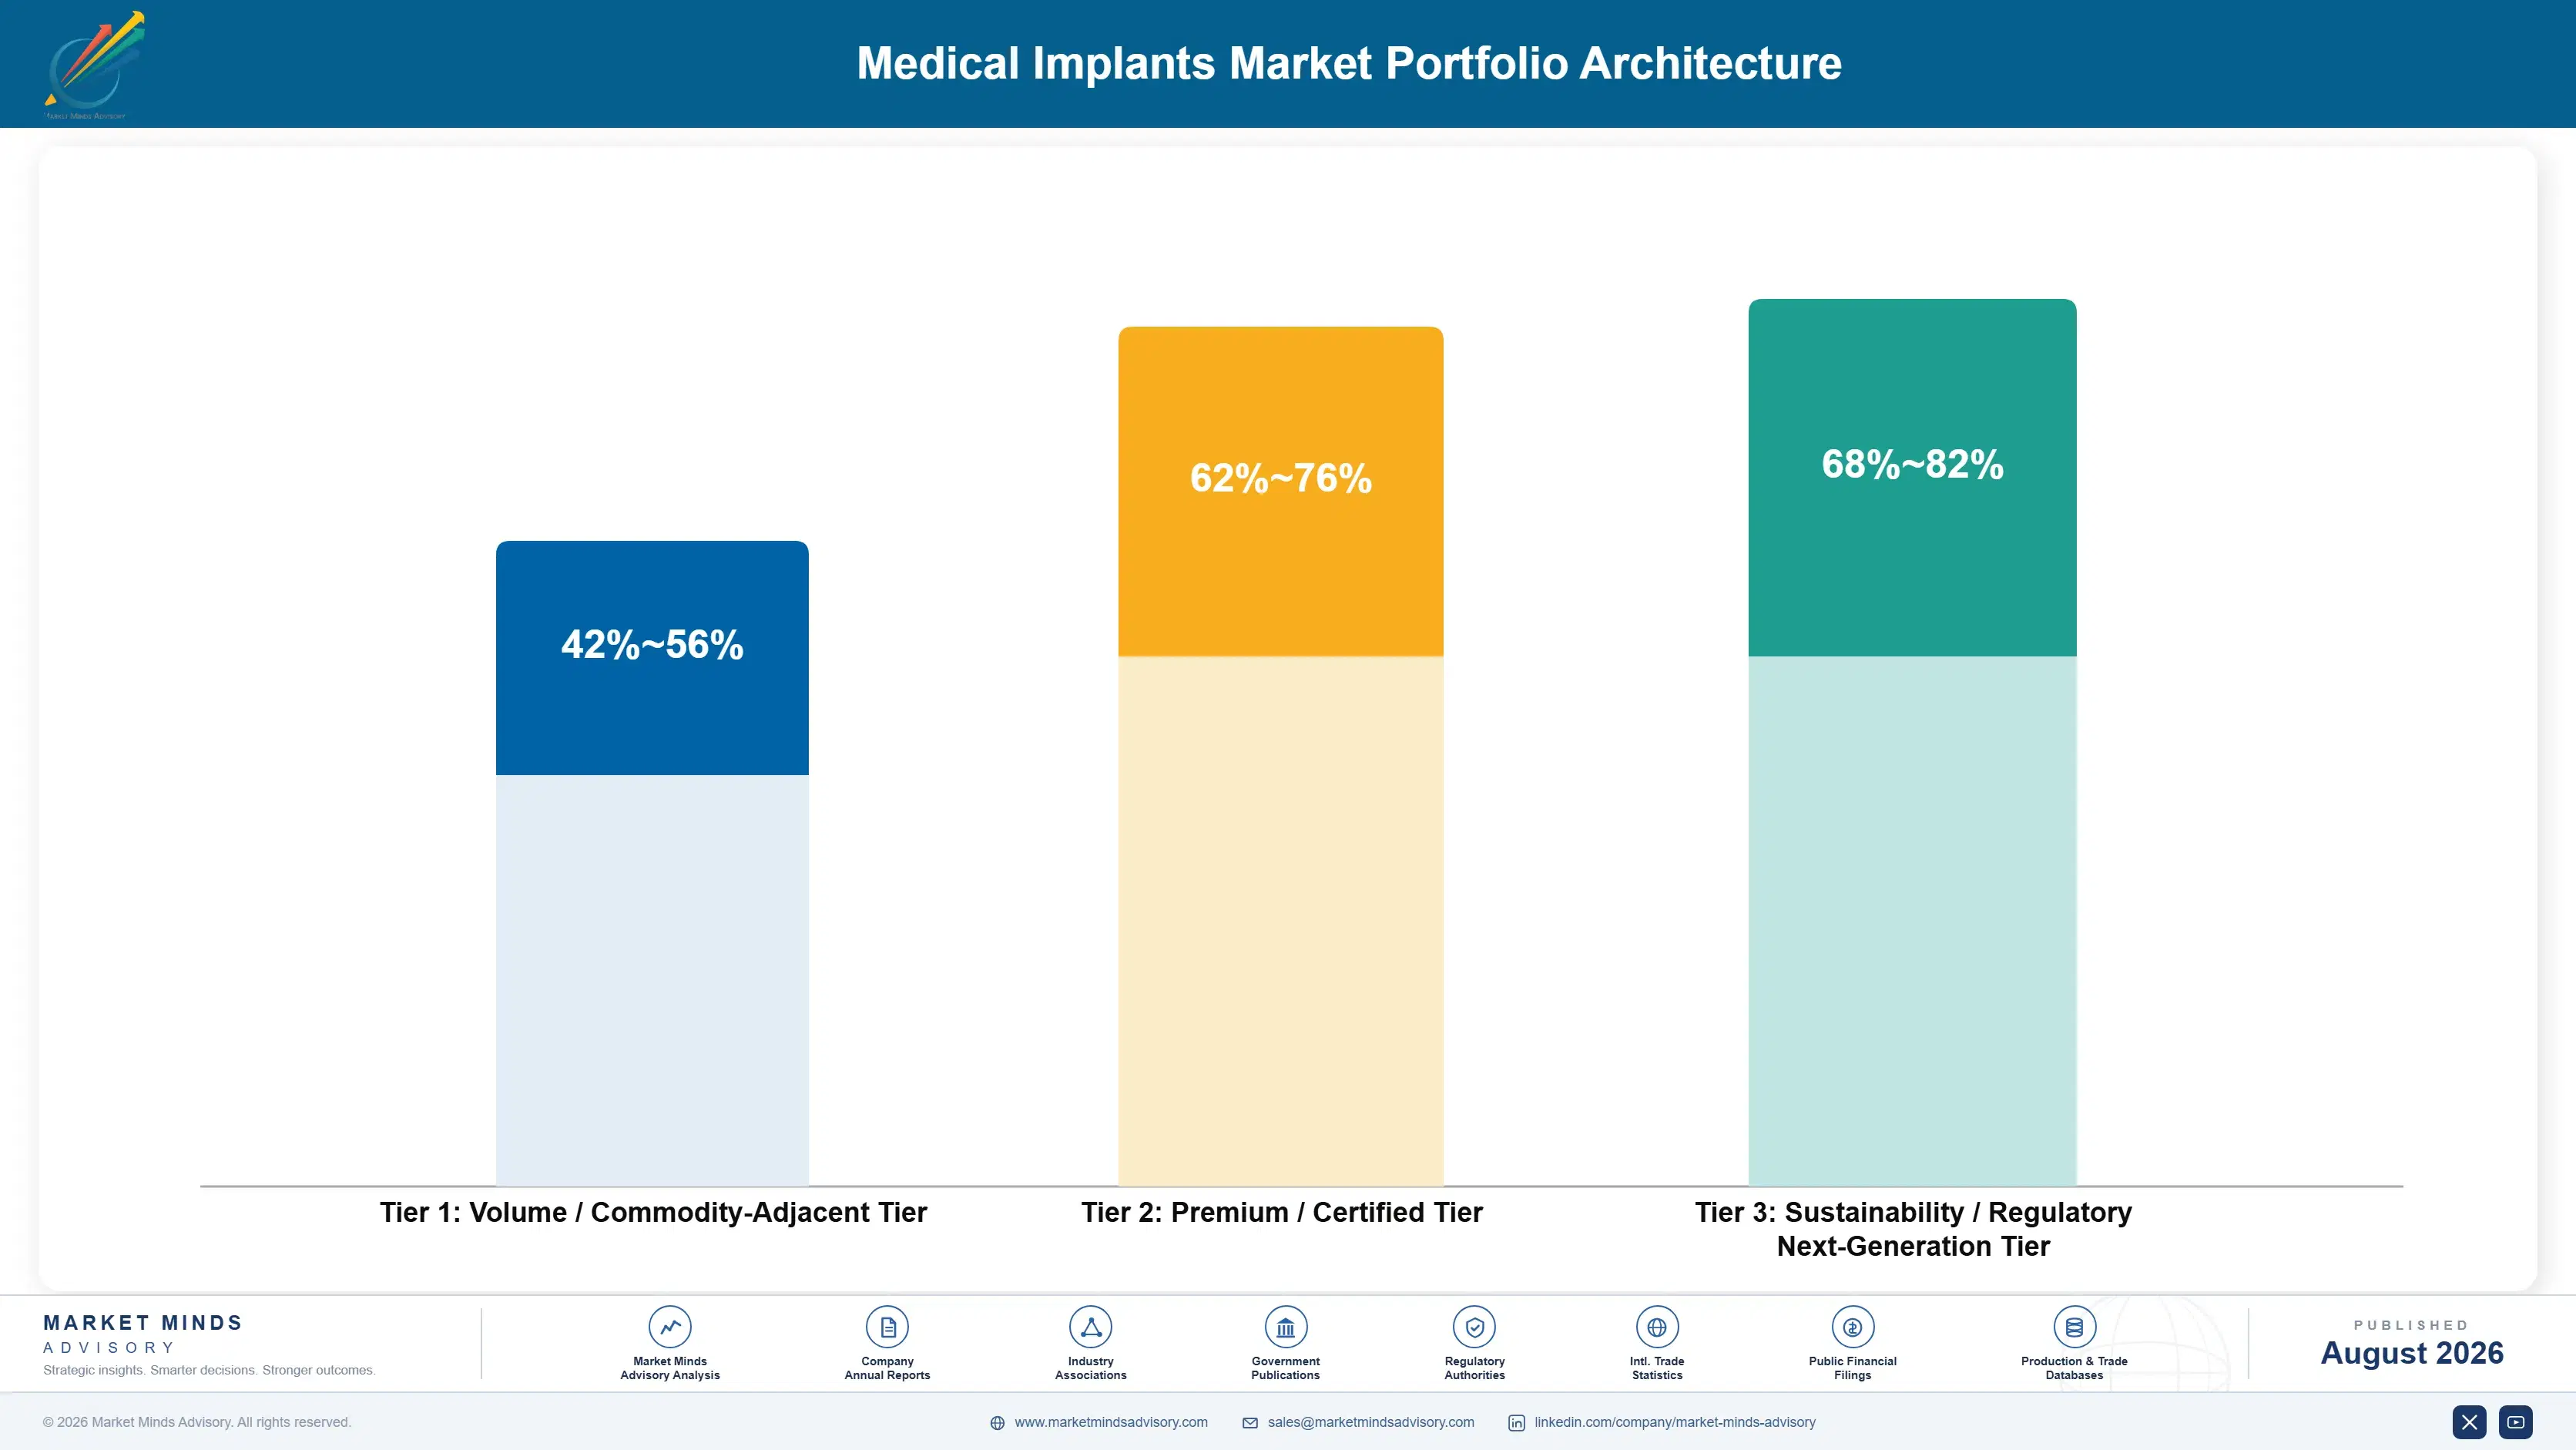
The portfolio splits into three tiers with different economics. Standard hips, knees, trauma plates, and basic spinal hardware form the volume tier, where clinical parity arrived years ago and purchasing organisations contract on price bands. Premium implants carrying registry evidence, specialist geometries, and approved indications earn more because the field narrows. Neurostimulation systems and sensing-enabled devices price against clinical outcome rather than a competing implant.
The tension runs between volume implants that hold the account and premium categories that earn the return. Standard hips and knees keep the surgeon relationship active and secure the network contract through which everything else sells. Yet they compete against three clinically equivalent alternatives under price bands that tighten at every renewal. Suppliers handling this well accept band pricing on volume while directing development toward neurostimulation and evidence-backed lines.

High-value pools concentrate where evidence or approval limits competition: neurostimulation systems with indication-specific approvals, implants showing registry revision rates well below category average, robotic-linked implant systems, and specialist geometries no competitor offers. All four escape the price band comparison. Standard trauma plates and basic spinal hardware sit at the other end, where several suppliers offer equivalent devices and the contract sets the ceiling.

Volume / Commodity-Adjacent Tier

Standard hips, knees, trauma plates, and basic spinal hardware sold under negotiated price bands. The range is wide because manufacturing integration and volume separate suppliers considerably at identical contracted selling prices.
Gross Margin: 42-56%

Premium / Certified Tier

Implants carrying registry outcome evidence, specialist geometries, revision systems, and approved indications that narrow the competitive field. The range is wide because registry standing varies by product and by national register, and pricing follows it.
Gross Margin: 62-76%

Sustainability / Regulatory / Next-Generation Tier

Neurostimulation systems, closed-loop sensing devices, robotic-linked implants, and newly approved indications. The range is wide because reimbursement for novel indications differs sharply by health system and several carry unrecovered development cost.
Gross Margin: 68-82%
medical-implants-market-portfolio-architecture-1787324627441

High-value Sub-segments and Strategic Watch-out

Neurostimulation and Neurological Implants

High value and high growth at 10.6%, the fastest category, driven by indication expansion rather than device engineering. Each new indication needs its own trial and reimbursement decision, which slows the pace and also protects the position once it is won. Pricing holds better than orthopaedics.
Gross Margin: 68-82%

Dental Implants

High value with strong growth at 7.4%, converting bridge and denture patients into implant patients. Patients pay directly in most systems, so volume tracks disposable income rather than clinical need, and value brands from Korea have taken real share on that basis. Practice-level selling decides most of it.
Gross Margin: 58-74%

Orthopaedic and Joint Reconstruction Implants

The volume core by a wide margin, growing at 5.6% and squeezed between price bands and outpatient migration to buyers with no committee. Caseload is entirely dependable given ageing populations, but clinical parity means pricing resets downward at every contract renewal. Registry evidence is the only defence left.
Gross Margin: 42-62%

Cardiovascular Implants

The strategic watch-out, growing at 6.8% on valve and heart repair caseload while Chinese procurement has already cut stent pricing steeply. Transcatheter procedures keep widening the treatable population, though reimbursement decisions rather than clinical evidence set the pace of that expansion. Price interventions have reached India too.
Gross Margin: 52-74%

How Implant Positions Actually Hold

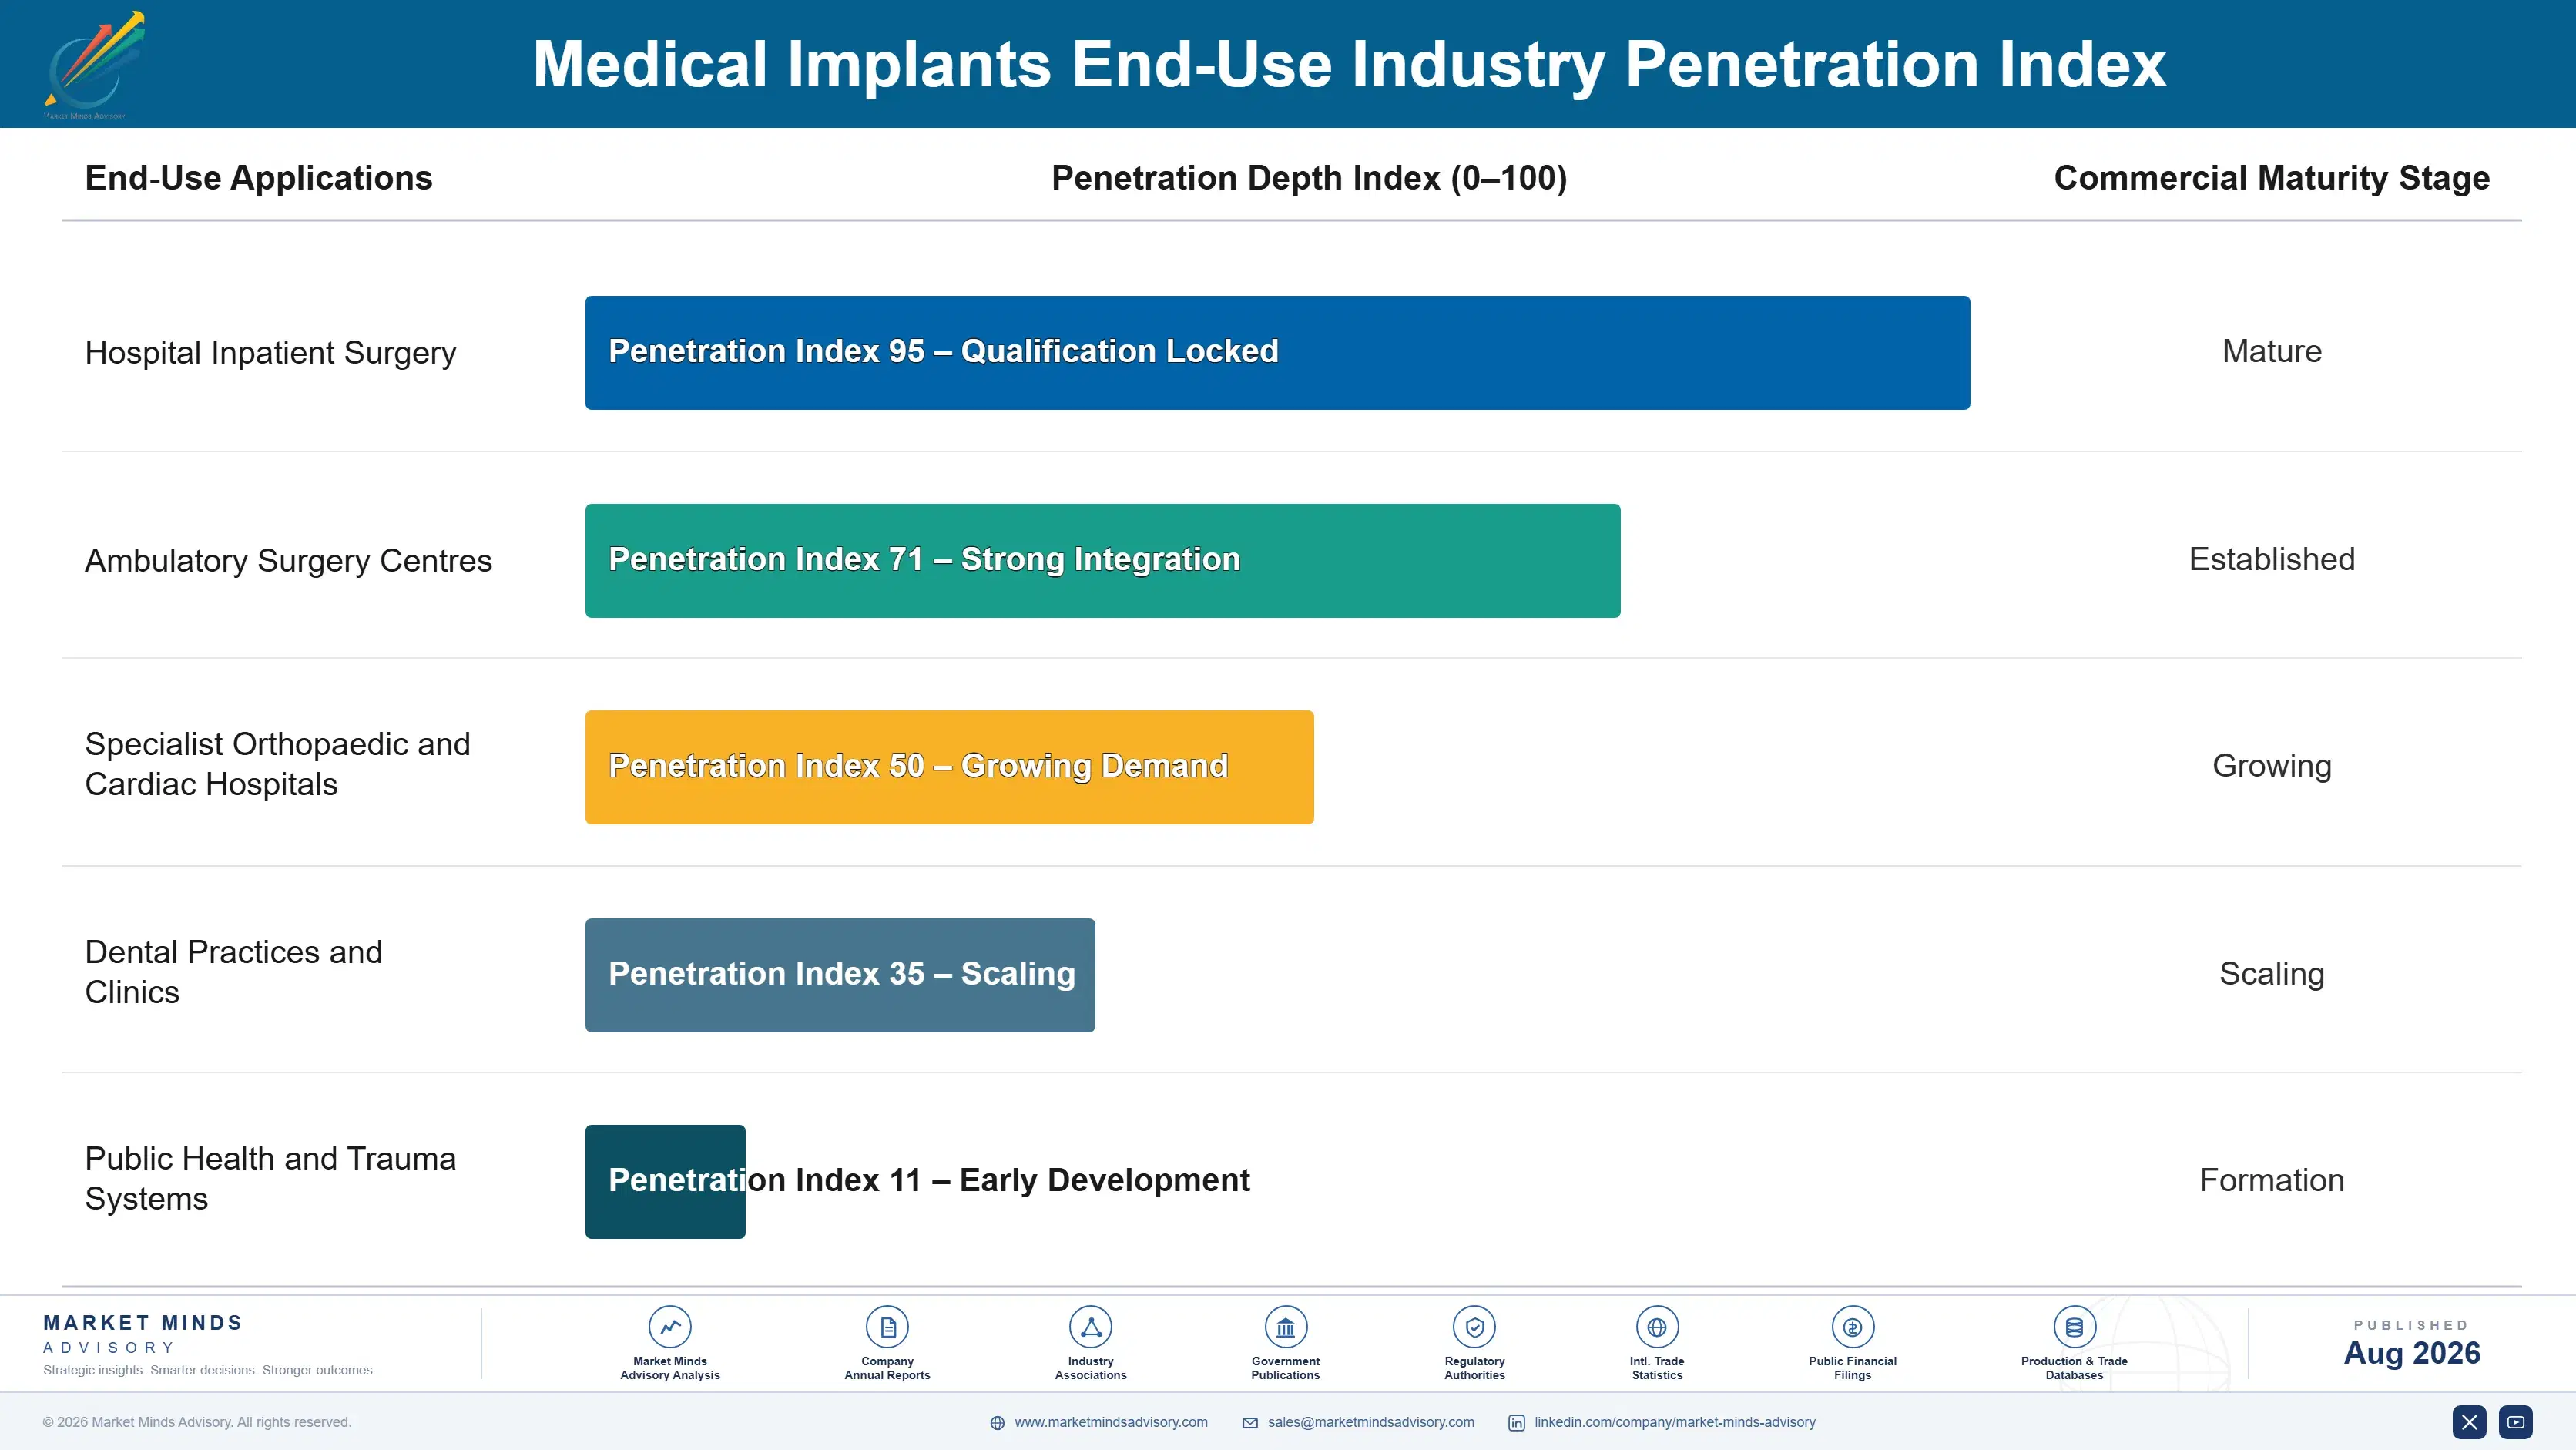
Demand commits at surgeon adoption and repeats case by case while that surgeon operates. An implant system chosen during fellowship becomes muscle memory, and the instrument set, surgical steps, and sizing judgement all sit in the same habit. Switching costs theatre time and carries real clinical risk on early cases. That protects incumbents strongly, and the genuine competitive moments are training, contract renewal, and the opening of a new centre.
Stickiness varies by procedure complexity and revision consequence. Neurostimulation sticks hardest, since programming, patient follow-up, and indication approval all tie to one platform. Revision joint systems stick nearly as firmly because the original implant dictates the compatible revision hardware. Primary hips and knees stick less than surgeons claim, moving at contract renewal when the price band moves. Dental implants stick at the practice, not the hospital.

Buyer profiles have moved from surgeons specifying on preference toward value analysis committees, ambulatory centre owners, and network procurement teams that all hold a veto. Younger surgeons trained on robotic platforms and digital planning also weigh workflow more heavily than tactile familiarity. That change rewards suppliers bringing registry data and cost-per-case arithmetic alongside clinical support, and it penalises those still selling on relationship alone.
medical-implants-market-end-use-penetration-index-1787324627929

Our Call On Medical Implants

These are among the four positions where our research anticipates prominent divergence between winners and laggards over the coming forecast period. Each is grounded in the demand model, the regulatory perimeter, and the announced capacity pipeline.
01 / SURGEON TRAINING INVESTMENT

The decision is made years before the tender

Surgeon preference still carries roughly 55% of the selection decision in most implant categories, and that preference forms during residency and fellowship on one specific instrument set rather than at a purchasing meeting. A surgeon who learned a system will defend it against a cheaper equivalent using clinical arguments a value analysis committee cannot easily rebut. Suppliers treating training as marketing spend rather than commercial investment keep losing accounts they were technically well placed to hold for a decade or more.
02 / REGISTRY EVIDENCE DISCIPLINE

Published outcomes are the only durable premium argument

National joint registries publish revision rates by brand, and a product showing revision near 3% at ten years against a category average nearer 6% carries an argument no competitor discount can answer. That case now works on the finance side as well, because bundled payment makes the provider carry revision cost directly rather than billing it onward. Suppliers without published comparative data are reduced to arguing specification against three clinically equivalent alternatives, which is precisely where price bands were designed to operate.
03 / AMBULATORY CHANNEL BUILD

Centres opening now will still buy in a decade

About 50% of primary knee cases now qualify for outpatient treatment, and an ambulatory centre buys nothing like a hospital does: no purchasing committee, thinner working capital, unwelcome consignment inventory, and implant cost per case watched by the people who own the business. Suppliers built entirely around hospital contracting are finding that channel genuinely difficult to reach at all. The centres being opened this year will still be buying in a decade, which makes this a build decision rather than a sales one.
04 / INSTRUMENT LOGISTICS PRICING

Stop absorbing tray cost inside the implant price

A single knee system can require 12 to 20 instrument trays per case, all of which must be delivered, sterilised, tracked, and returned at the supplier's expense inside an implant price that no comparison ever separates. Reducing tray count through single-use and simplified sets converts that hidden expense into either margin or a real competitive difference. Ambulatory centres value it most, because sterilisation capacity rather than implant price is frequently the binding constraint on how many cases they can run.

Engagement Snapshot From the Field

A live engagement with an industry participant carrying material or product regulatory and market exposure ahead of a defining policy shift, showing how our research translates into a defensible multi-year portfolio strategy.
MARKET MINDS ADVISORY · CLIENT ENGAGEMENT SUMMARY
Medical Implants Producer Strategic Portfolio Review and Transition Roadmap 2026·Investment Scenario on Medical Implants Exposure Evaluation 2025-26
CLIENT PROFILE
A mid-size orthopaedic implant manufacturer with roughly USD 640 million in annual revenue engaged MMA after losing three hospital network contracts in eighteen months. The client reported that its hip and knee lines held solid registry performance but that price band negotiations were compressing margin faster than volume growth could offset, and that ambulatory centres were not being called on systematically (client-reported, unverified by MMA).
STRATEGIC CHALLENGE
Competing on price against three larger suppliers with better purchasing scale was not winnable, and the sales organisation was built entirely around hospital value analysis committees. Nobody owned the ambulatory channel or the registry evidence argument. The board needed to know whether to defend the hospital base or redirect commercial resource, before another renewal cycle arrived.
MMA APPROACH
MMA rebuilt the account view around cost per case including instrument logistics rather than implant list price, which internal analysis had never done. We tested the client's registry position against category averages product by product to see which lines could genuinely support a premium band. We then mapped ambulatory centre openings in the client's territories and assessed which competitors were already calling on them.
KEY FINDINGS
  1. Instrument tray logistics added roughly 11% to delivered cost per case, none of which appeared in the price comparisons the client had been losing on (client-reported, unverified by MMA).
  2. Only two of the client's seven implant lines showed registry revision rates below category average, so the premium argument was defensible on those two alone.
  3. Thirty-one ambulatory centres had opened in the client's core territories over three years, and competitors had established supply relationships at twenty-four of them.
  4. Three lost network contracts had been decided on total episode cost rather than implant price, a criterion the client's sales organisation was not equipped to argue (client-reported, unverified by MMA).
CLIENT PROFILE
A mid-size orthopaedic implant manufacturer with roughly USD 640 million in annual revenue engaged MMA after losing three hospital network contracts in eighteen months. The client reported that its hip and knee lines held solid registry performance but that price band negotiations were compressing margin faster than volume growth could offset, and that ambulatory centres were not being called on systematically (client-reported, unverified by MMA).
STRATEGIC CHALLENGE
Competing on price against three larger suppliers with better purchasing scale was not winnable, and the sales organisation was built entirely around hospital value analysis committees. Nobody owned the ambulatory channel or the registry evidence argument. The board needed to know whether to defend the hospital base or redirect commercial resource, before another renewal cycle arrived.
MMA APPROACH
MMA rebuilt the account view around cost per case including instrument logistics rather than implant list price, which internal analysis had never done. We tested the client's registry position against category averages product by product to see which lines could genuinely support a premium band. We then mapped ambulatory centre openings in the client's territories and assessed which competitors were already calling on them.
KEY FINDINGS
  1. Instrument tray logistics added roughly 11% to delivered cost per case, none of which appeared in the price comparisons the client had been losing on (client-reported, unverified by MMA).
  2. Only two of the client's seven implant lines showed registry revision rates below category average, so the premium argument was defensible on those two alone.
  3. Thirty-one ambulatory centres had opened in the client's core territories over three years, and competitors had established supply relationships at twenty-four of them.
  4. Three lost network contracts had been decided on total episode cost rather than implant price, a criterion the client's sales organisation was not equipped to argue (client-reported, unverified by MMA).
RECOMMENDED STRATEGY
Phase 1: Phase 1 (0 to 6 months): Rebuild commercial arguments around cost per case including tray logistics, and retire list price comparisons from every tender response. Phase 2: Phase 2 (6 to 20 months): Build a dedicated ambulatory sales function with terms suited to small businesses, targeting centres opening rather than those already supplied. Phase 3: Phase 3 (20 to 36 months): Concentrate premium pricing on the two registry-supported lines and accept band pricing on the rest without further argument.
OUTCOME
The client retained two of three contracts at renewal by arguing total episode cost, and reported margin roughly 3 points above the prior year despite unchanged list pricing. The new ambulatory function secured supply at nineteen centres within a year, most of them newly opened rather than taken from competitors (client-reported, unverified by MMA).

Frequently Asked Questions

Foundational context covering the market sizes, CAGR, scope, country, region and competition that inform every finding below. This section is provided to cover basics and most often pre-purchase conversations, answered from the MMA Primary Research Dataset.

What is the current size of the Medical Implants Market?

The global medical implants market is valued at USD 128.4 billion in 2025, covering orthopaedic, cardiovascular, spinal, dental, and neurological implantable devices. External prosthetics, surgical instruments, and capital equipment are excluded.

How large will the Medical Implants Market be by 2036?

The market is forecast to reach USD 248.85 billion by 2036 in the base case, about 1.82 times the 2026 level. That represents incremental value of roughly USD 112.49 billion across the decade.

What is the CAGR for the Medical Implants Market 2026 to 2036?

The market grows at a 6.2% CAGR in the base case, with bull and bear scenarios at 7.4% and 5.0%. The spread turns mainly on neurostimulation indication approvals and orthopaedic price band pressure.

Which segment is growing fastest?

Neurostimulation and neurological implants grow fastest at 10.6%, about 1.71 times the overall rate, as indications widen beyond movement disorders. Dental implants follow at 7.4% on direct patient payment.

Who are the major companies in the Medical Implants Market?

Leading suppliers include Medtronic, Stryker, Johnson & Johnson MedTech, Zimmer Biomet, and Abbott. Concentration is high, with the top five holding roughly 42% of implant revenue above a long tail of category specialists.

Which country is growing fastest?

India grows fastest at a 10.4% CAGR, as private hospital groups add surgical capacity and public insurance schemes widen coverage. China and Indonesia follow on caseload expansion.

Report Segmentation Architecture

The full report scope spans multiple orthogonal segmentation dimensions, with cross-tabulated demand data provided for each dimension pair. Coverage extends further to regional breakdowns, trend trajectories, and the competitive detail needed to support segment-level decision-making.

By Implant Category

  • Orthopaedic and Joint Reconstruction Implants
  • Cardiovascular Implants
  • Spinal Implants
  • Dental Implants
  • Neurostimulation and Neurological Implants

By End-Use Industry

  • Hospital Inpatient Surgery
  • Ambulatory Surgery Centres
  • Specialist Orthopaedic and Cardiac Hospitals
  • Dental Practices and Clinics
  • Public Health and Trauma Systems

By Purchasing Channel

  • Direct Contract To Hospital Network
  • Group Purchasing Organisation Agreement
  • Public Tender and Government Procurement
  • Distributor and Dealer Supply

By Region

  • North America
  • Western Europe
  • East Asia
  • South Asia and Pacific
  • Latin America
  • Middle East and Africa
  • Eastern Europe

Scope, Methodology, and Coverage

Every figure in this report is reproducible from documented input assumptions. The scope below maps the historical period, the forecast horizon, the segmentation dimensions, and the countries covered, alongside the underlying primary and qualitative methodology.
Historical Period
2020 to 2025
Forecast Period
2026 to 2036
Base Year
2025 (USD billions; MMA Primary Research Dataset, August 2026)
Market Definition
The medical implants market comprises the manufacture and sale of devices placed surgically inside the human body for permanent or long-term function, valued at manufacturer selling prices to hospitals, ambulatory surgery centres, dental practices, distributors, and public procurement bodies. It spans orthopaedic and joint reconstruction implants, cardiovascular implants, spinal implants, dental implants, and neurostimulation and neurological implants, together with the fixation components, bearing surfaces, and leads supplied as part of those systems. External prosthetics and orthotics, surgical instruments and instrument trays sold separately from implants, capital equipment including surgical robots and imaging, diagnostic devices, tissue-engineered and cell-based products regulated as biologics, contact lenses and non-implantable hearing devices, and hospital service and maintenance contracts are excluded.
Quantitative Units
USD billions (current prices); implant volume in million units and procedures where applicable
Segmentation Dimensions
By Implant Category; By End-Use Industry; By Purchasing Channel; By Region
Regions Covered
North America, Western Europe, East Asia, South Asia and Pacific, Latin America, Middle East and Africa, Eastern Europe
Countries Covered
USA, China, Germany, France, UK, Japan, South Korea, India, Australia, Canada, Brazil, Mexico, Indonesia, Vietnam, Thailand, Malaysia, UAE, Saudi Arabia, South Africa, Nigeria, Turkey, Poland, Netherlands, Italy, Spain, Sweden, Switzerland, Argentina, Colombia, Singapore, and additional markets relevant to this sector
Key Companies Profiled
Medtronic, Stryker, Johnson & Johnson MedTech, Zimmer Biomet, Abbott, Boston Scientific, B. Braun, Smith+Nephew, Straumann, Dentsply Sirona, Envista, Edwards Lifesciences, LivaNova, Globus Medical, Integra LifeSciences, Enovis, Terumo, Nipro, Osstem Implant, MicroPort Scientific
Quantitative Methodology
Primary survey, n=3,800 respondents, Q4 2025, six countries; demand-side model with trade association cross-validation
Qualitative Methodology
47 expert interviews, Q4 2025; applied to validate demand model assumptions, identify emerging dynamics, and assess competitive positioning
Report Format
PDF and XLSX data workbook (Word format preview document)
Publisher
Market Minds Advisory
Report Code
MMA-2026-MED-260
Published
August 2026
Contact
sales@marketmindsadvisory.com | www.marketmindsadvisory.com

Purchase the full Medical Implants Market Report (2026 to 2036).

The full MMA Medical Implants report sizes the market across five implant categories, five end-use settings, four purchasing channels, and seven regions through 2036. It profiles 20 suppliers on a consistent basis of implantable device revenue, scoring each on surgeon training reach, registry outcome evidence, category breadth, and instrument logistics position. Scenario models quantify how purchasing consolidation, outpatient migration, and procurement reform move both volume and achievable margin by category. The report also includes registry revision rate benchmarking by brand, cost per case modelling including tray logistics, ambulatory centre opening maps by territory, and certification exposure analysis by implant class.
Five-category and four-channel market sizing to 2036
Twenty-supplier benchmark on implantable device revenue
Registry revision rate benchmarking by brand and category
Cost per case modelling including instrument tray logistics
Ambulatory surgery centre opening maps by sales territory
Certification exposure analysis by implant risk class

Built For The People Who Decide

From boardroom strategy to bench-side execution, this report is read cover-to-cover by leaders shaping the next decade of their industry, turning demand scenarios, market dynamics and valuation benchmarks into decisions.
CXOs/ Presidents/ VPs/ Managers
M&A and Corporate Development
Strategy Teams and R&D Heads
Procurement and Product Directors
Regulatory and Compliance Leaders
Investor Relations and Equity Analysts