

Market Minds Advisory
Medical Coatings Market

Medical Coatings Market: Functional Surface Chemistry Across Interventional, Implantable and Single-Use Device Platforms, 2026 to 2036

Device makers are pulling coating decisions upstream into early design work, because a surface that fails a hemocompatibility panel late in a programme costs far more than the entire coating budget itself.

Lead Analyst

Bilal Shaikh

Published

September 2026

Make Smarter Decisions with Customized Research Insights

Request a free sample report and evaluate market opportunities, growth trends, and competitive dynamics relevant to your business needs.

2025 MARKET VALUE$13.8BMarket Size 2025
2036 FORECAST VALUE$30.9BBase Case , 2026 to 2036
CAGR 2026 TO 20367.6 %Bull 8.8% / Bear 6.4%
INCREMENTAL OPPORTUNITY$16.0BNet 10- year value creation
EXPANSION MULTIPLE2.08x2036 value over 2026 base
Strategic Levers
M&A Pipeline
Regional Outlook
Country Rankings
Competitive Intelligence
Segmental Deep-dive
Call-Us : 91 93563 13602

Executive Snapshot and Market Trajectory

Coating selection has stopped being a finishing decision and become a design input in its own right. Device programmes that pick a surface chemistry after the substrate is frozen now routinely lose nine to fourteen months to requalification work, and that timing penalty is quietly reshaping how OEMs buy.
Growth concentrates where the surface does clinical work rather than cosmetic work. Drug-eluting and active release coatings expand at 11.4%, a full 1.50 times the market rate, pulled by drug-coated balloons in peripheral intervention and by antiproliferative surfaces on new implant classes. North America holds 31% of value on the sheer density of interventional device manufacture concentrated there, while East Asia grows considerably faster from a smaller installed base of certified application capacity.
Concentration is moderate: the top five suppliers hold 38% between them, and the field splits between formulation licensors and contract application houses that rarely compete directly. Regulatory pressure is the sharper force. Revised biocompatibility expectations under ISO 10993 and FDA guidance on particulate shedding have made coating durability data a gating item, which favours suppliers holding long field-performance records over newer entrants with better laboratory numbers.
Market Definition
The market covers functional coatings applied to medical devices to modify surface behaviour: lubricious, antimicrobial, drug-eluting, hemocompatible, barrier and anti-fouling chemistries, together with the contract application services that deposit them. It includes coating formulations sold to device OEMs and coating work performed on a toll basis. It excludes bulk device polymers, printing inks, adhesives, sterilisation processes, packaging films, and any coating applied to laboratory or diagnostic consumables outside a patient-contacting pathway.
Base Year Value
$13.8B in 2025 (MMA Primary Research Dataset, August 2026)
Forecast Period
2026 to 2036, eleven discrete annual values
CAGR
7.6% base case. Bull 8.8%. Bear 6.4%.
Fastest Growth Segment
Drug-Eluting and Active Release Coatings: 11.4% CAGR
Fastest Growth Country
India: 10.4% CAGR
Fastest Growth Region
South Asia and Pacific: 9.9% CAGR
Largest Region
North America: 31% of 2025 global value
Market Leaders
Surmodics, DSM Biomedical, Specialty Coating Systems, Biocoat, Hydromer. Source: MMA Primary Research Dataset, July 2026.
Primary Survey
n=3,800 procurement and R&D decision-makers, Q4 2025, six countries
Methodology
Demand-side build-up, cross-validated against public data, 47 expert interviews

Medical Coatings Market Forecast Scenarios

medical-coatings-market-trends-size-forecast-scenario-1787311366155
Between 2020 and 2025 the market compounded at 6.5%, and the shape of that growth mattered more than the rate. Elective procedure volumes collapsed in 2020, recovered unevenly through 2022, then ran ahead of pre-pandemic levels from 2023 as backlogs cleared. Coating suppliers with contract application capacity absorbed the swing better than pure formulation licensors did.
The 7.6% base case rests on three commercial mechanisms. First, interventional procedure volumes continue to grow in the mid single digits as peripheral and neurovascular indications widen. Second, coating content per device rises: a device that once carried a single lubricious layer now often carries a hemocompatible primer beneath it. Third, outsourcing deepens, with 61% of application work already performed outside the OEM and that share still climbing as regulatory documentation burdens grow.
The bull case at 8.8% turns on drug-coated balloon adoption in below-the-knee disease, where reimbursement decisions in the United States and Japan could add a large device population quickly. The bear case at 6.4% assumes particulate shedding scrutiny hardens into mandatory long-term surveillance, slowing new coating introductions and pushing OEMs toward incumbent chemistries they already have field data for.

Where Surface Performance Now Decides Device Economics

The commercial logic of this market is unusual. A coating is a rounding error on device cost, typically under two dollars against a catheter selling for several hundred, yet it carries a disproportionate share of clinical risk and regulatory exposure. That asymmetry is what gives established suppliers their pricing position.
TOP FIVE CONCENTRATION38%Combined position of the five largest specialty coating suppliers
APPLIED COST PER DEVICE$1.85Typical delivered coating cost on a finished interventional device
OUTSOURCED APPLICATION SHARE61%Portion of coating work performed by contract service providers
REQUALIFICATION CYCLE14 monthsMedian time to requalify a changed coating formulation fully
POLYMER INPUT SHARE22% of COGSMedical grade polymer share of the typical coating cost base
COATED DEVICE VOLUME412 million unitsAnnual global device units receiving a functional surface treatment
Application capability, not formulation chemistry, has become the scarce asset. Dip, spray and plasma deposition each demand different tooling, different cleanroom classification and different validation packages, and a device maker running a new geometry frequently discovers that its preferred chemistry cannot be applied uniformly to it. Contract houses that hold validated lines across several deposition methods capture work that formulation licensors cannot serve at all, and they capture it at service margins rather than material margins.
Consolidation of purchasing has followed. Large OEMs that once qualified a coating per programme now maintain platform-level surface specifications applied across whole product families, which concentrates volume on fewer suppliers and raises the cost of switching. Smaller device firms move the other way, buying complete coating packages including regulatory documentation because they lack the internal surface science staff to assemble one.
"The most valuable thing a coating supplier owns is not a formulation, it is a decade of field performance data that nobody can replicate quickly. That is why the newest chemistry rarely wins the largest programme, and why device makers keep paying for surfaces that laboratory testing says have been superseded."
Principal Analyst, Medical Device Materials Practice · MMA Medical Devices Pract

Market Trends

Hemocompatible Primers Move Beneath Lubricious Top Layers

Dual-layer architectures have moved from specialty neurovascular devices into mainstream peripheral catheters. A hemocompatible primer sits beneath the lubricious surface, addressing thrombus formation that a lubricity layer alone never touched. Roughly 28% of new interventional device programmes launched in 2025 specified a two-layer surface, against 11% four years earlier. The commercial consequence is that coating content per device rises without any change in procedure volume, and it favours suppliers whose two chemistries are validated together. OEMs that mix vendors across the stack carry the interface risk themselves, and most have decided they would rather not.
Market Impact: Drives 9% annual procedure volume g

Particulate Shedding Data Becomes A Submission Gating Item

Regulators have tightened expectations on particulate release from lubricious surfaces following device recalls tied to coating separation. FDA guidance now effectively requires quantified particulate characterisation across simulated use, and notified bodies in Europe have adopted comparable expectations under MDR. The practical effect is a longer, more expensive submission package: analytical costs on a new coating programme have risen by roughly 45% since 2021. Established chemistries with existing field records clear this bar cheaply. New entrants do not, and several promising surface technologies have stalled at the point where the durability testing bill exceeded the programme budget entirely.
Market Impact: Covers 2,300 hospitals under mandat

Market Opportunities and Growth Drivers

Peripheral Intervention Volumes Expand Coated Device Demand

Peripheral vascular procedures are growing faster than coronary work, and they consume more coated device length per case. A single below-the-knee intervention may use three coated devices where a coronary case uses one. Procedure volumes in this segment grew about 9% annually across 2022 to 2025 in the United States, Germany and Japan combined, and the ageing diabetic population that drives peripheral disease is expanding in every major market. Device makers have responded with dedicated product families, each requiring its own coating qualification, which multiplies supplier engagements rather than simply raising volume on existing ones.
Market Impact: Locks specifications for 14 months

Antimicrobial Surfaces Respond To Infection Cost Pressure

Hospital-acquired infection penalties under reimbursement rules in the United States and several European systems have made catheter-associated infection a direct financial exposure rather than a quality statistic. Silver, chlorhexidine and newer non-eluting antimicrobial surfaces have consequently moved from premium options into standing specifications on urinary and central venous catheters. Purchasing groups covering roughly 2,300 US hospitals now require antimicrobial surfaces on specified catheter classes. That converts a clinical preference into a procurement mandate, and it pushes device makers to qualify antimicrobial chemistry on product lines where they previously competed purely on price.
Market Impact: Requires 24 months to validate capa

Market Restraints and Challenges

Requalification Cost Freezes Coating Choices For Years

Once a coating is qualified into a device submission, changing it is expensive. A formulation change typically triggers 14 months of requalification work and analytical costs running into the high six figures, because biocompatibility, durability and particulate panels all reset. The root cause is that regulators treat the surface as inseparable from the device rather than as a component. Commercially this locks incumbent suppliers in place and starves better chemistries of adoption. Participants are working around it through platform-level master files and through pre-validated coating packages that carry portable data, which cuts requalification to roughly six months on favourable pathways.
Market Impact: Raises coating content 40% per devi

Contract Application Capacity Constrains Programme Timelines

Validated coating lines are scarce and slow to build. A new cleanroom-classified application cell takes 18 to 24 months from order to validated production, and the specialist operators who run reproducible dip and spray processes are hard to recruit. The root cause is that validation burden scales with line count, so contract houses add capacity conservatively rather than speculatively. Device makers consequently queue, and launch dates slip. Mitigation is running in two directions: OEMs are bringing high-volume coating in-house while contract houses invest in automated spray platforms that reduce operator dependence and shorten validation by around eight months.
Market Impact: Adds 45% to coating analytical cost
4 additional market trends, 3 additional growth drivers, and 2 additional restraints and challenges are covered in the full report. Contact sales@marketmindsadvisory.com to access the complete intelligence.

Segment CAGR and Growth Architecture

Segmentation follows coating function, meaning what the surface is actually engineered to do once the device is inside the body. That logic holds consistently across substrate types and application methods, and it matches closely how device engineers actually specify surfaces in practice and how regulators go on to assess the resulting clinical claims during submission review.
medical-coatings-market-trends-market-share-analysis-1787311367035

Drug-Eluting and Active Release Coatings

The fastest segment at 11.4%, a full 1.50 times the market rate, covering surfaces that release a pharmacological agent into surrounding tissue. Drug-coated balloons carrying paclitaxel or sirolimus account for most current volume, with antiproliferative and antibiotic release surfaces on orthopaedic and cardiac rhythm implants adding the rest. The economics differ sharply from passive coatings: the surface carries a drug master file, the supplier shares regulatory exposure, and realised pricing runs several times that of a lubricious layer. Growth is pulled by peripheral indications and by reimbursement decisions that finally recognised below-the-knee treatment. Excipient behaviour, rather than the drug substance itself, remains by some distance the hardest engineering problem anyone working in this segment has to solve.
CAGR 11.4%

Anti-Thrombogenic and Hemocompatible Coatings

Growing at 10.2% on surfaces engineered to suppress platelet adhesion and clot formation, principally heparin-bound, phosphorylcholine and zwitterionic chemistries. Demand runs strongest in neurovascular access, extracorporeal circuits and long-dwell catheters where blood contact persists for hours or days. The segment is expanding partly on its own merits and partly because it now sits beneath lubricious top layers in dual-architecture designs rather than competing with them. Pricing holds up well: these surfaces carry clinical claims that buyers verify, so competition runs on data rather than cost. Supplier positions are unusually narrow, with a small handful of proven chemistries holding almost every qualified programme worldwide and very little sign of that changing soon.
CAGR 10.2%
Full segment breakdown across 6 segments available in the complete report.

Regional Architecture and Country Demand Map

North America leads on the sheer density of interventional device manufacture and procedure volume, while East Asia grows faster from a thinner base of validated application capacity. South Asia and Pacific expands quickest of all as domestic device manufacture scales rapidly against imported finished product.

North America

At 31% of global value, this is the largest regional pool, and the reason is manufacturing geography rather than population. The United States hosts the design and production centres of the interventional device industry, from Minnesota through California and Massachusetts, and coating work follows the substrate. Reimbursement also supports higher-specification devices than most systems tolerate, so coated content per procedure runs above the global mean. Growth of 7.0% reflects a mature procedure base expanding steadily rather than rapidly. The contract application sector is deepest here too, with validated capacity concentrated around device clusters. Canadian activity is comparatively modest and mostly serves domestic orthopaedic and urology programmes rather than export manufacture of any scale.
Share: 31% | CAGR: 7.0% (2026 to 2036)

Western Europe

Twenty-three percent of value sits here, anchored on German, Irish and Swiss device manufacture that supplies markets well beyond the region. Ireland in particular hosts high-volume catheter and stent production for US-headquartered firms, which pulls coating demand disproportionately. MDR has reshaped commercial behaviour: requalification burden under the regulation persuaded several OEMs to consolidate onto fewer coating suppliers with complete technical files. Growth of 6.0% runs below the global rate, reflecting mature procedure volumes and pricing pressure from national tender systems. The region leads on hemocompatible chemistry development, with phosphorylcholine and zwitterionic work concentrated in UK and Dutch laboratories. Reimbursement conservatism slows adoption of newer drug-eluting surfaces relative to the United States.
Share: 23% | CAGR: 6.0% (2026 to 2036)
Regional intelligence for 5 additional markets available in the complete report: East Asia, South Asia and Pacific, Latin America, Middle East and Africa, Eastern Europe. Contact sales@marketmindsadvisory.com.
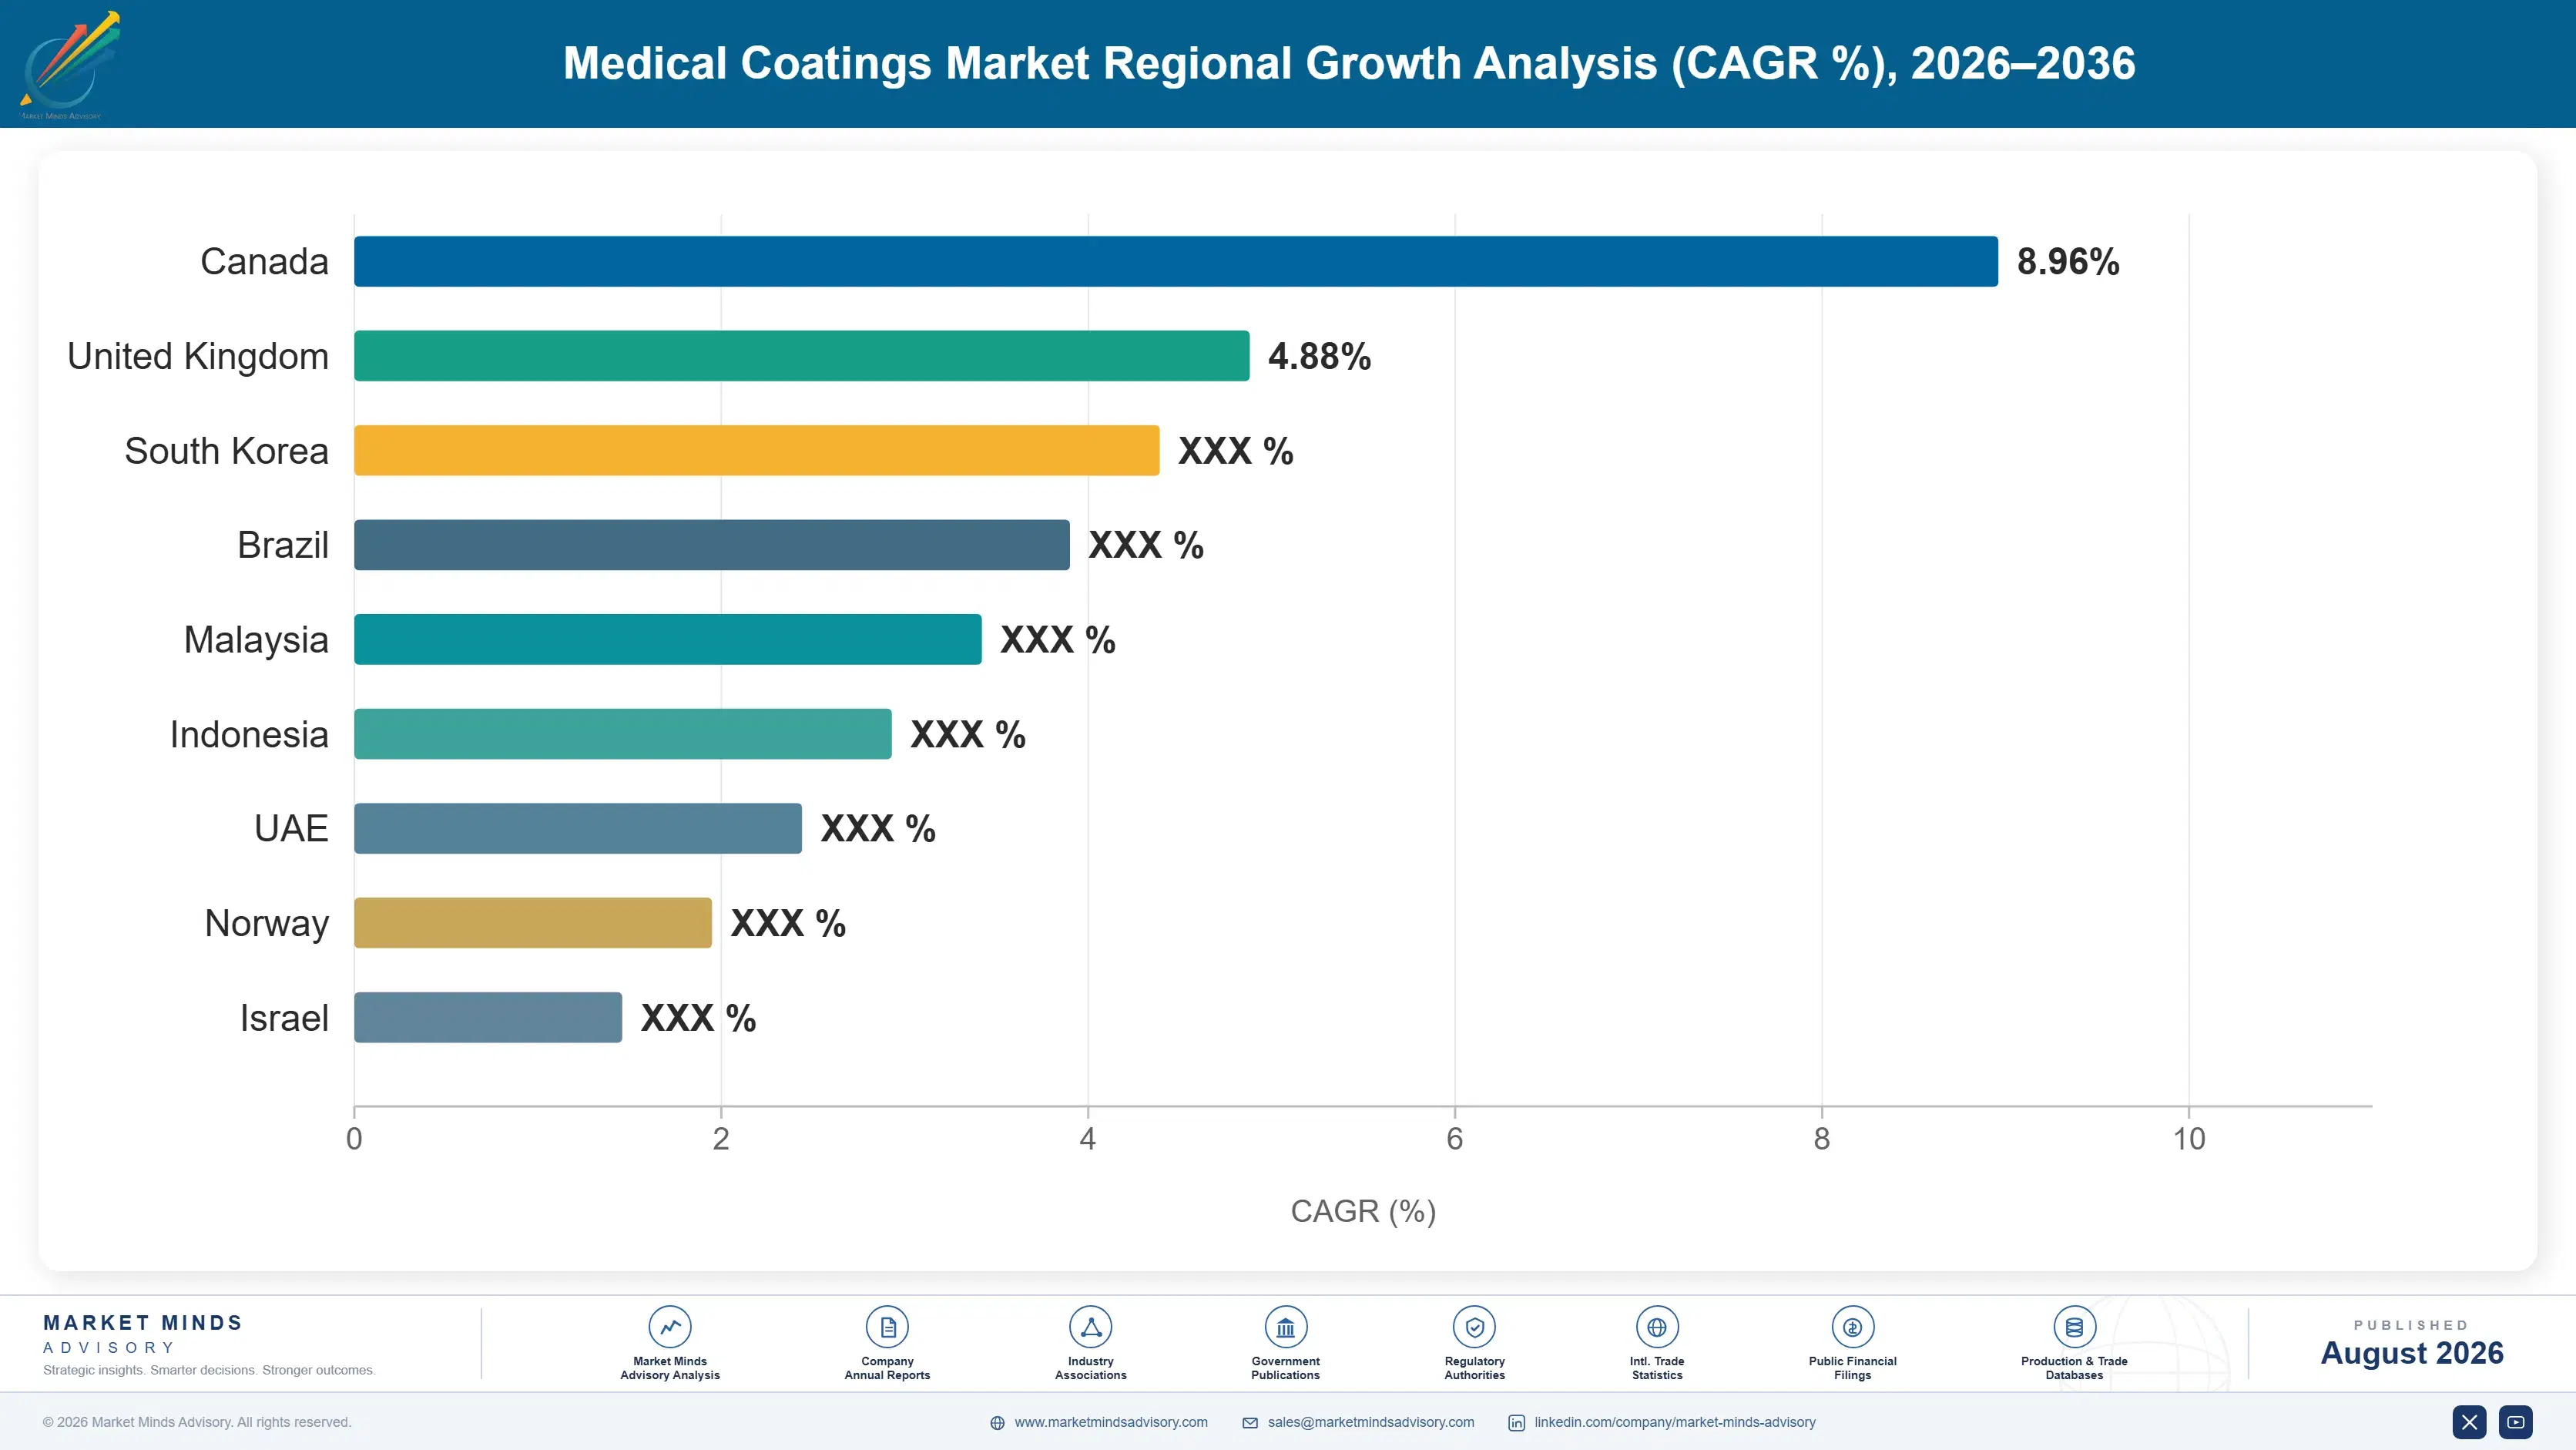
medical-coatings-market-trends-country-cagr-analysis-1787311367843

Where Coating Margin Actually Accumulates

Four commercial moves separate the suppliers earning material margins from those earning service margins alone. Each one of them depends on owning something that a device maker simply cannot assemble internally at any reasonable cost: regulatory data, validated capacity, combined chemistry stacks, or the analytical capability that turns a surface claim into a defensible submission package.

Sell The Regulatory File, Not The Chemistry

Coating suppliers that deliver a complete technical package, including biocompatibility, durability and particulate data referenced to a master file, realise roughly 30% higher pricing than those selling formulation alone. The reason is straightforward: a device maker assembling that package internally spends between $400,000 and $900,000 and eight months doing it. Smaller OEMs without surface science staff cannot do it at all. The supplier already holds the data across multiple programmes, so its marginal cost of supplying it approaches zero while the buyer's avoided cost is substantial. That gap is the margin.
Market Impact: Realises about 30% higher pricing t

Validate Across Several Deposition Methods At Once

Contract application houses running dip, spray and plasma lines under one quality system capture programmes that single-method operators cannot bid at all. Device geometries increasingly rule out one method or another, and an OEM that must split coating across two vendors carries interface risk it would rather avoid. Multi-method houses win roughly 55% of programmes they bid against single-method competitors, and they hold pricing because the alternative involves a second qualification. The capital cost is real, running $6 million to $11 million per additional validated cell, but utilisation across programmes recovers it inside four years.
Market Impact: Wins roughly 55% of contested multi

Bundle Primer And Top Layer Together

Dual-layer architectures create an opening that single-chemistry suppliers cannot address. Selling a validated hemocompatible primer and lubricious top layer as one qualified stack removes the interface testing burden from the device maker entirely, and that burden is expensive: OEMs report spending 10 to 14 weeks characterising layer interaction when they source separately. Suppliers offering validated stacks capture around 45% more revenue per device programme than single-layer positions deliver. The requirement here is genuine chemistry breadth rather than commercial distribution breadth, which is precisely why the field of credible bundlers stays so small.
Market Impact: Captures about 45% more revenue per

Build Analytical Services Around The Coating

Particulate characterisation, simulated use testing and durability panels have become substantial cost centres for device makers, and few run them well internally. Coating suppliers with accredited analytical laboratories sell that capability as a service attached to material supply, typically at $85,000 to $160,000 per programme. It converts a cost the supplier already bears into revenue, and more usefully it embeds the supplier in the submission process where coating changes are decided. Suppliers offering it report renewal rates around 20 points higher than material-only relationships, because switching means rebuilding the analytical relationship too.
Market Impact: Adds $160,000 per programme in atta

Who Controls the Margin Pool

Concentration is moderate. The five largest suppliers hold 38% of global revenue between them, measured on coating material and application service revenue across all participants. Surmodics leads on the breadth of its hydrophilic and drug-delivery positions combined with contract application capacity, and the gap to the second tier is wider in regulatory depth than in revenue terms alone.
Competition currently runs on three dimensions. Regulatory data completeness matters most: a supplier holding field records across many cleared devices reduces submission risk in a way newer chemistries cannot match. Validated application capacity matters second, and has become the binding constraint on timelines. Price matters least on interventional devices and most on high-volume single-use products such as urinary catheters, where antimicrobial surfaces compete against uncoated alternatives on cost alone.

Pressure builds from two directions. Large device OEMs are internalising high-volume coating work, which strips the most predictable service revenue out of contract houses and leaves them the difficult low-volume programmes. Meanwhile Chinese and Indian formulation developers have closed much of the technical gap on lubricious chemistry and win domestic programmes on cost. Rankings shift where those forces meet: suppliers resting on commodity lubricious volume rather than regulatory depth are most exposed.
medical-coatings-market-trends-company-positioning-matrix-1787311368563

Competitive Moat and Risk Dimensions

SURMODICS

Moat: Deepest cleared device record

Surmodics coatings appear on a very large installed base of cleared interventional devices, and that field record is the asset. A device maker citing an existing performance history through a submission reduces analytical burden materially. Competitors with better laboratory data cannot replicate a decade of clinical use, and regulators weight the latter more heavily.
SURMODICS

Risk: Drug-coated balloon concentration

A substantial share of forward growth expectation rests on drug-coated balloon programmes where the company holds both coating and device positions. That concentrates regulatory and reimbursement risk in one clinical area. Any adverse safety signal or reimbursement reversal in peripheral drug-coated balloon therapy would affect the coating business and the device business simultaneously, with no offsetting position.
DSM BIOMEDICAL

Moat: Biomaterials breadth across substrates

The company sells surface chemistry alongside bulk biomaterials, which lets it solve coating adhesion problems at the substrate level rather than the surface level. Device makers working on difficult polymer substrates frequently find that a supplier controlling both sides of the interface resolves adhesion failures that surface-only vendors have spent months on unsuccessfully.
DSM BIOMEDICAL

Risk: Limited contract application footprint

Formulation strength is not matched by validated application capacity, so programmes needing toll coating go elsewhere for the deposition step. That cedes the service revenue and, more damagingly, cedes the operational relationship with the device maker to a third party. As outsourcing deepens across the market, holding only the material position becomes a narrower place to stand.

Players Tracked

Prominent Players

Surmodics
DSM Biomedical
Specialty Coating Systems
Biocoat
Hydromer

Other Key Players

Covalon Technologies
BioInteractions
AST Products
Harland Medical Systems
Applied Membrane Technology
Freudenberg Medical
Precision Coating
Sono-Tek
Aculon
PPG Industries
Materion
Kisco
Biomerics
Argon Medical Devices
Formacoat

Recent Developments

MARCH 2025

Surmodics expands contract application capacity in Ireland

The company brought additional validated coating cells online at its European site, adding dedicated capacity for spray-applied hydrophilic and hemocompatible surfaces to serve catheter manufacture concentrated across the Irish and German device production clusters that between them supply device programmes sold across global interventional markets today.
Signal: Application capacity, rather than formulat
JULY 2025

Biocoat opens expanded coating services facility

A substantially larger coating application and analytical services facility entered commercial service, combining validated deposition lines with particulate characterisation laboratories under a single quality system, aimed squarely at device makers that are unable to run particulate and durability testing programmes internally at any reasonable cost whatsoever.
Signal: Analytical capability is now being sold al
NOVEMBER 2025

Covalon secures antimicrobial catheter supply agreement

A multi-year supply agreement placed the company's proprietary antimicrobial surface technology onto an established hospital catheter product line distributed across several large North American acute care networks, tied directly to measurable infection reduction commitments written explicitly into the purchasing terms rather than left as marketing claims.
Signal: Infection penalty economics are converting

What Moves Coating Production Cost

Medical grade polymers account for roughly 22% of coating cost of goods, principally polyvinylpyrrolidone, polyurethane dispersions and specialty acrylates sourced from a small set of qualified European and North American producers. Active pharmaceutical ingredients add 18% on drug-eluting lines, mostly paclitaxel and sirolimus from Indian and Italian manufacturers. Solvents contribute 9%, and cleanroom operating cost, which behaves like an input here, takes another 14%.
The 2022 to 2023 solvent and specialty monomer disruption showed how thin qualification depth is. European producers curtailed output as gas costs rose, and coating suppliers found they could not substitute freely because each alternate grade required its own biocompatibility assessment. Several reported input cost increases above 30% on affected lines, absorbed rather than passed through because device contracts were fixed. Company annual reports across the sector documented margin compression of two to four points.

Exposure varies sharply by supplier type. Contract application houses buy formulations at a fixed price and are largely insulated, taking the risk on labour and cleanroom cost instead. Formulation owners carry the raw material exposure directly and cannot requalify around it quickly, since a substituted polymer grade resets biocompatibility testing. That asymmetry gives service-model suppliers steadier margins through input cycles.
medical-coatings-market-trends-cost-volatility-analysis-1787311368758

Dual-qualify polymer grades ahead of need

Carrying a second qualified source for each critical polymer costs roughly $120,000 per grade in biocompatibility and stability testing, and most suppliers defer it. Those that pre-qualify during comfortable supply periods switch inside weeks rather than months when a primary source curtails, and they avoid the contract penalties that late substitution almost always triggers on fixed device supply terms.

Index long-term device contracts to input baskets

Fixed-price multi-year coating contracts transfer all input volatility to the supplier, which is where most of the 2022 margin damage came from. Suppliers now negotiate indexation clauses tied to published polymer and solvent references, typically with a quarterly reset and a collar limiting total movement to eight percent in either direction across any given year.

Move solvent-borne chemistry toward aqueous systems

Aqueous coating systems cut solvent purchase and cleanroom ventilation cost together, removing roughly nine percent of cost of goods where the chemistry permits substitution. The obstacle is requalification: an aqueous version of an existing coating is a new coating in regulatory terms, so conversion happens on new programmes rather than retrospectively on cleared devices.

Portfolio Architecture for Margin Defence

Margin architecture in coatings tracks regulatory exposure almost exactly. Commodity lubricious work on high-volume single-use devices runs at gross margins in the low thirties, because the chemistry is well understood, widely available and procurement buys it purely on delivered price. Certified surfaces carrying verified clinical claims run a full twenty points higher than that.
The volume-versus-premium tension is unusually sharp here. High-volume catheter coating provides the throughput that keeps validated application lines utilised, and utilisation is what makes a coating facility economic at all. But that same work carries the thinnest margins and is exactly what large OEMs internalise first. Suppliers who chase volume for utilisation find themselves defending the least defensible position, while those who refuse it cannot fill their lines.

Value pools concentrate where regulatory burden is highest. Drug-eluting surfaces, hemocompatible chemistry with clinical claims, and antimicrobial surfaces backed by infection outcome data all command margins the passive coating business never sees. The common feature is that the buyer cannot verify performance cheaply and therefore pays for evidence. Where a device maker can test the surface itself in a week, margin compresses toward the cost of the polymer.

Volume / Commodity-Adjacent

Lubricious coatings on high-volume single-use devices, guidewires and standard urinary catheters. Chemistry is mature and widely available, procurement buys on delivered cost, and the work exists mainly to keep validated application lines utilised across the year.
Gross Margin: 30-36%

Premium / Certified

Hemocompatible and antimicrobial surfaces carrying verified clinical claims on interventional and long-dwell devices. Pricing holds because buyers cannot assess performance independently and because switching resets a costly qualification package. Range reflects the wide spread between neurovascular and general catheter programmes.
Gross Margin: 48-58%

Sustainability / Regulatory / Next-Generation

Drug-eluting surfaces, combination-product coatings and next-generation zwitterionic chemistry. The supplier shares regulatory exposure and often holds a drug master file, which is precisely what justifies the pricing. Range is wide because programme economics vary with the drug and indication involved.
Gross Margin: 58-72%
medical-coatings-market-trends-portfolio-architecture-1787311369257

High-value Sub-segments and Strategic Watch-out

Drug-Eluting and Active Release

High value on genuinely high growth, expanding at 11.4% with the strongest realised margins found anywhere in this market. The regulatory exposure a supplier accepts here is real enough, but so is the pricing that comes with sharing it, and very few competitors can follow.
Gross Margin: 58-72%

Hemocompatible Surface Chemistry

Strong margins on steady rather than spectacular growth at 10.2%. Qualified supplier positions here remain very narrow, clinical claims get verified by buyers rather than merely asserted, and the dual-layer architecture trend is steadily pulling this chemistry into interventional programmes that had previously specified lubricity alone.
Gross Margin: 50-60%

Volume Lubricious Coating

The utilisation backbone of every contract application house, necessary for line economics but badly exposed to OEM insourcing. Margin sits in the low thirties and falls further whenever a large device maker validates its own capacity, which several of the largest are now doing quite deliberately.
Gross Margin: 30-36%

Antimicrobial Catheter Surfaces

The strategic watch-out in this portfolio. Infection penalty economics are pulling volume in quickly, but efficacy evidence remains contested and a single negative outcome study would strand qualification investment. Suppliers are committing scarce validated capacity against clinical claims that nobody has yet settled definitively either way.
Gross Margin: 44-54%

How Coating Demand Actually Recurs

Coating revenue behaves like an annuity attached to a device programme rather than a series of transactions. Once a surface is qualified into a cleared device, it ships with every unit for the commercial life of that programme, typically seven to twelve years. The supplier's revenue then tracks device volume without further selling effort.
Stickiness varies considerably by end-use. Neurovascular and cardiac programmes are the tightest: the qualification burden is heaviest, the clinical stakes highest, and coating changes on cleared devices are rare enough to be notable events. Peripheral and general interventional work sits a step looser. Urinary and general-purpose catheter lines are the loosest of all, where procurement reviews coating supply on ordinary purchasing cycles and switches when the delivered cost justifies requalification.

Buyer profiles have shifted generationally. Coating selection once sat with manufacturing engineers who chose on processability. It now sits with regulatory affairs and design teams who choose on submission risk, and those buyers ask entirely different questions. Supplier sales organisations built around process support have had to rebuild around regulatory evidence, and several have found that transition harder than any technical challenge.
medical-coatings-market-trends-end-use-penetration-index-1787311369748

Where To Place Capital Here

These are among the four positions where our research anticipates prominent divergence between winners and laggards over the coming forecast period. Each is grounded in the demand model, the regulatory perimeter, and the announced capacity pipeline.
01 / REGULATORY EVIDENCE DEPTH

Own the submission data, not just the chemistry

The defensible asset in this market is a field performance record that new entrants simply cannot manufacture at any price or on any timeline. Suppliers holding cleared device histories across many programmes command roughly 30% higher pricing than formulation-only competitors, and they hold that premium through input cost cycles rather than surrendering it. Capital directed at analytical capability and regulatory master file depth returns considerably more reliably here than capital directed at developing novel surface chemistry, however promising the laboratory data behind it looks.
02 / APPLICATION CAPACITY POSITIONING

Validated lines are the binding constraint through 2030

New coating cells take 18 to 24 months to validate fully, and device programmes are already queuing against that limit today rather than at some point in the future. Multi-method application houses win about 55% of contested bids, because device geometry frequently rules out a single deposition route entirely. Building validated capacity ahead of confirmed demand is uncomfortable for any board, but the practical alternative is watching good programmes go to whichever competitor already holds a qualified line standing free.
03 / DRUG-DELIVERY SURFACE EXPOSURE

Fastest pool, with regulatory risk priced in

Drug-eluting coatings grow at 11.4%, a full 1.50 times the market rate, and they carry gross margins reaching into the low seventies where the programme economics work. That premium exists because the supplier shares regulatory exposure with the device maker rather than despite it, which is the whole commercial bargain. Entering this pool requires genuine drug master file capability and a tolerance for concentrated clinical risk, which is exactly why the competitive field here has stayed so small for so long.
04 / COMMODITY VOLUME DEFENCE

Plan for OEM insourcing of lubricious work

High-volume lubricious coating work provides exactly the line utilisation that makes any coating facility economic at all, yet it sits at gross margins around 33% and is the first work large device makers choose to bring in-house. Suppliers depending on that work for throughput should assume the volume leaves them inside five years rather than quietly hoping otherwise. The practical response is converting that utilisation dependence into genuine specialty programme depth well before the insourcing decision gets made somewhere else entirely.

Engagement Snapshot From the Field

A live engagement with an industry participant carrying material or product regulatory and market exposure ahead of a defining policy shift, showing how our research translates into a defensible multi-year portfolio strategy.
MARKET MINDS ADVISORY · CLIENT ENGAGEMENT SUMMARY
Medical Coatings Producer Strategic Portfolio Review and Transition Roadmap 2026·Investment Scenario on Medical Coatings Exposure Evaluation 2025-26
CLIENT PROFILE
A privately held interventional device manufacturer with annual revenue near $340 million (client-reported, unverified by MMA), producing peripheral vascular catheters and access devices across two facilities in Western Europe and one in the United States. The company had grown through acquisition and inherited four different coating suppliers across its product families, with no common surface specification and no consolidated view of qualification exposure across the portfolio.
STRATEGIC CHALLENGE
A supplier notification of formulation change on a lubricious coating threatened requalification across eleven cleared devices simultaneously. Management had no assessment of how much of the portfolio sat on single-sourced coatings, what requalification would cost, or whether consolidating onto fewer suppliers would reduce or concentrate that exposure. The board wanted an answer before the next product planning cycle closed.
MMA APPROACH
MMA mapped every cleared device against its coating supplier, chemistry, application method and qualification pathway, then modelled requalification cost and timeline under three consolidation scenarios. Supplier capacity, regulatory file depth and financial stability were assessed for eight candidate suppliers. Findings were tested against 47 expert interviews covering contract application capacity and regulatory expectations in both jurisdictions.
KEY FINDINGS
  1. Sixty-three percent of cleared device revenue depended on coatings from a single supplier with no qualified alternate, concentrating far more exposure than management had assumed existed.
  2. Requalification across the affected eleven devices would cost between $3.1 million and $4.8 million (client-reported ranges, unverified by MMA) and consume roughly 16 months of regulatory capacity.
  3. Two candidate suppliers held master files that would have cut requalification timelines by around six months, but neither had validated application capacity available inside the planning window.
  4. Consolidating onto two suppliers rather than one preserved negotiating position while removing the tail of legacy chemistries that carried disproportionate qualification and analytical maintenance cost.
CLIENT PROFILE
A privately held interventional device manufacturer with annual revenue near $340 million (client-reported, unverified by MMA), producing peripheral vascular catheters and access devices across two facilities in Western Europe and one in the United States. The company had grown through acquisition and inherited four different coating suppliers across its product families, with no common surface specification and no consolidated view of qualification exposure across the portfolio.
STRATEGIC CHALLENGE
A supplier notification of formulation change on a lubricious coating threatened requalification across eleven cleared devices simultaneously. Management had no assessment of how much of the portfolio sat on single-sourced coatings, what requalification would cost, or whether consolidating onto fewer suppliers would reduce or concentrate that exposure. The board wanted an answer before the next product planning cycle closed.
MMA APPROACH
MMA mapped every cleared device against its coating supplier, chemistry, application method and qualification pathway, then modelled requalification cost and timeline under three consolidation scenarios. Supplier capacity, regulatory file depth and financial stability were assessed for eight candidate suppliers. Findings were tested against 47 expert interviews covering contract application capacity and regulatory expectations in both jurisdictions.
KEY FINDINGS
  1. Sixty-three percent of cleared device revenue depended on coatings from a single supplier with no qualified alternate, concentrating far more exposure than management had assumed existed.
  2. Requalification across the affected eleven devices would cost between $3.1 million and $4.8 million (client-reported ranges, unverified by MMA) and consume roughly 16 months of regulatory capacity.
  3. Two candidate suppliers held master files that would have cut requalification timelines by around six months, but neither had validated application capacity available inside the planning window.
  4. Consolidating onto two suppliers rather than one preserved negotiating position while removing the tail of legacy chemistries that carried disproportionate qualification and analytical maintenance cost.
RECOMMENDED STRATEGY
Phase 1: Phase one: dual-qualify the highest-revenue lubricious coating within nine months, accepting requalification cost on four devices to remove single-source exposure. Phase 2: Phase two: consolidate legacy acquired programmes onto two platform coating specifications at natural product refresh points rather than through forced requalification. Phase 3: Phase three: negotiate capacity reservation with both retained suppliers ahead of the 2027 product launches, tied to indexed pricing rather than fixed terms.
OUTCOME
The client executed phase one within eleven months and reported avoided requalification exposure of approximately $2.6 million (client-reported, unverified by MMA) when its primary supplier subsequently changed a second formulation. Platform specifications now govern all new programmes, and coating selection moved formally into design review rather than manufacturing engineering.

Frequently Asked Questions

Foundational context covering the market sizes, CAGR, scope, country, region and competition that inform every finding below. This section is provided to cover basics and most often pre-purchase conversations, answered from the MMA Primary Research Dataset.

What is the current size of the Medical Coatings Market?

The market was worth $13.8 billion in 2025 and is forecast to reach $14.85 billion in 2026. Growth is driven by rising coated content per device rather than device volume alone.

How large will the Medical Coatings Market be by 2036?

MMA forecasts $30.89 billion by 2036, an expansion multiple of 2.08 times the 2026 base. That represents $16.04 billion of incremental value across the forecast period.

What is the CAGR for the Medical Coatings Market 2026 to 2036?

The base case compound annual growth rate is 7.6%, with a bull case of 8.8% and a bear case of 6.4%. Historical growth from 2020 to 2025 ran at 6.5%.

Which segment is growing fastest?

Drug-eluting and active release coatings at 11.4%, a full 1.50 times the market rate. Growth is pulled by drug-coated balloon adoption in peripheral vascular intervention.

Who are the major companies in the Medical Coatings Market?

Surmodics, DSM Biomedical, Specialty Coating Systems, Biocoat and Hydromer lead, holding 38% of revenue between them. A further fifteen suppliers hold meaningful qualified positions across specific chemistries.

Which country is growing fastest?

India at 10.4%, as domestic device manufacture scales under production-linked incentive schemes. Coating demand follows substrate production, though most Indian manufacturers still license formulations rather than develop their own.

Report Segmentation Architecture

The full report scope spans multiple orthogonal segmentation dimensions, with cross-tabulated demand data provided for each dimension pair. Coverage extends further to regional breakdowns, trend trajectories, and the competitive detail needed to support segment-level decision-making.

By Coating Function

  • Drug-Eluting and Active Release Coatings
  • Anti-Thrombogenic and Hemocompatible Coatings
  • Antimicrobial Coatings
  • Hydrophilic and Lubricious Coatings
  • Hydrophobic and Anti-Fouling Coatings
  • Passive Barrier and Parylene Coatings

By End-Use Industry

  • Cardiovascular and Neurovascular Devices
  • Peripheral Vascular Intervention
  • Urology and Continence Devices
  • Orthopaedic and Dental Implants
  • General Surgery and Wound Management
  • Extracorporeal and Respiratory Circuits

By Commercial Dimension

  • Formulation Licensing to Device OEMs
  • Contract Coating Application Services
  • Combined Material and Regulatory Packages
  • Analytical and Validation Services
  • Direct Sale to Contract Device Manufacturers

By Region

  • North America
  • Western Europe
  • East Asia
  • South Asia and Pacific
  • Latin America
  • Middle East and Africa
  • Eastern Europe

Scope, Methodology, and Coverage

Every figure in this report is reproducible from documented input assumptions. The scope below maps the historical period, the forecast horizon, the segmentation dimensions, and the countries covered, alongside the underlying primary and qualitative methodology.
Historical Period
2020 to 2025
Forecast Period
2026 to 2036
Base Year
2025 (USD billions; MMA Primary Research Dataset, August 2026)
Market Definition
This report covers functional coatings engineered to modify the surface behaviour of medical devices in patient contact, spanning lubricious, hemocompatible, antimicrobial, drug-eluting, barrier and anti-fouling chemistries, together with the contract application services that deposit them onto device substrates. Coverage includes formulations licensed to device manufacturers and coating work performed on a toll basis by contract application houses. Bulk device polymers, adhesives, printing inks, sterilisation processes, packaging materials and coatings applied to diagnostic consumables outside a patient-contacting pathway are excluded from scope.
Quantitative Units
USD billions at supplier realised prices; coated device volumes in million units; gross margin percentages by portfolio tier.
Segmentation Dimensions
Coating function, end-use device industry, commercial dimension, region.
Regions Covered
North America, Western Europe, East Asia, South Asia and Pacific, Latin America, Middle East and Africa, Eastern Europe
Countries Covered
United States, Canada, Germany, Ireland, United Kingdom, France, Switzerland, Netherlands, China, Japan, South Korea, India, Australia, Brazil, Mexico, Poland, Turkey, Israel, Saudi Arabia, South Africa.
Key Companies Profiled
Surmodics, DSM Biomedical, Specialty Coating Systems, Biocoat, Hydromer, Covalon Technologies, BioInteractions, AST Products, Harland Medical Systems, Freudenberg Medical, and ten further suppliers.
Quantitative Methodology
Primary survey, n=3,800 respondents, Q4 2025, six countries; demand-side model with trade association cross-validation
Qualitative Methodology
47 expert interviews, Q4 2025; applied to validate demand model assumptions, identify emerging dynamics, and assess competitive positioning
Report Format
PDF and XLSX data workbook (Word format preview document)
Publisher
Market Minds Advisory
Report Code
MMA-2026-MED-683
Published
August 2026
Contact
sales@marketmindsadvisory.com | www.marketmindsadvisory.com

Purchase the full Medical Coatings Market Report (2026 to 2036).

The full report sets out ten-year forecasts for medical coatings by function, end-use device industry and commercial model across seven regions, with the segment and regional detail behind every figure in this summary. It quantifies requalification cost and timeline exposure across coating chemistries, and maps validated contract application capacity against forecast device programme demand through 2030. Competitive assessment covers twenty suppliers on a consistent revenue basis, and portfolio economics are broken out by tier with gross margin ranges calibrated to disclosed segment performance. Findings draw on a quantitative survey of 3,800 respondents across six countries and 47 expert interviews conducted in the fourth quarter of 2025.
Ten-year forecasts by coating function and region
Requalification cost and timeline exposure modelling
Validated application capacity mapped against programme demand
Twenty-supplier competitive assessment on consistent revenue basis
Portfolio margin architecture across three commercial tiers
Input cost composition and volatility exposure by supplier type

Built For The People Who Decide

From boardroom strategy to bench-side execution, this report is read cover-to-cover by leaders shaping the next decade of their industry, turning demand scenarios, market dynamics and valuation benchmarks into decisions.
CXOs/ Presidents/ VPs/ Managers
M&A and Corporate Development
Strategy Teams and R&D Heads
Procurement and Product Directors
Regulatory and Compliance Leaders
Investor Relations and Equity Analysts