Market Minds Advisory
Medical Billing Outsourcing Market

Medical Billing Outsourcing Market: Medical Billing Outsourcing Market. Revenue Cycle Automation Reshapes Provider Economics

Hospitals and physician groups are outsourcing medical billing and revenue cycle management to specialized vendors deploying AI-assisted coding, as staffing shortages and payer denial complexity strain in-house billing operations nationwide.

Lead Analyst

Published

September 2026

Make Smarter Decisions with Customized Research Insights

Request a free sample report and evaluate market opportunities, growth trends, and competitive dynamics relevant to your business needs.

2025 MARKET VALUE$15.8BMarket Size 2025
2036 FORECAST VALUE$52.3BBase Case , 2026 to 2036
CAGR 2026 TO 203611.5 %Bull 12.8% / Bear 10.2%
INCREMENTAL OPPORTUNITY$34.7BNet 10- year value creation
EXPANSION MULTIPLE2.97x2036 value over 2026 base
Strategic Levers
M&A Pipeline
Regional Outlook
Country Rankings
Competitive Intelligence
Segmental Deep-dive
Call-Us : 91 93563 13602

Executive Snapshot and Market Trajectory.

Provider organizations are outsourcing medical billing at an accelerating pace as denial rates climb and in-house coding staff shortages persist, pushing revenue cycle management toward specialized external vendors capable of absorbing volume spikes without proportional headcount increases across every department, specialty, care setting, and payer mix combination.
AI-assisted medical coding services are growing fastest as natural language processing tools extract billable codes directly from clinical documentation with far less manual review than traditional coding workflows require across every specialty. Hospital systems drive the largest current share of outsourcing spend, reflecting their disproportionate exposure to complex multi-payer claim volumes and specialty billing requirements across dozens of clinical departments, service lines, and physician specialties nationwide, spanning both inpatient and outpatient settings.
Competitive intensity is rising as legacy billing outsourcers add AI coding capability while specialized revenue cycle technology vendors compete on genuine automation depth and payer-specific denial management expertise rather than headcount scale alone or geographic reach and coverage. Data security requirements under HIPAA are shaping which vendors can credibly win enterprise hospital system contracts without extensive compliance documentation, audit history, and demonstrated breach-free operational track records.
Market Definition
This market covers outsourced medical coding, claims submission, denial management, and revenue cycle management services provided by third-party vendors to hospitals, physician groups, and other healthcare providers. It excludes in-house billing department software licensing and general healthcare IT consulting services unrelated to revenue cycle operations.
Base Year Value
$15.8B in 2025 (MMA Primary Research Dataset, September 2026)
Forecast Period
2026 to 2036, eleven discrete annual values
CAGR
11.5% base case. Bull 12.8%. Bear 10.2%.
Fastest Growth Segment
AI-Assisted Medical Coding Services: 16.0% CAGR
Fastest Growth Country
India: 14.5% CAGR
Fastest Growth Region
South Asia and Pacific: 13.5% CAGR
Largest Region
North America: 43% of 2025 global value
Market Leaders
R1 RCM, Optum360, Conifer Health, Waystar, athenahealth
Primary Survey
n=3,800 procurement and R&D decision-makers, Q4 2025, six countries
Methodology
Demand-side build-up, cross-validated against public data, 47 expert interviews

Medical Billing Outsourcing Market Forecast Scenarios

medical-billing-outsourcing-market-size-forecast-scenario-1788503278140
Medical billing outsourcing demand between 2020 and 2025 grew steadily as payer denial rates climbed and provider organizations struggled to retain experienced in-house coding staff amid broader healthcare labor shortages. The pandemic accelerated adoption of remote billing operations, and demand held up well through subsequent years as payer contract complexity and prior authorization requirements continued expanding across most major insurance plans nationwide.
The base case assumes continued expansion driven by three commercial mechanisms: provider organizations shifting billing operations to specialized vendors as denial management complexity exceeds in-house staff capacity, AI-assisted coding tools reducing per-claim processing cost enough to justify outsourcing even for smaller physician groups previously handling billing internally, and health system consolidation concentrating billing volume with vendors capable of serving multi-facility enterprise contracts. Value-based care contract administration is also creating new outsourcing demand beyond traditional fee-for-service billing.
A bull scenario centers on accelerated AI coding adoption that meaningfully compresses per-claim processing cost, making outsourcing attractive even to previously reluctant large health systems with substantial in-house billing staff. The bear risk is provider organizations building comparable AI coding capability internally, which would slow the outsourcing shift that currently drives most vendor revenue growth.

Where Automation Meets Denial Management Complexity

Medical billing outsourcing sits at the intersection of healthcare administration and business process automation, letting provider organizations convert a fixed in-house cost center into a variable, performance-linked vendor relationship tied directly to collection outcomes and denial resolution rates. The category expanded from basic claims submission into comprehensive revenue cycle management spanning coding, denial appeals, and patient billing communication across every care setting and specialty.
MARKET CONCENTRATIONCR5 32%Top five vendors hold a moderate combined revenue share
AVERAGE DENIAL RATE~10 to 12%Typical share of initial claims denied by payers currently
TOP CLIENT COUNTRY SHAREUnited States leadsSingle country contributes the largest share of billed claims
OFFSHORE DELIVERY SHARE~55% of volumePortion of processing work delivered through offshore coding teams
CODING AUTOMATION RATE~35% AI-assistedShare of coding work completed using automated extraction tools
CLIENT CONTRACT RENEWAL RATE~90% annuallyShare of existing client contracts renewed at each cycle
AI-assisted coding tools increasingly substitute for manual chart review, extracting billable codes directly from clinical documentation with meaningfully faster turnaround than traditional coder-driven workflows relying on trained human reviewers working case by case. Vendor differentiation increasingly depends on payer-specific denial pattern knowledge rather than raw coding throughput alone, since denial prevention captures more revenue than faster initial submission timelines ever could achieve alone.
Competitive advantage increasingly rests on integration depth with electronic health record systems and payer connectivity breadth rather than headcount scale alone, since reliable data flow between systems reduces the manual intervention that drives per-claim processing cost upward over time. Vendors lacking demonstrated HIPAA compliance history face growing difficulty winning large hospital system contracts requiring extensive security audits and vendor risk assessments beforehand.
"The vendors winning share now are not the cheapest, they are the ones that can prove their AI actually reduces denials. Everyone claims automation, but denial rate data does not lie."
Principal Analyst, Healthcare Revenue Cycle and Administrative Technology Practice · MMA Outsourced Medical Coding Practice · September 2026

Market Trends

AI Extracts Billable Codes Directly From Clinical Notes

Natural language processing tools now extract billable diagnosis and procedure codes directly from physician clinical documentation, reducing the manual chart review burden that traditionally consumed the majority of a coder's working time on each claim. Vendors like Waystar and athenahealth have integrated these tools into their coding workflows, cutting average per-claim processing time meaningfully compared to fully manual coding approaches used just a few years earlier. This shift matters because it lets vendors handle rising claim volume without proportional headcount growth, improving margin structure while also reducing the coding errors that trigger costly payer denials and rework cycles.
Market Impact: Denial rates up 8 percent

Denial Prediction Tools Flag Claims Before Submission

Predictive denial management tools increasingly flag claims likely to be denied before submission, letting billing teams correct documentation gaps or coding errors proactively rather than managing denials reactively after payer rejection. This shift toward prevention rather than appeal meaningfully improves first-pass claim acceptance rates, directly increasing provider cash flow speed and reducing the administrative cost of managing denial appeals after the fact. Vendors offering demonstrated denial prediction accuracy increasingly win client contracts based on measurable first-pass acceptance rate improvements documented during pilot engagements with prospective hospital system clients. Payers increasingly reward vendors with lower denial rates through preferred processing terms.
Market Impact: Vacancy rates exceed 12 percent

Market Opportunities and Growth Drivers

Payer Denial Rates Continue Climbing Industry-Wide

Payer claim denial rates have climbed steadily across most major insurance plans, driven by increasingly complex prior authorization requirements and stricter documentation standards that in-house billing staff often struggle to satisfy consistently across every claim submitted. Provider organizations facing rising denial rates increasingly conclude that specialized outsourced vendors with dedicated denial management expertise can recover more revenue than in-house teams stretched across too many competing administrative priorities. This dynamic directly drives outsourcing demand growth even among larger health systems that previously kept billing entirely in-house for cost control reasons. Larger vendors with deep denial databases capture more of this shift.
Market Impact: Adds 3 to 6 months

Coding Staff Shortages Push Providers Toward Vendors

Certified medical coder shortages have intensified across the United States, making it increasingly difficult and expensive for provider organizations to staff in-house billing departments at the levels required to keep pace with claim volume growth and increasing coding complexity requirements across every specialty and department. Outsourced vendors solve this staffing constraint by drawing on centralized, scalable coder pools spanning multiple countries, letting client provider organizations avoid the recruitment and retention challenges that increasingly plague in-house billing department staffing efforts nationwide, particularly in rural and smaller markets. Rural hospital shortages compound this pressure across many underserved regions.
Market Impact: Could reduce addressable market by 10pp

Market Restraints and Challenges

Data Security Concerns Limit Offshore Delivery Adoption

Provider organizations increasingly hesitate to send protected health information to offshore billing operations, particularly amid heightened regulatory scrutiny of cross-border data handling practices and rising concern about potential breach liability under HIPAA enforcement actions. The root cause is that offshore data security standards and enforcement mechanisms vary considerably by country, creating genuine uncertainty about liability allocation when a data breach occurs at an offshore vendor facility outside direct United States regulatory jurisdiction. This concern slows offshore vendor selection for larger, more risk-averse hospital systems specifically. Some vendors are mitigating this by expanding domestic onshore delivery capacity as an alternative option.
Market Impact: Cuts processing time 40 percent

In-House AI Coding Tools Threaten Outsourcing Demand

Large health systems with substantial capital budgets are increasingly building in-house AI coding capability rather than outsourcing to third-party vendors, potentially slowing the outsourcing growth trajectory that currently drives most vendor revenue expansion industry-wide. The root cause is that AI coding technology has become accessible enough that well-resourced health systems no longer need external vendor expertise to achieve meaningful automation benefits previously available only through specialized outsourcing relationships. This trend concentrates most remaining outsourcing demand among smaller and mid-sized providers lacking comparable capital resources. Vendors are mitigating this by emphasizing denial management expertise that pure coding automation alone cannot replicate.
Market Impact: Improves first-pass acceptance by 15 percent
3 additional market trends, 4 additional growth drivers, and 2 additional restraints and challenges are covered in the full report. Contact sales@marketmindsadvisory.com to access the complete intelligence.

Segment CAGR and Growth Architecture

Medical billing outsourcing segments by the specific service function performed, spanning medical coding, claims submission and clearinghouse management, denial management and appeals, patient billing and collections, credentialing services, and full end-to-end revenue cycle management bundled across the entire billing lifecycle from initial patient registration through final account resolution, closeout, and long-term archival record keeping.
medical-billing-outsourcing-market-market-share-analysis-1788503278730

AI-Assisted Medical Coding Services

AI-assisted medical coding services use natural language processing to extract billable diagnosis and procedure codes directly from clinical documentation, reducing manual coder review time while improving coding accuracy and consistency across large claim volumes handled daily. Growth outpaces the broader market because AI tools deliver measurable cost savings per claim that justify vendor switching even for provider organizations satisfied with existing manual coding relationships, creating genuine competitive displacement pressure across the entire outsourcing category. Vendors without demonstrated AI coding capability increasingly struggle to win new client contracts against competitors offering faster turnaround and lower per-claim pricing built on automation. Health systems increasingly evaluate coding vendors on documented accuracy metrics rather than simple per-claim price comparisons.
CAGR 16.0%

Denial Management and Appeals Services

Denial management and appeals services help provider organizations recover revenue from initially rejected claims through corrected resubmission, formal appeals, and payer negotiation processes requiring specialized knowledge of payer-specific denial patterns and appeal procedures. This segment grows nearly as fast as AI coding because rising payer denial rates directly increase the addressable volume of claims requiring specialized recovery expertise that in-house billing staff often lack bandwidth to pursue thoroughly. Vendors with the deepest payer-specific denial pattern databases increasingly differentiate on measurable recovery rate improvements rather than processing speed alone, capturing premium pricing for demonstrated appeal success rates. Larger hospital systems increasingly bring the most complex, highest-value denial cases to specialized third-party appeal specialists.
CAGR 14.0%
Full segment breakdown across 6 segments available in the complete report.

Regional Architecture and Country Demand Map

North America dominates given the complexity of the United States multi-payer insurance system, extensive HIPAA compliance requirements, and the sheer scale of American healthcare spending, while South Asia and Pacific posts the fastest growth as offshore delivery capacity expands rapidly to serve rising global demand.

North America

The United States accounts for a disproportionate share of global medical billing outsourcing demand because its fragmented, multi-payer private insurance system generates billing complexity that few other national healthcare systems approach, justifying a regional share well above the standard band for this market specifically. R1 RCM, Optum360, and Conifer Health all maintain substantial domestic operations serving American hospital systems navigating this payer complexity directly. HIPAA compliance requirements also concentrate demand toward vendors with demonstrated domestic regulatory expertise, favoring established American vendors over newer international entrants lacking comparable compliance track records. Canada contributes a smaller share, reflecting its single-payer system's comparatively lower billing complexity relative to its southern neighbor. Mexico contributes marginally to this grouping given its distinct healthcare financing structure.
Share: 43% | CAGR: 11.8% (2026 to 2036)

Western Europe

European countries with national single-payer or heavily regulated multi-payer healthcare systems generate meaningfully less billing complexity than the American market, reducing outsourcing demand intensity even as administrative burden remains a genuine concern for providers. Germany and the United Kingdom show the most developed outsourcing markets regionally, reflecting their larger private healthcare sectors operating alongside national health systems. Growth trails North America and East Asia considerably, reflecting the structurally simpler billing environment that most European national health systems maintain compared to the American model. France and the Nordic countries contribute smaller shares, reflecting comparably simple national billing environments across their systems. Regional vendors increasingly position toward specialized private-sector billing niches rather than broad market coverage.
Share: 18% | CAGR: 9.8% (2026 to 2036)
Regional intelligence for 5 additional markets available in the complete report: East Asia, South Asia and Pacific, Latin America, Middle East and Africa, Eastern Europe. Contact sales@marketmindsadvisory.com.
medical-billing-outsourcing-market-country-cagr-analysis-1788503279292

Where Billing Vendors Build Lasting Client Value

Beyond per-claim processing fees, medical billing vendors build durable revenue through mechanisms that deepen client dependency and demonstrate measurable financial outcomes over multi-year contract relationships, rewarding vendors that invest early in denial prediction accuracy, payer connectivity breadth, and outcome-based pricing structures rather than pure headcount-driven capacity expansion across every client segment and geography served.

Structuring Contracts Around Performance-Based Collection Fees

Vendors increasingly structure client contracts around a percentage of collected revenue rather than flat per-claim processing fees, aligning vendor incentives directly with client financial outcomes rather than transaction volume alone. This performance-based pricing model typically commands a 3 to 6 percent fee on net collections, meaningfully higher than comparable flat-fee arrangements once denial recovery performance is factored into total vendor compensation. Clients increasingly prefer this model because it removes the incentive for vendors to prioritize submission speed over collection accuracy, better aligning long-term interests across the relationship. This structure also strengthens client retention meaningfully once collection performance data accumulates.
Market Impact: Performance fees reach 3 to 6 percent typically

Selling Denial Prediction Analytics as a Standalone Product

Vendors with proven denial prediction accuracy increasingly license that analytics capability as a standalone software product to provider organizations that keep billing operations in-house but want the predictive intelligence layer without full outsourcing. This software licensing revenue carries margins 20 to 30 percentage points higher than labor-intensive processing services, since the underlying technology investment is already amortized across the vendor's existing client base. Early licensing deals have expanded vendor total addressable market beyond pure outsourcing relationships into a broader software revenue category entirely. This model lets vendors monetize technology investment beyond their traditional labor-based service delivery footprint.
Market Impact: Software licensing adds 8 to 10pp margin annually

Expanding Into Patient Financial Engagement Services

Vendors are expanding beyond payer-facing billing into patient-facing financial engagement services, including payment plan administration, financial counseling, and patient communication automation that captures additional revenue from the same underlying client relationship. This expansion capitalizes on rising patient financial responsibility as high-deductible health plans shift more payment burden directly onto patients rather than insurers, creating genuine demand for specialized patient billing communication expertise. Vendors offering this bundled service increasingly win contracts worth 20 to 25 percent more than payer-facing billing alone. Larger health systems increasingly favor a single vendor covering both payer and patient billing functions.
Market Impact: Patient services add roughly 15 percent to contracts

Building Proprietary Payer Connectivity and Data Assets

Vendors that build proprietary payer connectivity infrastructure and accumulate proprietary denial pattern data across thousands of client claims create a data asset that smaller competitors entering the market cannot easily replicate without years of accumulated transaction history. This data advantage compounds over time, since more claims processed means more denial patterns learned, directly improving the predictive accuracy that increasingly differentiates vendor offerings in competitive sales situations. Larger vendors with the deepest historical claims databases, often spanning 10 or more years of data, command premium pricing over newer entrants. Smaller vendors struggle to compete on accuracy without comparable claims volume history.
Market Impact: Data scale advantage compounds meaningfully over 5 or more years

Who Controls the Margin Pool

Concentration among the top five medical billing outsourcing vendors sits at roughly thirty-two percent, moderate for a category still fragmented across hundreds of regional and specialty-focused providers. R1 RCM and Optum360 lead on hospital system contract breadth, but the gap separating them from mid-tier challengers like Waystar remains narrow enough that a strong AI coding launch could shift rankings within one renewal cycle.
Current competitive activity centers on AI coding capability expansion and denial prediction accuracy improvement, since both directly drive the measurable financial outcomes that increasingly determine contract renewal decisions. Several vendors have also launched patient financial engagement service lines, bundling payer-facing and patient-facing billing functions into a single comprehensive contract offering. Denial prediction accuracy has become a key differentiator vendors highlight in new client sales pitches.

Emerging pressure comes from large health systems building in-house AI coding capability, threatening vendors without clearly differentiated denial management expertise beyond basic automation. Ranking shifts are most likely among mid-tier vendors lacking either proprietary claims data depth or demonstrated performance-based pricing track records, since both dimensions increasingly separate durable market leaders from vulnerable smaller competitors. Vendors with performance-based pricing increasingly win contracts against flat-fee incumbents unable to match this alignment.
medical-billing-outsourcing-market-company-positioning-matrix-1788503279819

Competitive Moat and Risk Dimensions

R1 RCM

Moat: Broad Hospital System Contracts

R1 RCM maintains the broadest portfolio of large hospital system revenue cycle management contracts among independent vendors, giving it substantial claims volume and accumulated denial pattern data that smaller competitors cannot easily match without years of comparable client relationship building. This scale advantage compounds each year as accumulated claims history further sharpens predictive accuracy.
R1 RCM

Risk: Client Concentration Risk

R1 RCM's revenue remains concentrated among a relatively small number of large hospital system clients, exposing the company to meaningful revenue impact if even one major client relationship ends or gets renegotiated on less favorable terms. Diversifying the client base across a broader mix of mid-sized health systems would reduce this exposure meaningfully.
OPTUM360

Moat: Parent Company Payer Integration

Optum360's affiliation with UnitedHealth Group's broader payer operations gives it unusual visibility into payer-side claims processing logic, potentially improving denial prediction accuracy in ways that independent competitors lacking comparable payer relationships cannot replicate. This integration advantage becomes especially valuable when negotiating payer contract terms on behalf of provider clients.
OPTUM360

Risk: Conflict of Interest Perception

Optum360's parent company relationship with a major payer creates perceived conflict of interest concerns among some provider clients, who worry that billing decisions could favor parent company interests over client financial outcomes in subtle ways. Optum360 has attempted to address this perception through transparent reporting and independent client advisory arrangements.

Players Tracked

Prominent Players

R1 RCM
Optum360
Conifer Health
Waystar
athenahealth

Other Key Players

Cognizant (TriZetto)
GeBBS Healthcare Solutions
AGS Health
Access Healthcare
Omega Healthcare
MRO Corporation
CareCloud
Kareo
AdvancedMD
Ensemble Health Partners
Parallon
Vee Technologies
Firstsource Solutions
IKS Health
Invensis

Recent Developments

FEBRUARY 2026

R1 RCM Launches AI-Powered Denial Prediction Platform

R1 RCM launched a new AI-powered denial prediction platform designed to flag high-risk claims before submission, extending its existing revenue cycle management offering with a proactive rather than reactive denial management approach. The platform represents an internal product development effort rather than an acquisition of external technology.
Signal: Signals continued vendor investment in prevention-focused denial management technology capability well ahead of key competitors industry-wide
NOVEMBER 2025

Waystar Acquires Patient Financial Engagement Software Startup

Waystar acquired a smaller patient financial engagement software startup to expand its patient-facing billing communication and payment plan administration capability beyond its existing payer-facing claims processing core business. The acquisition brought in proprietary patient communication technology that Waystar plans to integrate across its existing client base.
Signal: Demonstrates the patient engagement expansion pattern this report identifies as a key durable revenue lever for vendors
AUGUST 2025

Conifer Health Signs Multi-Year Contract With Regional System

Conifer Health signed a multi-year revenue cycle management contract with a large regional hospital system covering coding, claims submission, and denial management across the system's entire multi-facility network. The agreement is a service contract rather than an acquisition or joint venture between the two organizations.
Signal: Extends an established vendor's reach into a large regional multi-facility hospital network relationship and broader territory

Labor and Technology Cost Exposure

Medical billing outsourcing cost structures are dominated by skilled labor for coding and denial management staff, along with cloud computing and AI model training expense for automated coding tools, rather than physical materials or manufacturing inputs. Offshore coding labor in India and the Philippines represents a meaningful cost advantage, though rising wage inflation in these established delivery hubs is gradually narrowing that advantage over time.
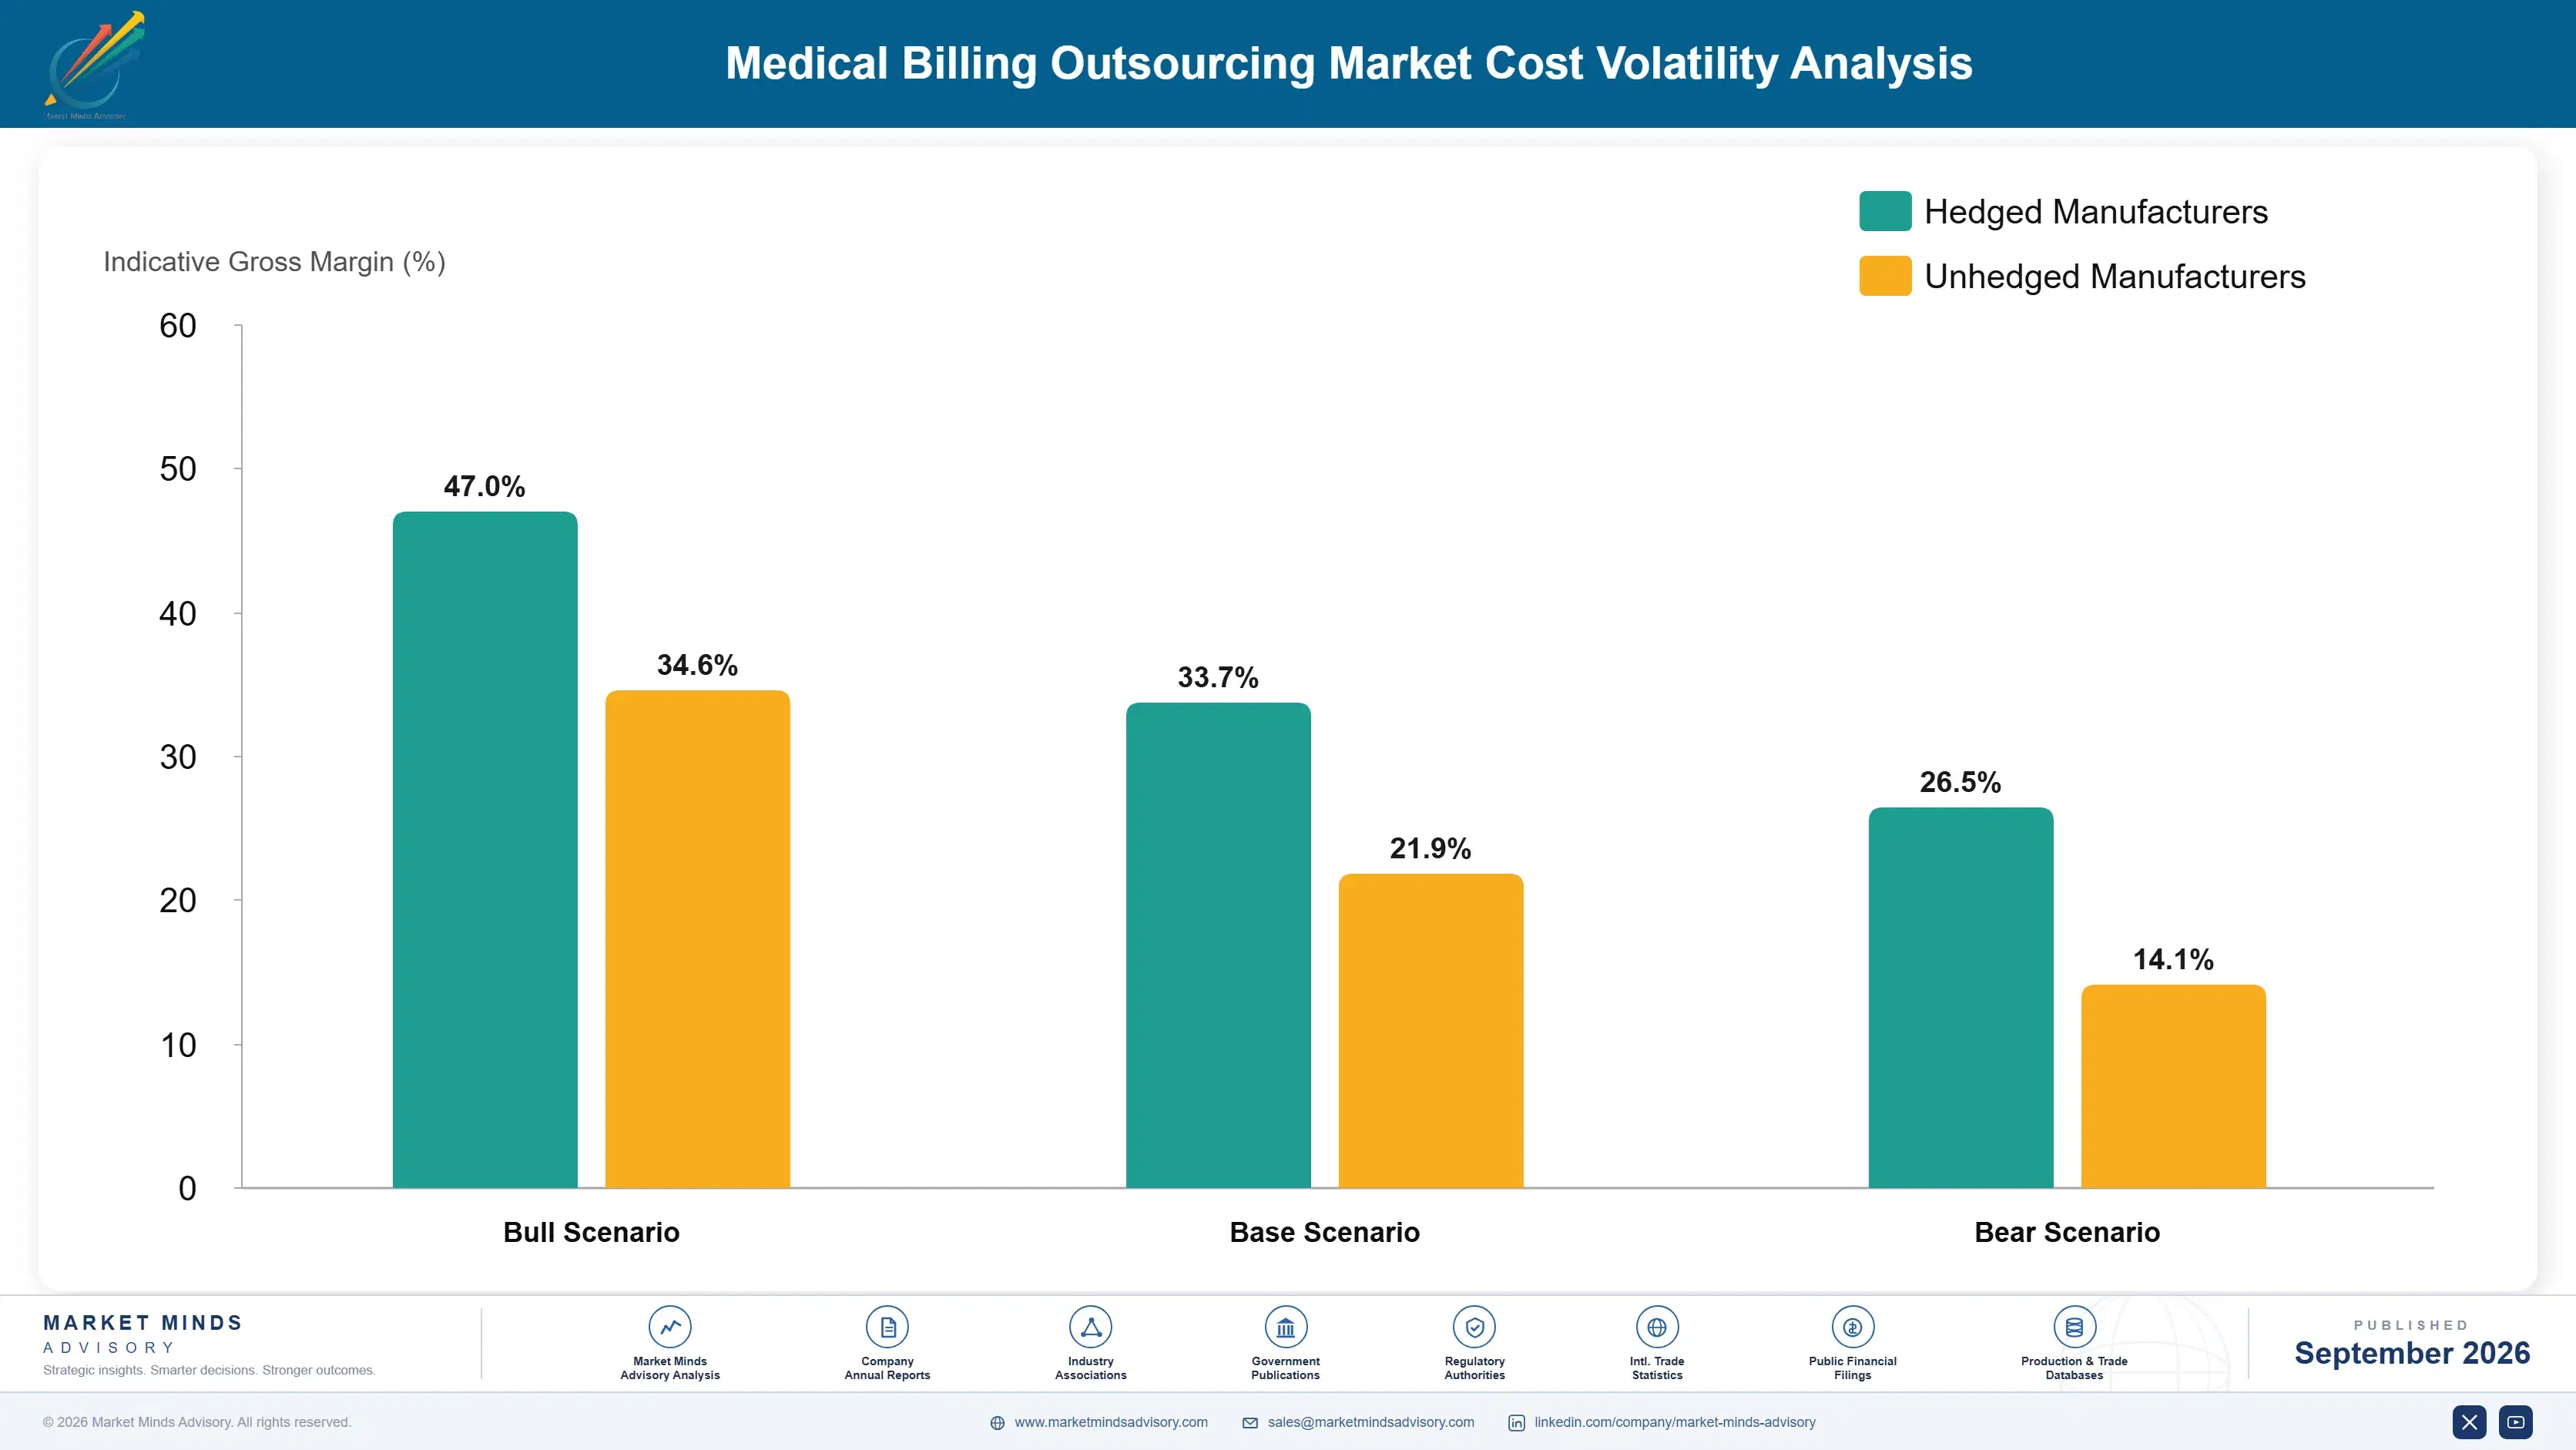
Skilled coder wage inflation in India accelerated meaningfully during 2023 and 2024 as demand for experienced medical coders outpaced available domestic supply, according to industry compensation surveys and vendor annual reports discussing rising delivery center operating costs across the sector. Vendors without diversified delivery locations absorbed a larger share of this wage pressure directly, while others expanded into secondary delivery cities offering somewhat lower labor cost structures.

Smaller vendors lacking geographic delivery diversification face a genuine competitive disadvantage versus larger competitors able to shift work across multiple lower-cost delivery locations as wage pressure emerges in any single market. This exposure varies by player type: vendors with established multi-country delivery networks absorbed the 2023 to 2024 wage inflation more smoothly than smaller regional competitors concentrated in a single delivery location.
medical-billing-outsourcing-market-cost-volatility-analysis-1788503280032

Diversify Delivery Operations Across Multiple Countries

Vendors are diversifying coding and processing operations across multiple countries beyond traditional India and Philippines hubs, reducing exposure to any single labor market's wage inflation while maintaining service quality standards across newly added delivery locations. These transitions typically require twelve to eighteen months to reach full maturity. Multi-country presence also provides useful continuity coverage during regional disruptions.

Invest in AI to Reduce Labor Intensity

Vendors are investing in AI-assisted coding tools specifically to reduce the labor intensity of routine coding tasks, letting existing staff handle higher claim volumes without proportional headcount growth as wage costs continue climbing steadily. This investment also improves coding accuracy, reducing rework costs that erode labor savings. Vendors report meaningful efficiency gains within the first year of deployment.

Negotiate Multi-Year Fixed-Rate Client Contracts

Vendors are negotiating multi-year client contracts with built-in rate adjustment clauses tied to published wage indices, converting unpredictable labor cost exposure into a more manageable, contractually anticipated expense that simplifies internal financial planning considerably. Clients generally accept these clauses since predictable pricing benefits their own budgeting processes. Larger vendors with stronger negotiating positions secure more favorable terms than smaller competitors.

Portfolio Architecture for Margin Defence

Portfolio economics across medical billing outsourcing vendors split between high-volume basic claims processing services competing largely on per-claim price, and specialized denial management or performance-based revenue cycle contracts commanding meaningfully higher margins given demonstrated financial outcome improvements delivered to demanding hospital system clients across every specialty, department, and payer relationship served nationwide today, from small physician practices to large academic medical centers.
The tension between volume and premium positioning shows clearly in contract structure: basic claims processing competes on low per-transaction pricing, while performance-based and comprehensive revenue cycle contracts command substantially higher effective margins justified by measurable collection rate improvements that basic processing alone cannot demonstrate to skeptical hospital system finance leadership evaluating vendor renewal decisions each and every contract cycle.

High-value margin pools concentrate around performance-based pricing contracts and patient financial engagement services, both requiring proprietary data assets and specialized expertise that smaller vendors cannot easily replicate without years of accumulated client relationship history and claims volume. Vendors positioned purely as low-cost claims processors will struggle to capture this premium tier without meaningful, sustained investment in denial prediction analytics and outcome-based contracting capability over time.

Volume / Commodity-Adjacent

Basic claims submission and coding services competing largely on per-claim price against similar undifferentiated vendors, with thin margins typical of high-volume commodity service delivery facing constant price pressure from offshore labor cost competition.
Gross Margin: 15-25%

Premium / Certified

AI-assisted coding and denial prediction services sold to hospital systems willing to pay for measurable accuracy improvement and faster claim turnaround times beyond what basic manual coding services can reliably deliver at scale.
Gross Margin: 30-40%

Sustainability / Regulatory / Next-Generation

Performance-based pricing contracts and patient financial engagement services requiring proprietary data infrastructure that smaller vendors cannot easily replicate quickly or affordably, commanding the category's strongest and most defensible margin position available today.
Gross Margin: 35-50%
medical-billing-outsourcing-market-portfolio-architecture-1788503280547

High-value Sub-segments and Strategic Watch-out

AI-Assisted Medical Coding Services

The fastest-growing, highest-value segment as natural language processing tools deliver measurable per-claim cost savings that justify vendor switching across the entire outsourcing category, letting vendors handle rising claim volume without proportional headcount growth or margin compression, even as demand accelerates rapidly across every specialty and care setting.
Gross Margin: 30-40%

Performance-Based Pricing Contracts

High-value and steadily growing as hospital systems increasingly prefer collection-percentage pricing that aligns vendor incentives directly with their own financial outcomes and cash flow, rewarding vendors that can demonstrate consistent, measurable collection rate improvements over time and across every payer category and claim type served.
Gross Margin: 35-50%

Basic Claims Submission Services

The volume core of the market, generating steady per-claim revenue but facing margin pressure from increasingly capable in-house AI coding tools at large health systems, requiring efficient operations to sustain acceptable margins as competition intensifies across every geography, specialty, and provider size segment tracked here.
Gross Margin: 15-25%

In-House AI Coding Adoption

A strategic watch-out category where large, well-capitalized health systems building comparable AI coding capability internally could meaningfully slow outsourcing demand growth over time, potentially concentrating remaining vendor demand among smaller and mid-sized providers lacking comparable capital resources, technical expertise, and internal data science talent pools.
Gross Margin: N/A, internal

How Billing Contracts Compound Client Value

Revenue cycle management contracts function like an annuity once a vendor demonstrates measurable collection improvement, since switching vendors mid-relationship risks disrupting the payer connectivity integrations and coding workflows built up over months of implementation, a real switching cost that grows every year a client relationship continues successfully without significant service disruption, performance decline, or staff turnover on either side of the relationship.
Adoption stickiness varies by end-use vertical: large hospital systems show the deepest lock-in given complex multi-specialty billing integration requirements spanning dozens of departments, while smaller physician practices switch more readily given simpler billing needs and lower integration switching costs that make vendor comparison shopping considerably easier for practice administrators managing tighter operating budgets and fewer competing priorities day to day.

Generational shifts in healthcare administration are reshaping buyer profiles, as newer practice administrators and hospital revenue cycle leaders entering the field now expect AI-assisted automation as a baseline vendor capability rather than a premium add-on feature reserved for the largest, most sophisticated health systems only. This mindset shift accelerates vendor evaluation cycles considerably compared to prior administrator generations accustomed to slower, more conservative procurement processes.
medical-billing-outsourcing-market-end-use-penetration-index-1788503281039

MMA Verdict on Billing Outsourcing

These are among the four positions where our research anticipates prominent divergence between winners and laggards over the coming forecast period. Each is grounded in the demand model, the regulatory perimeter, and the announced capacity pipeline.
01 / AI CODING INVESTMENT

Prioritize AI coding accuracy over raw processing scale

Vendors treating AI coding as a marketing feature rather than a genuine accuracy improvement will lose ground to competitors that can demonstrate measurable reductions in coding errors and denial rates through documented client results across multiple contract renewal cycles. Investing in AI coding accuracy compounds over time as accumulated claims data improves predictive performance, creating a durable advantage that pure headcount scale cannot easily replicate without comparable data volume. Vendors should prioritize this investment ahead of geographic expansion or headcount growth alone.
02 / PERFORMANCE PRICING SHIFT

Transition clients toward performance-based collection pricing

Vendors relying entirely on flat per-claim fees leave meaningful revenue on the table compared to competitors capturing a percentage of improved collections through performance-based contract structures tied directly to measurable client outcomes. This pricing model aligns vendor and client incentives directly around financial outcomes rather than transaction volume, strengthening client retention as collection performance data accumulates over successive contract renewal cycles and years of relationship history. Sales teams should introduce this pricing option proactively rather than waiting for client requests.
03 / DELIVERY DIVERSIFICATION STRATEGY

Diversify delivery locations to manage wage inflation risk

Vendors concentrated in a single offshore delivery hub face meaningful wage inflation exposure that diversified competitors operating across multiple countries can absorb more easily without disrupting client service quality, accuracy, or turnaround times during periods of local labor market tightness. Building secondary delivery locations requires upfront investment in training and infrastructure, but the wage cost stability and business continuity benefits compound meaningfully over a multi-year operating horizon that outlasts any single wage inflation cycle. Vendors delaying this diversification risk losing cost competitiveness to better-positioned rivals already established.
04 / PATIENT ENGAGEMENT EXPANSION

Expand into patient financial engagement as a bundled offering

Vendors offering payer-facing billing alone increasingly lose comprehensive contracts to competitors bundling patient financial engagement services that address the growing share of provider revenue now collected directly from patients under high-deductible health plans nationwide and across every provider type. This bundled positioning captures additional revenue from the same underlying client relationship while making vendor switching considerably more disruptive for clients to contemplate given the operational complexity involved. Vendors delaying this expansion risk losing ground to more comprehensive competitors already active in the market.

Engagement Snapshot From the Field

A live engagement with an industry participant carrying material or product regulatory and market exposure ahead of a defining policy shift, showing how our research translates into a defensible multi-year portfolio strategy.
MARKET MINDS ADVISORY · CLIENT ENGAGEMENT SUMMARY
Medical Billing Outsourcing Producer Strategic Portfolio Review and Transition Roadmap 2026·Investment Scenario on Medical Billing Outsourcing Exposure Evaluation 2025-26
CLIENT PROFILE
The client is a multi-specialty physician group with twelve locations, previously managing medical billing entirely in-house but facing rising denial rates and staff turnover that increasingly delayed claim submission and revenue collection across the practice. The company had never outsourced revenue cycle functions before and needed guidance on vendor selection, transition planning, and expected cost and performance outcomes.
STRATEGIC CHALLENGE
Leadership needed to select a billing outsourcing vendor capable of reducing denial rates and accelerating collections, without disrupting existing patient billing relationships or creating a lengthy transition period that could temporarily worsen cash flow during the changeover from in-house billing operations to an external vendor relationship spanning multiple clinical departments.
MMA APPROACH
MMA conducted a structured vendor evaluation across five revenue cycle management vendors, assessing denial prediction accuracy, specialty-specific coding expertise, and pricing structure against the client's existing claim volume and payer mix, supplementing vendor-provided data with reference calls to comparable existing multi-specialty physician group clients already using each evaluated vendor's services.
KEY FINDINGS
  1. Three of five evaluated vendors lacked demonstrated coding expertise across all of the client's clinical specialties, requiring supplemental specialty-specific training investment before full deployment.
  2. Performance-based pricing vendors quoted meaningfully lower effective cost per collected dollar than flat-fee competitors once projected denial reduction was factored into total pricing.
  3. Vendors with dedicated denial prediction technology demonstrated measurably faster first-pass claim acceptance rates during reference client interviews conducted as part of the evaluation.
  4. The selected vendor's onboarding timeline was shorter than competing vendors, reducing the cash flow disruption risk during the transition period considerably for the client.
CLIENT PROFILE
The client is a multi-specialty physician group with twelve locations, previously managing medical billing entirely in-house but facing rising denial rates and staff turnover that increasingly delayed claim submission and revenue collection across the practice. The company had never outsourced revenue cycle functions before and needed guidance on vendor selection, transition planning, and expected cost and performance outcomes.
STRATEGIC CHALLENGE
Leadership needed to select a billing outsourcing vendor capable of reducing denial rates and accelerating collections, without disrupting existing patient billing relationships or creating a lengthy transition period that could temporarily worsen cash flow during the changeover from in-house billing operations to an external vendor relationship spanning multiple clinical departments.
MMA APPROACH
MMA conducted a structured vendor evaluation across five revenue cycle management vendors, assessing denial prediction accuracy, specialty-specific coding expertise, and pricing structure against the client's existing claim volume and payer mix, supplementing vendor-provided data with reference calls to comparable existing multi-specialty physician group clients already using each evaluated vendor's services.
KEY FINDINGS
  1. Three of five evaluated vendors lacked demonstrated coding expertise across all of the client's clinical specialties, requiring supplemental specialty-specific training investment before full deployment.
  2. Performance-based pricing vendors quoted meaningfully lower effective cost per collected dollar than flat-fee competitors once projected denial reduction was factored into total pricing.
  3. Vendors with dedicated denial prediction technology demonstrated measurably faster first-pass claim acceptance rates during reference client interviews conducted as part of the evaluation.
  4. The selected vendor's onboarding timeline was shorter than competing vendors, reducing the cash flow disruption risk during the transition period considerably for the client.
RECOMMENDED STRATEGY
Phase 1: Phase one: transition a single high-volume specialty department to the selected vendor to validate performance before expanding practice-wide across all locations. Phase 2: Phase two: expand vendor coverage to remaining specialty departments once initial denial rate and collection timeline metrics clear defined internal thresholds. Phase 3: Phase three: renegotiate contract terms toward performance-based pricing once sufficient collection data accumulates to support outcome-based fee structuring with confidence.
OUTCOME
The client completed its phased vendor transition, reporting a denial rate reduction and faster average collection timeline compared to its prior in-house billing operation across all twelve locations (client-reported, unverified by MMA). Leadership credited the phased rollout with limiting cash flow disruption during the transition period considerably.

Frequently Asked Questions

Foundational context covering the market sizes, CAGR, scope, country, region and competition that inform every finding below. This section is provided to cover basics and most often pre-purchase conversations, answered from the MMA Primary Research Dataset.

What is the current size of the Medical Billing Outsourcing Market?

The Medical Billing Outsourcing Market is valued at 15.8 billion dollars in 2025. It is expected to reach 17.62 billion dollars by 2026 as denial complexity rises.

How large will the Medical Billing Outsourcing Market be by 2036?

The market is projected to reach 52.33 billion dollars by 2036, up from 17.62 billion dollars in 2026. That represents a 2.97 times expansion over the forecast period.

What is the CAGR for the Medical Billing Outsourcing Market 2026 to 2036?

The market is forecast to grow at an 11.5 percent compound annual growth rate between 2026 and 2036. This reflects steady demand tied to rising payer denial complexity.

Which segment is growing fastest?

AI-Assisted Medical Coding Services lead at a 16.0 percent CAGR, roughly 1.39 times the overall market rate. Natural language processing tools are driving this rapid adoption.

Who are the major companies in the Medical Billing Outsourcing Market?

Leading vendors include R1 RCM, Optum360, Conifer Health, Waystar, and athenahealth. Together these five vendors hold an estimated 32 percent combined market share nationwide today.

Which country is growing fastest?

India leads at a 14.5 percent CAGR, driven by its dominant role as the world's largest offshore medical billing delivery hub. Domestic outsourcing demand is also accelerating steadily.

Report Segmentation Architecture

The full report scope spans multiple orthogonal segmentation dimensions, with cross-tabulated demand data provided for each dimension pair. Coverage extends further to regional breakdowns, trend trajectories, and the competitive detail needed to support segment-level decision-making.

By Primary Market Dimension

  • AI-Assisted Medical Coding
  • Claims Submission and Clearinghouse
  • Denial Management and Appeals
  • Patient Billing and Collections
  • Credentialing Services
  • Full Revenue Cycle Management

By End-Use Industry

  • Hospital Systems
  • Multi-Specialty Physician Groups
  • Independent Physician Practices
  • Ambulatory Surgery Centers
  • Behavioral Health Providers

By Commercial Dimension

  • Flat Per-Claim Fee Contracts
  • Performance-Based Collection Pricing
  • Bundled Payer and Patient Billing
  • Standalone Software Licensing

By Region

  • North America
  • Western Europe
  • East Asia
  • South Asia and Pacific
  • Latin America
  • Middle East and Africa
  • Eastern Europe

Scope, Methodology, and Coverage

Every figure in this report is reproducible from documented input assumptions. The scope below maps the historical period, the forecast horizon, the segmentation dimensions, and the countries covered, alongside the underlying primary and qualitative methodology.
Historical Period
2020 to 2025
Forecast Period
2026 to 2036
Base Year
2025 (USD billions; MMA Primary Research Dataset, September 2026)
Market Definition
This market covers outsourced medical coding, claims submission, denial management, and revenue cycle management services provided by third-party vendors to hospitals, physician groups, and other healthcare providers. It excludes in-house billing department software licensing and general healthcare IT consulting services unrelated to revenue cycle operations.
Quantitative Units
USD billions, market share percentages, CAGR percentages
Segmentation Dimensions
Service function type, end-use industry, commercial dimension, region
Regions Covered
North America, Western Europe, East Asia, South Asia and Pacific, Latin America, Middle East and Africa, Eastern Europe
Countries Covered
United States, United Kingdom, Germany, Japan, India, Philippines, China, Brazil, United Arab Emirates, and 30 additional countries across all seven global regions
Key Companies Profiled
R1 RCM, Optum360, Conifer Health, Waystar, athenahealth, and 15 additional vendors
Quantitative Methodology
Primary survey, n=3,800 respondents, Q4 2025, six countries; demand-side model with trade association cross-validation
Qualitative Methodology
47 expert interviews, Q4 2025; applied to validate demand model assumptions, identify emerging dynamics, and assess competitive positioning
Report Format
PDF and XLSX data workbook (Word format preview document)
Publisher
Market Minds Advisory
Report Code
MMA-2026-HLT-162
Published
September 2026
Contact
sales@marketmindsadvisory.com | www.marketmindsadvisory.com

Purchase the full Medical Billing Outsourcing Market Report (2026 to 2036).

This report examines the Medical Billing Outsourcing Market across its full 2026 to 2036 forecast horizon, covering market sizing, segmentation, competitive dynamics, and regional demand patterns in depth. It draws on primary survey data from 3,800 respondents and 47 expert interviews conducted in the fourth quarter of 2025. The analysis profiles twenty leading vendors and quantifies revenue levers, labor cost exposure, and portfolio economics across the category's major segments. Strategic recommendations address AI coding investment, performance pricing transition, and delivery diversification for vendors and investors.
Full 2026-2036 market sizing and forecast data
Seven-region demand and growth rate breakdown
Twenty-company competitive profiles and moat analysis
Segment-level CAGR and market share detail
Revenue lever and labor cost exposure analysis
Anonymised client case study with strategy recommendations

Built For The People Who Decide

From boardroom strategy to bench-side execution, this report is read cover-to-cover by leaders shaping the next decade of their industry, turning demand scenarios, market dynamics and valuation benchmarks into decisions.
CXOs/ Presidents/ VPs/ Managers
M&A and Corporate Development
Strategy Teams and R&D Heads
Procurement and Product Directors
Regulatory and Compliance Leaders
Investor Relations and Equity Analysts