

Market Minds Advisory
Media Asset Management Market

Media Asset Management Market: Media Asset Management Market: Metadata Economics, Rights Exposure and What An Archive Is Actually Worth 2026 to 2036

Storage became almost free, which removed the reason these systems originally existed. What remained expensive is describing what is inside the files, and nobody has ever budgeted properly for that.

Lead Analyst

Published

September 2026

Make Smarter Decisions with Customized Research Insights

Request a free sample report and evaluate market opportunities, growth trends, and competitive dynamics relevant to your business needs.

2025 MARKET VALUE$5.8BMarket Size 2025
2036 FORECAST VALUE$16.0BBase Case , 2026 to 2036
CAGR 2026 TO 20369.6 %Bull 10.9% / Bear 8.4%
INCREMENTAL OPPORTUNITY$9.6BNet 10- year value creation
EXPANSION MULTIPLE2.50x2036 value over 2026 base
Strategic Levers
M&A Pipeline
Regional Outlook
Country Rankings
Competitive Intelligence
Segmental Deep-dive
Call-Us : 91 93563 13602

Executive Snapshot and Market Trajectory.

Storage became almost entirely free, which quietly removed the reason that these systems originally existed at all. What stayed genuinely expensive is describing what actually sits inside all of the files, and no organisation anywhere has ever budgeted properly for that particular work.
The market reaches USD 6.4 billion in 2026 and USD 16.0 billion by 2036, a 2.50 times expansion at 9.6% annually. Rights and usage tracking modules grow at 14.4%, half again the market rate of 9.6%, because not knowing whether you may use a given clip is a genuine legal exposure rather than any filing inconvenience. East Asia holds 28% of global spending, and India compounds fastest of any market at 15.7% on production volume.
Five vendors hold just 36% of licence, subscription and services revenue, because general purpose asset tools compete against broadcast specialists for the same budgets. Avid Technology, Dalet, Vizrt, Adobe and Sony lead the field between them. An archive whose metadata nobody maintained is simply an expensive folder, and roughly 42% of archived material sits in exactly that condition. Description quality rather than storage capability now decides an archive's entire commercial value.
Market Definition
This report covers media asset management software and associated services by function class: rights and usage tracking modules, machine-assisted metadata enrichment, archive migration and normalisation tooling, production workflow integration, distribution and versioning management, and core cataloguing with storage management. It excludes raw storage hardware and cloud object storage sold by capacity, video editing and post-production applications, content delivery networks, playout and transmission systems, and general enterprise document management.
Base Year Value
$5.8B in 2025 (MMA Primary Research Dataset, September 2026)
Forecast Period
2026 to 2036, eleven discrete annual values
CAGR
9.6% base case. Bull 10.9%. Bear 8.4%.
Fastest Growth Segment
Rights And Usage Tracking Modules: 14.4% CAGR
Fastest Growth Country
India: 15.7% CAGR
Fastest Growth Region
South Asia and Pacific: 11.9% CAGR
Largest Region
East Asia: 28% of 2025 global value
Market Leaders
Avid Technology, Dalet, Vizrt, Adobe and Sony lead on media asset management licence, subscription and services revenue. Source: MMA Analysis.
Primary Survey
n=3,800 procurement and R&D decision-makers, Q4 2025, six countries
Methodology
Demand-side build-up, cross-validated against public data, 47 expert interviews

Media Asset Management Market Forecast Scenarios

media-asset-management-market-size-forecast-scenario-1789997517815
Between 2020 and 2025 the category compounded at 8.5%, and the proposition changed underneath it without much acknowledgement. These systems were originally sold as places to put things safely, at a time when storage was genuinely expensive and losing material was a real risk. Storage then became cheap enough that nobody worries about it, and the value moved into describing what is stored.
The base case holds 9.6% on three mechanisms. Rights exposure keeps growing as archives are reused across far more territories and platforms than any of the original agreements ever contemplated. Machine-assisted enrichment keeps reducing the cost of describing material that was never catalogued properly. And production volume across India, Southeast Asia and Latin America keeps creating archives inside organisations holding no established cataloguing practice to inherit, reconcile or defend against anybody.
The bull case at 10.9% assumes automated enrichment improves enough to make previously unusable archives genuinely searchable, which would justify migration projects that currently fail their business case. The bear case at 8.4% is general purpose absorption: broad asset management platforms keep adding media handling, and an organisation whose needs stop short of broadcast complexity has little reason to buy a specialist product.

An Archive Nobody Can Search

The founding proposition of this category expired without much ceremony. These systems existed because storage was expensive and losing material was a genuine risk, so somebody built careful places to put things. Storage then became cheap enough that nobody thinks about it, and what remained valuable was describing what is inside the files well enough to find again.
TOP FIVE CONCENTRATION36%Low, since general asset tools compete against broadcast specialists
UNTAGGED ARCHIVE SHARE42%Archived material carrying metadata too poor to search usefully
METADATA COST PER HOUR38 dollarsManual enrichment cost for each hour of archived footage
RIGHTS VERIFICATION TIME6 hoursManual effort establishing usage entitlement for one archived clip
MIGRATION PROJECT DURATION17 monthsFrom contract through to a fully normalised broadcaster archive
REUSE RATE AFTER MIGRATION31%Archived material actually retrieved and used within a year
Roughly 42% of archived material carries metadata too poor to search usefully, which makes it functionally invisible however carefully it is stored. Enriching it manually costs around 38 dollars an hour of footage, and no broadcaster has ever had that budget for a full archive. That gap between what is stored and what can be found is the real product problem here.
The commercial urgency now comes from rights rather than retrieval. Establishing whether an organisation may use a particular archived clip in a given territory takes around six hours of manual work, and reusing material across more platforms than the original agreement contemplated is a legal exposure rather than an administrative one. Rights and usage tracking modules grow at 14.4% against 9.6% for the market, and the buyer sits in legal.
"Every one of these projects is sold as a library and turns into an excavation. The software goes in fine. Then somebody asks what is actually in the archive, and it emerges that four different people catalogued it across twenty years using three schemes and none of them wrote anything down."
Director, Media Technology and Content Operations Practice · MMA Technology Practice · September 2026

Market Trends

Rights Exposure Overtakes Retrieval As The Purchase Driver

Establishing whether an organisation actually holds the right to use an archived clip in a particular territory takes around six hours of manual work, and archives are now reused across far more platforms and markets than the original agreements ever contemplated. That converts a filing question into a genuine legal exposure with somebody accountable for it. Rights and usage tracking modules grow at 14.4% against 9.6% for the market, and the buyer for them sits in legal or compliance rather than anywhere near the production department. That is an entirely different evaluation from anything the category was previously sold on.
Market Impact: India compounds at 15.7% annually

Machine Enrichment Lowers The Cost Of Describing Material

Manual metadata enrichment costs around 38 dollars for every hour of archived footage, which is why roughly 42% of archive material has never been described well enough to search. Automated speech, object and face recognition brings that cost down far enough that previously hopeless archives become worth processing at all. Machine-assisted metadata enrichment grows at 12.8% as a result. Accuracy remains imperfect and the output still requires review, though imperfect searchable metadata beats none at all by a very wide margin. An archive that could never justify description suddenly becomes worth processing.
Market Impact: Reuse reaches 31% after migration

Market Opportunities and Growth Drivers

Production Volume Creates Archives Without Established Practice

Broadcast and streaming production across India, Southeast Asia and Latin America keeps creating archives inside organisations that have no twenty year cataloguing legacy to inherit, reconcile or defend against anybody. India compounds at 15.7%, faster than any other market, on production volume that has expanded enormously across several languages simultaneously. Those organisations catalogue at ingest rather than attempting reconstruction later, which avoids the excavation that stalls established broadcaster deployments almost everywhere else in the world. Cataloguing at ingest costs a fraction of reconstruction afterwards. Those organisations also start with consistent schemes nobody has to reconcile later.
Market Impact: Migration consumes 17 months

Archive Reuse Becomes A Measurable Commercial Argument

After a properly executed migration around 31% of archived material is actually retrieved and used within a year, against almost none beforehand, which converts an archive from a storage cost into something that produces content nobody has to commission again. That is one of very few measurable returns available in this category, and finance functions accept it in a way they have never accepted searchability arguments. Archive migration and normalisation tooling grows at 10.7% on exactly that reasoning. Commissioning budgets are the comparison every broadcaster finance function actually understands. Searchability arguments have been discounted for two decades.
Market Impact: Concentration caps at only 36%

Market Restraints and Challenges

Migration Work Stalls Deployments After Purchase

Normalising an archive catalogued by different people under different schemes across two decades takes around 17 months, and the software is usually installed and waiting long before that work finishes. The root cause is that nobody documented the original schemes and the people who applied them have left. Commercially this produces deployments that technically succeeded and practically achieved nothing. Mitigation runs through phased migration by collection, through machine enrichment reducing manual effort, and through vendors supplying migration capability rather than leaving it entirely with the customer. Reference selling suffers considerably more than the individual project loss.
Market Impact: Verification takes 6 hours manually

General Purpose Platforms Absorb Simpler Requirements

Broad digital asset management platforms keep adding video handling, and an organisation whose requirements stop short of broadcast complexity has very little reason to buy a specialist product at specialist prices. The root cause is that most media asset management is cataloguing, which any competent asset platform performs adequately. Commercially this caps concentration at 36% and removes the simpler half of the market. Mitigation runs through rights tracking, broadcast workflow integration and archive scale, none of which general platforms handle at all convincingly. Specialists therefore compete for the harder and larger half of the market.
Market Impact: Manual tagging costs 38 dollars
4 additional market trends, 3 additional growth drivers, and 2 additional restraints and challenges are covered in the full report. Contact sales@marketmindsadvisory.com to access the complete intelligence.

Segment CAGR and Growth Architecture

Segmentation follows function class, since each carries a different buyer, different exposure to general purpose competition and quite different evidence about whether it delivers anything. Six classes cover the market, spanning rights tracking, machine enrichment, archive migration, production workflow, distribution management and core cataloguing. Organisation type and deployment route are separate dimensions handled elsewhere in this report.
media-asset-management-market-market-share-analysis-1789997518391

Rights And Usage Tracking Modules

Rights and usage tracking modules grow at 14.4%, half again the market rate of 9.6%, because establishing whether an organisation may actually use an archived clip in a given territory takes around six hours of manual work and archives are now reused far beyond what the original agreements contemplated. That turns a filing question into a legal exposure with somebody personally accountable for getting it wrong. The buyer sits in legal or compliance rather than in production, which makes this a risk purchase carrying an entirely different evaluation from anything the rest of the category is sold on. Territory and era both change what any given agreement actually permits, which is exactly why this work resists automation so stubbornly.
CAGR 14.4%

Machine-Assisted Metadata Enrichment

Machine-assisted metadata enrichment compounds at 12.8% because manual description costs around 38 dollars for every hour of footage, which is precisely why roughly 42% of archived material has never been described well enough to find. Automated speech, object and face recognition reduces that cost far enough to make previously hopeless archives worth processing at all. Accuracy is imperfect and the output still needs review before anybody relies on it, though imperfect searchable metadata beats none whatsoever by an extremely wide margin. The economics of an archive change entirely once description stops being manual. Review effort remains real but it is a fraction of full manual description. Language coverage determines where the tooling works well.
CAGR 12.8%
Full segment breakdown across 6 segments available in the complete report.

Regional Architecture and Country Demand Map

East Asia holds 28% of category spending, ahead of every other region, on the broadcast and streaming production volume running across China, Japan and South Korea. North America follows closely behind at 26% on the largest studio archives and the heaviest rights exposure found anywhere.

East Asia

East Asia takes 28% of spending, the largest regional share, on broadcast and streaming production volume that has grown faster than anywhere else over the past decade. South Korean drama and Japanese animation production both generate enormous archives with genuine international reuse value, which makes rights tracking commercially serious rather than administrative. Chinese broadcasters hold very large archives managed largely on domestic platforms under separate arrangements. Sony operates from the region and supplies internationally. Growth at 10.8% sits above the global rate on production volume rather than on any archive remediation programme. Rights value on exported content makes verification commercially serious. Domestic platforms handle much of the Chinese archive volume.
Share: 28% | CAGR: 10.8% (2026 to 2036)

North America

Twenty-six percent of spending reaches North America, where the largest studio and broadcaster archives sit alongside the heaviest rights exposure found anywhere in the world. Material licensed decades ago for territories and media that no longer describe how anything is distributed creates verification work running to around six hours per clip. Avid Technology, Adobe and Vizrt all hold substantial regional positions across different buyer types. Litigation risk makes rights tracking an easier internal argument here than elsewhere. Growth at 9.2% sits marginally below the global rate on archive maturity. Studio archives here are the largest and the most heavily licensed anywhere. Litigation risk makes the internal argument straightforward. Verification work here is genuinely substantial.
Share: 26% | CAGR: 9.2% (2026 to 2036)
Regional intelligence for 5 additional markets available in the complete report: Western Europe, South Asia and Pacific, Latin America, Middle East and Africa, Eastern Europe. Contact sales@marketmindsadvisory.com.
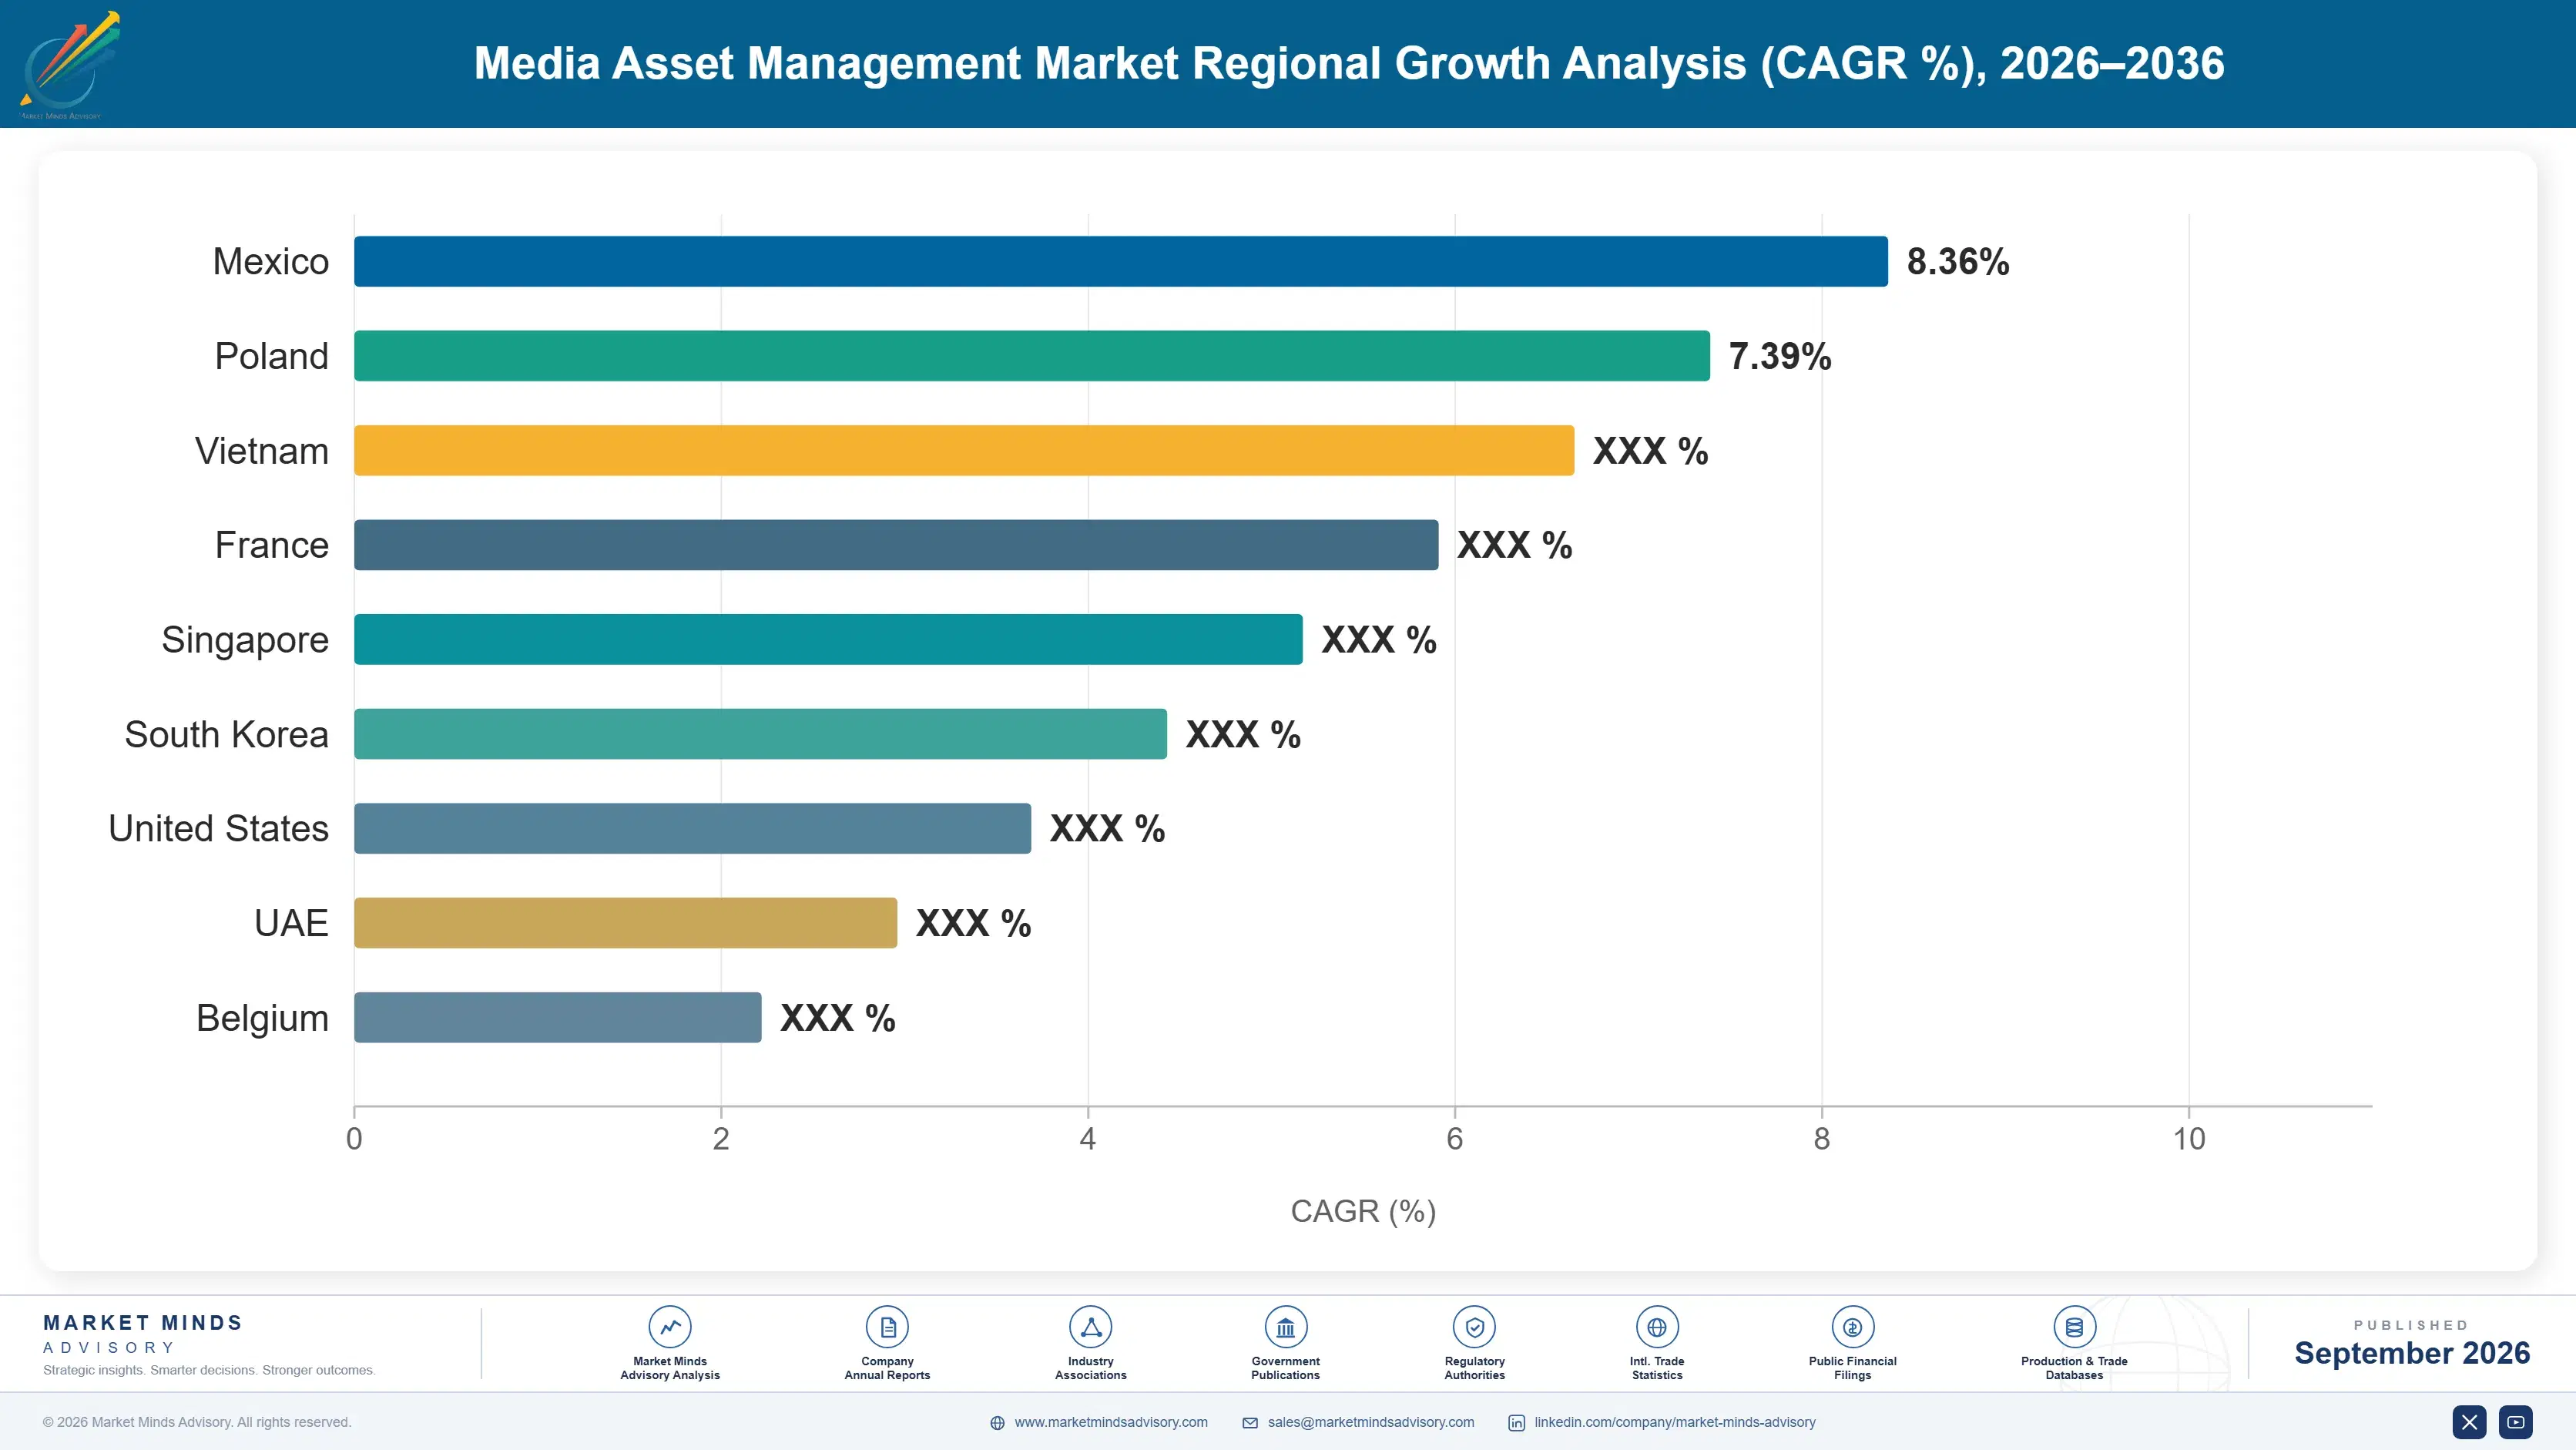
media-asset-management-market-country-cagr-analysis-1789997518944

Where These Systems Actually Sell

Storage stopped being the problem and it took the original proposition away with it entirely, migration work stalls deployments long after the software has already been installed, and general purpose platforms have now absorbed everything stopping short of broadcast complexity. The four levers below follow those conditions rather than any argument about cataloguing capability.

Sell Rights Exposure Rather Than Retrieval Speed

Establishing whether an organisation may use an archived clip in a given territory takes around 6 hours of manual work, and archives are now reused across far more platforms than any original agreement ever contemplated. That is a legal exposure with somebody personally accountable rather than an administrative inconvenience anybody can quietly defer. Vendors selling faster search are addressing a production budget and a benefit nobody measures. Those selling rights verification are addressing a legal function carrying an obligation and considerably less discretion about it. Somebody signs off on that exposure personally.
Market Impact: Verification takes a full 6 hours per clip

Supply Migration Capability Rather Than Software Alone

Normalising an archive catalogued by different people under different schemes across two decades takes around 17 months, and that work is exactly where deployments stall after the software has already been paid for. Vendors supplying migration capability alongside the licence remove the obstacle competitors leave sitting in front of the customer. It costs money to staff properly and converts stalled implementations into working references, which is worth considerably more than the services margin foregone. Stalled deployments also poison the reference base that sells the next three opportunities. Services margin foregone is worth considerably less than that.
Market Impact: Migration work consumes a full 17 months each

Quantify Archive Reuse Against Commissioning Budgets

After a properly executed migration around 31% of archived material is actually retrieved and used within a year, against almost none beforehand, which converts an archive from a storage cost into content nobody has to commission again. That is a measurable return finance functions accept, unlike searchability claims they have discounted for two decades. Vendors presenting improved findability are offering a benefit nobody tracks. Those presenting commissioning spend avoided are offering a figure the customer can verify. Commissioning spend is a number every broadcaster finance function already tracks closely. Searchability has never once persuaded a finance director.
Market Impact: Archive reuse reaches fully 31% after any migration

Compete Where General Platforms Genuinely Cannot

Broad asset management platforms handle cataloguing perfectly adequately, which is why concentration sits at only 36% and why the simpler half of this market has already gone. Rights tracking, broadcast workflow integration and archives measured in petabytes are the three things those platforms handle badly or not at all. Vendors competing on cataloguing capability are arguing about the one function their largest competitors already provide inside something the customer very likely owns. Those three are also where the remaining margin in this category actually sits. Everything else has been competed down to platform pricing.
Market Impact: Concentration now sits at only 36% across the market

Who Controls the Margin Pool

Five vendors hold just 36% of licence, subscription and services revenue, which is low for enterprise software and reflects that general purpose asset platforms compete directly against broadcast specialists for the same budgets. Avid Technology, Dalet, Vizrt, Adobe and Sony lead. All participants here are assessed on media asset management licence, subscription and services revenue rather than on any broader media technology business. Concentration has fallen steadily as general platforms extended into video handling.
Competition runs on rights capability and archive scale rather than on cataloguing, which every credible product performs adequately and general platforms perform well enough. The second dimension is migration capability, because a 17 month normalisation project is where deployments stall, and the vendor who removes that obstacle converts sales into working references far more reliably than anybody else manages.

Pressure comes from general purpose asset platforms extending into media handling rather than from specialists competing with each other. Rankings shift where production volume is creating new archives rather than where established broadcasters remediate old ones, particularly across India, Southeast Asia and the Gulf. Cataloguing at ingest rather than reconstruction afterwards is what makes those markets commercially attractive to any vendor entering them now.
media-asset-management-market-company-positioning-matrix-1789997519476

Competitive Moat and Risk Dimensions

AVID TECHNOLOGY

Moat: Production Workflow Entrenchment

Avid holds editing and production positions that media asset management sits directly alongside, which means the archive integrates into how content actually gets made rather than existing as a separate library. That integration reaches production staff who use it daily rather than archivists using it occasionally. Competitors arriving without production workflow presence find the asset system evaluated as an accessory.
AVID TECHNOLOGY

Risk: Broadcast Segment Concentration

Revenue weights heavily toward traditional broadcast organisations whose budgets are constrained and whose archive work competes against programme spending every year. Growth sits in production volume across newer markets and in rights exposure among rights holders. Production workflow depth matters considerably less to an organisation that never adopted the production tools in the first place.
DALET

Moat: Public Broadcaster Archive Depth

Dalet built genuine depth in large public broadcaster archives, where cataloguing inconsistency spans decades and preservation obligations are statutory rather than commercial. That experience accumulated across migrations nobody can shorten, and it reaches buyers who evaluate on archive credibility rather than on interface quality. Competitors without comparable migration references struggle to be shortlisted at all for that work.
DALET

Risk: Public Funding Dependency

Public service broadcaster budgets respond to political decisions rather than to any commercial demand signal, and archive remediation competes directly against programme making every single year. Growth sits in commercial production volume across newer markets instead. Depth in an institution funded by public money carries a different risk profile from depth in one funded by content revenue.

Players Tracked

Prominent Players

Avid Technology
Dalet
Vizrt
Adobe
Sony

Other Key Players

Grass Valley
Imagine Communications
EVS Broadcast Equipment
Telestream
Signiant
Cantemo
Bynder
Canto
MediaValet
Iconik
Object Matrix
Quantum Corporation
Perifery
Wasabi Technologies
Mimir

Recent Developments

MARCH 2025

Rights Holders Tighten Archive Usage Verification Requirements

Major rights holders tightened internal requirements around verifying usage entitlement before archived material is reused, a governance development rather than any corporate transaction. Establishing entitlement for a single clip takes around six hours of manual work, and archives are now reused across far more platforms than the original agreements contemplated.
Signal: Reuse beyond the original agreement turns a simple filing question into a genuine legal exposure instead.
SEPTEMBER 2024

Automated Enrichment Reduces Archive Description Costs

Media technology vendors extended automated speech, object and face recognition across archive enrichment ranges, an engineering development rather than any acquisition. Manual description costs around 38 dollars for every hour of footage, which is precisely why roughly 42% of archived material has never been described well enough to find.
Signal: Imperfect but searchable metadata beats none whatsoever by an extremely wide and entirely obvious practical margin.
JULY 2025

Indian Production Growth Creates Archives Without Legacy Practice

Indian broadcast and streaming organisations expanded production across several languages simultaneously, capacity development rather than any corporate transaction. Those organisations catalogue material at the point of ingest rather than attempting reconstruction years afterwards, which avoids the excavation work that stalls established broadcaster deployments almost everywhere else.
Signal: Cataloguing at ingest avoids entirely the excavation work that stalls every single established archive deployment anywhere.

What Delivering This Costs

Migration and normalisation services absorb roughly 41% of vendor cost of delivery, which is high even by enterprise software standards and reflects that every archive is inconsistent in its own particular way. Machine learning inference for enrichment takes around 19% and rises with archive volume. Product engineering absorbs about 23%, concentrated in rights logic and format handling, with support taking the balance.
Inference compute pricing rose materially through 2023 and 2024 as accelerator demand outpaced available capacity, and vendors on fixed enrichment pricing absorbed most of that movement rather than repricing broadcasters mid-contract. Adobe Annual Report 2024 and Avid Technology Annual Report 2023 both record infrastructure and services cost as significant operating variables. Vendors with efficient enrichment pipelines managed that period considerably better than those running heavier processing per hour.

The competitive disadvantage mechanism is migration tooling rather than compute price. A vendor whose tooling normalises inconsistent catalogues automatically carries 41% delivery cost where a competitor doing it manually carries considerably more and cannot scale. Exposure concentrates among vendors selling into established broadcasters, which is precisely where the largest archives and the worst cataloguing inconsistency both happen to sit together.
media-asset-management-market-cost-volatility-analysis-1789997519679

Build Normalisation Tooling For Inconsistent Catalogues

Migration absorbs roughly 41% of delivery cost, most of it spent reconciling catalogues that different people built under different schemes across two decades. Tooling that maps inconsistent schemes automatically converts that engineering into configuration. The investment sits in product rather than services headcount, and vendors treating migration as a services opportunity never improve with volume.

Tier Enrichment Depth By Archive Value

Enrichment inference absorbs around 19% of delivery cost and scales directly with archive hours, which run into very large numbers at any broadcaster. Processing high value collections thoroughly while handling bulk material more lightly cuts that cost substantially. The discipline is product design rather than infrastructure procurement, and it needs deciding before a large archive is processed rather than afterwards.

Invest Enrichment Engineering By Language Volume

Product engineering absorbs roughly 23% of cost, and language coverage for speech recognition only pays back where archive hours in that language are substantial. Prioritising by actual archive volume rather than by market prestige keeps that spending proportionate to the return. Vendors adding languages for competitive appearance rather than for volume carry engineering cost against revenue that rarely materialises.

Portfolio Architecture for Margin Defence

Margin architecture separates on whether general purpose platforms have already absorbed the function. Core cataloguing and storage management earns least, since any competent asset platform performs it adequately and buyers understand that perfectly well. Distribution and versioning sits above on workflow content. Rights tracking, machine enrichment and migration tooling earn most, because each addresses something general platforms handle badly or not at all.
The volume versus premium tension runs between licence and migration services. Normalisation absorbs roughly 41% of delivery cost, and vendors carrying that as services headcount earn considerably less per customer than those whose tooling automates it. Treating migration as a revenue line works commercially until a competitor arrives whose product simply does not need the same effort, which is happening across the mid-market steadily.

High-value pools concentrate in rights tracking and in migration tooling, and neither is reached through cataloguing capability. Rights tracking requires understanding licensing structures that vary by territory and era. Migration tooling requires having normalised enough archives to recognise the patterns. Both are deliberate investments rather than natural extensions of a catalogue product, which is why relatively few vendors hold either.

Volume / Commodity-Adjacent

Core cataloguing and storage management at standard capability, where any competent general asset platform performs the same function adequately and buyers understand that perfectly well. The twelve point spread separates cloud subscription delivery from deployments still requiring substantial on-premise installation and support.
Gross Margin: 46% to 58%

Premium / Certified

Distribution and versioning management alongside production workflow integration, where broadcast workflow depth and format handling determine selection alongside price. The twelve point spread tracks how much per-customer configuration each deployment requires against how much the product handles natively out of the box.
Gross Margin: 62% to 74%

Sustainability / Regulatory / Next-Generation

Rights and usage tracking, machine-assisted enrichment and archive migration tooling, each addressing something general purpose platforms handle badly or not at all. The twelve point spread reflects licensing structure understanding and normalisation tooling depth, neither of which accumulates quickly.
Gross Margin: 76% to 88%
media-asset-management-market-portfolio-architecture-1789997520186

High-value Sub-segments and Strategic Watch-out

Rights And Usage Tracking Modules

Grows at 14.4% because establishing entitlement for a single clip takes around six hours of genuinely manual work. The twelve point spread reflects licensing structure understanding. Archives are now reused far beyond what any original agreement ever contemplated happening. Territory and era both change what is permitted.
Gross Margin: 76% to 88%

Machine-Assisted Metadata Enrichment

Grows at 12.8% because manual description costs around 38 dollars for every single hour of archived footage. The twelve point spread reflects enrichment pipeline efficiency. Roughly 42% of archived material has never been described well enough to find again. Language coverage determines where it works well.
Gross Margin: 76% to 88%

Archive Migration And Normalisation Tooling

Grows at 10.7% as organisations finally attempt the normalisation work that stalls deployments for around 17 months. The twelve point spread reflects tooling automation depth. Reuse reaches around 31% afterwards, which is the measurable return finance accepts. Tooling automation separates the vendors sharply here. Deployments stall precisely here.
Gross Margin: 76% to 88%

Core Cataloguing And Storage Management

Grows at 3.4%, slowest of the six function classes, because any competent general asset platform performs exactly the same function adequately. The twelve point spread reflects delivery model alone. This is the function that keeps concentration down at only 36% across the category. Buyers understand that perfectly well by now.
Gross Margin: 46% to 58%

Why Archives Stay Put

The annuity here is normalised metadata rather than any contract term. Reconciling an archive takes around 17 months of work that produces a catalogue specific to the system it was built in, and none of it transfers cleanly to a replacement. Nobody repeats that exercise to change vendor. Deployments consequently persist for a decade or considerably longer, and vendors routinely underestimate how thoroughly that protects them.
Depth varies sharply by function. Rights records supporting a legal position are deeply embedded, since the evidence must remain accessible for as long as material stays in use. A normalised catalogue with enrichment history behind it is similarly fixed. Core cataloguing is entirely substitutable, particularly against a general purpose platform an organisation very likely already owns for everything that is not video.

The buyer has moved from archive and library functions toward legal and production. An archivist evaluated cataloguing quality and preservation standards. A legal function evaluates whether usage entitlement can be demonstrated. A production function evaluates whether material can be found while somebody is actually editing. Vendors still selling to archivists are addressing the buyer with the smallest budget and the least organisational leverage.
media-asset-management-market-end-use-penetration-index-1789997520678

What Decides These Deployments

These are among the four positions where our research anticipates prominent divergence between winners and laggards over the coming forecast period. Each is grounded in the demand model, the regulatory perimeter, and the announced capacity pipeline.
01 / RIGHTS EXPOSURE SELLING

Sell The Legal Question, Not Search Speed

Establishing whether an organisation may actually use an archived clip in a given territory takes around six hours of manual work, and archives are now reused across far more platforms and markets than any original agreement ever contemplated. That is a genuine legal exposure with somebody personally accountable rather than an administrative inconvenience anybody can quietly defer. Vendors still selling faster search are addressing a production budget and a benefit that nobody inside the organisation actually measures at all, and somebody signs off on that exposure personally.
02 / MIGRATION CAPABILITY SUPPLY

Do The Normalisation, Not Just The Software

Normalising an archive catalogued by different people under different schemes across two full decades takes around 17 months, and that work is precisely where deployments stall long after the software has already been paid for. Vendors supplying migration capability alongside the licence itself remove the one obstacle that competitors leave sitting squarely in front of the customer. It costs real money to staff properly and converts stalled implementations into genuinely working reference accounts that sell the next deal, which sells the next three opportunities in the same sector.
03 / MEASURABLE RETURN FRAMING

Count Programmes Nobody Had To Commission

After a properly executed migration around 31% of archived material is actually retrieved and used within a year, against almost none at all beforehand, which converts an archive from a storage cost into content that nobody has to commission again. That is a measurable return finance functions genuinely accept, unlike the searchability claims they have been discounting for two full decades now. Vendors presenting improved findability instead are offering a benefit that nobody anywhere in the organisation actually tracks, which is why the argument keeps failing at review.
04 / PLATFORM GAP TARGETING

Build Only What Broad Platforms Cannot

Broad digital asset management platforms handle cataloguing perfectly adequately, which is exactly why concentration sits at only 36% and why the simpler half of this market has already gone to them. Rights tracking, broadcast workflow integration and archives measured in petabytes are the three things those platforms handle badly or not at all convincingly. Vendors competing on cataloguing capability alone are arguing about the one function their largest competitors already provide inside something the customer very likely owns, and margin in this category now sits only in those three.

Engagement Snapshot From the Field

A live engagement with an industry participant carrying material or product regulatory and market exposure ahead of a defining policy shift, showing how our research translates into a defensible multi-year portfolio strategy.
MARKET MINDS ADVISORY · CLIENT ENGAGEMENT SUMMARY
Media Asset Management Producer Strategic Portfolio Review and Transition Roadmap 2026·Investment Scenario on Media Asset Management Exposure Evaluation 2025-26
CLIENT PROFILE
A national broadcaster holding several decades of programme material catalogued under at least three separate schemes by staff who had largely retired. A rights dispute over reused archive footage had reached the board, and a media asset management system installed two years earlier was substantially unused because almost nothing in the archive could be found through it.
STRATEGIC CHALLENGE
The archive department wanted funding to complete cataloguing manually, which it had requested and been refused twice already. Legal wanted rights records after the dispute. Finance had rejected both requests on the grounds that neither produced anything measurable, and was unlikely to approve a third attempt without something considerably more concrete behind it.
MMA APPROACH
MMA sampled the archive to establish what proportion carried metadata good enough to search and what proportion had verifiable rights records. We costed manual enrichment against machine-assisted alternatives across the full archive, and modelled reuse value against current commissioning spend. Work drew on 47 expert interviews conducted in Q4 2025 with broadcasters, rights holders and technology vendors.
KEY FINDINGS
  1. Around 4 in 10 of sampled archive material carried metadata too poor to search usefully, closely matching the pattern seen across comparable broadcasters.
  2. Manual enrichment of the full archive would have cost more than the broadcaster's entire annual technology budget several times over by any calculation.
  3. Rights entitlement could not be established from records held for a substantial share of the material most likely to be reused (client-reported, unverified by MMA).
  4. Machine-assisted enrichment brought the cost within range, though the output still required review before anybody could rely on it for rights purposes.
CLIENT PROFILE
A national broadcaster holding several decades of programme material catalogued under at least three separate schemes by staff who had largely retired. A rights dispute over reused archive footage had reached the board, and a media asset management system installed two years earlier was substantially unused because almost nothing in the archive could be found through it.
STRATEGIC CHALLENGE
The archive department wanted funding to complete cataloguing manually, which it had requested and been refused twice already. Legal wanted rights records after the dispute. Finance had rejected both requests on the grounds that neither produced anything measurable, and was unlikely to approve a third attempt without something considerably more concrete behind it.
MMA APPROACH
MMA sampled the archive to establish what proportion carried metadata good enough to search and what proportion had verifiable rights records. We costed manual enrichment against machine-assisted alternatives across the full archive, and modelled reuse value against current commissioning spend. Work drew on 47 expert interviews conducted in Q4 2025 with broadcasters, rights holders and technology vendors.
KEY FINDINGS
  1. Around 4 in 10 of sampled archive material carried metadata too poor to search usefully, closely matching the pattern seen across comparable broadcasters.
  2. Manual enrichment of the full archive would have cost more than the broadcaster's entire annual technology budget several times over by any calculation.
  3. Rights entitlement could not be established from records held for a substantial share of the material most likely to be reused (client-reported, unverified by MMA).
  4. Machine-assisted enrichment brought the cost within range, though the output still required review before anybody could rely on it for rights purposes.
RECOMMENDED STRATEGY
Phase 1: Phase one: build the funding case entirely on rights exposure and reuse value rather than on cataloguing completeness, which finance had already rejected twice. Phase 2: Phase two: apply machine-assisted enrichment across the bulk archive and reserve manual effort for the collections most likely to be reused commercially. Phase 3: Phase three: capture rights records at commissioning for all new material, rather than attempting any reconstruction from incomplete historical paperwork.
OUTCOME
The broadcaster funded machine-assisted enrichment on a rights and reuse business case that passed at the first attempt (client-reported, unverified by MMA). Archive retrieval rose substantially within a year of processing. Rights records are now captured at commissioning rather than reconstructed afterwards, which is the change that outlasted the engagement itself.

Frequently Asked Questions

Foundational context covering the market sizes, CAGR, scope, country, region and competition that inform every finding below. This section is provided to cover basics and most often pre-purchase conversations, answered from the MMA Primary Research Dataset.

What is the current size of the Media Asset Management Market?

Global value reaches USD 6.4 billion in 2026, measured as licence, subscription and services revenue across six function classes. The 2025 base is USD 5.8 billion.

How large will the Media Asset Management Market be by 2036?

The market reaches USD 16.0 billion by 2036, an increase of USD 9.6 billion across the forecast period. That represents 2.50 times expansion from the 2026 base.

What is the CAGR for the Media Asset Management Market 2026 to 2036?

The base case runs at 9.6% annually, with a bull case at 10.9% if automated enrichment makes previously unusable archives searchable and a bear case at 8.4% if general platforms absorb more of the category.

Which segment is growing fastest?

Rights and usage tracking modules grow at 14.4%, half again the market rate of 9.6%. Not knowing whether you may use a clip is a legal exposure rather than a filing inconvenience.

Who are the major companies in the Media Asset Management Market?

Avid Technology, Dalet, Vizrt, Adobe and Sony lead on licence, subscription and services revenue, together holding 36%. Grass Valley, Telestream and Iconik hold smaller positions.

Which country is growing fastest?

India leads at 15.7%, on broadcast and streaming production that has expanded enormously across several languages at once. Indonesia and Brazil both follow behind it.

Report Segmentation Architecture

The full report scope spans multiple orthogonal segmentation dimensions, with cross-tabulated demand data provided for each dimension pair. Coverage extends further to regional breakdowns, trend trajectories, and the competitive detail needed to support segment-level decision-making.

By Function Class

  • Rights And Usage Tracking Modules
  • Machine-Assisted Metadata Enrichment
  • Archive Migration And Normalisation Tooling
  • Production Workflow Integration
  • Distribution And Versioning Management
  • Core Cataloguing And Storage Management

By End-Use Industry

  • Public Service Broadcasters
  • Commercial Television Networks
  • Streaming And Content Platforms
  • Film And Television Production Companies
  • Sports Rights Holders And Leagues
  • Corporate And Institutional Archives

By Commercial Dimension

  • Direct Vendor Subscription Sales
  • Systems Integrator Delivery
  • Broadcast Equipment Bundled Supply
  • Migration And Services Engagements
  • Cloud Platform Marketplace Distribution
  • Managed Archive Service Providers

By Region

  • North America
  • Western Europe
  • East Asia
  • South Asia and Pacific
  • Latin America
  • Middle East and Africa
  • Eastern Europe

Scope, Methodology, and Coverage

Every figure in this report is reproducible from documented input assumptions. The scope below maps the historical period, the forecast horizon, the segmentation dimensions, and the countries covered, alongside the underlying primary and qualitative methodology.
Historical Period
2020 to 2025
Forecast Period
2026 to 2036
Base Year
2025 (USD billions; MMA Primary Research Dataset, September 2026)
Market Definition
This report covers media asset management software and associated services by function class: rights and usage tracking modules, machine-assisted metadata enrichment, archive migration and normalisation tooling, production workflow integration, distribution and versioning management, and core cataloguing with storage management. It excludes raw storage hardware and cloud object storage sold by capacity, editing and post-production applications, content delivery networks, playout systems, and general enterprise document management.
Quantitative Units
USD millions, licence, subscription and services revenue basis; managed archive hours; untagged archive share as a percentage; enrichment cost per footage hour; rights verification time in hours; migration duration in months.
Segmentation Dimensions
Function class; end-use organisation type; commercial purchase and delivery route; geography across seven regions.
Regions Covered
North America, Western Europe, East Asia, South Asia and Pacific, Latin America, Middle East and Africa, Eastern Europe
Countries Covered
China, Japan, South Korea, India, Indonesia, Australia, Singapore, United States, Canada, Mexico, Brazil, Argentina, United Kingdom, Germany, France, Netherlands, Spain, Poland, United Arab Emirates, South Africa.
Key Companies Profiled
Avid Technology, Dalet, Vizrt, Adobe, Sony, Grass Valley, Imagine Communications, EVS Broadcast Equipment, Telestream, Signiant, Cantemo, Bynder, MediaValet, Iconik, Object Matrix.
Quantitative Methodology
Primary survey, n=3,800 respondents, Q4 2025, six countries; demand-side model with trade association cross-validation
Qualitative Methodology
47 expert interviews, Q4 2025; applied to validate demand model assumptions, identify emerging dynamics, and assess competitive positioning
Report Format
PDF and XLSX data workbook (Word format preview document)
Publisher
Market Minds Advisory
Report Code
MMA-2026-TEC-861
Published
September 2026
Contact
sales@marketmindsadvisory.com | www.marketmindsadvisory.com

Purchase the full Media Asset Management Market Report (2026 to 2036).

This report sizes the global media asset management market from 2026 to 2036 across six function classes, six organisation types and seven regions. It explains why cheap storage removed the category's founding proposition and left describing content as the expensive problem nobody budgets for, with untagged material at roughly 42% quantified against manual enrichment costing around 38 dollars per footage hour. Rights verification at around six hours per clip is analysed as the exposure moving this purchase into legal budgets. Delivery cost composition is sourced to company annual reports. Regional analysis explains why East Asia leads at 28% of spending.
Six function classes sized through to 2036
Metadata economics quantified against archive searchability outcomes
Rights verification effort assessed as legal exposure
Twenty named vendors assessed on category revenue
Four revenue levers with quantified commercial impact
Anonymised national broadcaster archive engagement documented in full

Built For The People Who Decide

From boardroom strategy to bench-side execution, this report is read cover-to-cover by leaders shaping the next decade of their industry, turning demand scenarios, market dynamics and valuation benchmarks into decisions.
CXOs/ Presidents/ VPs/ Managers
M&A and Corporate Development
Strategy Teams and R&D Heads
Procurement and Product Directors
Regulatory and Compliance Leaders
Investor Relations and Equity Analysts