Market Minds Advisory
Mattresses & Accessories Market

Mattresses & Accessories Market: Mattresses and Accessories Market: Trial Periods, Missing Firmness Standards and Where The Margin Moved

The hundred night trial exists because no common firmness scale does, so buyers guess, and an industry pays for the guessing through returns it cannot resell anywhere. The write-off is total every time.

Lead Analyst

Published

September 2026

Make Smarter Decisions with Customized Research Insights

Request a free sample report and evaluate market opportunities, growth trends, and competitive dynamics relevant to your business needs.

2025 MARKET VALUE$58.0BMarket Size 2025
2036 FORECAST VALUE$93.2BBase Case , 2026 to 2036
CAGR 2026 TO 20364.4 %Bull 5.6% / Bear 3.2%
INCREMENTAL OPPORTUNITY$32.6BNet 10- year value creation
EXPANSION MULTIPLE1.54x2036 value over 2026 base
Strategic Levers
M&A Pipeline
Regional Outlook
Country Rankings
Competitive Intelligence
Segmental Deep-dive
Call-Us : 91 93563 13602

Executive Snapshot and Market Trajectory.

There is no common firmness scale in this industry. A medium-firm from one brand and a medium-firm from another can differ enough that a buyer would reject one and keep the other, and no published measure lets anyone compare before purchase. The trial period is the workaround for that gap.
Hybrid mattresses grow at 6.6%, half again the market rate of 4.4%, because they answer the two objections buyers actually raise: foam sleeps hot and springs transfer movement. Mattress protectors and encasements follow at 6.1%. Innerspring grows slowest at 2.4%, holding only the price-led tiers and the institutional contracts where purchase specification never changed. Boxed compression removed the economics that protected incumbents for decades.
The margin moved to the accessories while most participants kept organising around the mattress. Protectors, toppers and pillows replace several times inside one mattress cycle of about 9.2 years, and they attach on only 37% of mattress purchases. That gap is the largest uncontested revenue pool anywhere in this business, and it needs no new manufacturing to reach. Attach rises to about 71% when the protector sits inside the mattress checkout rather than beside it.
Market Definition
This market covers mattresses and the accessories sold alongside them, spanning innerspring, foam, hybrid and speciality mattresses together with protectors and encasements, toppers, pillows and foundations. Sizing is at wholesale shipment value across residential, hospitality and institutional demand. Bed frames and headboards, adjustable bases sold as furniture, bed linen and duvets, sleep tracking devices, and mattress recycling or disposal services are excluded from scope.
Base Year Value
$58.0B in 2025 (MMA Primary Research Dataset, September 2026)
Forecast Period
2026 to 2036, eleven discrete annual values
CAGR
4.4% base case. Bull 5.6%. Bear 3.2%.
Fastest Growth Segment
Hybrid Mattresses: 6.6% CAGR
Fastest Growth Country
India: 7.2% CAGR
Fastest Growth Region
South Asia and Pacific: 6.4% CAGR
Largest Region
East Asia: 29% of 2025 global value
Market Leaders
Somnigroup International, Serta Simmons Bedding, Sleep Number, Hilding Anders, Xilinmen Furniture. Source: MMA Primary Research Dataset, July 2026.
Primary Survey
n=3,800 procurement and R&D decision-makers, Q4 2025, six countries
Methodology
Demand-side build-up, cross-validated against public data, 47 expert interviews

Mattresses & Accessories Market Forecast Scenarios

mattresses-and-accessories-market-size-forecast-scenario-1790022247922
Growth of 3.4% between 2020 and 2025 was almost entirely borrowed from later years. Home spending through 2020 and 2021 pulled replacement forward across North America and Western Europe, then 2023 and 2024 fell hard as housing transactions slowed and the demand simply was not there to replace it. Asian volume grew steadily through the whole period and increasingly carried the global number.
Three mechanisms carry the base case. Hybrid construction keeps taking share at 6.6% because it answers heat retention and motion transfer together, which no single-material mattress does. Accessory attach improves from 37% as manufacturers finally organise around the higher-frequency purchase. Indian and Southeast Asian household formation adds genuine new units rather than replacement, with India at 7.2%, and none of that depends on developed market housing activity recovering at all.
The bull case is a firmness standard. If any recognised body publishes a comparable firmness scale, online selection stops being guesswork, trial returns fall and the industry recovers a cost it currently treats as unavoidable. The bear case is housing activity. Purchase clusters around house moves rather than sleep complaints, and a sustained slowdown removes the trigger marketing has never replaced.

Why The Trial Period Exists

The hundred night trial is not a marketing generosity, it is a workaround for a missing measurement. No recognised scale lets a buyer compare firmness between two brands, so online selection is guesswork and the trial converts that guess into a refundable one. The industry pays for the missing standard through returns rather than solving it. A published scale would cost less than one year of write-offs.
TOP FIVE CONCENTRATION24%Combined shipment value share held by the five largest participants
TRIAL RETURN RATE9%Units returned during trial periods in direct channels
AVERAGE SELLING PRICEUSD 640Weighted global wholesale price across all mattress constructions
FIRMNESS STANDARDS RECOGNISED0Common scales letting buyers compare firmness across brands
ACCESSORY ATTACH RATE37%Mattress purchases that include a protector or topper
REPLACEMENT CYCLE LENGTH9.2 yearsAverage interval before a household replaces its mattress
Those returns are expensive in a way few categories match. Trial return rates in direct channels run around 9%, and a returned mattress cannot be resold in most jurisdictions for hygiene reasons, so it goes to charity, to recycling or to landfill. The unit is written off entirely. Rates stay tolerable mainly because returning a mattress is inconvenient rather than because buyers are satisfied.
Replacement is triggered by moving house far more reliably than by any sleep complaint. Purchase clusters around relocations, relationship changes and a mattress passing an age the household finds embarrassing, which is why the category tracks housing transactions closely and why sleep health marketing has never shortened the 9.2 year cycle. Housing transaction volume predicts this category better than any sleep measure ever has.
"This industry invented a hundred night trial rather than agree on what medium-firm means, then built a returns operation to absorb the consequences. A published scale would cost less than a single year of write-offs."
Director, Home Furnishings and Bedding Practice · MMA Consumer and Industrial Goods Practice · September 2026

Market Trends

Hybrid Construction Answers Both Objections At Once

Buyers raise two complaints about mattresses and only two that matter commercially: foam sleeps hot and springs transfer a partner's movement. Hybrid construction with pocketed coils under a foam or latex comfort layer addresses both simultaneously, which is why it grows at 6.6% against a category rate of 4.4%. Build cost sits above pure foam and below premium latex, and the format compresses well enough to ship boxed. Participants whose capacity is weighted toward pure foam lines are watching demand move to a construction that needs spring capability they may not still hold.
Market Impact: India grows 2.8 points faster

Accessories Replace Several Times Inside One Mattress Cycle

A mattress lasts about 9.2 years while a protector lasts two to three and a pillow around eighteen months, which makes accessories a fundamentally different business attached to the same customer. Attach rates sit at roughly 37% of mattress purchases, and every unattached sale forfeits a recurring relationship the manufacturer will not get another chance at. Margins on protectors and encasements run above mattress margins in most ranges. Participants organised around mattress production continue treating the higher-frequency category as an afterthought at point of sale. The retailer usually asks first and keeps the relationship.
Market Impact: 34% of units ship compressed

Market Opportunities and Growth Drivers

Indian Household Formation Adds Units Rather Than Replacements

Indian urban household formation continues at a pace that adds genuinely new mattress demand rather than replacing existing units, which is unlike every developed market in this category. Foam and coir products dominate the value tiers, and Sheela Foam, Duroflex and Kurlon hold strong domestic positions built on local manufacture. India grows at 7.2%, the fastest national market covered here. Organised retail penetration is rising from a low base, which shifts volume from unbranded local producers toward participants who can supply consistent specification at scale. That favours participants supplying consistent specification at scale.
Market Impact: Exactly 0 common scales exist

Boxed Compression Opened Distribution Everywhere At Once

Roll-packing a mattress into a carton removed the freight and showroom economics that had protected incumbent manufacturers for decades, and the effect has not reversed. Any factory with a compression line can now reach any market a parcel carrier serves. That has commoditised foam construction and pushed differentiation toward hybrid builds, accessories and service. Roughly 34% of global mattress units now ship compressed. The distribution change also made trial periods necessary, since a buyer who never lies on the product needs a way out. A buyer who never lies on the product needs a way out.
Market Impact: 9% of trial units written off

Market Restraints and Challenges

No Recognised Firmness Scale Exists Between Brands

Nothing lets a buyer compare medium-firm across two manufacturers, because indentation load deflection is measured inconsistently where it is measured at all and almost never published. The root cause is competitive: a common scale would make products directly comparable on the attribute buyers care most about, and no incumbent gains from that. The commercial impact is trial return rates near 9% on units that cannot be resold. Some participants now publish indentation figures voluntarily, which works as differentiation precisely because so few competitors follow. Nobody with a strong position gains from making comparison easy.
Market Impact: Grows 2.2 points above category

Returned Units Cannot Be Resold In Most Markets

Hygiene regulations across most developed markets prevent resale of a returned mattress, so a trial return is a complete write-off rather than a restocking cost. The root cause is that the trial period was designed as a conversion tool without anyone costing the disposal side of it properly. Charity donation and recycling both carry handling cost rather than recovery. Participants are addressing it with better pre-purchase guidance, in-home firmness questionnaires and exchange-rather-than-refund policies, all of which reduce the write-off without removing the trial. None of it addresses why the buyer guessed wrong originally.
Market Impact: Attach sits at only 37%
3 additional market trends, 4 additional growth drivers, and 2 additional restraints and challenges are covered in the full report. Contact sales@marketmindsadvisory.com to access the complete intelligence.

Segment CAGR and Growth Architecture

Segmentation follows product category as retailed, the dimension on which manufacturing, replacement frequency, margin and point of sale all divide together. Six categories are assessed at wholesale shipment value. Bed frames, adjustable bases sold as furniture, bed linen, sleep tracking devices and disposal services sit outside the defined scope. Hospitality and institutional demand is included throughout.
mattresses-and-accessories-market-market-share-analysis-1790022248489

Hybrid Mattresses

Hybrid mattresses grow at 6.6%, half again the market rate of 4.4%, because they resolve the only two objections that consistently reach a purchase decision. Foam sleeps hot and springs transfer a partner's movement, and pocketed coils beneath a foam or latex comfort layer address both without asking the buyer to accept one problem to avoid the other. Build cost sits above pure foam and below premium latex, which places the construction squarely in the middle of the market where most volume is. The format compresses well enough to ship boxed, so it competes in direct channels as well as in showrooms. Participants whose capacity is weighted toward pure foam need spring capability they may no longer hold.
CAGR 6.6%

Mattress Protectors And Encasements

Protectors and encasements grow at 6.1% and behave like a different business attached to the same customer. A protector lasts two to three years against a mattress cycle of about 9.2, which means the category generates several purchase occasions inside one bed. Margins run above mattress margins across most ranges, and manufacturing is textile converting rather than bedding assembly, so the capability sits outside what most mattress plants do. Attach rates of roughly 37% mean nearly two thirds of mattress buyers leave without one. Allergen and bed bug encasements carry the strongest pricing, because the buyer is solving a specific problem rather than protecting an asset. Manufacturers organised around bedding assembly rarely hold that converting capability internally.
CAGR 6.1%
Full segment breakdown across 6 segments available in the complete report.

Regional Architecture and Country Demand Map

Regional shares measure wholesale shipment value where product is sold. East Asia and North America sit within one point of each other, and East Asia leads on units by a considerably wider margin than the value figures suggest. All seven regions sit inside their standard share bands.

East Asia

China carries most of this 29% position and the region leads on units by a far wider margin than value suggests, since average selling prices sit well below North American equivalents. Xilinmen, Sinomax, Keeson and Mlily all built scale on export manufacture and have converted it into domestic brand positions as Chinese bedroom furniture spending rose. Japanese demand is distinctive, weighted toward thinner futon-adjacent products and toward Paramount Bed in the institutional and care segments. Korean demand skews premium and adopts hybrid construction faster than the regional average. Growth of 5.3% comes from both replacement and new household formation. Export manufacture built the capability that domestic brand positions were later constructed on.
Share: 29% | CAGR: 5.3% (2026 to 2036)

North America

The 28% position sits within a point of East Asia on value while trailing considerably on units, because average selling prices here are the highest of any region by a clear margin. This is where boxed compression changed the category first and most completely, and where trial periods became a competitive necessity. Somnigroup, Serta Simmons and Sleep Number hold the largest positions, with the Mattress Firm acquisition concentrating retail distribution meaningfully. Purchase timing tracks housing transactions closely, which made 2023 and 2024 difficult across every participant. Growth of 3.6% reflects a mature replacement market. Accessory attach sits close to the global figure despite the highest selling prices anywhere, leaving the largest absolute pool of unsold accessory revenue anywhere.
Share: 28% | CAGR: 3.6% (2026 to 2036)
Regional intelligence for 5 additional markets available in the complete report: Western Europe, South Asia and Pacific, Latin America, Eastern Europe, Middle East and Africa. Contact sales@marketmindsadvisory.com.
mattresses-and-accessories-market-country-cagr-analysis-1790022249011

Where This Business Leaks Value

These four address the two facts that decide profitability here: a missing measurement drives returns nobody can resell, and the higher-frequency half of the category is left unsold at the point of purchase. Each has been executed by at least one participant, and none requires new mattress manufacturing capacity. Three of the four are decisions rather than investments.

Publish Indentation Load Deflection On Every Model

No recognised scale lets a buyer compare firmness between manufacturers, which is why trial periods exist and why return rates in direct channels sit near 9% on units that cannot be resold. Publishing indentation load deflection figures by comfort layer costs a test that most manufacturers already run internally. Participants who publish report trial returns falling by roughly 3 points, which on a written-off unit flows entirely to contribution. It works as differentiation precisely because so few competitors are willing to make their products directly comparable. Most participants already run the test internally.
Market Impact: Cuts trial returns by roughly 3 full points

Attach An Accessory To Every Mattress Sale

Protectors and encasements attach on roughly 37% of mattress purchases, leaving nearly two thirds of buyers without the product that will bring them back inside three years rather than nine. Margins on protectors run above mattress margins across most ranges. Participants who bundle a protector into the mattress price rather than offering it separately report attach reaching around 71%, and repeat contact rising accordingly. The change is a pricing and point-of-sale decision rather than a manufacturing one, and it works in both retail and direct channels. The retailer asks first when the manufacturer does not.
Market Impact: Raises accessory attach rates to roughly 71% overall

Offer Exchange Rather Than Refund During Trial

A refunded mattress is a total write-off because hygiene rules prevent resale in most markets, while an exchange keeps the revenue and costs only the second unit's margin. Participants offering firmness exchange as the default trial remedy, with refund as a secondary option, report retaining roughly 62% of trial claims as revenue. The operational requirement is a firmness ladder within the range and a delivery network able to swap. Neither is difficult for any participant already running a hundred night trial programme. A firmness ladder within the range is the only real prerequisite.
Market Impact: Retains roughly 62% of trial claims as revenue

Build Spring Capability Or Contract It Quickly

Hybrid construction grows at 6.6% against 4.4% for the category because it answers heat retention and motion transfer together, and it requires pocketed coil capability that pure foam participants divested or never built. Contracting coil units from a specialist supplier costs roughly 11% more per unit than in-house production and reaches the market two years sooner. The alternative is watching mid-market volume move to a construction the business cannot make. Several foam-led participants have already taken the contracting route rather than the capital one. Capital projects for coil capacity take about two years to reach useful output.
Market Impact: Costs 11% more and arrives 2 years sooner

Who Controls the Margin Pool

Concentration is low at 24% held by the top five, measured consistently on wholesale shipment value rather than on units. The leader to challenger gap is wide in retail distribution control and brand permission, both of which take decades or an acquisition to build, and narrow in manufacturing, where compression lines and foam pouring are available to any competent producer.
Competition runs on three dimensions currently. Retail distribution decides most volume in developed markets, and the Mattress Firm acquisition concentrated a meaningful share of American specialty retail under one manufacturer. Construction capability decides participation in hybrid growth, which foam-only participants cannot join without coil supply. Price decides the value tiers, where regional manufacturers compete on cost structures international brands cannot approach.

Pressure is building around vertical integration into retail and around accessory attach, and both are where positions will move. Participants without controlled distribution face a competitor that owns the shelf in the largest value market. Those still treating protectors and pillows as an afterthought are leaving the higher-frequency revenue to whoever asks the customer first, which is usually the retailer rather than the manufacturer.
mattresses-and-accessories-market-company-positioning-matrix-1790022249527

Competitive Moat and Risk Dimensions

SOMNIGROUP INTERNATIONAL

Moat: Controlled Retail Distribution

Combining Tempur Sealy manufacturing with Mattress Firm retail gives the group control of shelf position in the largest value market rather than dependence on it. That vertical position determines which products a buyer sees first and removes the distribution risk that every competing manufacturer carries into every negotiation with specialty retail.
SOMNIGROUP INTERNATIONAL

Risk: Integration And Channel Conflict

Owning a retailer that also sells competing brands creates tension that competitors will use in their own negotiations, and regulatory attention to shelf allocation is a live consideration. Integration of two large organisations also absorbs management capacity during a period when accessory attach and hybrid capability both need attention.
SERTA SIMMONS BEDDING

Moat: Manufacturing Scale And Coils

Long-established innerspring and pocketed coil manufacturing gives the company direct participation in hybrid growth without contracting capability from a supplier, which several foam-led competitors cannot say. Scale across multiple American plants also supports the delivery economics that specialty retail partners require on a bulky product.
SERTA SIMMONS BEDDING

Risk: Dependence On Third Party Retail

Volume routed through specialty retail now includes a chain owned by the largest competitor, which puts shelf allocation partly in a rival's hands. Building direct channels against that requires the trial infrastructure and returns absorption that direct brands already operate, and it competes for capital with manufacturing investment the business also needs.

Players Tracked

Prominent Players

Somnigroup International
Serta Simmons Bedding
Sleep Number
Hilding Anders
Xilinmen Furniture

Other Key Players

Purple Innovation
Ashley Furniture Industries
Corsicana Mattress
Emma Sleep
Casper Sleep
Simba Sleep
Silentnight Group
Recticel
Mlily
Sinomax Group
Keeson Technology
Sheela Foam
Duroflex
King Koil
Paramount Bed Holdings

Recent Developments

FEBRUARY 2025

Tempur Sealy completes Mattress Firm acquisition and renames Somnigroup

The company completed its acquisition of the Mattress Firm retail chain and adopted Somnigroup International as its corporate name. This was a completed acquisition rather than a merger or joint venture, and it places manufacturing and specialty retail under single ownership. No divestiture accompanied the transaction.
Signal: Control of the retail shelf is now judged more valuable in this category than manufacturing scale.
SEPTEMBER 2024

Serta Simmons consolidates North American manufacturing footprint

The company concentrated production into fewer plants as part of a cost programme following its restructuring. This was an internal manufacturing footprint decision taken on cost grounds, involving no acquisition, divestiture or external capacity partner at any stage. Coil manufacturing capability was retained across the remaining sites.
Signal: Manufacturing scale is being defended at a point when retail access is becoming considerably harder to secure.
JULY 2025

Sheela Foam expands mattress production capacity in India

The company added foam pouring and mattress assembly capacity at its Indian operations to serve rising organised retail demand. This was organic capital investment funded internally, with no joint venture, contract manufacturer or external partner involved in the expansion. Existing lines continued running throughout the construction period.
Signal: Capacity is following household formation rather than replacement in the growth markets. New households, not replacements, justify this capacity.

What A Mattress Costs To Build

Polyurethane foam accounts for roughly 29% of build cost, driven by polyol and isocyanate pricing that tracks crude oil and natural gas feedstocks rather than any bedding cycle. Pocket spring steel wire adds about 14% on hybrid and innerspring construction and nothing on pure foam. Ticking, quilting textiles and the flame barrier layer together account for around 19%, with the barrier alone carrying a meaningful cost where regulation requires it.
The 2021 winter storm across the United States Gulf Coast showed how narrow this supply base is. Petrochemical plants supplying polyol and isocyanate declared force majeure within days, foam allocation collapsed across North America, and prices moved sharply through the following two quarters. Tempur Sealy and Recticel annual reports for that period both identify chemical raw material availability and cost as material factors requiring pricing action.

Exposure varies by construction and by sourcing footprint, which decides who holds price through a season. Foam-only participants carry concentrated petrochemical exposure with no offsetting input. Hybrid and innerspring producers spread it across steel and chemicals, which move on unrelated cycles. Regional manufacturers buying domestic foam avoid the freight layer entirely, which explains most of their cost advantage at home.
mattresses-and-accessories-market-cost-volatility-analysis-1790022249723

Contract polyol volume ahead of the hurricane season window

Gulf Coast petrochemical capacity concentrates supply exposure into a geography with a predictable seasonal disruption risk. Contracting volume ahead of that window costs a modest premium against average pricing and preserves the ability to hold a published price. Smaller producers avoid the commitment because it lands before the selling season generates cash. That timing problem is a financing question.

Qualify coil supply from a specialist rather than building capacity

Hybrid growth requires pocketed coil capability that many foam-led producers divested or never built, and capital projects take roughly two years to reach useful output. Contracted coil units cost around a tenth more per unit and arrive far sooner. The decision is a timing question rather than a capability one, and the growth will not wait.

Design the flame barrier as a replaceable layer not a bonded one

Flame barrier fabric carries meaningful cost where regulation requires it, and bonding it permanently into the construction removes any ability to substitute when material pricing moves. A separately assembled barrier layer allows qualification of alternative materials without recertifying the whole product. The engineering effort is modest and the flexibility persists across the platform. Regulation differs by market in any case.

Portfolio Architecture for Margin Defence

Margin architecture divides by construction and by purchase frequency, and the second matters far more than most participants organise around. Entry foam and innerspring mattresses sold through value retail and instalment credit channels run at gross margins in the high twenties to mid thirties, competing against regional manufacturers whose cost structures international participants cannot approach in their own markets.
Premium hybrid and speciality mattresses sold through specialty retail and direct channels hold gross margins in the low to high forties. The spread reflects distribution control more than construction cost, since a product on a shelf the manufacturer owns earns considerably more than the same product bidding for space on someone else's. Trial returns are subtracted from that figure and rarely accounted for at product level.

The highest-value pool sits in accessories, which most participants still treat as an add-on. Protectors, encasements and pillows carry margins in the low to high fifties and replace several times inside one mattress cycle, which makes lifetime value per customer considerably higher than the mattress itself. Attach at 37% means most of that pool is left on the table at the point of sale.

Volume / Commodity-Adjacent

Entry foam and innerspring mattresses sold through value retail and instalment credit channels. Regional manufacturers in India, Turkey, Poland and China compete on cost structures international participants cannot approach domestically.
Gross Margin: 28 to 35%

Premium / Certified

Premium hybrid and speciality mattresses sold through specialty retail and direct channels. The eight-point range reflects distribution control rather than construction cost, and trial returns are subtracted from it in direct channels.
Gross Margin: 42 to 50%

Sustainability / Regulatory / Next-Generation

Protectors, encasements and pillows replacing several times inside one mattress cycle. Allergen and bed bug encasements carry the strongest pricing, since the buyer is solving a specific problem rather than protecting an asset.
Gross Margin: 52 to 60%
mattresses-and-accessories-market-portfolio-architecture-1790022250221

High-value Sub-segments and Strategic Watch-out

Protectors And Allergen Encasements

High value and high growth at 6.1%. A protector lasts two to three years against a mattress cycle of 9.2, and attach sits at only 37%. Encasements solving a bed bug or allergen problem carry the strongest pricing in the whole category. Textile converting sits outside most bedding plants.
Gross Margin: 54 to 60%

Hybrid Mattress Construction

High value and high growth at 6.6%. Pocketed coils under a foam comfort layer answer heat retention and motion transfer together. Foam-led participants need coil supply they divested or never built, and contracting it costs about a tenth more. Building the capacity instead takes roughly two years.
Gross Margin: 44 to 50%

Entry Foam Mattresses

Volume core, commoditised by boxed compression that let any factory with a compression line reach any market a parcel carrier serves. It fills capacity and funds very little beyond its own freight and warehousing. Any factory with a compression line reaches any market a carrier serves.
Gross Margin: 28 to 34%

Direct Channel Trial Programmes

Strategic watch-out. Return rates near 9% on units that cannot legally be resold make each trial claim a complete write-off. The ten-point range reflects how differently participants handle exchange against refund as the default remedy. Exchange keeps the revenue while a refund forfeits it entirely on an identical complaint.
Gross Margin: 38 to 48%

What Triggers A Purchase

Replacement here is event-driven rather than condition-driven, and that is the most commercially useful fact in the category. Purchase clusters around house moves, relationship changes and a mattress passing an age the household finds embarrassing to admit. Sleep complaints alone rarely produce a purchase, which is why decades of sleep health marketing have not shortened the 9.2 year replacement cycle by any measurable amount.
Stickiness varies sharply by channel and by what else was bought. Households that purchased through a specialty retailer with a firmness fitting return to that retailer rather than to the manufacturer, since the relationship was built at the shelf. Direct brand buyers who kept the mattress through trial repurchase the brand at high rates. Accessory buyers return within three years rather than nine, which is the only mechanism in this business that produces frequent contact.

Buyer profiles shifted in one direction after boxed compression arrived. The cohort that bought a mattress online without lying on it first is now reaching replacement, and it has learned what firmness it actually wanted rather than what a description suggested. That group asks for indentation figures and comparable specifications, and it is markedly less willing to guess a second time.
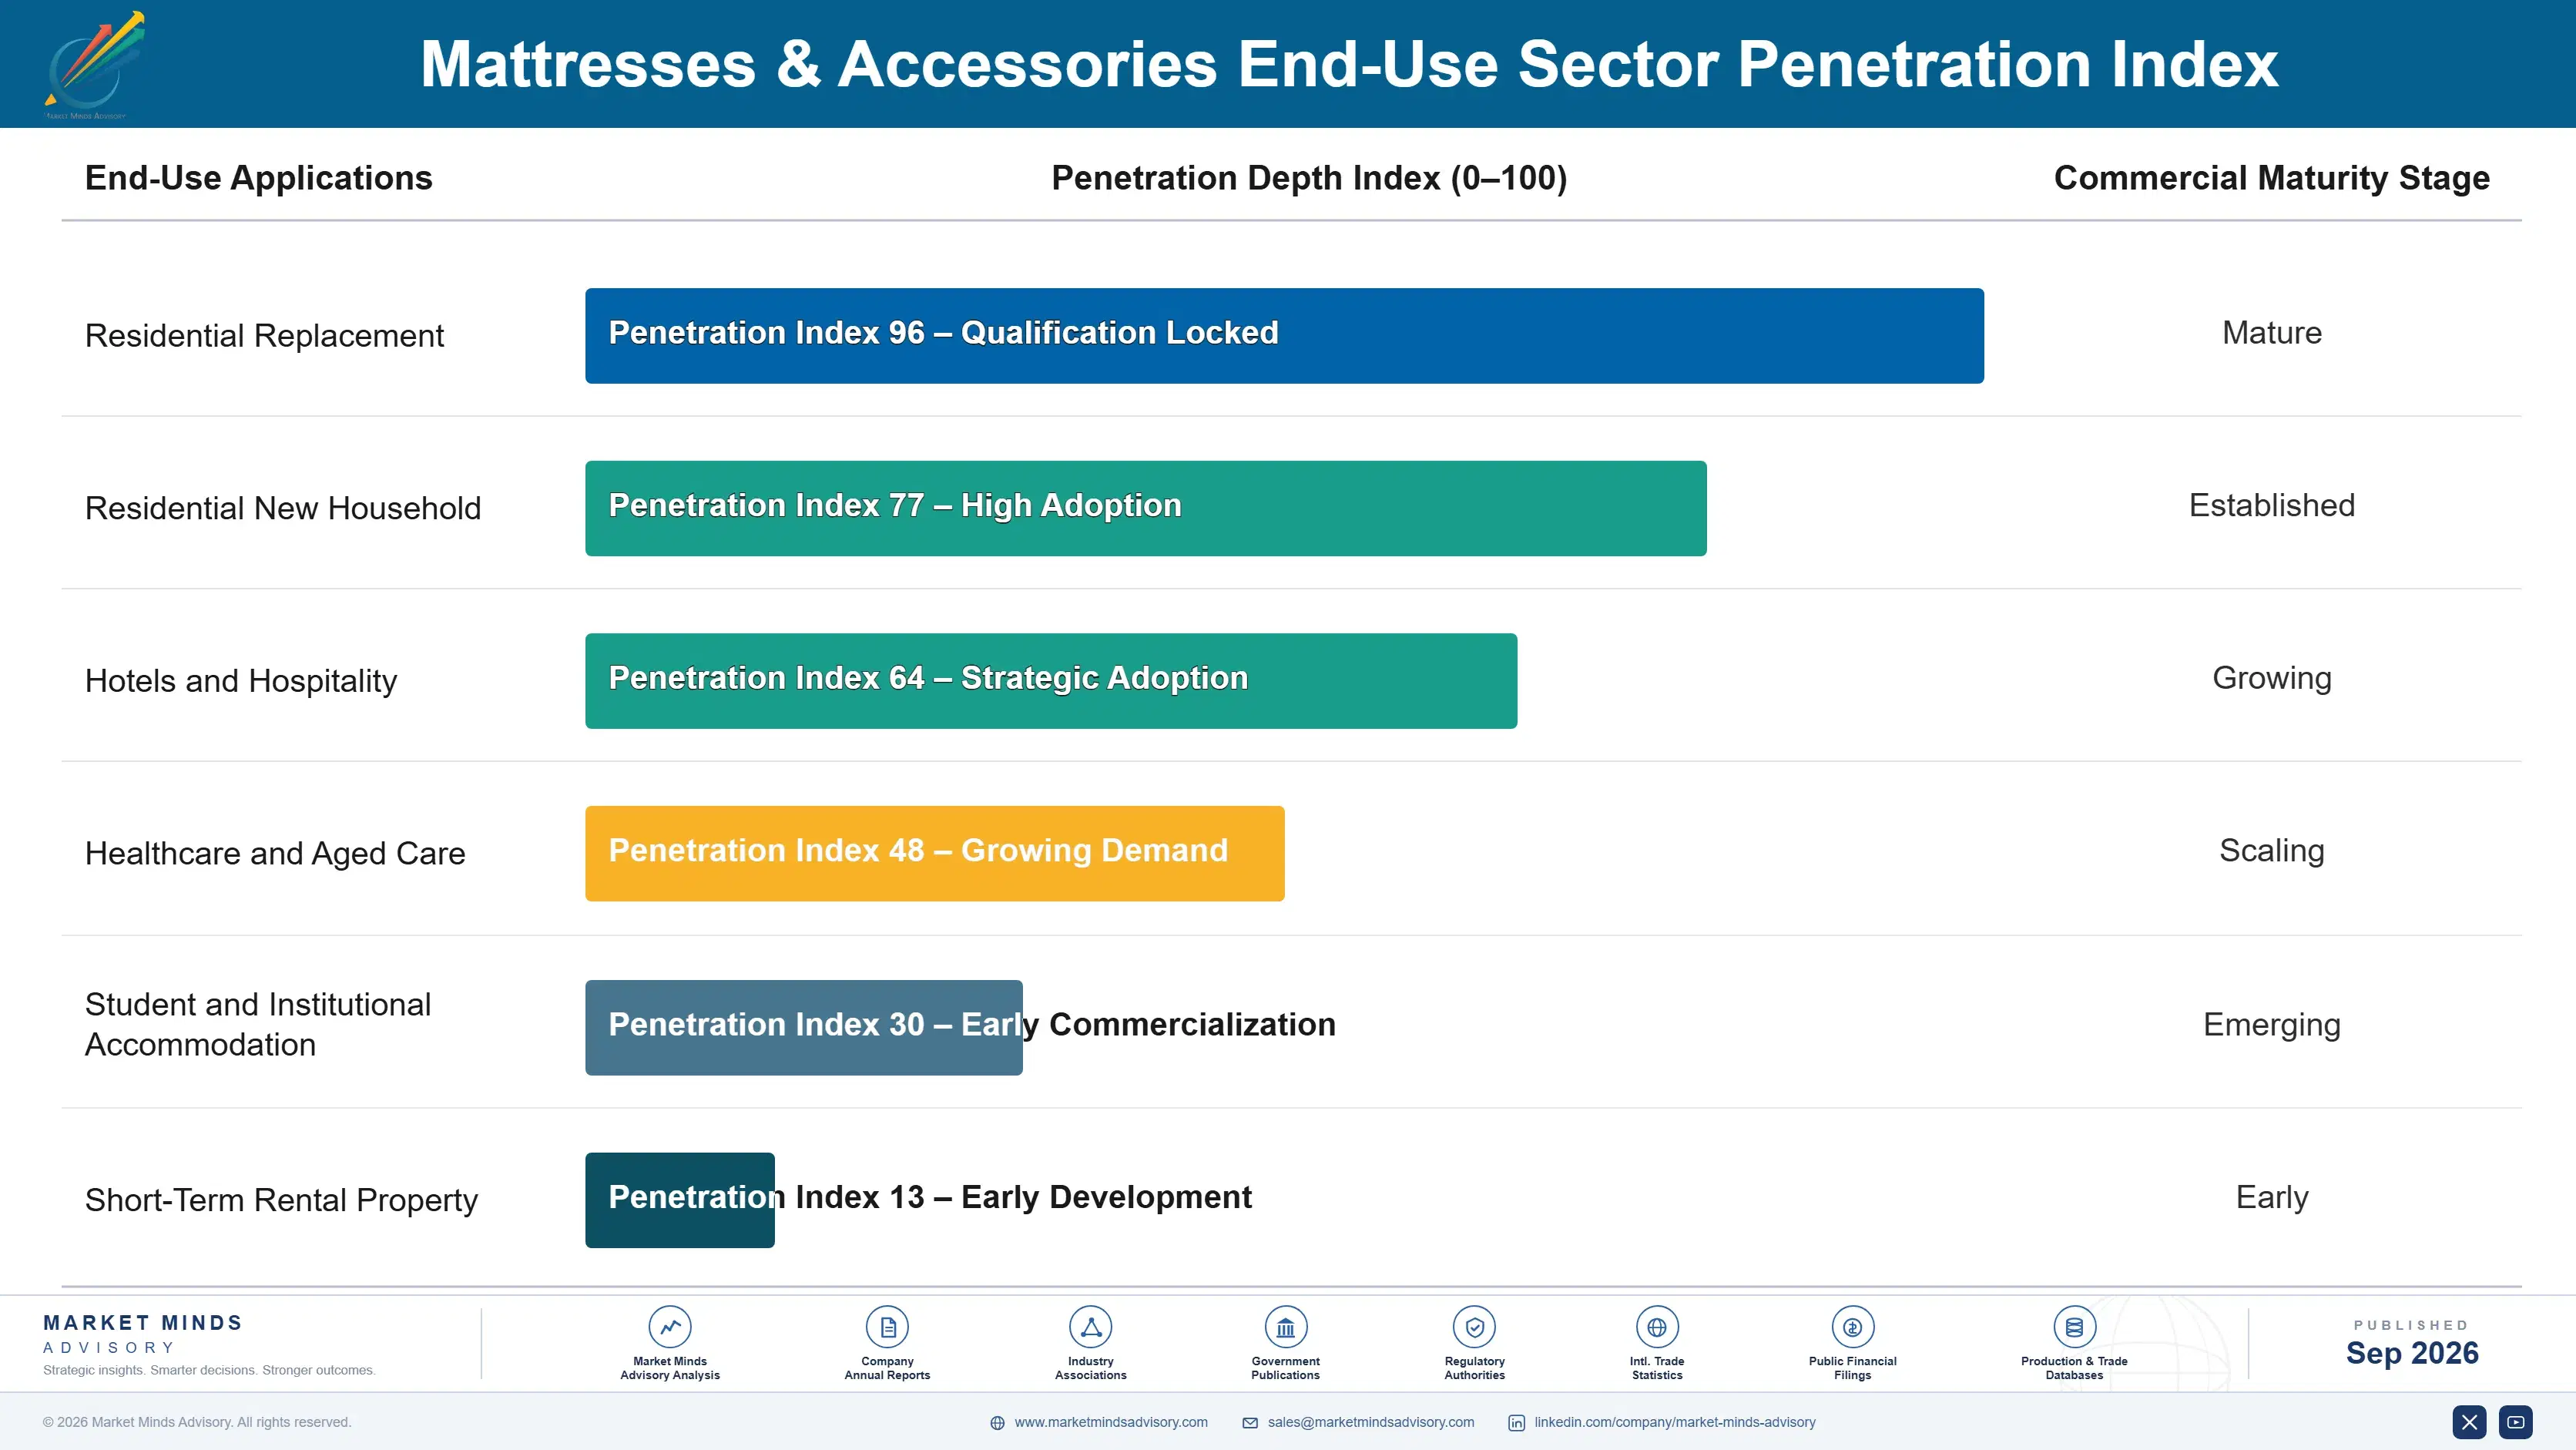
mattresses-and-accessories-market-end-use-penetration-index-1790022250712

Where The Money Sits

These are among the four positions where our research anticipates prominent divergence between winners and laggards over the coming forecast period. Each is grounded in the demand model, the regulatory perimeter, and the announced capacity pipeline.
01 / FIRMNESS SPECIFICATION DISCLOSURE

Publish the number that makes products comparable

No recognised scale lets a buyer compare medium-firm across two manufacturers, which is precisely why hundred night trials exist and why direct channel return rates sit near 9% on units nobody can resell. Publishing indentation load deflection by comfort layer costs a test most manufacturers already run internally. Participants who publish report trial returns falling by roughly 3 points, and the differentiation works because so few competitors are willing to make their products directly comparable, and a published scale would cost less than a single year of write-offs.
02 / ACCESSORY ATTACH DISCIPLINE

Sell the product that brings them back sooner

Protectors and encasements attach on only 37% of mattress purchases, leaving nearly two thirds of buyers without the item that returns them within three years instead of nine. Accessory margins run above mattress margins across most ranges, and the manufacturing is textile converting rather than bedding assembly. Participants bundling a protector into the mattress price rather than offering it separately report attach reaching around 71%, on a pricing decision that needs no new capacity, and the retailer asks the customer first whenever the manufacturer declines to.
03 / TRIAL REMEDY DESIGN

Exchange the mattress instead of refunding it

Hygiene rules prevent resale of a returned mattress in most developed markets, so a refunded trial claim is a complete write-off rather than a restocking cost. An exchange keeps the revenue and costs only the second unit's margin, which is a fundamentally different outcome for the same customer complaint. Participants offering firmness exchange as the default remedy report retaining roughly 62% of trial claims as revenue, requiring only a firmness ladder and a delivery network, both of which any participant running a hundred night trial already operates.
04 / COIL CAPABILITY ACCESS

Buy the spring capacity rather than waiting to build

Hybrid construction grows at 6.6% against 4.4% for the category because it answers heat retention and motion transfer together, and it needs pocketed coil capability that foam-led participants divested or never developed. Contracting coil units from a specialist costs roughly 11% more per unit than in-house production and reaches market about two years sooner. The alternative is watching mid-market volume migrate to a construction the business simply cannot manufacture, and building the capacity instead takes roughly two years to reach useful output.

Engagement Snapshot From the Field

A live engagement with an industry participant carrying material or product regulatory and market exposure ahead of a defining policy shift, showing how our research translates into a defensible multi-year portfolio strategy.
MARKET MINDS ADVISORY · CLIENT ENGAGEMENT SUMMARY
Mattresses & Accessories Producer Strategic Portfolio Review and Transition Roadmap 2026·Investment Scenario on Mattresses & Accessories Exposure Evaluation 2025-26
CLIENT PROFILE
A direct bedding brand selling foam and hybrid mattresses across nine European markets with revenue near USD 310 million (client-reported, unverified by MMA). Trial returns ran at 12%, above the category figure, and every returned unit was written off. Accessory attach sat at 22%, and the accessory range had been built as a merchandising afterthought rather than as a commercial category with its own targets.
STRATEGIC CHALLENGE
Contribution margin had been falling for six consecutive quarters while revenue grew, and management attributed it to acquisition cost inflation in paid channels. A budget reallocation toward brand marketing had been approved. Nobody had analysed what trial returns actually cost at unit level, or why a fifth of returns concerned the same two models.
MMA APPROACH
MMA costed every trial return at unit level including collection, disposal and lost margin, then coded return reasons across two years of claims. Model-level firmness was measured independently by indentation load deflection. Accessory attach was analysed by channel and by checkout flow, and 38 returning customers were interviewed about their selection process.
KEY FINDINGS
  1. Trial returns cost an average of 118% of unit gross margin once collection and disposal were included, which had never been costed at product level anywhere in the business.
  2. Firmness mismatch accounted for 71% of coded return reasons, and independent measurement showed two models labelled medium-firm differing by a wide indentation margin.
  3. Accessory attach reached 41% when a protector appeared inside the mattress checkout flow and 9% when offered as a separate post-purchase email.
  4. Customers who exchanged rather than refunded during trial repurchased accessories at more than twice the rate of those who received a refund and left.
CLIENT PROFILE
A direct bedding brand selling foam and hybrid mattresses across nine European markets with revenue near USD 310 million (client-reported, unverified by MMA). Trial returns ran at 12%, above the category figure, and every returned unit was written off. Accessory attach sat at 22%, and the accessory range had been built as a merchandising afterthought rather than as a commercial category with its own targets.
STRATEGIC CHALLENGE
Contribution margin had been falling for six consecutive quarters while revenue grew, and management attributed it to acquisition cost inflation in paid channels. A budget reallocation toward brand marketing had been approved. Nobody had analysed what trial returns actually cost at unit level, or why a fifth of returns concerned the same two models.
MMA APPROACH
MMA costed every trial return at unit level including collection, disposal and lost margin, then coded return reasons across two years of claims. Model-level firmness was measured independently by indentation load deflection. Accessory attach was analysed by channel and by checkout flow, and 38 returning customers were interviewed about their selection process.
KEY FINDINGS
  1. Trial returns cost an average of 118% of unit gross margin once collection and disposal were included, which had never been costed at product level anywhere in the business.
  2. Firmness mismatch accounted for 71% of coded return reasons, and independent measurement showed two models labelled medium-firm differing by a wide indentation margin.
  3. Accessory attach reached 41% when a protector appeared inside the mattress checkout flow and 9% when offered as a separate post-purchase email.
  4. Customers who exchanged rather than refunded during trial repurchased accessories at more than twice the rate of those who received a refund and left.
RECOMMENDED STRATEGY
Phase 1: Phase one: publish indentation load deflection for every model and rebuild the online selection tool around measured firmness rather than descriptions. Phase 2: Phase two: make firmness exchange the default trial remedy with refund available as a secondary option on request. Retain the revenue rather than writing it off. Phase 3: Phase three: move protector selection into the mattress checkout flow and set attach targets by channel. Post-purchase email attach was measured at 9%.
OUTCOME
Trial returns fell from 12% to 7% across three quarters and accessory attach rose from 22% to 48% (client-reported, unverified by MMA). The brand marketing reallocation was cancelled once return costs were understood at unit level, and contribution margin recovered above its previous peak within four quarters.

Frequently Asked Questions

Foundational context covering the market sizes, CAGR, scope, country, region and competition that inform every finding below. This section is provided to cover basics and most often pre-purchase conversations, answered from the MMA Primary Research Dataset.

What is the current size of the Mattresses & Accessories Market?

The market was valued at USD 58.0 billion in 2025, rising to USD 60.6 billion in 2026. Sizing is at wholesale shipment value across six product categories.

How large will the Mattresses & Accessories Market be by 2036?

MMA forecasts USD 93.2 billion by 2036, an increase of USD 32.6 billion over the 2026 base. That represents expansion of 1.54 times across the forecast period.

What is the CAGR for the Mattresses & Accessories Market 2026 to 2036?

The base case CAGR is 4.4%, with a bull case of 5.6% and a bear case of 3.2%. Historical growth between 2020 and 2025 ran at 3.4%.

Which segment is growing fastest?

Hybrid mattresses grow at 6.6%, half again the market rate, because pocketed coils under a foam layer answer heat retention and motion transfer together. Protectors and encasements follow at 6.1%.

Who are the major companies in the Mattresses & Accessories Market?

Somnigroup International, Serta Simmons Bedding, Sleep Number, Hilding Anders and Xilinmen lead on shipment value, holding a combined 24%. The category remains unusually fragmented across regional manufacturers.

Which country is growing fastest?

India grows fastest at 7.2%, because urban household formation adds genuinely new mattress demand rather than replacement, and organised retail penetration is rising from a low base.

Report Segmentation Architecture

The full report scope spans multiple orthogonal segmentation dimensions, with cross-tabulated demand data provided for each dimension pair. Coverage extends further to regional breakdowns, trend trajectories, and the competitive detail needed to support segment-level decision-making.

By Product Category

  • Innerspring Mattresses
  • Foam Mattresses
  • Hybrid Mattresses
  • Speciality Mattresses
  • Mattress Protectors and Encasements
  • Toppers, Pillows and Foundations

By End-Use Sector

  • Residential Replacement
  • Residential New Household
  • Hotels and Hospitality
  • Healthcare and Aged Care
  • Student and Institutional Accommodation
  • Short-Term Rental Property

By Distribution Channel

  • Specialty Bedding Retail
  • Furniture and Department Retail
  • Direct-to-Consumer Online
  • Marketplace Platforms
  • Contract and Institutional Supply
  • Instalment and Credit Retail

By Region

  • East Asia
  • North America
  • Western Europe
  • South Asia and Pacific
  • Latin America
  • Eastern Europe
  • Middle East and Africa

Scope, Methodology, and Coverage

Every figure in this report is reproducible from documented input assumptions. The scope below maps the historical period, the forecast horizon, the segmentation dimensions, and the countries covered, alongside the underlying primary and qualitative methodology.
Historical Period
2020 to 2025
Forecast Period
2026 to 2036
Base Year
2025 (USD billions; MMA Primary Research Dataset, September 2026)
Market Definition
This market covers mattresses and the accessories sold alongside them, spanning innerspring, foam, hybrid and speciality mattress constructions together with protectors and encasements, toppers, pillows and foundations. Sizing is at wholesale shipment value across residential, hospitality, healthcare and institutional demand in specialty, furniture, direct, marketplace, contract and credit retail channels. Bed frames and headboards, adjustable bases sold as furniture, bed linen and duvets, sleep tracking devices, and mattress recycling or disposal services are excluded throughout.
Quantitative Units
USD billions at wholesale shipment value; volume in millions of units; firmness as indentation load deflection.
Segmentation Dimensions
Product category, end-use sector, distribution channel, and geographic region.
Regions Covered
East Asia, North America, Western Europe, South Asia and Pacific, Latin America, Eastern Europe, Middle East and Africa
Countries Covered
United States, China, India, Germany, Brazil, Japan
Key Companies Profiled
Somnigroup International, Serta Simmons Bedding, Sleep Number, Hilding Anders, Xilinmen Furniture, Purple Innovation, Ashley Furniture Industries, Corsicana Mattress, Emma Sleep, Casper Sleep, Simba Sleep, Silentnight Group, Recticel, Mlily, Sinomax Group, Keeson Technology, Sheela Foam, Duroflex, King Koil, Paramount Bed Holdings
Quantitative Methodology
Primary survey, n=3,800 respondents, Q4 2025, six countries; demand-side model with trade association cross-validation
Qualitative Methodology
47 expert interviews, Q4 2025; applied to validate demand model assumptions, identify emerging dynamics, and assess competitive positioning
Report Format
PDF and XLSX data workbook (Word format preview document)
Publisher
Market Minds Advisory
Report Code
MMA-2026-CON-772
Published
September 2026
Contact
sales@marketmindsadvisory.com | www.marketmindsadvisory.com

Purchase the full Mattresses & Accessories Market Report (2026 to 2036).

The full report sizes the mattresses and accessories market across six product categories, six end-use sectors and six distribution channels for all seven global regions. It includes trial return costing at unit level, separating collection, disposal and lost margin from headline return rates. Independent indentation load deflection measurement compares labelled firmness across participants and models. Accessory attach is analysed by channel and checkout flow, and build cost is decomposed by construction with petrochemical and steel exposure separated. Competitive assessment covers 20 participants on a consistent wholesale shipment value basis.
Trial returns costed at unit level by component
Labelled firmness measured independently across models
Accessory attach analysed by channel and flow
Build cost decomposed by mattress construction
Six product categories sized through 2036
Twenty participants assessed on wholesale shipment value

Built For The People Who Decide

From boardroom strategy to bench-side execution, this report is read cover-to-cover by leaders shaping the next decade of their industry, turning demand scenarios, market dynamics and valuation benchmarks into decisions.
CXOs/ Presidents/ VPs/ Managers
M&A and Corporate Development
Strategy Teams and R&D Heads
Procurement and Product Directors
Regulatory and Compliance Leaders
Investor Relations and Equity Analysts