Market Minds Advisory
Massive MIMO Market

Massive MIMO Market: Massive MIMO Market: Active Antenna Arrays, Power Constrained Deployment and Site Economics, 2026 to 2036

The capacity gain is genuine and the electricity bill is why deployment slowed. Operators started declining capacity they technically needed, because the array draws more power than the site economics tolerate.

Lead Analyst

Published

September 2026

Make Smarter Decisions with Customized Research Insights

Request a free sample report and evaluate market opportunities, growth trends, and competitive dynamics relevant to your business needs.

2025 MARKET VALUE$12.8BMarket Size 2025
2036 FORECAST VALUE$31.1BBase Case , 2026 to 2036
CAGR 2026 TO 20368.4 %Bull 9.6% / Bear 7.2%
INCREMENTAL OPPORTUNITY$17.2BNet 10- year value creation
EXPANSION MULTIPLE2.24x2036 value over 2026 base
Strategic Levers
M&A Pipeline
Regional Outlook
Country Rankings
Competitive Intelligence
Segmental Deep-dive
Call-Us : 91 93563 13602

Executive Snapshot and Market Trajectory.

A mid-band macro array draws around 1,180 watts under load, several times what the passive antenna and radio it replaced consumed, in networks where electricity already accounts for 31% of site operating cost. Operators began declining capacity they needed, and deployment slowed accordingly. Traffic kept growing regardless.
Lightweight and low power arrays grow at 12.6%, half again the market rate of 8.4%, and they win on being deployable rather than on performing better. A 34 kilogram unit requires tower reinforcement at 27% of sites and a fresh lease negotiation at many of them, and that work costs more than the radio does. East Asia holds 37% of shipment value. Weight limits now appear ahead of performance figures in tenders.
Five suppliers hold 84% of shipment value, which is among the highest concentration in any infrastructure category, and the barrier is radio frequency integration and field-proven reliability rather than any patent. The capacity argument remains genuine at 4.1 times the passive configuration replaced, and it is no longer the argument that decides deployment. Whether a site carries the weight and affords the electricity is the whole conversation now.
Market Definition
This market covers active antenna arrays performing multi-user spatial multiplexing for mobile networks, including 64T64R macro active antenna units, 32T32R mid-capacity units, lightweight and low power arrays, millimetre wave beamforming arrays, fixed wireless access optimised arrays, and private network and neutral host arrays. It excludes passive base station antennas, conventional remote radio units without integrated arrays, baseband and core network equipment, tower steelwork, and customer premises devices.
Base Year Value
$12.8B in 2025 (MMA Primary Research Dataset, September 2026)
Forecast Period
2026 to 2036, eleven discrete annual values
CAGR
8.4% base case. Bull 9.6%. Bear 7.2%.
Fastest Growth Segment
Lightweight And Low Power Arrays: 12.6% CAGR
Fastest Growth Country
India: 13.6% CAGR
Fastest Growth Region
South Asia and Pacific: 10.5% CAGR
Largest Region
East Asia: 37% of 2025 global value
Market Leaders
Huawei, Ericsson, Nokia, ZTE, and Samsung Electronics lead the field. Source: MMA Primary Research Dataset, July 2026.
Primary Survey
n=3,800 procurement and R&D decision-makers, Q4 2025, six countries
Methodology
Demand-side build-up, cross-validated against public data, 47 expert interviews

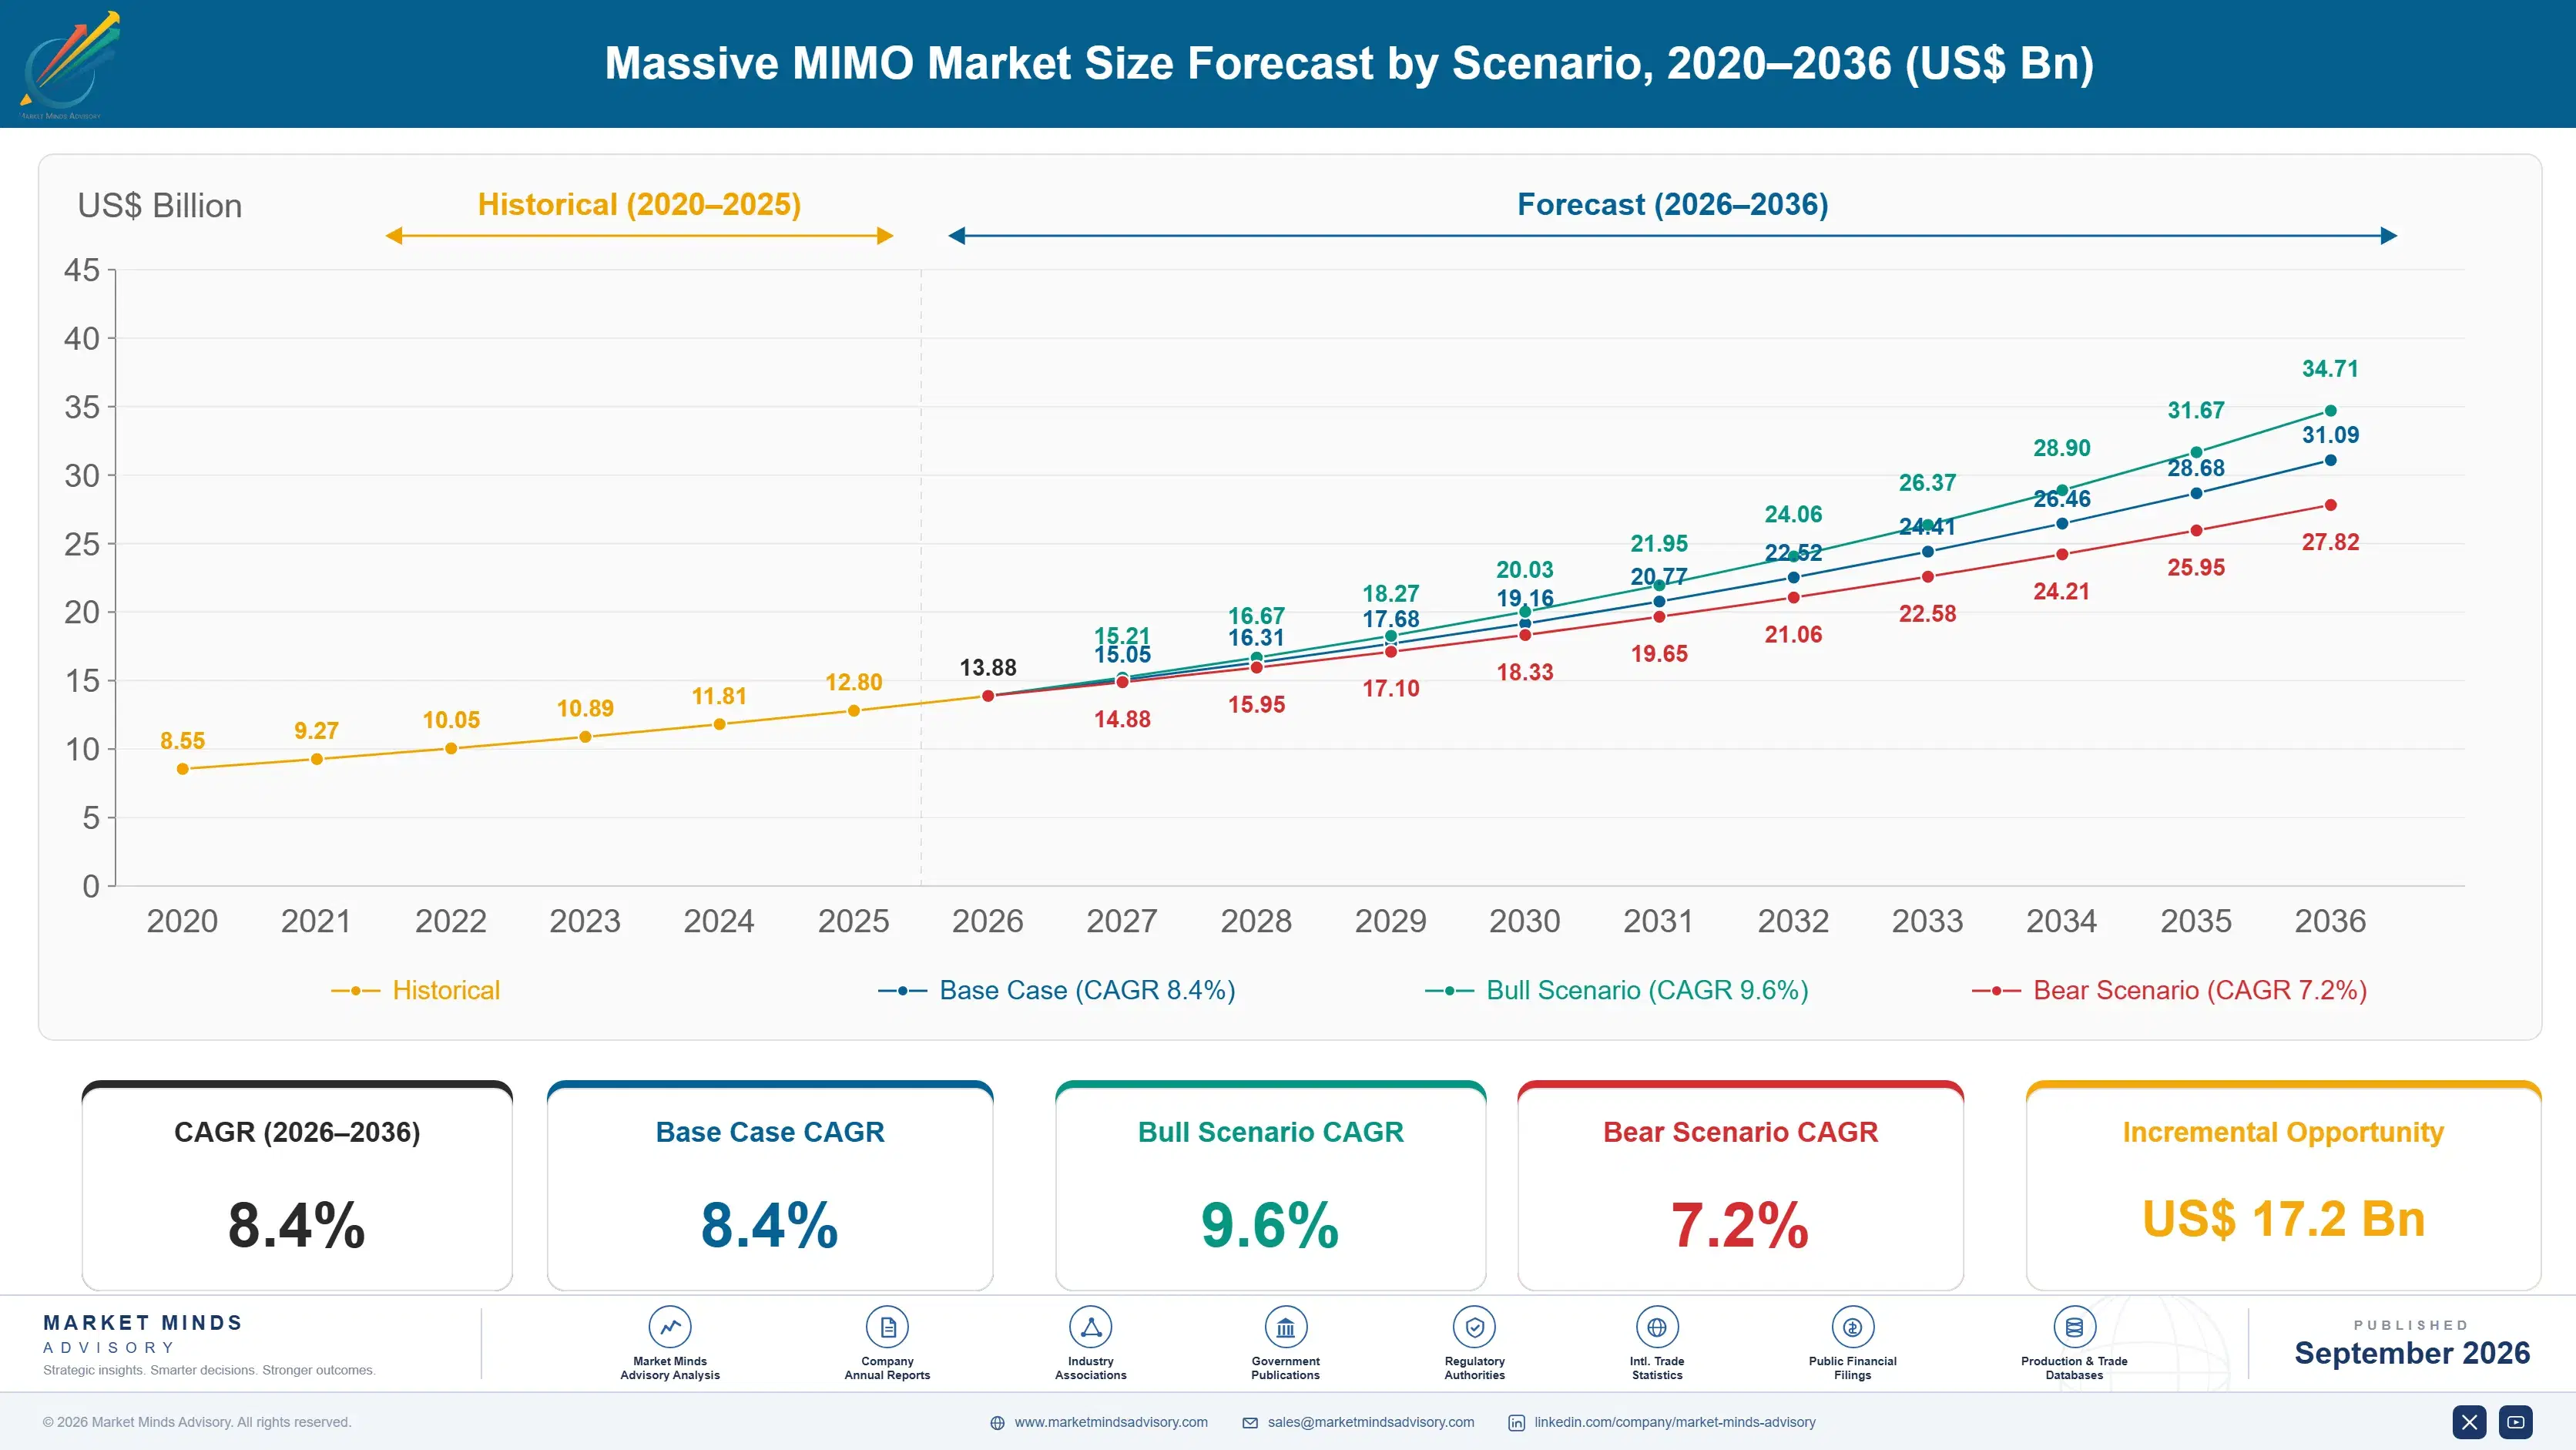
Massive MIMO Market Forecast Scenarios

massive-mimo-market-size-forecast-scenario-1790008945484
Growth between 2020 and 2025 followed the initial mid-band deployment wave and then confronted its running costs. Operators installed arrays rapidly across dense urban areas, discovered what the electricity and tower reinforcement actually cost, and became considerably more selective about where the next ones went. Historical growth of 7.3% reflects that sequence, with volumes rising then flattening as site economics became the constraint.
The base case at 8.4% rests on three mechanisms. Indian and African deployment continues at scale in networks that started later and are building through their first mid-band cycle now. Lower power array designs make previously uneconomic sites viable, which reopens deployment nobody would otherwise fund. And fixed wireless growth attaches capacity to suburban sites whose traffic profile differs entirely from urban cells. Spectrum availability constrains none of these three mechanisms at all.
The bull case at 9.6% depends on power consumption falling far enough that arrays become the default rather than the exception at ordinary sites, which would restore volume growth mature markets have largely stopped delivering. The bear case at 7.2% is capital discipline: operators facing flat revenue and elevated energy prices defer capacity that customers are not visibly demanding, which describes most capacity.

Capacity Nobody Can Afford To Power

The technology works and the operating model did not anticipate it. A mid-band array delivers roughly 4.1 times the throughput of the passive configuration it replaces and draws around 1,180 watts to do it, in networks where electricity already represents 31% of site running cost. Operators ran the arithmetic and started saying no to capacity they could genuinely use. Traffic growth did not change that arithmetic at all.
TOP FIVE CONCENTRATION84%Share of shipment value held by the leading suppliers
ARRAY POWER CONSUMPTION1,180 wattsTypical draw of a mid-band macro unit under load
ENERGY SHARE OF OPEX31%Site operating cost attributable to electricity consumption alone
UNIT WEIGHT34 kgTypical mass of a mid-band macro array assembly
SITES REQUIRING STRENGTHENING27%Towers needing reinforcement before array installation can proceed
CAPACITY GAIN MULTIPLE4.1Throughput improvement against the passive configuration being replaced
Physical installation compounds the problem. A 34 kilogram unit with meaningful wind loading requires tower reinforcement at 27% of sites, and reinforcement means engineering assessment, works, and frequently a renegotiated lease with a site owner who now knows the operator has no alternative. That sequence routinely costs more than the array itself. Operators absorbed that cost invisibly for several years.
Concentration at 84% among five suppliers reflects how difficult the integration genuinely is. Combining dozens of transmit chains, filtering, digital beamforming, and thermal management into a housing that survives a decade on a tower is hard, and field-proven reliability cannot be demonstrated by anybody who has not already deployed at scale somewhere. Patents have very little to do with the position.
"Every operator we spoke to could quote the capacity gain and every one of them had a list of sites where they had declined to deploy. The technology stopped being the question years ago. Whether the site can carry the weight and afford the electricity is the whole conversation now."
Practice Director, Wireless Network Infrastructure · MMA Technology Practice · September 2026

Market Trends

Power Consumption Became The Deployment Constraint

An array drawing around 1,180 watts sits in networks where electricity already accounts for 31% of site operating cost, and adding that consumption across thousands of sites produces a bill operators cannot absorb against flat revenue. Lightweight and low power designs grow at 12.6% because they can actually be switched on, not because they perform better than the heavier alternatives. Suppliers now lead technical presentations with watts per gigabit rather than with peak throughput, which reverses a decade of how this equipment was sold. Flat revenue makes an additional kilowatt across thousands of sites genuinely unaffordable.
Market Impact: Drives 13.6% Indian growth
Weight And Wind Loading Trigger Site Renegotiation

A 34 kilogram array with significant wind loading requires tower reinforcement at 27% of sites, and reinforcement means engineering assessment, physical work, and a lease renegotiation with an owner who understands the operator's position perfectly. That sequence frequently costs more than the equipment. Suppliers reducing mass and projected area therefore remove a cost the operator has been absorbing invisibly, and operators have started specifying weight limits before performance figures in tender documents. Operators have started specifying weight limits before performance figures in tender documents, which reverses how this equipment was previously evaluated entirely.
Market Impact: Segment grows at 10.2%

Market Opportunities and Growth Drivers

Late Building Networks Deploy Through First Mid-Band Cycle

Operators in India and across Africa began mid-band deployment later than mature markets and are building through that cycle now, at subscriber densities that make the capacity gain genuinely necessary rather than anticipatory. Indian growth of 13.6% leads every country covered, representing the largest single mid-band deployment anywhere. These buyers specify differently, weighting delivered cost, power consumption, and installation weight far more heavily than mature market operators did during their own initial build. Delivered cost, power consumption, and installation weight all outrank peak capacity in their tender documents. Anticipation plays no part.
Market Impact: Pushes energy to 31% opex

Fixed Wireless Access Puts Capacity Where Traffic Sits

Households taking broadband over the mobile network consume far more data than mobile subscribers and consume it in the evening from a fixed location, which is a traffic profile urban array deployment was never designed around. Fixed wireless optimised arrays grow at 10.2% as operators place capacity in suburban and rural cells that would never have justified it on mobile traffic alone. The economics work because household broadband revenue is considerably higher per connection than mobile service revenue is. Household broadband revenue per connection is considerably higher than mobile service revenue per subscriber.
Market Impact: Affects 84% supplier field

Market Restraints and Challenges

Site Electricity Cost Exceeds The Capacity Benefit

Arrays drawing around 1,180 watts push electricity toward and beyond 31% of site operating cost, and the root cause is that active beamforming requires powering many transmit chains continuously rather than one. Commercially this means operators decline capacity they could use, which caps unit volumes independently of traffic growth or spectrum availability. Participants respond with lower power designs, adaptive sleep across unused chains during quiet hours, and increasingly with power consumption commitments written into supply contracts as measurable obligations. Traffic growth does not change that calculation. Power commitments now appear in contracts.
Market Impact: Draws 1,180 watts per unit

Supplier Restrictions Narrow Choice In Several Markets

Government restrictions on equipment from certain suppliers apply across a growing number of markets, and the root cause is geopolitical rather than technical. Commercially this removes suppliers from consideration regardless of capability, reduces competitive pressure on the remainder, and forces operators into replacement programmes they did not plan or budget for. Participants respond by qualifying multiple suppliers ahead of any requirement, by designing for interface compatibility that eases substitution, and by sequencing replacement into cycles already scheduled. Qualified alternatives are needed before the requirement becomes urgent. Interface compatibility eases eventual substitution.
Market Impact: Reinforcement at 27% of sites
3 additional market trends, 4 additional growth drivers, and 2 additional restraints and challenges are covered in the full report. Contact sales@marketmindsadvisory.com to access the complete intelligence.

Segment CAGR and Growth Architecture

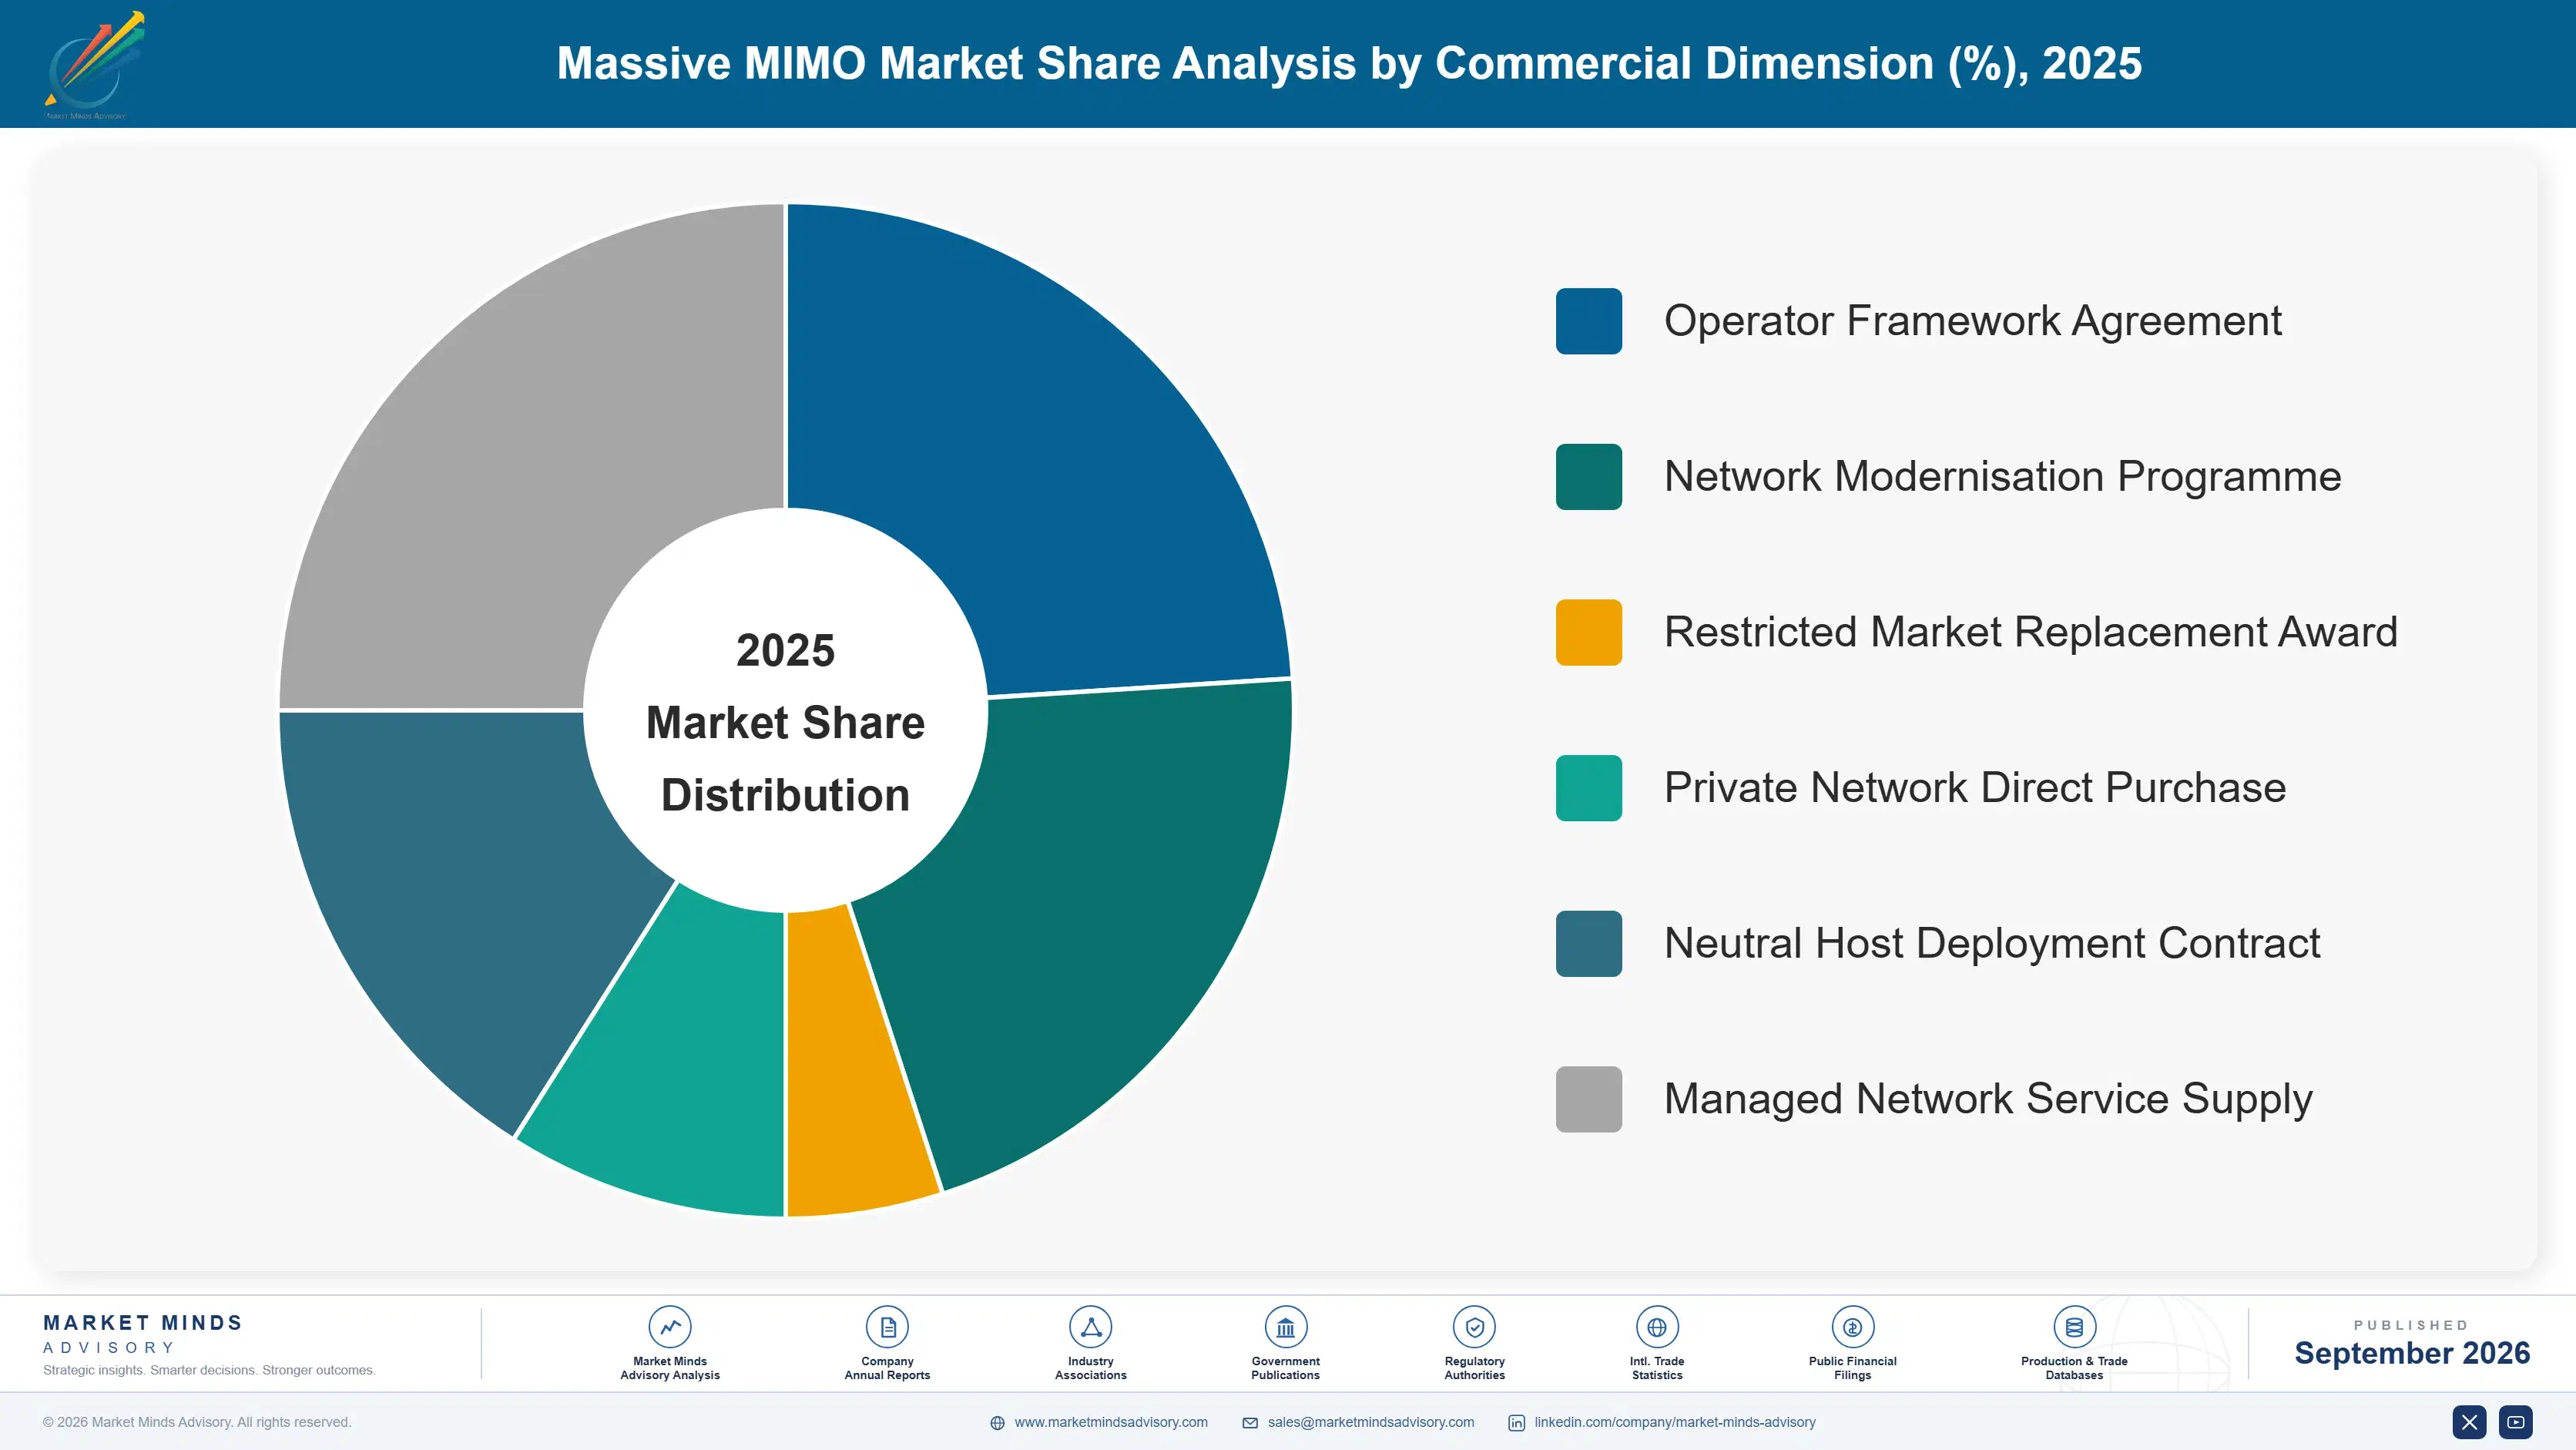
Segmentation follows array configuration and deployment context. Six categories cover the market: 64T64R macro active antenna units, 32T32R mid-capacity units, lightweight and low power arrays, millimetre wave beamforming arrays, fixed wireless access optimised arrays, and private network and neutral host arrays. Heavy macro units dominate installed value while lighter designs take new deployment. Deployability now decides.
massive-mimo-market-market-share-analysis-1790008946053

Lightweight And Low Power Arrays

Lightweight arrays grow at 12.6%, half again the market rate of 8.4%, and they are winning on deployability rather than on capability. A design that draws materially less than 1,180 watts and weighs well under 34 kilograms avoids both the electricity bill that made operators decline capacity and the tower reinforcement required at 27% of sites. Neither advantage appears in a throughput comparison, which is why suppliers reorganised their technical presentations around watts per gigabit and installed mass. Operators now specify weight and power limits before they discuss performance in most tender documents. Capability arguments persuade nobody who has already run the site arithmetic. Deployability decides these awards now. Nobody argues with electricity.
CAGR 12.6%

Millimetre Wave Beamforming Arrays

Millimetre wave arrays grow at 10.8% from a small base, concentrated in dense venues, transport hubs, and fixed wireless deployments where propagation limitations matter less than the available capacity does. Deployment has been slower than early expectations because coverage per site is poor and the number of sites required is correspondingly large, which multiplies exactly the electricity and installation costs constraining the rest of this market. Where it works it works very well, and the number of locations meeting that condition is considerably smaller than anybody forecast during the initial spectrum auctions. Site counts multiply exactly the costs constraining everything else here. Far fewer locations qualify than anybody forecast. Coverage per site is poor.
CAGR 10.8%
Full segment breakdown across 6 segments available in the complete report.

Regional Architecture and Country Demand Map

Regional shares track where arrays are deployed on live networks rather than where equipment is manufactured, though the two overlap heavily in one region. Read the table as a map of site economics. Two shares fall outside the standard bands because deployment concentrates far more than subscriber numbers do.

East Asia

At 37% East Asia sits far above the standard band, and Chinese deployment explains most of it. Chinese operators installed more massive multiple input multiple output capacity than the rest of the world combined during the initial mid-band build, at site densities that made the capacity genuinely necessary. Chinese and Korean manufacturers also supply the majority of global units, so deployment and production coincide here. Growth of 9.4% runs above the world rate as replacement of first generation arrays with lower power designs begins alongside continued Japanese and Korean network densification. Deployment and production coincide here as they do nowhere else in this study. Replacement with lower power designs is beginning.
Share: 37% | CAGR: 9.4% (2026 to 2036)

North America

Deployment concentrated in dense urban and suburban areas during the initial build and has become considerably more selective since operators measured what the electricity actually cost. Fixed wireless access has become the strongest driver of new array placement, since household broadband revenue justifies capacity that mobile traffic alone never would. Growth of 7.2% is moderate. Supplier restrictions apply across the region, which removes participants from consideration regardless of capability and has driven replacement programmes that operators neither planned nor budgeted for originally. Household broadband revenue justifies capacity that mobile traffic alone never would have supported. Restrictions drove replacement nobody had budgeted for originally. Fixed wireless now drives new placement. Selection tightened considerably.
Share: 22% | CAGR: 7.2% (2026 to 2036)
Regional intelligence for 5 additional markets available in the complete report: Western Europe, South Asia and Pacific, Latin America, Middle East and Africa, Eastern Europe. Contact sales@marketmindsadvisory.com.
massive-mimo-market-country-cagr-analysis-1790008946581

How Suppliers Win Deployment Decisions

Four commercial moves separate suppliers winning array deployments from those presenting capacity figures that stopped deciding anything years ago. Each addresses what actually constrains an operator: the electricity bill, the tower, and the capital they are unwilling to commit to capacity nobody is demanding. Capacity figures stopped deciding anything several years ago. Site economics decide instead.

Lead With Watts Per Gigabit Not Peak Throughput

Operators declining capacity they could use are doing so because of a 1,180 watt draw against electricity at 31% of site operating cost, which no throughput figure addresses. Suppliers presenting energy efficiency first, and accepting measurable power commitments in supply contracts, win deployments at roughly 2.6 times the rate of those leading with capacity. It reverses a decade of how this equipment was sold and matches the question the buyer is actually asking themselves. Throughput figures address none of it. It matches the question buyers ask. Selling practice reversed accordingly.
Market Impact: Wins 2.6 times more deployment decisions than rivals

Design Mass Down To Avoid Tower Reinforcement

A 34 kilogram array triggers reinforcement at 27% of sites, and reinforcement brings engineering assessment, physical works, and a lease renegotiation costing more than the equipment. Suppliers reducing mass and projected area below the thresholds that trigger assessment remove a cost operators have absorbed invisibly for years. Those doing so report specification wins 3.2 times more often at sites where reinforcement would otherwise apply, which is a growing proportion of what remains undeployed. Undeployed sites are increasingly these ones. Assessment thresholds are the target. Invisible cost becomes visible saving. Sites qualify that previously did not.
Market Impact: Wins specification 3.2 times more often than rivals

Target Fixed Wireless Where Revenue Justifies Capacity

Household broadband over the mobile network generates considerably more revenue per connection than mobile service does, which makes capacity investment defensible at suburban and rural sites that mobile traffic alone would never justify. Fixed wireless optimised arrays grow at 10.2%. Suppliers building for that traffic profile, with evening peaks from fixed locations rather than mobility across cells, address demand that is expanding while urban replacement volume is not, and they reach a business case the operator can approve easily. Urban replacement volume is not expanding. Operators approve that case readily.
Market Impact: Addresses a segment growing at 10.2% each year

Qualify Early In Restricted Supplier Markets

Government restrictions remove suppliers from consideration across a growing number of markets regardless of capability, and operators facing forced replacement need qualified alternatives before the requirement becomes urgent. Suppliers qualifying ahead of any tender capture replacement programmes at roughly 4.1 times the rate of those responding afterwards. Qualification costs money against no immediate order, and the replacement volumes involved are substantial and arrive on timescales that leave no room for a first conversation. Replacement volumes are substantial and arrive quickly. No first conversation is possible. Timescales allow nothing else. Volumes involved are substantial.
Market Impact: Captures 4.1 times more replacement programme awards overall

Who Controls the Margin Pool

Concentration is among the highest of any infrastructure category we cover. Five suppliers hold 84% of shipment value, measured consistently on that basis across all participants, and the barrier is genuine engineering difficulty combined with field-proven reliability that nobody can demonstrate without having already deployed at scale. The gap between the leader and the fifth is wide and moves largely with regional deployment cycles. Nobody enters this field from a standing start.
Competition currently turns on three things: energy efficiency measured in watts per gigabit, installed mass low enough to avoid tower reinforcement, and qualification status in markets applying supplier restrictions. Peak throughput differentiates almost nothing now, because every credible array exceeds what operators are willing to power at most of their sites. Operators will not power what they have already declined.

Pressure comes from two directions. Supplier restrictions are reshaping the field by administrative decision rather than by competition, creating replacement volumes and removing participants regardless of capability. Meanwhile open radio interface initiatives have produced smaller entrants in private networks. Rankings will shift with restriction policy more than with any technical development. Administrative decisions now move share faster than products do.
massive-mimo-market-company-positioning-matrix-1790008947102

Competitive Moat and Risk Dimensions

HUAWEI

Moat: Integration Depth And Scale

Vertical integration across radio frequency components, digital processing, and system design produces arrays with energy efficiency and cost positions competitors buying components cannot match, and enormous domestic deployment volume funds continued development. That combination is the reason the company holds the position it does in markets where it remains eligible to compete.
HUAWEI

Risk: Market Access Restricted Administratively

Government restrictions across North America, much of Western Europe, and a growing number of other markets remove the company from consideration regardless of product capability, and no engineering response addresses that. The accessible market is defined by policy rather than by competitive performance, and policy has moved consistently in one direction.
ERICSSON

Moat: Unrestricted Global Market Access

Eligibility in every major market, combined with the replacement programmes restrictions have created elsewhere, provides an addressable base competitors facing restrictions cannot reach at all. Long operator relationships and field reliability records across many networks reinforce that position in exactly the markets where the alternatives have been removed.
ERICSSON

Risk: Energy Efficiency Race Intensity

Deployment decisions now turn on watts per gigabit, and maintaining leadership requires continuous investment in radio frequency and digital efficiency against competitors with deeper component integration. Losing that comparison would matter more than any capacity shortfall, since power consumption is the constraint operators actually cite when declining deployment.

Players Tracked

Prominent Players

Huawei
Ericsson
Nokia
ZTE
Samsung Electronics

Other Key Players

NEC
Fujitsu
Mavenir
JMA Wireless
Airspan
CommScope
Comba Telecom
Rosenberger
Tongyu Communication
Amphenol
Analog Devices
Qorvo
MediaTek
Marvell
Corning

Recent Developments

FEBRUARY 2026

Ericsson Releases Lightweight Array Below Reinforcement Threshold

Ericsson released a mid-band array with mass and projected area reduced below the thresholds that trigger tower assessment at most sites, addressing installation cost that routinely exceeds the price of the equipment being installed. Capacity is modestly reduced against the heavier unit it replaces. Measured traffic rarely requires it.
Signal: Suppliers are designing deliberately to avoid tower reinforcement because that cost now exceeds the equipment itself.
SEPTEMBER 2025

Samsung Electronics Awarded Array Contract By Indian Operator

Samsung Electronics was selected to supply mid-band arrays across an Indian operator's continuing deployment, on criteria weighting power consumption and installation weight alongside delivered cost rather than emphasising peak throughput figures. Deployment covers several circles across a multi-year programme. Peak throughput figures were not emphasised in the evaluation at all.
Signal: Late building networks specify power and weight ahead of capacity, quite unlike mature market initial builds.
MAY 2025

Nokia Signs Supply Agreement For Fixed Wireless Optimised Arrays

Nokia entered a supply agreement covering arrays optimised for fixed wireless traffic profiles, with evening peaks from stationary households rather than the mobility patterns urban array deployment was originally designed to handle. Suburban and rural placement forms most of the deployment scope. Evening peak handling was the principal design requirement.
Signal: Household broadband revenue justifies capacity at sites that mobile traffic alone would never have supported at all.

What An Array Costs To Build

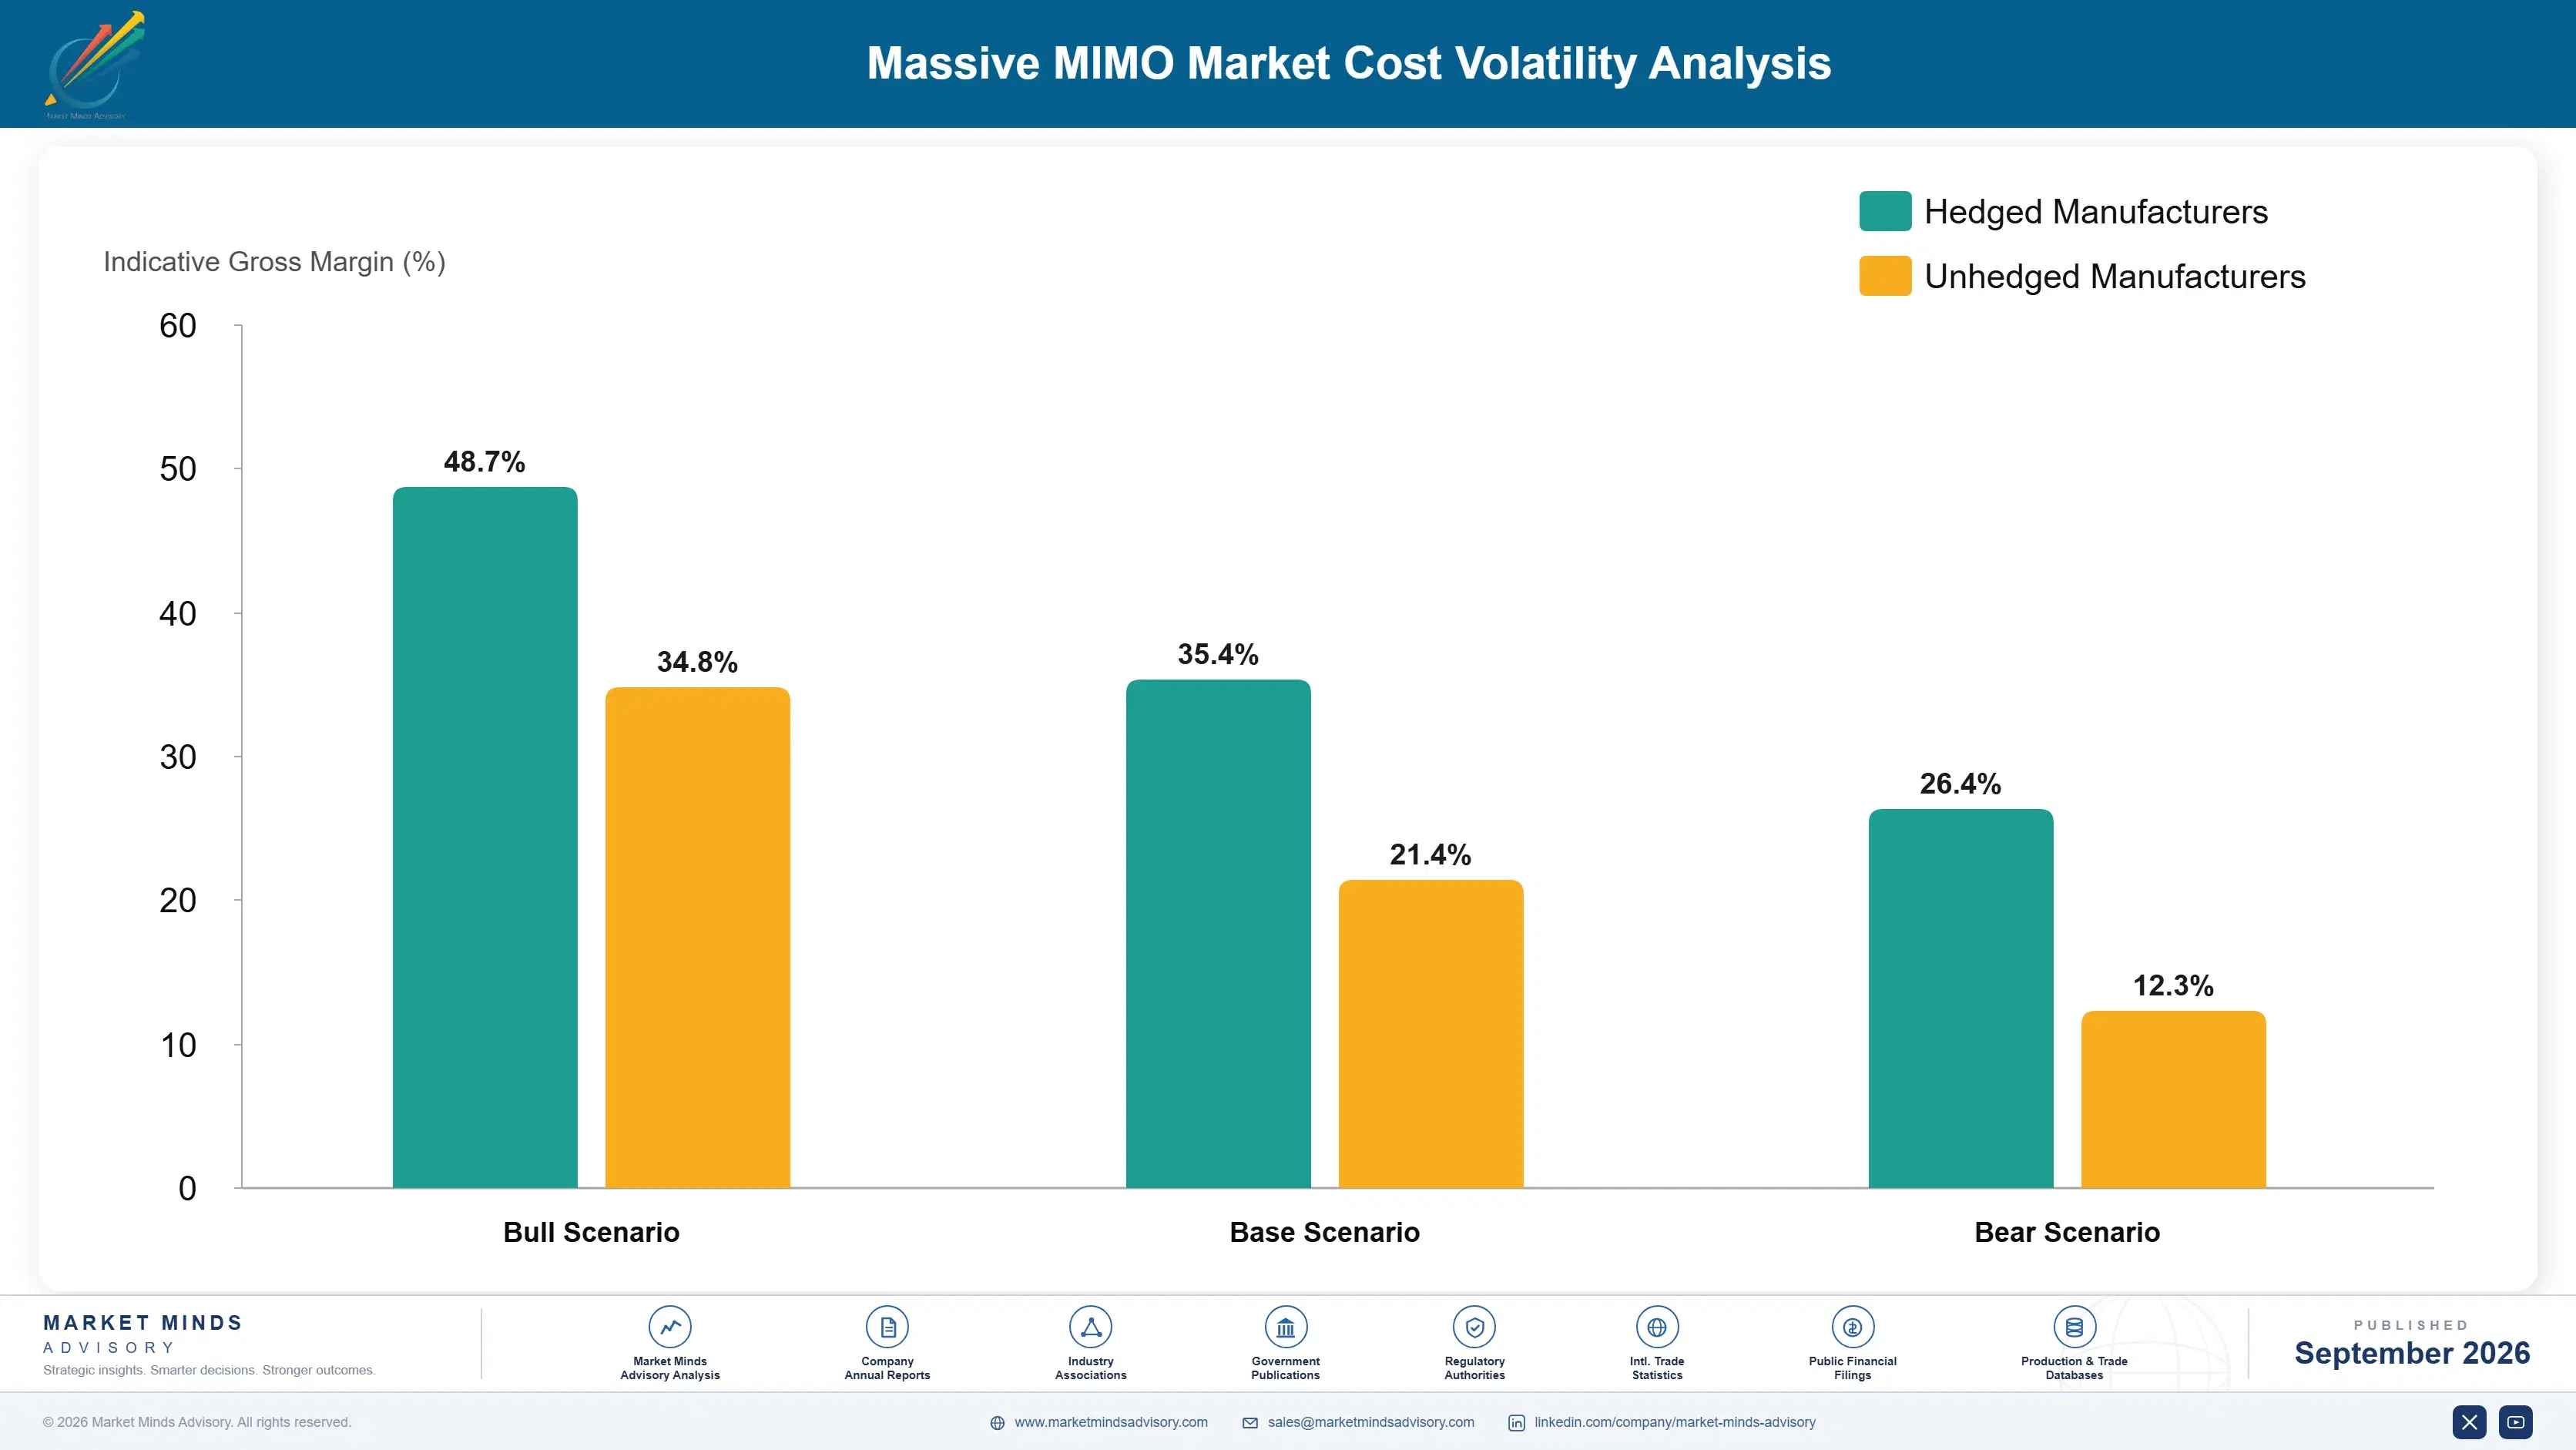
Three inputs dominate manufacturing cost. Radio frequency front end components, principally power amplifiers and transceivers replicated across dozens of chains, run 34% to 42% of cost of goods sold. Digital processing and beamforming silicon takes 18% to 24%. Filters, mechanical housing, and thermal management add a further 20% to 26%, higher than conventional radios because heat dissipation at these power levels is genuinely difficult.
Gallium nitride amplifier and power component pricing tightened through 2024 and 2025 as demand from adjacent applications competed for constrained capacity, and SEMI materials data documents the underlying supply position. Several suppliers described the resulting margin pressure in their annual reports for those years, with amplifier efficiency improvements partly offsetting the cost movement by reducing the thermal management required. Efficiency gains partly offset the movement.

The competitive disadvantage mechanism runs through amplifier efficiency rather than through component price. A supplier whose amplifiers convert less input power to radiated signal needs more thermal management, more mass, and delivers worse watts per gigabit, which now decides deployments. Exposure varies by supplier type. Vertically integrated participants tune amplifiers and digital predistortion together. Component buyers accept whatever efficiency the merchant market currently offers them.
massive-mimo-market-cost-volatility-analysis-1790008947301

Integrate Amplifier And Digital Predistortion Design

Amplifier efficiency determines power draw, thermal mass, and ultimately whether an operator will deploy the unit at all. Designing amplifiers and digital predistortion together rather than combining merchant components produces efficiency gains that compound into lower weight and lower running cost, which is precisely what deployment decisions now turn on. Merchant components cannot be tuned together.

Reduce Projected Area Alongside Absolute Mass

Tower assessment triggers on wind loading as much as on weight, so a lighter unit with the same frontal area may still require reinforcement. Reducing projected area through housing design and antenna arrangement addresses the assessment threshold directly, and it is frequently cheaper to achieve than equivalent mass reduction. Frontal area matters as much as mass.

Share Radio Frequency Platforms Across Band Variants

Operators require the same array architecture across several frequency bands, and treating each as a separate design multiplies component qualification and inventory. A shared radio frequency platform with band specific filtering concentrates purchasing on the dominant cost line and shortens the qualification cycle for each additional variant considerably. Inventory complexity falls at the same time.

Portfolio Architecture for Margin Defence

Margin follows how much of the operator's actual constraint the product removes. Heavy macro arrays are increasingly difficult to place at all, since they combine the electricity bill and the reinforcement requirement in one unit, and pricing reflects that reluctance. Lightweight designs earn better. Arrays with contractual power commitments and fixed wireless optimised units earn most, because both address a business case the operator can approve. Constraint removal sets the whole margin ladder.
The tension between volume and premium runs through site availability rather than through demand. The sites where heavy arrays deploy easily were equipped years ago, so remaining volume sits at locations where weight, power, or lease economics currently prevent installation. Serving those sites requires design investment that only pays across the substantial volume they collectively represent. Those sites collectively represent substantial remaining volume.

High-value pools concentrate where the array enables revenue or removes a blocking cost: fixed wireless deployments where household broadband justifies the capacity, sites where lighter design avoids reinforcement entirely, and replacement programmes in restricted supplier markets where the operator has no choice. These share an operator with a specific reason to proceed. Elsewhere, capacity alone no longer persuades anybody.

Volume / Commodity-Adjacent

Heavy macro arrays combining high power draw with reinforcement requirements, increasingly difficult to place at remaining sites. Pricing reflects operator reluctance rather than technical merit. The nine-point range reflects component integration depth differences between vertically integrated and component buying suppliers.
Gross Margin: 21% to 30%

Premium / Certified

Lightweight and low power arrays that avoid reinforcement thresholds and reduce site electricity cost materially. Deployability rather than capability wins these awards. The ten-point range separates suppliers integrating amplifier and predistortion design from those assembling merchant radio frequency components.
Gross Margin: 34% to 44%

Sustainability / Regulatory / Next-Generation

Arrays sold with contractual power consumption commitments, fixed wireless optimised designs, and supply into restricted markets where qualified alternatives are scarce. Each addresses a specific operator constraint. The twelve-point range reflects how differently restricted market supply is priced against open competition.
Gross Margin: 46% to 58%
massive-mimo-market-portfolio-architecture-1790008947818

High-value Sub-segments and Strategic Watch-out

Lightweight Low Power Array Designs

Fastest growth at 12.6% on deployability rather than capability, avoiding both the electricity bill that stopped deployment and the reinforcement required at 27% of sites. Neither advantage appears in throughput comparison. Operators now specify weight and power before performance in tenders. Deployability is the product.
Gross Margin: 38% to 48%

Restricted Market Replacement Supply

High value where administrative restrictions have removed suppliers and operators face forced replacement they neither planned nor budgeted. Qualified alternatives are scarce and timescales leave no room for first conversations. The twelve-point range reflects how differently urgency is priced across markets. Policy rather than competition.
Gross Margin: 48% to 60%

Fixed Wireless Optimised Arrays

Growing at 10.2% because household broadband revenue per connection justifies capacity that mobile traffic never would at suburban and rural sites. Traffic profile differs entirely from urban deployment. This is demand expanding while urban replacement volume stays flat. Revenue justifies the capacity here. Demand keeps expanding.
Gross Margin: 40% to 50%

Heavy Macro Array Supply

The strategic watch-out. Combines the power draw that stops deployment with the weight that triggers reinforcement, at sites where the easy locations were equipped years ago. The ten-point range reflects integration differences that do not change the placement difficulty at all. Easy sites are already done.
Gross Margin: 18% to 28%

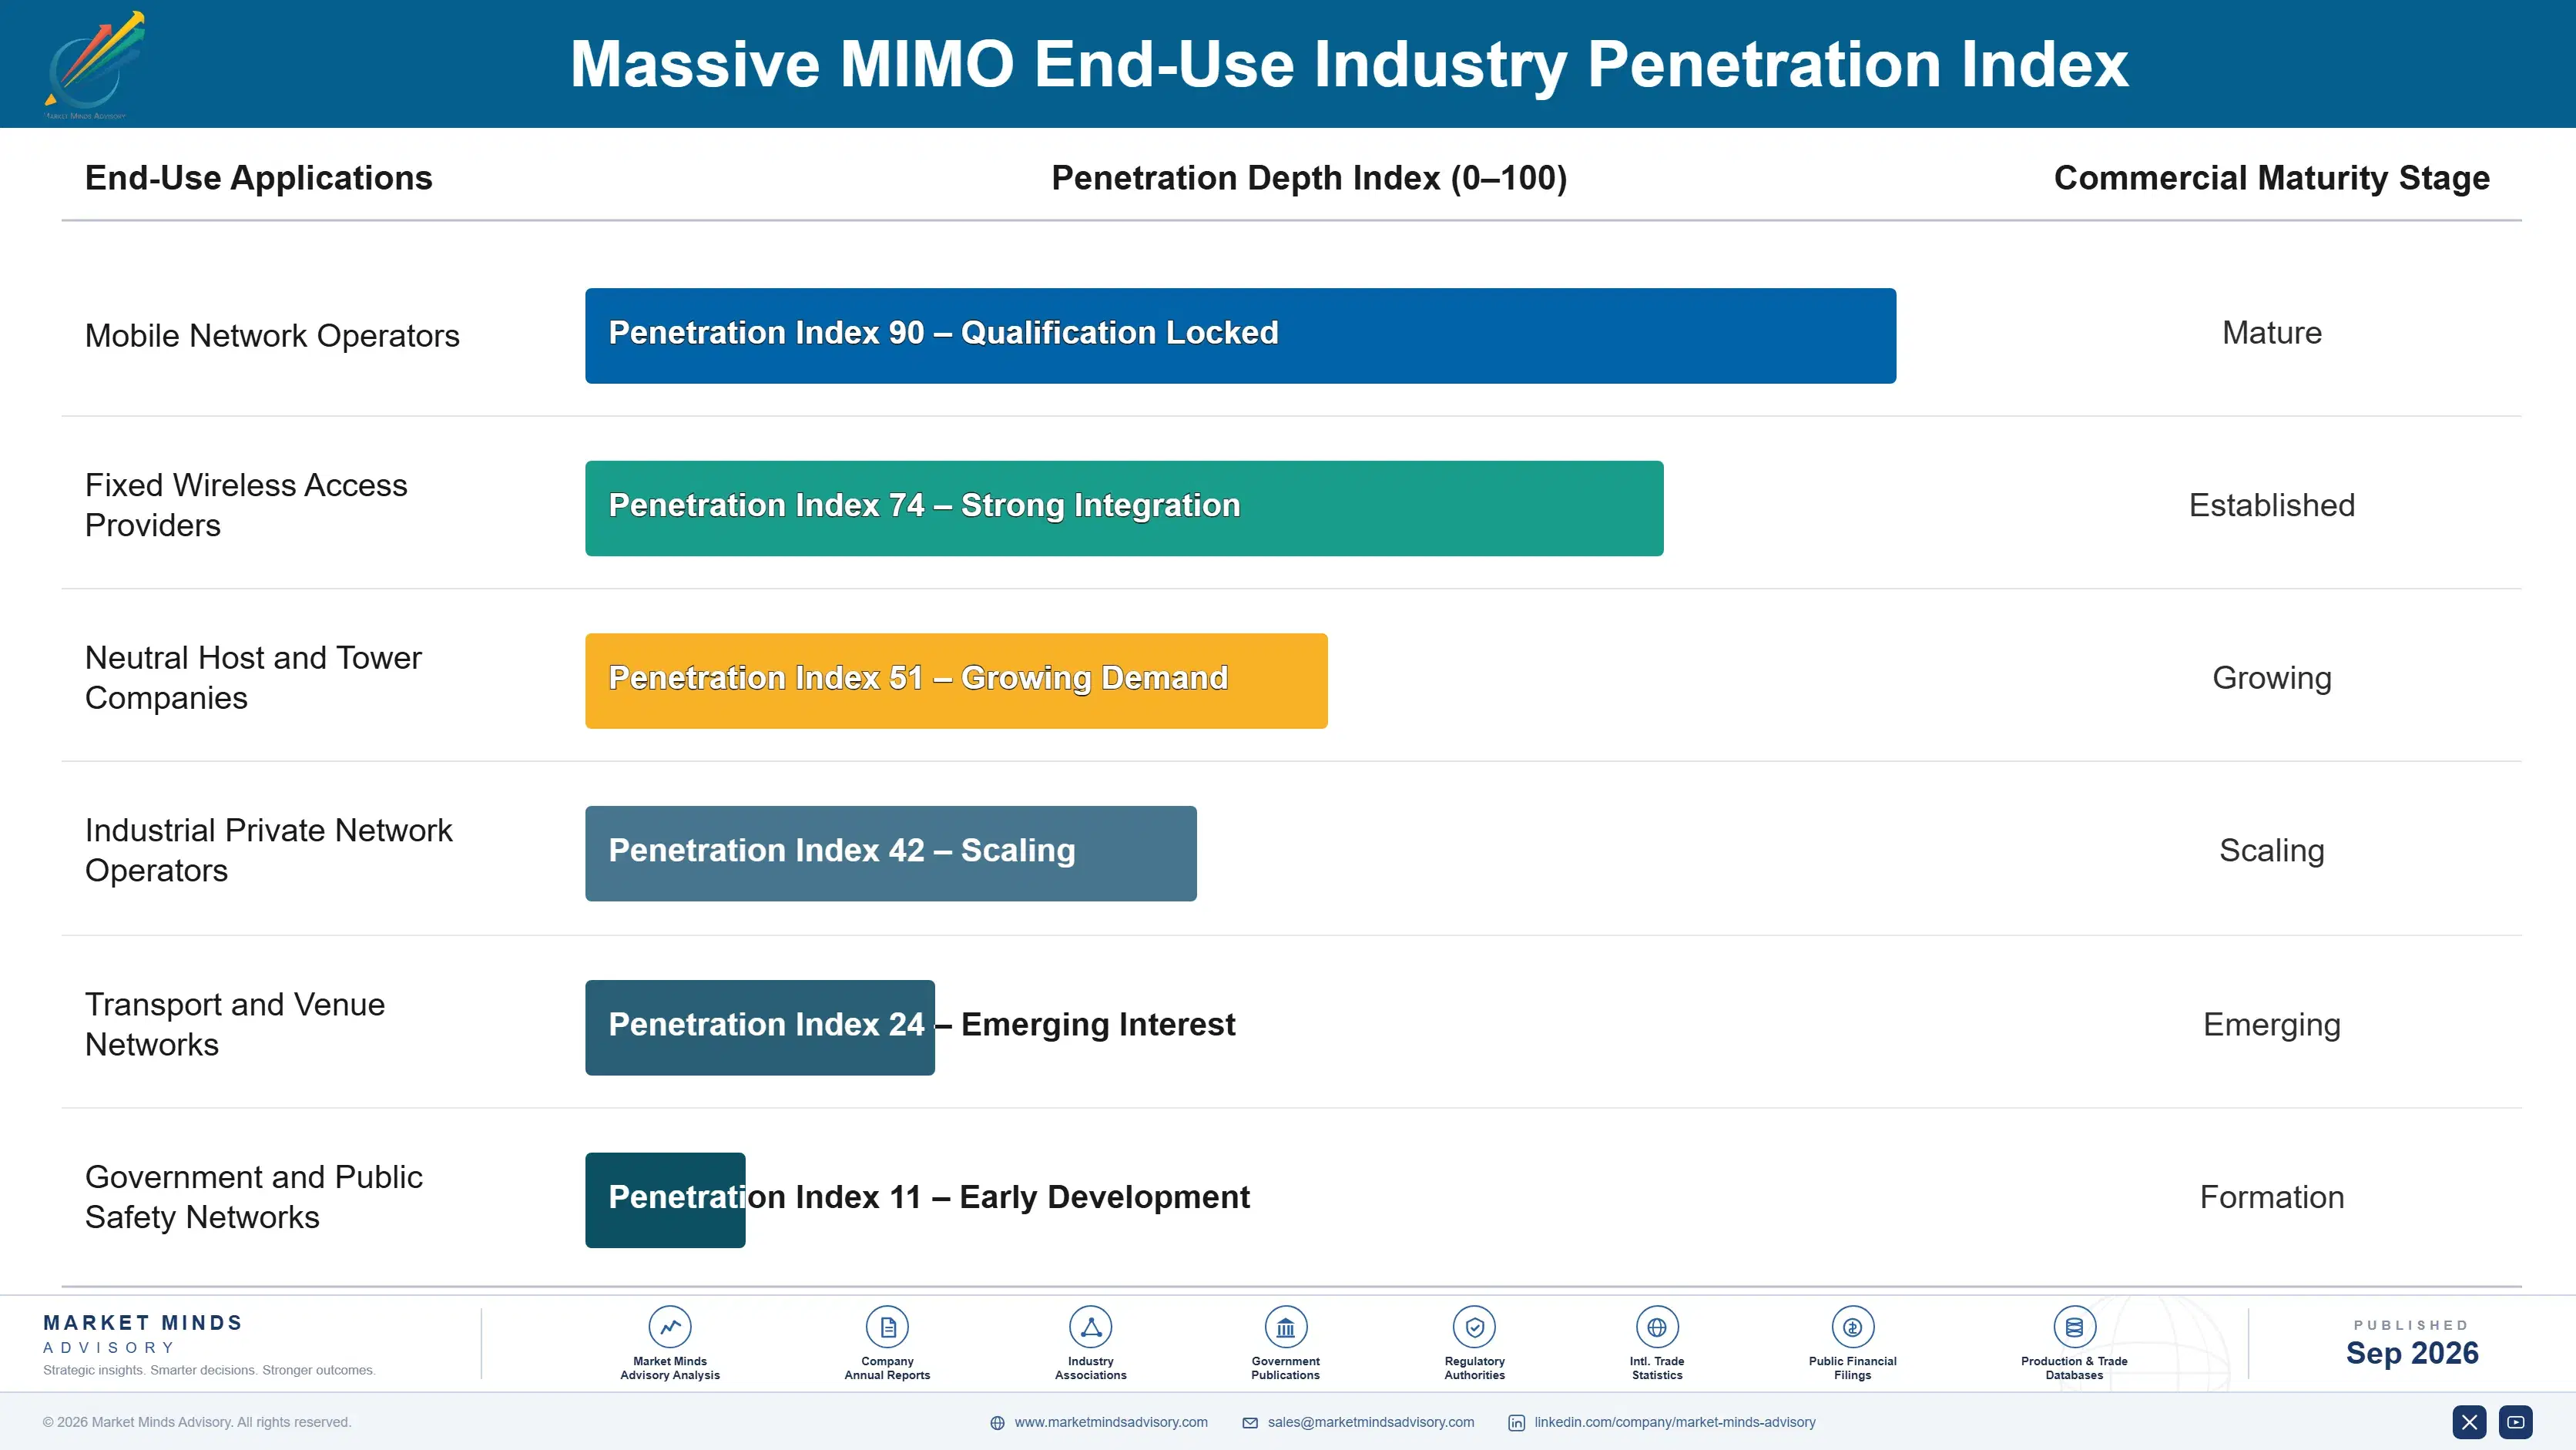
What Drives Repeat Deployment

Demand arrives in deployment programmes rather than in continuous purchasing, and each programme is separately approved against capital that operators are increasingly reluctant to commit. An array installed on a tower stays for a decade, so replacement volume is small and driven by administrative restriction or by power economics rather than by any technical obsolescence. Suppliers forecasting from installed base rather than from approved programmes overestimate consistently.
Commitment depth varies by how the supplier was selected. Operators facing restriction driven replacement choose under time pressure and stay with whoever delivered, since repeating the exercise is unattractive. Operators choosing on energy efficiency reassess at each programme, because efficiency improves generation to generation and the comparison is quantitative. Fixed wireless deployments sit between the two, tied to a business case rather than to a supplier.

The decision has moved from radio planning toward finance. Network planners once specified arrays on coverage and capacity modelling, and they still perform the analysis. Chief financial officers now weigh site electricity across thousands of locations, and property teams weigh lease renegotiations that reinforcement triggers. Suppliers presenting to planners alone are addressing the people who no longer decide whether a programme proceeds.
massive-mimo-market-end-use-penetration-index-1790008948336

Where This Market Rewards

These are among the four positions where our research anticipates prominent divergence between winners and laggards over the coming forecast period. Each is grounded in the demand model, the regulatory perimeter, and the announced capacity pipeline.
01 / ENERGY EFFICIENCY POSITIONING

Watts per gigabit replaced peak throughput entirely

Arrays drawing around 1,180 watts push electricity toward 31% of site operating cost, which is why operators now decline capacity they could genuinely use and why deployment slowed despite traffic continuing to grow. Suppliers leading with energy efficiency and accepting measurable power commitments in supply contracts win deployments roughly 2.6 times more often. It reverses a decade of selling practice and matches the question buyers are actually asking themselves, which is not a comfortable adjustment for anybody involved after a decade of practice.
02 / INSTALLED MASS DISCIPLINE

Reinforcement costs more than the array does

A 34 kilogram unit with meaningful wind loading triggers tower assessment at 27% of sites, and reinforcement brings engineering work plus a lease renegotiation with an owner who understands the operator has no alternative available. Suppliers designing mass and projected area below assessment thresholds win specification 3.2 times more often at those sites. That population is a growing share of what remains undeployed anywhere, and it grows with every easy site already equipped, and reinforcement brings a lease renegotiation with it.
03 / REVENUE LINKED PLACEMENT

Household broadband justifies capacity mobile traffic cannot

Fixed wireless connections generate considerably more revenue per household than mobile service does per subscriber, which makes capacity investment defensible at suburban and rural sites that mobile traffic alone would never support at any power consumption. Fixed wireless optimised arrays grow at 10.2% on that arithmetic. Suppliers building for evening peaks from stationary households reach a business case an operator can approve without argument, which is rare in a market where capacity persuades nobody, and approves it without much argument at all.
04 / RESTRICTION READINESS PLANNING

Policy reshapes this field faster than engineering does

Government restrictions remove suppliers from consideration across a growing number of markets regardless of capability, creating replacement programmes operators neither planned nor budgeted for and leaving them needing qualified alternatives urgently. Suppliers qualified before any tender capture that replacement work roughly 4.1 times more often than those responding afterwards. Qualification costs money against no immediate order, and the timescales involved allow no first conversation, so preparation has to precede the requirement entirely, well before any tender is published anywhere in that market.

Engagement Snapshot From the Field

A live engagement with an industry participant carrying material or product regulatory and market exposure ahead of a defining policy shift, showing how our research translates into a defensible multi-year portfolio strategy.
MARKET MINDS ADVISORY · CLIENT ENGAGEMENT SUMMARY
Massive MIMO Producer Strategic Portfolio Review and Transition Roadmap 2026·Investment Scenario on Massive MIMO Exposure Evaluation 2025-26
CLIENT PROFILE
A European mobile network operator running approximately 14,000 macro sites across two markets, with annual network capital expenditure above USD 780 million (client-reported, unverified by MMA). A mid-band array deployment programme had been approved three years earlier and had reached under half its planned site count, with the shortfall attributed internally to supply and installation delays.
STRATEGIC CHALLENGE
Deployment had slowed and nobody had established why, with network planning blaming installation capacity and operations blaming approvals. Site electricity cost had risen sharply over the same period, and finance had begun asking whether the remaining programme should proceed at all rather than how quickly it could be completed. Nobody had tested either explanation.
MMA APPROACH
MMA analysed deployed and undeployed sites against weight, reinforcement requirement, electricity tariff, and lease terms, measured actual power consumption of installed arrays against specification, and compared the marginal cost of capacity against measured traffic and revenue at each candidate site. Lighter alternatives were assessed against measured traffic at each remaining site.
KEY FINDINGS
  1. Undeployed sites differed from deployed ones almost entirely on reinforcement requirement and electricity tariff, and not at all on traffic demand or planning approval status.
  2. Measured array power consumption exceeded specification by 14% under real traffic conditions, which nobody had verified since the original equipment selection three years earlier.
  3. Tower reinforcement plus lease renegotiation averaged 1.7 times the array cost at affected sites, and had never been included in any programme business case.
  4. A lighter array design available from two suppliers would avoid reinforcement at 71% of the remaining sites, at a modest capacity reduction that measured traffic did not require.
CLIENT PROFILE
A European mobile network operator running approximately 14,000 macro sites across two markets, with annual network capital expenditure above USD 780 million (client-reported, unverified by MMA). A mid-band array deployment programme had been approved three years earlier and had reached under half its planned site count, with the shortfall attributed internally to supply and installation delays.
STRATEGIC CHALLENGE
Deployment had slowed and nobody had established why, with network planning blaming installation capacity and operations blaming approvals. Site electricity cost had risen sharply over the same period, and finance had begun asking whether the remaining programme should proceed at all rather than how quickly it could be completed. Nobody had tested either explanation.
MMA APPROACH
MMA analysed deployed and undeployed sites against weight, reinforcement requirement, electricity tariff, and lease terms, measured actual power consumption of installed arrays against specification, and compared the marginal cost of capacity against measured traffic and revenue at each candidate site. Lighter alternatives were assessed against measured traffic at each remaining site.
KEY FINDINGS
  1. Undeployed sites differed from deployed ones almost entirely on reinforcement requirement and electricity tariff, and not at all on traffic demand or planning approval status.
  2. Measured array power consumption exceeded specification by 14% under real traffic conditions, which nobody had verified since the original equipment selection three years earlier.
  3. Tower reinforcement plus lease renegotiation averaged 1.7 times the array cost at affected sites, and had never been included in any programme business case.
  4. A lighter array design available from two suppliers would avoid reinforcement at 71% of the remaining sites, at a modest capacity reduction that measured traffic did not require.
RECOMMENDED STRATEGY
Phase 1: Phase one: rescope the remaining programme around a lighter array design, accepting reduced peak capacity that measured traffic at those sites does not actually require. Phase 2: Phase two: write measurable power consumption commitments into the supply agreement, verified under real traffic rather than accepted from specification sheets. Phase 3: Phase three: include reinforcement and lease renegotiation cost in site business cases, which had been omitted entirely from the original programme approval.
OUTCOME
Deployment completed across 84% of remaining sites within eighteen months, against under half achieved in the previous three years (client-reported, unverified by MMA). Total programme cost fell 26% despite the additional sites. Measured site electricity increase came in below the revised commitment on every installation.

Frequently Asked Questions

Foundational context covering the market sizes, CAGR, scope, country, region and competition that inform every finding below. This section is provided to cover basics and most often pre-purchase conversations, answered from the MMA Primary Research Dataset.

What is the current size of the Massive MIMO Market?

The market was worth USD 12.8 billion in 2025 and reaches USD 13.9 billion in 2026. Value covers active antenna arrays performing multi-user spatial multiplexing for mobile networks.

How large will the Massive MIMO Market be by 2036?

MMA forecasts USD 31.1 billion by 2036, an increase of USD 17.2 billion across the forecast period. That represents 2.24 times the 2026 base of USD 13.9 billion.

What is the CAGR for the Massive MIMO Market 2026 to 2036?

The base case compound annual growth rate is 8.4%, with a bull case at 9.6% and a bear case at 7.2%. Historical growth from 2020 to 2025 ran at 7.3%.

Which segment is growing fastest?

Lightweight and low power arrays grow at 12.6%, half again the market rate of 8.4%. They win on being deployable rather than on performing better than alternatives.

Who are the major companies in the Massive MIMO Market?

Huawei, Ericsson, Nokia, ZTE, and Samsung Electronics lead the field, holding 84% of shipment value between them. Integration difficulty and proven reliability keep the field narrow.

Which country is growing fastest?

India grows at 13.6%, representing the largest single mid-band deployment anywhere and running at subscriber densities that make the capacity genuinely necessary rather than anticipatory.

Report Segmentation Architecture

The full report scope spans multiple orthogonal segmentation dimensions, with cross-tabulated demand data provided for each dimension pair. Coverage extends further to regional breakdowns, trend trajectories, and the competitive detail needed to support segment-level decision-making.

By Array Configuration

  • 64T64R Macro Active Antenna Units
  • 32T32R Mid-Capacity Units
  • Lightweight and Low Power Arrays
  • Millimetre Wave Beamforming Arrays
  • Fixed Wireless Access Optimised Arrays
  • Private Network and Neutral Host Arrays

By End-Use Industry

  • Mobile Network Operators
  • Fixed Wireless Access Providers
  • Neutral Host and Tower Companies
  • Industrial Private Network Operators
  • Transport and Venue Networks
  • Government and Public Safety Networks

By Commercial Dimension

  • Operator Framework Agreement
  • Network Modernisation Programme
  • Restricted Market Replacement Award
  • Private Network Direct Purchase
  • Neutral Host Deployment Contract
  • Managed Network Service Supply

By Region

  • East Asia
  • North America
  • Western Europe
  • South Asia and Pacific
  • Latin America
  • Middle East and Africa
  • Eastern Europe

Scope, Methodology, and Coverage

Every figure in this report is reproducible from documented input assumptions. The scope below maps the historical period, the forecast horizon, the segmentation dimensions, and the countries covered, alongside the underlying primary and qualitative methodology.
Historical Period
2020 to 2025
Forecast Period
2026 to 2036
Base Year
2025 (USD billions; MMA Primary Research Dataset, September 2026)
Market Definition
This market covers active antenna arrays performing multi-user spatial multiplexing for mobile networks, including 64T64R macro active antenna units, 32T32R mid-capacity units, lightweight and low power arrays, millimetre wave beamforming arrays, fixed wireless access optimised arrays, and private network and neutral host arrays. It excludes passive base station antennas, conventional remote radio units without integrated arrays, baseband and core equipment, tower steelwork, and customer premises devices.
Quantitative Units
USD billions, delivered equipment shipment value
Segmentation Dimensions
Array configuration, end-use industry, commercial dimension, region
Regions Covered
East Asia, North America, Western Europe, South Asia and Pacific, Latin America, Middle East and Africa, Eastern Europe
Countries Covered
China, Japan, South Korea, Taiwan, United States, Canada, Mexico, United Kingdom, Germany, France, Italy, Spain, Netherlands, Sweden, India, Indonesia, Vietnam, Philippines, Australia, Brazil, Colombia, Chile, Saudi Arabia, United Arab Emirates, Nigeria, Kenya, South Africa, Poland, Romania, Czechia
Key Companies Profiled
Huawei, Ericsson, Nokia, ZTE, Samsung Electronics, NEC, Fujitsu, Mavenir, JMA Wireless, Airspan, CommScope, Comba Telecom, Rosenberger, Tongyu Communication, Amphenol, Analog Devices, Qorvo, MediaTek, Marvell, Corning
Quantitative Methodology
Primary survey, n=3,800 respondents, Q4 2025, six countries; demand-side model with trade association cross-validation
Qualitative Methodology
47 expert interviews, Q4 2025; applied to validate demand model assumptions, identify emerging dynamics, and assess competitive positioning
Report Format
PDF and XLSX data workbook (Word format preview document)
Publisher
Market Minds Advisory
Report Code
MMA-2026-TEC-651
Published
September 2026
Contact
sales@marketmindsadvisory.com | www.marketmindsadvisory.com

Purchase the full Massive MIMO Market Report (2026 to 2036).

The full report sizes the massive multiple input multiple output array market across six configurations, seven regions, and thirty countries, with forecasts to 2036 under base, bull, and bear cases. It examines why power consumption rather than capacity now constrains deployment, what tower reinforcement adds to installation economics, and how supplier restrictions reshape the field administratively. Competitive analysis covers twenty participants evaluated consistently on shipment value, with detailed treatment of amplifier efficiency and restricted market replacement volumes. Cost structure, margin architecture by configuration, and regional deployment drivers are analysed in full. Primary research includes 3,800 survey responses and 47 expert interviews.
Six array configurations sized and forecast separately
Twenty participants evaluated on delivered shipment value
Regional deployment and restriction drivers across seven geographies
Margin architecture by configuration and operator constraint
Site economics analysis covering power, weight and lease cost
Reinforcement threshold and deployment refusal benchmarking

Built For The People Who Decide

From boardroom strategy to bench-side execution, this report is read cover-to-cover by leaders shaping the next decade of their industry, turning demand scenarios, market dynamics and valuation benchmarks into decisions.
CXOs/ Presidents/ VPs/ Managers
M&A and Corporate Development
Strategy Teams and R&D Heads
Procurement and Product Directors
Regulatory and Compliance Leaders
Investor Relations and Equity Analysts