Market Minds Advisory
Marking and Coding Equipment Market

Marking and Coding Equipment Market: Consumable Economics, Serialisation Mandates and the Print Nobody Sees Until It Fails

A missing date code stops a production line and a wrong one triggers a recall, which is why a machine costing a few thousand dollars gets chosen on uptime rather than on specification.

Lead Analyst

Bilal Shaikh

Published

September 2026

Make Smarter Decisions with Customized Research Insights

Request a free sample report and evaluate market opportunities, growth trends, and competitive dynamics relevant to your business needs.

2025 MARKET VALUE$6.8BMarket Size 2025
2036 FORECAST VALUE$14.6BBase Case , 2026 to 2036
CAGR 2026 TO 20367.1 %Bull 8.3% / Bear 5.9%
INCREMENTAL OPPORTUNITY$7.3BNet 10- year value creation
EXPANSION MULTIPLE2.00x2036 value over 2026 base
Strategic Levers
M&A Pipeline
Regional Outlook
Country Rankings
Competitive Intelligence
Segmental Deep-dive
Call-Us : 91 93563 13602

Executive Snapshot and Market Trajectory

Nobody buys a coder because they want one. They buy it because product cannot legally leave the factory without a date code, and because a printer that stops takes the whole line down with it while everything upstream keeps producing. Downtime runs near USD 340 a minute while that happens.
Laser marking compounds at 10.7%, exactly 1.50 times the market, on a straightforward argument: it consumes no ink, no solvent and no make-up fluid, which removes roughly 62% of the lifetime cost of running a continuous inkjet coder. East Asia holds 32% of demand, above the usual band, on packaging line installation volumes no other region approaches. Line installation volumes there dwarf every other region.
Five suppliers hold 57%, and consumables explain most of that. Ink, solvent and service generate more revenue over a machine's life than the machine ever did, and a coder tied to proprietary fluid cartridges renews that stream without ever being retendered by anybody. That fluid stream funds the field service density customers are genuinely buying, which is what makes laser conversion more commercially disruptive than its share suggests. Nobody retenders a fluid contract.
Market Definition
The market covers equipment that applies variable codes, dates and identifiers directly to products and packaging on production lines, spanning continuous inkjet coders, thermal inkjet systems, thermal transfer overprinters, laser marking systems, print and apply labelling systems, and large character case coding, together with the inks, solvents and consumables they use. Pre-printed labels, packaging printing presses and standalone barcode scanners are excluded.
Base Year Value
$6.8B in 2025 (MMA Primary Research Dataset, August 2026)
Forecast Period
2026 to 2036, eleven discrete annual values
CAGR
7.1% base case. Bull 8.3%. Bear 5.9%.
Fastest Growth Segment
Laser Marking Systems: 10.7% CAGR
Fastest Growth Country
India: 11.2% CAGR
Fastest Growth Region
South Asia and Pacific: 9.3% CAGR
Largest Region
East Asia: 32% of 2025 global value
Market Leaders
Danaher, Dover Corporation, Brother Industries, Matthews International, Hitachi Industrial Equipment. Source: MMA Analysis based on company annual reports.
Primary Survey
n=3,800 procurement and R&D decision-makers, Q4 2025, six countries
Methodology
Demand-side build-up, cross-validated against public data, 47 expert interviews

Marking and Coding Equipment Market Forecast Scenarios

marking-and-coding-equipment-market-size-forecast-scenario-1787308564111
Growth ran at an implied 5.9% across 2020 to 2025 and the shape was uneven. Equipment orders paused through 2020 while consumable revenue held steady, since installed coders kept running on lines that never stopped, then serialisation and traceability requirements across pharmaceutical, food and tobacco pulled capital spending forward sharply from 2022 onward. Consumables never paused at all.
The base case at 7.1% rests on three mechanisms. Traceability regulation keeps widening beyond pharmaceutical serialisation into food, agrochemicals and consumer goods, and each new requirement converts a line that previously printed nothing. Laser systems keep displacing inkjet on consumable economics. And integration with line control and vision inspection is raising system value well above the coder itself. Regulation rather than replacement is doing most of the work. None of the three depends on line replacement cycles.
The bull case at 8.3% assumes item-level traceability requirements extend into further food and consumer categories, since those mandates convert entire line populations rather than individual machines. The bear case at 5.9% follows from capital spending restraint across food and beverage manufacturing, where buyers defer replacement and run ageing coders harder while continuing to consume inks and service. Consumables hold up either way.

The Cheapest Machine on the Line and the Most Disruptive

Coding equipment occupies a strange commercial position. The machine itself costs a fraction of the filler, the capper or the case packer around it, and it is the one most likely to stop the line. When a coder fails, everything upstream keeps producing into a buffer that empties in minutes, and downtime runs near USD 340 a minute on a typical food or beverage line.
TOP FIVE CONCENTRATION57%Combined share held by the five largest global suppliers
CONSUMABLE LIFETIME SHARE62% of spendInk, solvent and service against original equipment purchase price
LINE DOWNTIME COSTUSD 340 per minuteTypical production loss when a coder stops a packaging line
INSTALLED BASE AGE9 years medianMedian age of coding equipment currently running in production
SERVICE RESPONSE REQUIREMENT4 hoursResponse time typically demanded in food and beverage contracts
CODE VERIFICATION ADOPTION48% of linesInstallations pairing a coder with vision verification of output
That asymmetry decides how these machines are bought. Service response is written into contracts at four hours, and buyers weigh uptime history far above print resolution or throughput figures. It also explains why the installed base runs to a median nine years: a coder that has never failed is not replaced, whatever a newer machine might offer on paper or on consumable cost.
The economics sit in fluids rather than hardware. A continuous inkjet coder consumes around 1.4 litres of make-up solvent a day plus ink, and over a machine life consumables and service account for roughly 62% of total spend. Suppliers price equipment accordingly and defend the fluid stream, which is exactly what laser marking attacks by consuming nothing at all.
"I have never seen a coder chosen on print quality. I have seen dozens chosen because an engineer remembered a supplier who turned up at two in the morning, and that memory outlives every specification comparison anybody ever ran."
Director, Packaging Line Equipment and Industrial Coding Practice · MMA Industri

Market Trends

Laser Marking Attacks the Consumable Revenue Model Directly

A laser marker uses no ink, no solvent and no make-up fluid, which removes the roughly 62% of lifetime cost that consumables and service represent on a continuous inkjet installation. It also eliminates solvent handling, ventilation requirements and the fluid inventory a plant must hold. Payback against inkjet running costs typically falls inside three years at reasonable line utilisation. The segment compounds at 10.7% against a market at 7.1%, and it threatens the recurring revenue that has funded the industry's service model for decades. Substrate compatibility is the only real limit.
Market Impact: Downtime costing USD 340 per minute
Traceability Mandates Convert Lines That Printed Nothing Before

Pharmaceutical serialisation under the European Falsified Medicines Directive and the United States Drug Supply Chain Security Act established item-level unique coding, and comparable requirements are now spreading into food, agrochemicals, tobacco and consumer goods across multiple jurisdictions. Each new mandate converts entire line populations rather than individual machines, because compliance is not optional and the deadline applies to everyone simultaneously. Roughly 48% of installations now pair the coder with vision verification, since an unreadable mandated code is a compliance failure rather than a cosmetic one. Deadlines arrive for everyone at once.
Market Impact: Integrated systems at 3x standalone

Market Opportunities and Growth Drivers

Downtime Cost Makes Service Response the Deciding Variable

A stopped coder halts a packaging line while everything upstream continues producing into a buffer measured in minutes, and the resulting loss runs near USD 340 a minute on a typical food or beverage line. Four hour service response is written into contracts as standard, and buyers weigh uptime history above every technical specification. That reality favours suppliers with dense field service networks and penalises those competing on machine capability alone, regardless of how good the equipment might be. Specification comparisons rarely change an outcome. Equipment capability is almost beside the point.
Market Impact: Installed base at 9 years median

Line Integration Raises System Value Above the Coder Itself

Coders increasingly connect to line control systems, receiving batch and product data automatically rather than relying on an operator typing a date. That removes the most common source of miscoding, which is human entry error, and it generates the audit trail that traceability requirements demand. Vision verification closes the loop by confirming the printed code is readable before the pack moves on. Integrated installations carry values several times a standalone coder, and they are specified during line design rather than bought as replacements. That conversation happens with the machinery builder months before any coding supplier is normally contacted.
Market Impact: Laser removing 62% recurring revenu

Market Restraints and Challenges

Installed Coders Run Long Past Any Economic Replacement Point

Median installed age runs nine years and much equipment is considerably older. The root cause is that a working coder producing legible codes competes for capital against machinery that has actually failed, and no engineer volunteers to replace something that has never caused a stoppage. Consumable savings arguments rarely reach the capital committee. Suppliers mitigate by funding replacement from operating cost rather than capital budgets, and by offering laser conversions where the running cost difference is large enough to clear approval thresholds quickly. Approval thresholds decide the outcome. Payback inside three years clears most limits.
Market Impact: Consumables at 62% of lifetime spen

Laser Conversion Erodes the Fluid Revenue That Funds Service

Consumables and service generate roughly 62% of lifetime spend on an inkjet installation, and that stream funds the field service density buyers demand. Laser systems consume nothing, so every conversion removes recurring revenue while the service obligation on the remaining installed base continues. The root cause is that the industry's commercial model was built around fluid sales rather than equipment margin. Suppliers mitigate by pricing laser hardware to reflect the lost stream and by attaching service and verification contracts that renew independently of consumption. The obligation persists after the funding leaves.
Market Impact: Verification paired on 48% of lines
3 additional market trends, 4 additional growth drivers, and 2 additional restraints and challenges are covered in the full report. Contact sales@marketmindsadvisory.com to access the complete intelligence.

Segment CAGR and Growth Architecture

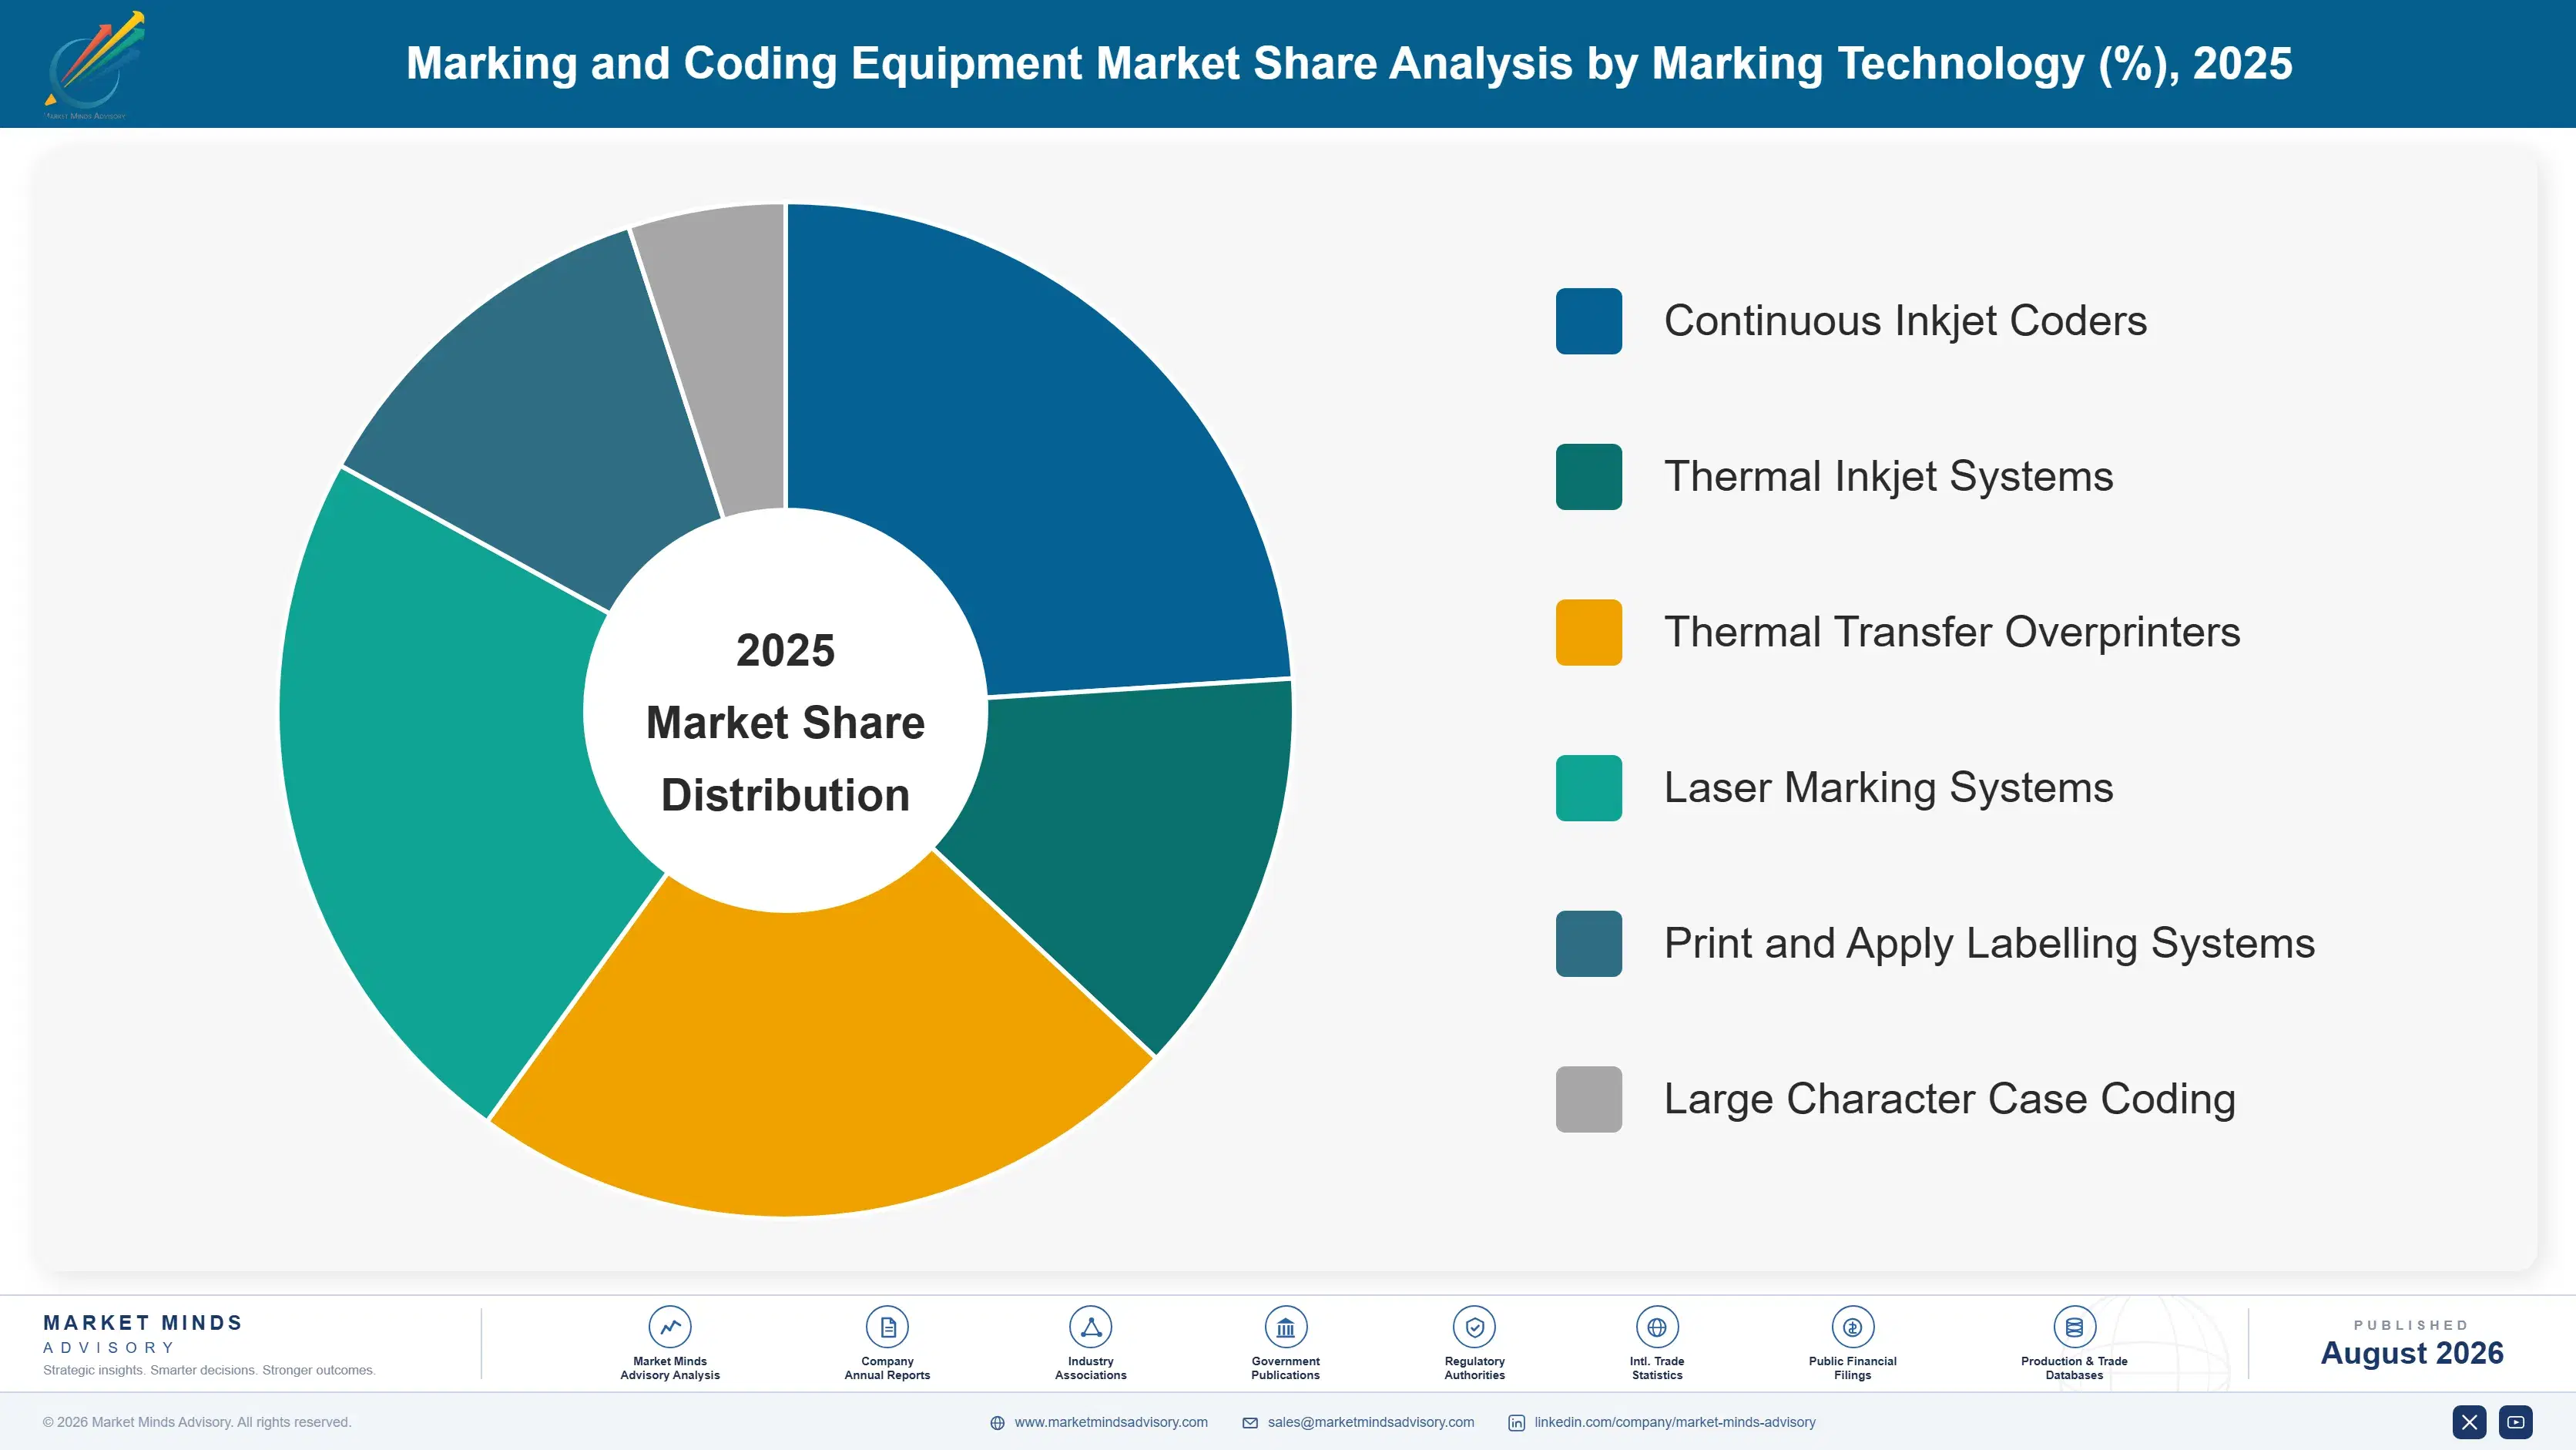
Segmentation follows marking technology, because each carries different consumable economics, different substrate compatibility and a different service burden. A continuous inkjet coder and a laser marker produce comparable codes and sit at opposite ends of the running cost, maintenance and installation requirement spectrum. Technology choice decides the running cost and the service burden together.
marking-and-coding-equipment-market-market-share-analysis-1787308564647

Laser Marking Systems

Laser marking compounds at 10.7%, exactly 1.50 times the market rate, on an argument the incumbent technology cannot answer. It consumes no ink, no solvent and no make-up fluid, removing the roughly 62% of lifetime cost that consumables and service represent on continuous inkjet. It also eliminates solvent storage, ventilation and the handling procedures that come with flammable fluids in a food plant. The constraints are real: laser marks by ablating or discolouring the substrate, so it works beautifully on glass, coated card and some plastics and poorly on others, and extraction is required to remove the vapour it generates. Where the substrate suits it, payback against inkjet running costs typically falls inside three years.
CAGR 10.7%

Print and Apply Labelling Systems

Print and apply systems grow at 8.6% by handling what direct coding cannot. Where a code must carry substantial data, survive a distribution environment, or sit on a surface no printer can mark reliably, a printed label applied automatically is the only workable answer. Logistics labelling under retailer and carrier requirements has driven most of the growth, alongside pharmaceutical serialisation where the label carries the unique identifier and a tamper feature together. The mechanical complexity is the weakness, since applicators involve moving parts, air supply and label web handling that all present failure modes a solid-state laser simply does not have, which raises the service burden considerably. Nothing else handles those applications.
CAGR 8.6%
Full segment breakdown across 6 segments available in the complete report.

Regional Architecture and Country Demand Map

Demand follows packaging line population rather than consumption, since a coder is installed where product is packed. Regulation determines how many lines must code at all, and that varies more sharply between regions than manufacturing output does. Regulatory scope rather than manufacturing output is the map worth reading.

East Asia

East Asia holds 32% of global demand. Note: this exceeds the standard band because packaging line installations across China alone outnumber those of any other region several times over, and a coder is installed wherever product is packed. Chinese food, beverage, pharmaceutical and consumer goods manufacturing generates continuous line addition, and domestic suppliers including Hitachi's local competitors serve much of the standard inkjet volume at prices international suppliers cannot match. Chinese pharmaceutical traceability requirements have driven serialisation installations at scale. Japanese demand is smaller, technically exacting and weighted toward laser and integrated systems, with domestic suppliers holding strong positions. Korean demand follows electronics and food processing. Regional growth of 8.1% tracks line installation rather than regulation.
Share: 32% | CAGR: 8.1% (2026 to 2036)

South Asia and Pacific

The fastest growing region at 9.3%, with India compounding at 11.2%, South Asia and Pacific accounts for 12% of demand. Indian packaged food, pharmaceutical and agrochemical manufacturing has expanded rapidly, and regulatory requirements have followed: pharmaceutical export coding requirements and domestic food labelling rules have both converted lines that previously printed nothing at all. Price sensitivity is acute, which favours thermal inkjet and entry continuous inkjet over laser and integrated systems despite the running cost arithmetic. Service network density is the practical constraint on supplier selection, since a four hour response is difficult to guarantee outside major industrial clusters. Australian and Southeast Asian demand is smaller and more specification-driven. Service coverage limits supplier choice.
Share: 12% | CAGR: 9.3% (2026 to 2036)
Regional intelligence for 5 additional markets available in the complete report: North America, Western Europe, Latin America, Middle East and Africa, Eastern Europe. Contact sales@marketmindsadvisory.com.
marking-and-coding-equipment-market-country-cagr-analysis-1787308565175

Defending Fluids While Selling Lasers

The commercial model here was built on consumables, and the fastest-growing technology consumes nothing. Every position worth holding either protects the recurring stream or replaces it with something that renews on a different basis. Four do, and none of them competes on machine specification. Machine specification decides almost nothing here, and it never has.

Fund Replacement From Operating Cost Not Capital Budgets

Median installed age runs nine years because a coder that has never failed cannot compete for capital against machinery that has. Consumable savings arguments die at the capital committee. Suppliers that present laser conversion as an operating cost reduction, funded from the fluid spend it eliminates, move the approval to a threshold that clears in weeks rather than budget cycles. With consumables at 62% of lifetime cost the arithmetic is genuinely strong, and payback inside three years clears most operating approval limits without escalation. Budget cycles are avoided entirely. Escalation is rarely needed.
Market Impact: Consumables now representing 62% of

Attach Verification and Service to Replace Fluid Revenue

Every laser conversion removes the consumable stream that funds field service density, and that density is what customers actually buy. Attaching vision verification and contracted service that renew annually replaces recurring revenue on a basis independent of consumption. Verification already pairs with 48% of installations because an unreadable mandated code is a compliance failure. Suppliers pricing laser hardware to reflect the lost fluid stream, and contracting service separately, protect the economics that make a four hour response commercially possible at all. Recurring revenue survives the technology shift. Four hour response stays economic.
Market Impact: Verification now attached to 48% of

Reach Line Designers Before Replacement Buyers

Integrated installations connecting the coder to line control and vision inspection carry values several times a standalone machine, and they are specified during line design rather than bought when something fails. That means the decision happens with the machinery builder or the engineering contractor, months before any coding supplier would normally be contacted. Suppliers holding original equipment relationships with packaging machinery builders reach that conversation; those selling replacement machines to plant engineers never do, and they compete for the least valuable version of the same installation. Integrated installations carry roughly 3 times the value of a standalone coder.
Market Impact: Integrated systems worth 3x a stand

Build Service Density Ahead of Equipment Placement

A stopped coder costs roughly USD 340 a minute in lost production, and four hour response is written into food and beverage contracts as standard. Buyers weigh uptime history above every technical specification, and an engineer who remembers a supplier attending overnight will specify that supplier for a decade. Service network density is therefore the primary asset in this business and equipment is close to a means of placing it. Suppliers entering a geography without service coverage lose accounts they were technically well positioned to win. Equipment placement follows the network.
Market Impact: Downtime now costing USD 340 every

Who Controls the Margin Pool

Five suppliers hold 57% of the market measured on equipment and consumable revenue, the basis applied consistently through this section. Concentration is high for industrial equipment, and service density rather than technology explains it. Danaher and Dover Corporation lead through Videojet and Markem-Imaje respectively, both built on field service networks. Technology capability separates almost nobody.
Competition operates on three dimensions. Field service density decides who can guarantee the four hour response contracts demand, and it is expensive to build and impossible to fake. Consumable attachment decides the recurring revenue that funds that density. And line integration capability decides participation in the installations specified during machinery design rather than bought after a failure. All three are built slowly and cannot be bought. Density in particular takes many years to establish.

Two pressures are reshaping position. Laser conversion removes the fluid revenue funding service networks, which pressures suppliers whose economics depend on it most. Against that, regional and Chinese suppliers compete hard on entry inkjet where service expectations are lower. Rankings will move toward whoever replaces fluid revenue with verification and service contracts fastest. Very few are moving quickly enough.
marking-and-coding-equipment-market-company-positioning-matrix-1787308565700

Competitive Moat and Risk Dimensions

DANAHER

Moat: Service network and installed base

The Videojet field service network is among the densest in industrial equipment, which matters because customers buy uptime rather than machines and write four hour response into contracts. That network is funded by consumable revenue from a very large installed base, and the two reinforce each other in a way a new entrant cannot replicate by pricing equipment competitively.
DANAHER

Risk: Fluid revenue dependence

The service density that defines the position is funded by ink and solvent sales, and laser conversion removes that revenue while leaving the service obligation intact on remaining installations. Every conversion improves the customer's economics and weakens the model that made the supplier attractive, which is an uncomfortable position to manage across a large installed base.
DOVER CORPORATION

Moat: Pharmaceutical serialisation depth

Markem-Imaje holds strong positions in pharmaceutical serialisation and regulated coding, where the requirement is not a printed code but a validated system producing verifiable unique identifiers with an audit trail. That capability is qualified into customer compliance documentation, which makes displacement a regulatory exercise rather than a procurement decision and protects the position considerably.
DOVER CORPORATION

Risk: Laser portfolio positioning

Laser marking compounds at 10.7% against a market at 7.1% and attacks consumable economics directly, and suppliers with strong fluid businesses face a genuine conflict in promoting it. Competitors without a large ink revenue base to protect can push laser conversion aggressively, and the customer arithmetic favours them in every application where the substrate permits marking.

Players Tracked

Prominent Players

Danaher
Dover Corporation
Brother Industries
Matthews International
Hitachi Industrial Equipment

Other Key Players

ITW
Kagome Kikai
Leibinger
REA Elektronik
Squid Ink Manufacturing
Control Print
Anser Coding
Han's Laser Technology
Trotec Laser
Coherent
Bluhm Systeme
InkJet Inc
Weber Marking Systems
ID Technology
Diagraph

Recent Developments

JANUARY 2025

Food traceability requirements extend coding into new categories

Food safety traceability rules across several jurisdictions extended item and case level coding requirements into categories previously carrying only a date code. These were regulatory implementations rather than commercial developments, and they convert entire line populations rather than individual machines. Compliance is not optional for anybody affected.
Signal: A mandate applies to everyone at once, whi
MAY 2025

Laser conversion accelerates in solvent-restricted food plants

Food manufacturers expanded laser marking installation where solvent storage, ventilation and handling procedures had become operationally burdensome, independent of any running cost comparison. This reflects plant policy rather than corporate transactions, and it removes consumable revenue permanently from those lines. Running cost arguments had never moved those installations.
Signal: Solvent handling policy is converting inst
SEPTEMBER 2025

Vision verification becomes standard on regulated coding lines

Manufacturers subject to serialisation and traceability requirements increasingly paired coders with vision verification confirming code readability before packs progress. These were compliance practice changes rather than acquisitions, and they add a recurring service and calibration requirement alongside the equipment. Calibration and service requirements follow the verification equipment.
Signal: An unreadable mandated code is a complianc

Fluids, Electronics and Field Engineers

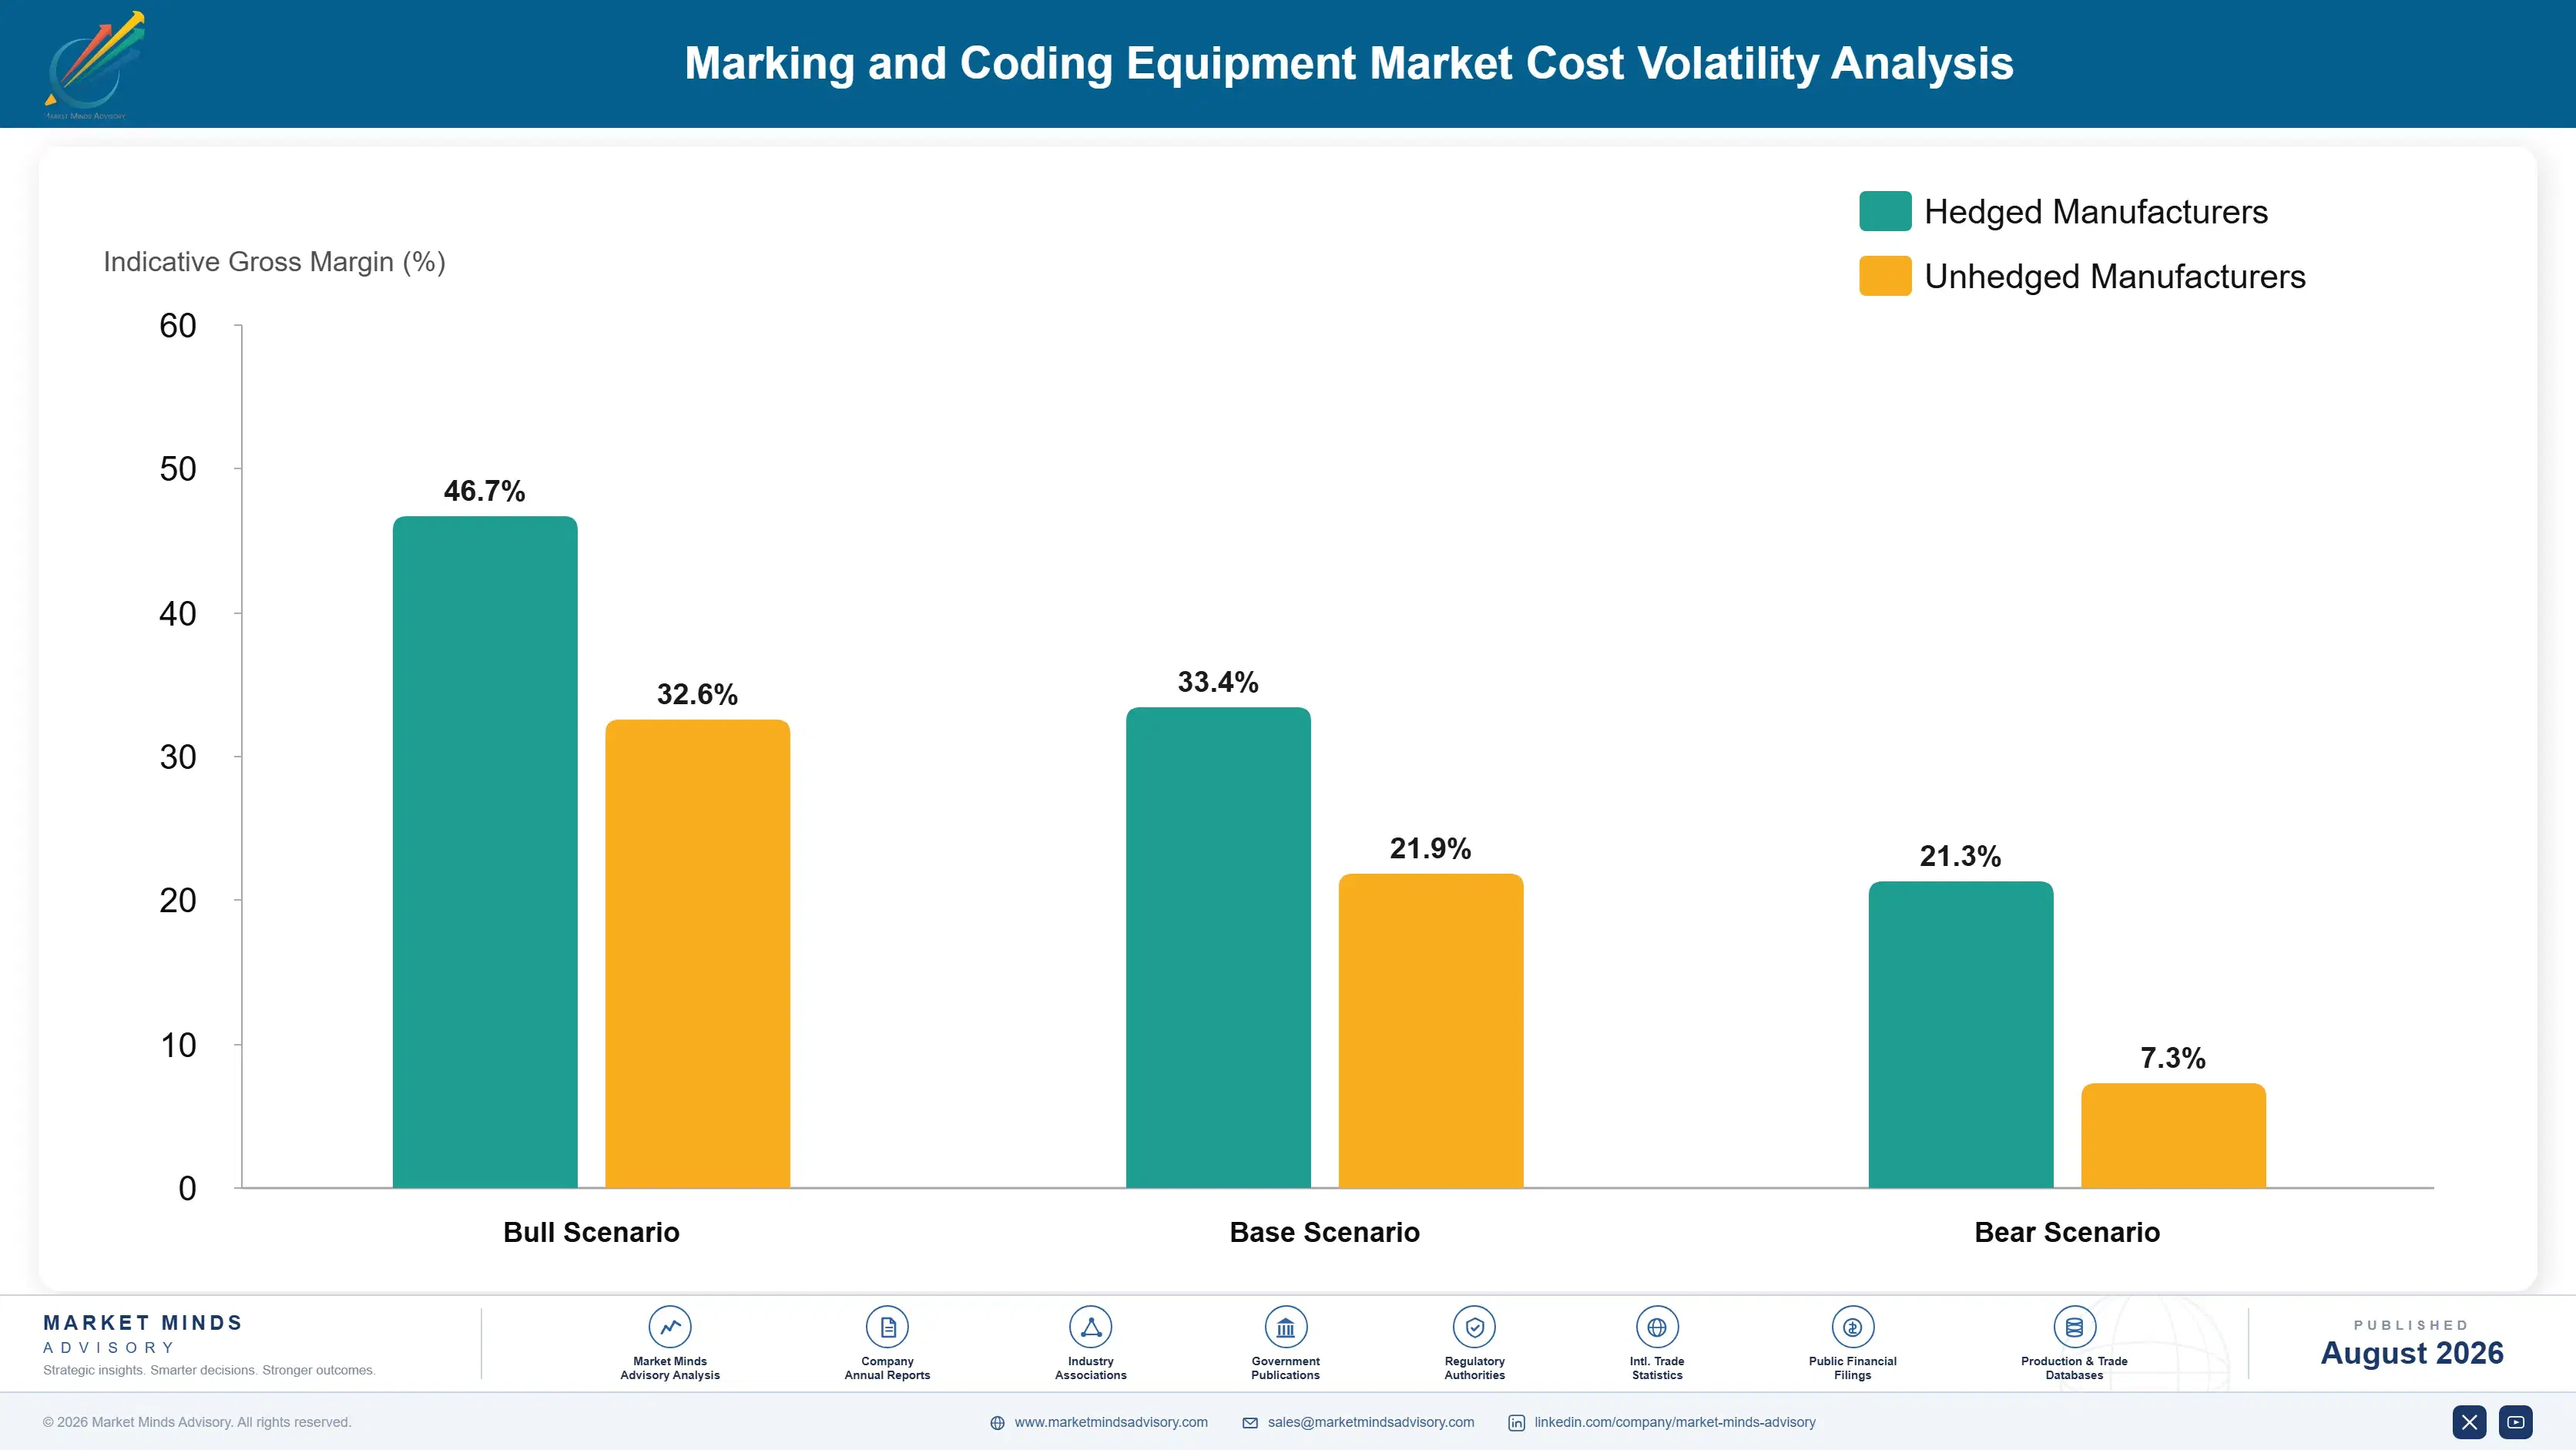
Field service is the dominant cost in this business rather than manufacturing. Service engineers, vehicles and spares inventory account for roughly 34% of cost of delivery, and that network is what customers are actually buying. Electronic components, printheads and mechanical assemblies run a further 27%. Ink and solvent raw materials are comparatively cheap, which is precisely why consumable margins are strong.
Semiconductor and electronic component availability disrupted equipment build schedules through 2021 and 2022, extending lead times across the industry and pushing customers toward repair rather than replacement. Company annual reports covering product identification segments disclose the resulting backlog and margin effects. Solvent and pigment intermediate costs rose in parallel through the European energy disruption documented in International Energy Agency reporting across that period. Repair displaced replacement for several quarters.

Exposure divides by revenue mix rather than by scale. Suppliers weighted toward consumable revenue carry high service costs funded by strong fluid margins, which works well until laser conversion removes the fluid. Those weighted toward equipment and contracted service carry lower recurring margin but no consumption dependency. The disadvantage falls hardest on suppliers with dense networks and shrinking fluid volume, since the obligation persists after the funding leaves.
marking-and-coding-equipment-market-cost-volatility-analysis-1787308565898

Contract service independently of consumable consumption

Field service density is funded by fluid margin in most supplier models, and laser conversion removes that funding while the obligation remains. Contracting service annually against installed equipment rather than recovering it through consumable pricing decouples the two, which protects network economics as the technology mix shifts toward systems that consume nothing at all.

Dual-source printheads and control electronics

Electronic component availability caused most of the 2021 and 2022 build disruption, and qualifying a second source costs one engineering cycle against months of extended lead time later. Standardising control architecture across product families reduces the number of distinct components requiring qualification and shortens the response when a supply route closes unexpectedly. Response times shorten as a result.

Route service coverage through installed base density

A four hour response is only economic where installed base density supports it, so equipment placement and service viability are the same decision rather than separate ones. Concentrating placement geographically, even at the cost of declining distant opportunities, produces networks that are profitable rather than networks that merely exist on a coverage map. Coverage maps flatter nobody.

Portfolio Architecture for Margin Defence

The portfolio separates on how revenue recurs. Continuous inkjet generates fluid consumption that renews daily and funds the service network customers actually buy. Thermal inkjet uses cartridges that renew similarly at lower volumes. Laser consumes nothing and must be priced against the stream it destroys. Print and apply consumes labels and ribbon while carrying the heaviest mechanical service burden of any technology here. How revenue recurs draws the whole ladder.
The tension is genuinely awkward. The fastest-growing technology attacks the commercial model that funds the industry's principal competitive asset, and suppliers promoting laser hardest are frequently those with least fluid revenue to lose. Incumbents managing this well are repricing laser hardware upward and contracting service separately rather than defending inkjet installations that will convert on their own arithmetic. The arithmetic favours the customer either way. Incumbents face the sharpest version of the problem.

High-value pools concentrate where a code carries regulatory weight or where the installation is designed rather than replaced. Pharmaceutical serialisation, verification systems and integrated line installations all qualify, and none of them is awarded on the price of the printer. Printer price decides none of them.

Volume / Commodity-Adjacent Tier

Entry continuous inkjet and thermal inkjet coders applying simple date and batch codes on general packaging lines. Regional and Chinese suppliers compete effectively where service expectations are lower, and equipment margin is thin by design.
Gross Margin: 22-31%

Premium / Certified Tier

Thermal transfer overprinters, print and apply labelling and laser marking systems selected on running cost, substrate capability and uptime record. Service network density rather than machine specification decides most awards in this tier.
Gross Margin: 36-48%

Sustainability / Regulatory / Next-Generation Tier

Serialisation systems, vision verification and integrated line installations connecting coding to control and inspection. The wide margin range reflects the gap between established pharmaceutical serialisation and newer food traceability work still being specified.
Gross Margin: 42-64%
marking-and-coding-equipment-market-portfolio-architecture-1787308566400

Bought on Memory of a Failure

Recurring revenue here is unusually reliable and unusually vulnerable at the same time. An installed inkjet coder consumes ink and solvent every operating day for nine years or more, and that stream renews without ever being retendered because the fluid is proprietary to the machine. It funds the service network that customers actually value. Laser conversion severs both at once, which is why the technology's growth is more commercially disruptive than its share suggests.
Depth varies by regulatory exposure. Pharmaceutical manufacturers buy deepest, treating the coder as a validated system inside compliance documentation. Food and beverage producers buy on uptime and contracted response. Consumer goods packers buy on delivered cost with genuine substitution freedom. Contract packers sit shallowest, running whatever equipment their customer's specification permits and switching without hesitation.

The deciding population has stayed remarkably stable. Coder selection sits with plant engineering and maintenance, and those people choose on service memory rather than on specification. What has changed is that integrated installations are now specified during line design, which moves the decision to a machinery builder the coding supplier may never have met. That is a supplier they may never have met.
marking-and-coding-equipment-market-end-use-penetration-index-1787308566891

Where Coding Suppliers Make Money

These are among the four positions where our research anticipates prominent divergence between winners and laggards over the coming forecast period. Each is grounded in the demand model, the regulatory perimeter, and the announced capacity pipeline.
01 / SERVICE DENSITY PRIMACY

Customers buy a response time and receive a machine with it

A stopped coder halts a packaging line while everything upstream produces into a buffer measured in minutes, at roughly USD 340 a minute in lost output. Four hour response is written into food and beverage contracts as standard, and buyers weigh uptime history above every technical specification a supplier can present. Field service density is therefore the primary commercial asset in this whole business, and suppliers entering a geography without it lose accounts they were otherwise very well placed to win.
02 / CONSUMABLE MODEL TRANSITION

The fastest-growing technology destroys the revenue funding the industry

Consumables and service account for roughly 62% of lifetime spend on a continuous inkjet installation, and that stream funds the service network customers genuinely buy. Laser marking consumes nothing at all and compounds at 10.7% against a market growing at 7.1%. Every single conversion improves the customer's economics while removing the funding for the supplier's principal competitive asset, so laser hardware has to be priced against the recurring stream it eliminates rather than against competing machines on a specification basis.
03 / DESIGN STAGE ACCESS

Integrated installations are specified before any coder is bought

Coders connected to line control and vision inspection carry values several times a standalone machine, and they are specified during the line design stage rather than purchased after a failure. That conversation happens with the packaging machinery builder or the engineering contractor months earlier in the project. Suppliers holding original equipment relationships with those builders reach it, while those selling replacement machines to plant engineers arrive far too late and compete only for the least valuable version of the same installation.
04 / MANDATE CONVERSION TIMING

Regulation converts whole line populations on a single date

Traceability requirements apply to everyone subject to them simultaneously, which converts entire line populations at once rather than individual machines as each one happens to fail. Pharmaceutical serialisation established the pattern, and food, agrochemical and consumer goods requirements are now following it across multiple jurisdictions. Verification now pairs with 48% of installations, because an unreadable mandated code is a compliance failure rather than a cosmetic one, and suppliers positioned ahead of a deadline capture volume that arrives all at once.

Engagement Snapshot From the Field

A live engagement with an industry participant carrying material or product regulatory and market exposure ahead of a defining policy shift, showing how our research translates into a defensible multi-year portfolio strategy.
MARKET MINDS ADVISORY · CLIENT ENGAGEMENT SUMMARY
Marking and Coding Equipment Producer Strategic Portfolio Review and Transition Roadmap 2026·Investment Scenario on Marking and Coding Equipment Exposure Evaluation 2025-26
CLIENT PROFILE
A food and beverage manufacturer operating 34 plants across Europe, North America and Southeast Asia with roughly USD 7.4 billion in revenue (client-reported, unverified by MMA). Coding equipment and consumable spend ran near USD 41 million annually (client-reported, unverified by MMA), purchased plant by plant across nine suppliers with no group specification or shared uptime data.
STRATEGIC CHALLENGE
Coding-related line stoppages had risen for two consecutive years and a group procurement initiative had consolidated consumable purchasing on price, achieving a reported saving. Plant engineering across several sites reported that response times had deteriorated after the consolidation, though nobody had connected the two events in any formal review. No group review had examined the two together.
MMA APPROACH
MMA reconstructed coding-related downtime by plant, supplier and technology across twenty-four months, separating equipment failure from consumable and operator causes. Service response times were measured against contracted commitments, and total cost of ownership was rebuilt per line including downtime rather than equipment and fluid spend alone. Substrate compatibility for laser was assessed plant by plant.
KEY FINDINGS
  1. Coding-related downtime across the network cost several times the consumable saving procurement had achieved, and the increase tracked precisely to plants where the consolidation had changed supplier.
  2. Actual service response averaged well beyond the four hour contracted commitment at eleven plants, all of which sat outside the consolidated supplier's dense coverage areas rather than reflecting any capability shortfall.
  3. Nine plants ran coders on substrates fully compatible with laser marking, where eliminating solvent would have removed both consumable cost and the ventilation compliance burden site management had separately raised.
  4. Operator data entry accounted for a substantial share of miscoding incidents, and only six of the 34 plants had coders connected to line control systems receiving batch data automatically.
CLIENT PROFILE
A food and beverage manufacturer operating 34 plants across Europe, North America and Southeast Asia with roughly USD 7.4 billion in revenue (client-reported, unverified by MMA). Coding equipment and consumable spend ran near USD 41 million annually (client-reported, unverified by MMA), purchased plant by plant across nine suppliers with no group specification or shared uptime data.
STRATEGIC CHALLENGE
Coding-related line stoppages had risen for two consecutive years and a group procurement initiative had consolidated consumable purchasing on price, achieving a reported saving. Plant engineering across several sites reported that response times had deteriorated after the consolidation, though nobody had connected the two events in any formal review. No group review had examined the two together.
MMA APPROACH
MMA reconstructed coding-related downtime by plant, supplier and technology across twenty-four months, separating equipment failure from consumable and operator causes. Service response times were measured against contracted commitments, and total cost of ownership was rebuilt per line including downtime rather than equipment and fluid spend alone. Substrate compatibility for laser was assessed plant by plant.
KEY FINDINGS
  1. Coding-related downtime across the network cost several times the consumable saving procurement had achieved, and the increase tracked precisely to plants where the consolidation had changed supplier.
  2. Actual service response averaged well beyond the four hour contracted commitment at eleven plants, all of which sat outside the consolidated supplier's dense coverage areas rather than reflecting any capability shortfall.
  3. Nine plants ran coders on substrates fully compatible with laser marking, where eliminating solvent would have removed both consumable cost and the ventilation compliance burden site management had separately raised.
  4. Operator data entry accounted for a substantial share of miscoding incidents, and only six of the 34 plants had coders connected to line control systems receiving batch data automatically.
RECOMMENDED STRATEGY
Phase 1: Phase 1 (months 1 to 6): Rebuild supplier selection around measured service response by location rather than consumable pricing across the network. Phase 2: Phase 2 (months 6 to 18): Convert the nine substrate-compatible plants to laser marking funded from eliminated consumable and ventilation compliance cost. Phase 3: Phase 3 (months 18 to 30): Connect coders to line control at all plants and introduce vision verification on regulated product lines.
OUTCOME
Coding-related downtime fell by roughly 57% within eighteen months (client-reported, unverified by MMA). Consumable spend rose by approximately USD 2.1 million against production recovery valued near USD 12 million. Miscoding incidents fell sharply following line control integration at the connected plants (client-reported, unverified by MMA).

Frequently Asked Questions

Foundational context covering the market sizes, CAGR, scope, country, region and competition that inform every finding below. This section is provided to cover basics and most often pre-purchase conversations, answered from the MMA Primary Research Dataset.

What is the current size of the Marking and Coding Equipment Market?

The global market was worth USD 6.8 billion in 2025, reaching USD 7.28 billion in 2026. East Asia holds the largest regional share at 32% of demand.

How large will the Marking and Coding Equipment Market be by 2036?

MMA forecasts USD 14.55 billion by 2036, an expansion multiple of 2.00 times the 2026 base. That represents roughly USD 7.27 billion of incremental value.

What is the CAGR for the Marking and Coding Equipment Market 2026 to 2036?

The base case compounds at 7.1% annually, with a bull case of 8.3% and a bear case of 5.9%. Historical growth from 2020 to 2025 ran at 5.9%.

Which segment is growing fastest?

Laser marking systems compound at 10.7%, exactly 1.50 times the market rate. They consume no ink or solvent, removing roughly 62% of the lifetime cost of running an inkjet coder.

Who are the major companies in the Marking and Coding Equipment Market?

Danaher, Dover Corporation, Brother Industries, Matthews International and Hitachi Industrial Equipment hold a combined 57% of the market. Field service density rather than technology sustains that concentration.

Which country is growing fastest?

India compounds at 11.2%, ahead of every other national market. Packaged food, pharmaceutical and agrochemical manufacturing expansion is converting lines that had previously printed nothing at all.

Report Segmentation Architecture

The full report scope spans multiple orthogonal segmentation dimensions, with cross-tabulated demand data provided for each dimension pair. Coverage extends further to regional breakdowns, trend trajectories, and the competitive detail needed to support segment-level decision-making.

By Marking Technology

  • Continuous Inkjet Coders
  • Thermal Inkjet Systems
  • Thermal Transfer Overprinters
  • Laser Marking Systems
  • Print and Apply Labelling Systems
  • Large Character Case Coding

By End-Use Industry

  • Food and Beverage Manufacturing
  • Pharmaceutical and Healthcare
  • Consumer Packaged Goods
  • Agrochemicals and Industrial Products
  • Electronics and Automotive Components

By Commercial Dimension

  • Direct Supply to Manufacturers
  • Original Equipment Supply to Machinery Builders
  • Distributor and Integrator Channel
  • Consumable and Service Contract Supply

By Region

  • North America
  • Western Europe
  • East Asia
  • South Asia and Pacific
  • Latin America
  • Middle East and Africa
  • Eastern Europe

Scope, Methodology, and Coverage

Every figure in this report is reproducible from documented input assumptions. The scope below maps the historical period, the forecast horizon, the segmentation dimensions, and the countries covered, alongside the underlying primary and qualitative methodology.
Historical Period
2020 to 2025
Forecast Period
2026 to 2036
Base Year
2025 (USD billions; MMA Primary Research Dataset, August 2026)
Market Definition
The market covers equipment that applies variable codes, dates, batch identifiers and unique serial numbers directly to products and packaging on production lines, spanning continuous inkjet coders, thermal inkjet systems, thermal transfer overprinters, laser marking systems, print and apply labelling systems and large character case coding, together with the inks, solvents, ribbons and service contracts associated with them. Pre-printed labels, packaging printing presses, standalone barcode scanners and serialisation software sold independently of equipment are excluded. Sizing is measured at supplier revenue in current prices.
Quantitative Units
USD billions (current prices); installed units and consumable volumes where applicable
Segmentation Dimensions
By Marking Technology; By End-Use Industry; By Commercial Dimension; By Region
Regions Covered
North America, Western Europe, East Asia, South Asia and Pacific, Latin America, Middle East and Africa, Eastern Europe
Countries Covered
USA, China, Germany, France, UK, Japan, South Korea, India, Australia, Canada, Brazil, Mexico, Indonesia, Vietnam, Thailand, Malaysia, UAE, Saudi Arabia, South Africa, Nigeria, Turkey, Poland, Netherlands, Italy, Spain, Sweden, Switzerland, Argentina, Colombia, Singapore, and additional markets relevant to this sector
Key Companies Profiled
Danaher, Dover Corporation, Brother Industries, Matthews International, Hitachi Industrial Equipment, ITW, Kagome Kikai, Leibinger, REA Elektronik, Squid Ink Manufacturing, Control Print, Anser Coding, Han's Laser Technology, Trotec Laser, Coherent, Bluhm Systeme, InkJet Inc, Weber Marking Systems, ID Technology, Diagraph
Quantitative Methodology
Primary survey, n=3,800 respondents, Q4 2025, six countries; demand-side model with trade association cross-validation
Qualitative Methodology
47 expert interviews, Q4 2025; applied to validate demand model assumptions, identify emerging dynamics, and assess competitive positioning
Report Format
PDF and XLSX data workbook (Word format preview document)
Publisher
Market Minds Advisory
Report Code
MMA-2026-CON-745
Published
August 2026
Contact
sales@marketmindsadvisory.com | www.marketmindsadvisory.com

Purchase the full Marking and Coding Equipment Market Report (2026 to 2036).

The full report sizes marking and coding equipment across six technologies, three commercial dimensions and seven regions, with annual forecasts to 2036 under base, bull and bear scenarios. Lifetime cost of ownership is modelled per technology including consumables, service and downtime, which is where laser conversion economics actually resolve. Laser substrate compatibility is assessed by packaging material to identify which installed inkjet population can realistically convert. Traceability mandate timetables are mapped by jurisdiction and category against affected line populations. Twenty suppliers are profiled on a consistent equipment and consumable revenue basis.
Lifetime cost modelled per technology including downtime exposure
Laser substrate compatibility assessed across packaging materials
Traceability mandate timetables mapped by jurisdiction and category
Service network density compared against contracted response commitments
Consumable attachment rates tracked by supplier and technology
Line integration adoption measured by industry and plant size

Built For The People Who Decide

From boardroom strategy to bench-side execution, this report is read cover-to-cover by leaders shaping the next decade of their industry, turning demand scenarios, market dynamics and valuation benchmarks into decisions.
CXOs/ Presidents/ VPs/ Managers
M&A and Corporate Development
Strategy Teams and R&D Heads
Procurement and Product Directors
Regulatory and Compliance Leaders
Investor Relations and Equity Analysts