Market Minds Advisory
Marine Insurance Market

Marine Insurance Market: Mutual Pools, War Risk And Very Large Ships

Red Sea war risk premiums moved from roughly 0.05% of hull value to about 0.9% inside a single quarter. Underwriters who had treated that cover as free money discovered otherwise.

Lead Analyst

Published

September 2026

Make Smarter Decisions with Customized Research Insights

Request a free sample report and evaluate market opportunities, growth trends, and competitive dynamics relevant to your business needs.

2025 MARKET VALUE$41.5BMarket Size 2025
2036 FORECAST VALUE$78.8BBase Case , 2026 to 2036
CAGR 2026 TO 20366.0 %Bull 7.2% / Bear 4.8%
INCREMENTAL OPPORTUNITY$34.8BNet 10- year value creation
EXPANSION MULTIPLE1.79x2036 value over 2026 base
Strategic Levers
M&A Pipeline
Regional Outlook
Country Rankings
Competitive Intelligence
Segmental Deep-dive
Call-Us : 91 93563 13602

Executive Snapshot and Market Trajectory

Nothing else in insurance is structured quite like this. The largest liability claims run through mutual clubs owned by shipowners, pooled above 10 million dollars and reinsured collectively to roughly 3.1 billion, which is the biggest single placement in the market.
Western Europe writes 38% of premium, above the usual regional band, because the London and Nordic markets remain where hull and liability business is placed regardless of where the ships trade. War risk and political violence cover grows at 9.0%, half again the market rate of 6.0%, after Red Sea and Black Sea repricing that nobody underwriting a year earlier had modelled at all. That repricing surprised everybody who had been quietly underwriting it.
Concentration reaches only 29%, since mutuals, Lloyd's syndicates and commercial carriers all write parts of the same risk on different capital structures. Cargo remains the largest class at 57% of premium, and accumulation on vessels carrying 1.8 billion dollars of goods is the exposure everybody watches most nervously. Nobody can aggregate what they hold on one hull, because the policies are written by voyage and the ships keep on growing.
Market Definition
The market covers gross written premium across marine insurance classes, spanning cargo insurance, hull and machinery insurance, marine liability including protection and indemnity calls, offshore energy insurance, war risk and political violence cover, and specie yacht and specialist marine lines. Inland transit cover unconnected to sea carriage, aviation and general transport liability, port and terminal property insurance, shipbuilders risk before launch, and trade credit insurance on cargo transactions are excluded.
Base Year Value
$41.5B in 2025 (MMA Primary Research Dataset, August 2026)
Forecast Period
2026 to 2036, eleven discrete annual values
CAGR
6.0% base case. Bull 7.2%. Bear 4.8%.
Fastest Growth Segment
War Risk and Political Violence Cover: 9.0% CAGR
Fastest Growth Country
India: 8.0% CAGR
Fastest Growth Region
South Asia and Pacific: 8.2% CAGR
Largest Region
Western Europe: 38% of 2025 global value
Market Leaders
Allianz Commercial, AXA XL, Gard, Chubb, Zurich Insurance Group. Source: MMA Analysis based on disclosed marine and specialty gross written premium, company annual reports 2025.
Primary Survey
n=3,800 procurement and R&D decision-makers, Q4 2025, six countries
Methodology
Demand-side build-up, cross-validated against public data, 47 expert interviews

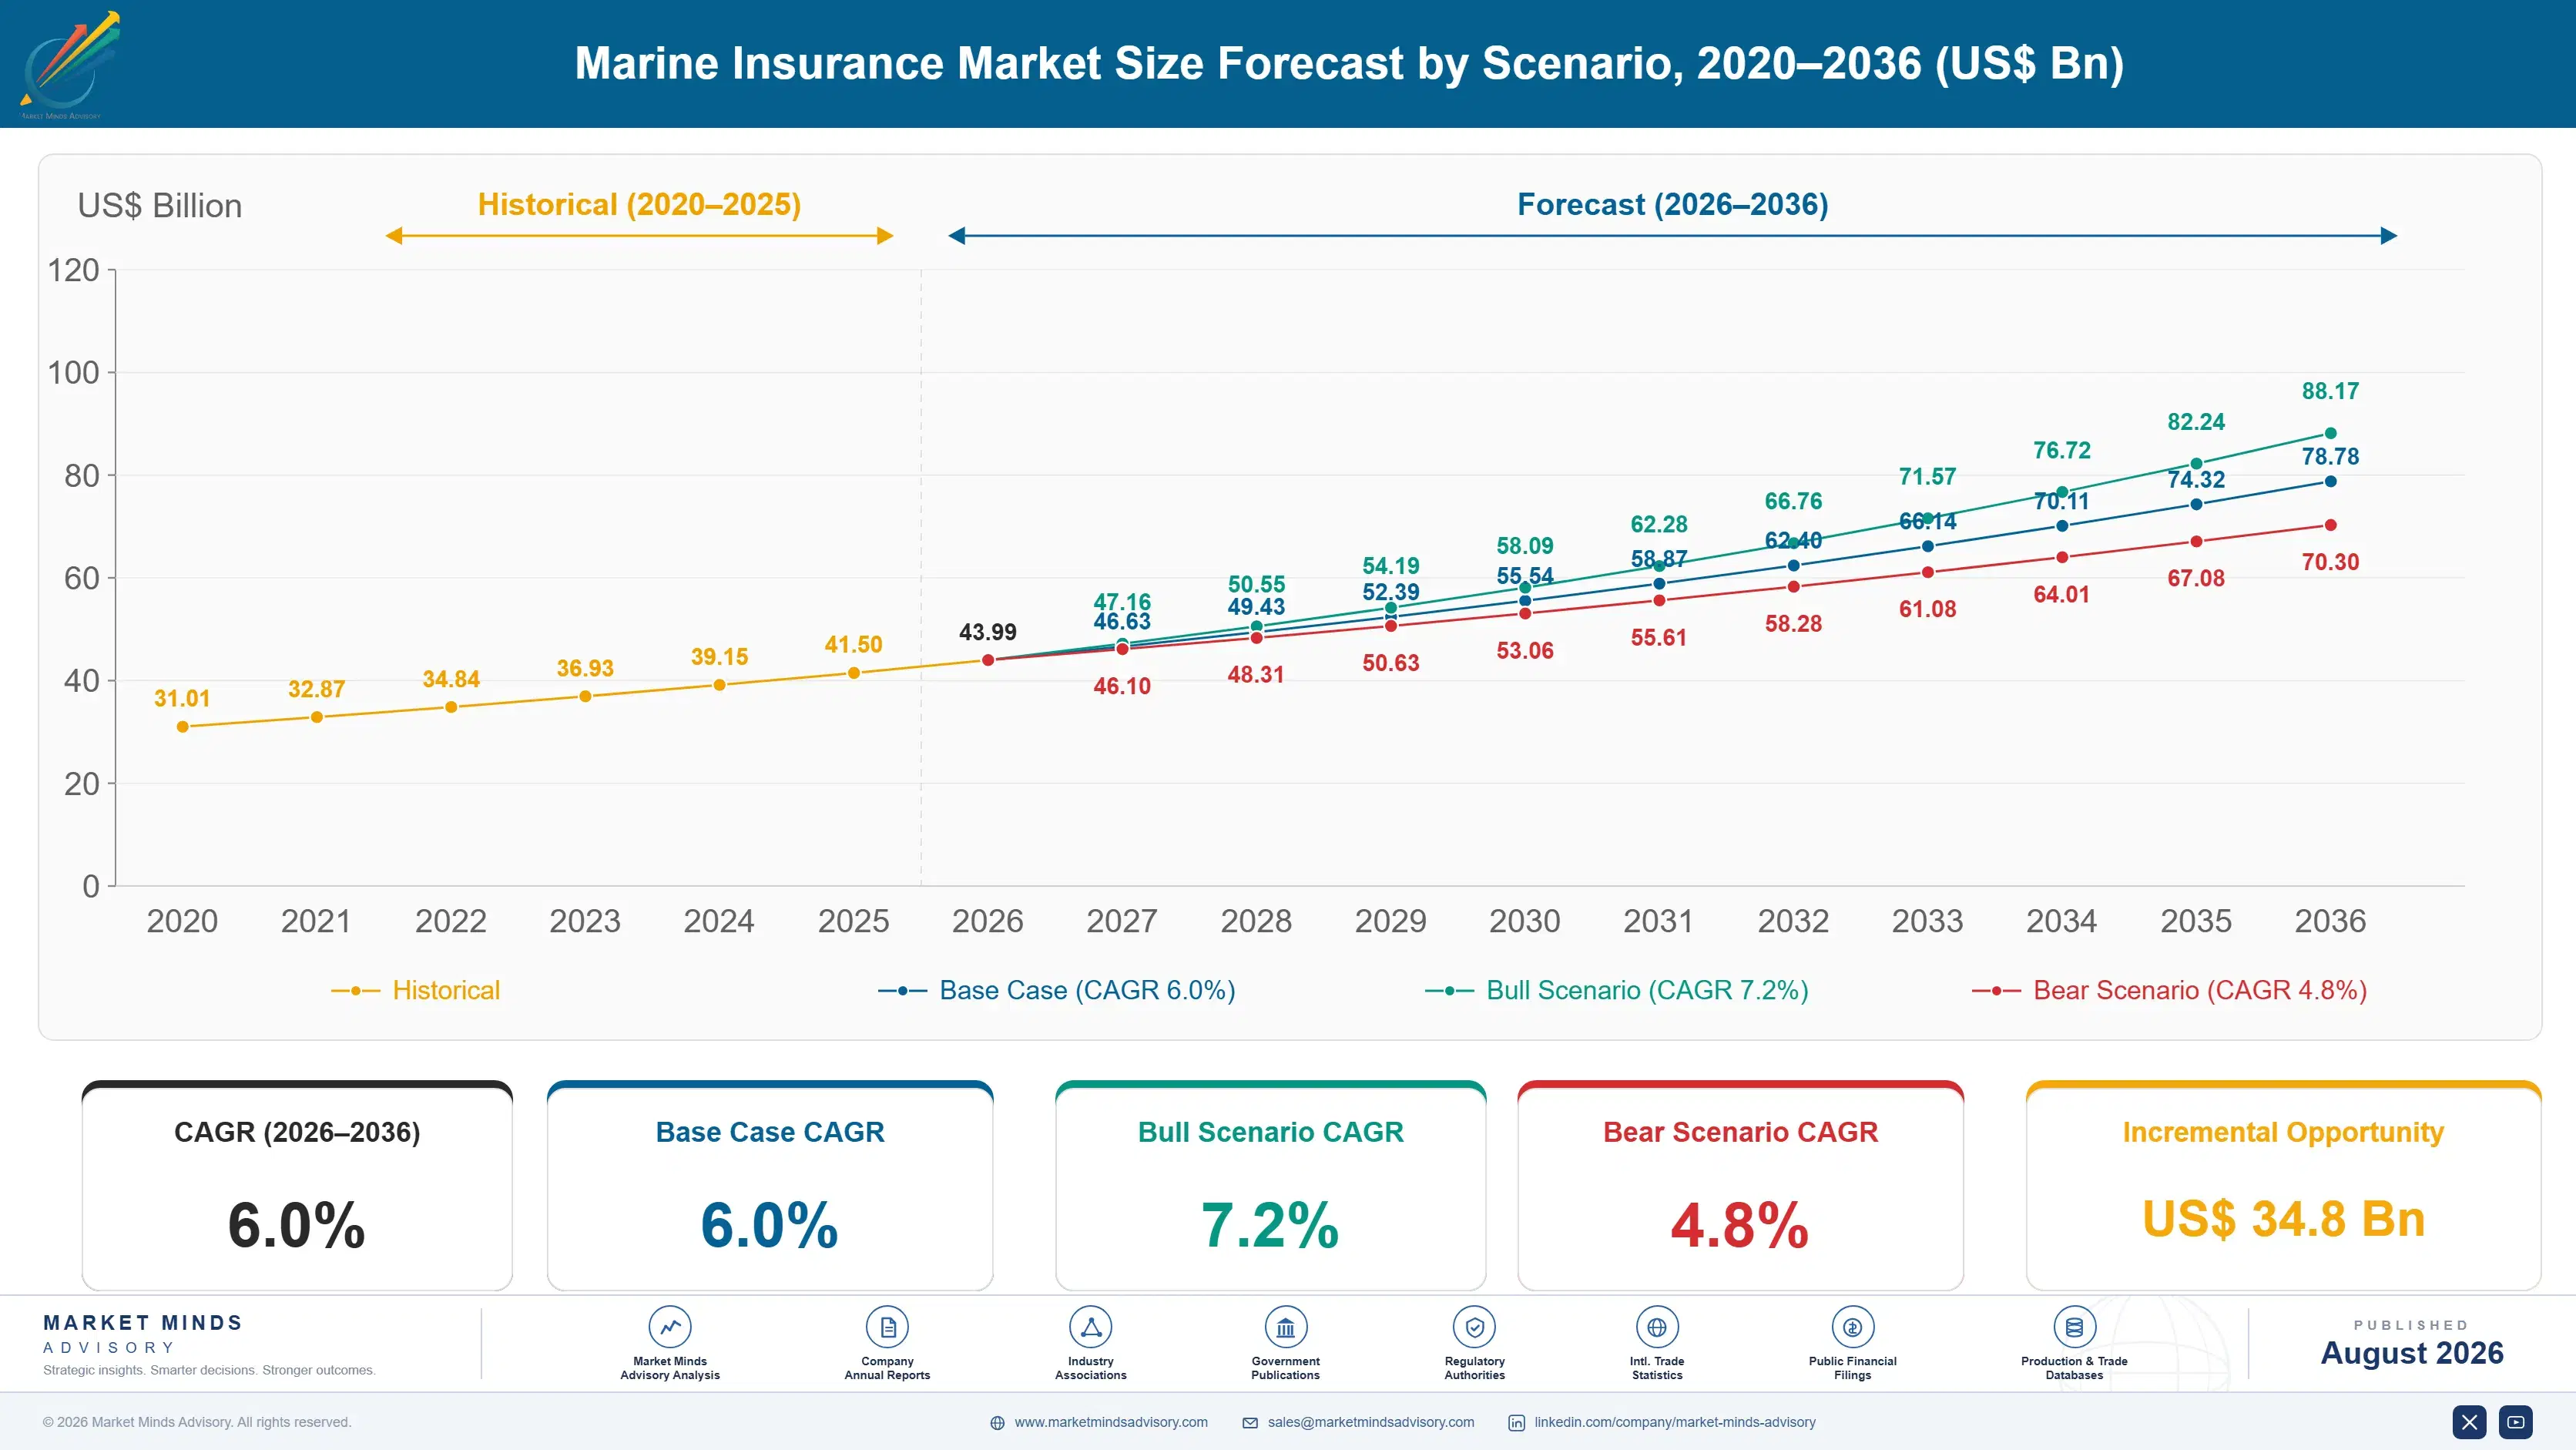
Marine Insurance Market Forecast Scenarios

marine-insurance-market-size-forecast-scenario-1787913429917
Growth from 2020 to 2025 ran at 4.8% and two events dominated it. Trade volumes and commodity values pushed cargo premium up through 2021 and 2022 without any change in rating discipline. Then war risk repriced violently across the Black Sea and Red Sea, and the Baltimore bridge collapse in March 2024 produced what will very likely stand as the largest marine loss ever recorded once it finally settles.
The 6.0% base case rests on three mechanisms. War risk and political violence cover stays expensive because the exposures that created the repricing have not gone away. Offshore energy premium rises on renewed capital expenditure and on floating production units carrying enormous single-site values. And cargo premium tracks trade volume with accumulation loadings that underwriters have finally started applying properly. None of the three depends on any new capacity entering.
The bull case at 7.2% assumes further conflict-driven war risk repricing alongside a hardening liability market after the Baltimore settlement works through mutual pooling and collective reinsurance. The bear case at 4.8% is trade volume softening while capacity returns to war risk lines, since underwriters have short memories and today's premium looks remarkable to anybody absent in 2024.

Where The Big Claims Actually Go

The liability side of this market is a mutual, and outsiders consistently misread it. Protection and indemnity cover comes from clubs owned by the shipowners they insure, which charge calls rather than premium and can levy more if claims exceed expectation. Twelve clubs pool claims above 10 million dollars between them and buy collective reinsurance to around 3.1 billion. That single placement is the largest marine reinsurance purchase anywhere.
FIVE-FIRM CONCENTRATION29%Share of global premium written by the largest marine carriers
CARGO PREMIUM SHARE57%Portion of global marine premium written on carried goods
POOL CLAIM RETENTION10Level in millions where mutual clubs begin sharing claims
GROUP REINSURANCE LIMIT3.1Billions of collective cover sitting above the mutual pool
RED SEA WAR PREMIUM0.9%Hull value charged for a single high risk transit
VESSEL CARGO VALUE1.8Billions of goods carried aboard one large container ship
War risk repriced faster than anything in living memory. Transits through the Red Sea moved from roughly 0.05% of hull value to about 0.9% inside a quarter from late 2023, and a good number of underwriters simply stopped quoting rather than price a risk they could not model. That cover had been sold for decades as a near-costless addition. It is not being sold that way now.
Cargo carries 57% of global premium and the accumulation problem keeps getting worse. A 24,000 container vessel can hold around 1.8 billion dollars of goods insured across hundreds of separate policies with dozens of carriers, none of whom know what the others have written on the same hull. Port accumulation is the same problem sitting still. Underwriters have finally begun charging for it.
"Ask a cargo underwriter what their maximum exposure on a single vessel is and watch the pause. Nobody actually knows, because the policies are written by voyage and the ships keep getting bigger, and the answer only arrives after something has already gone wrong."
Director, Specialty Insurance Practice · MMA Specialty Insurance and Risk Transfer Practice · August 2026

Market Trends

War Risk Cover Stopped Being A Free Addition

Red Sea transits moved from around 0.05% of hull value to roughly 0.9% within a quarter, a repricing of a magnitude nobody in the class had modelled, and several underwriters withdrew rather than quote at any number. Black Sea cover moved similarly earlier. That segment grows at 9.0%. The exposures driving it have not resolved, and capacity is returning slowly enough that pricing discipline has so far survived contact with competition. Nobody in the class had priced a transit at that level in living memory before any of this happened.
Market Impact: Grows offshore energy at 7.2%
Accumulation Loadings Finally Reach Cargo Rating

A large container vessel can carry around 1.8 billion dollars of insured goods spread across hundreds of policies and dozens of carriers, none of whom can see the whole exposure they collectively hold on one hull. Cargo underwriters have started applying accumulation loadings rather than rating each shipment in isolation. It remains crude, since the data to do it properly does not exist in any shared form anybody can access. Everybody in the class knows the problem and almost nobody holds the data required to go and solve it properly themselves.
Market Impact: Grows Indian premium at 8.0%

Market Opportunities and Growth Drivers

Offshore Energy Values Concentrate On Very Few Assets

Offshore energy premium grows at 7.2% as capital expenditure returns and as floating production units carrying multi-billion dollar values enter service in deeper water than previous generations operated in. A single unit represents an exposure comparable to a small city. Construction and installation phases carry the sharpest risk, and the specialist capacity willing to write those phases is genuinely limited, which supports pricing in a way the operational phase never does. Nothing about that exposure spreads across a portfolio in quite the way that ordinary marine risk does at all.
Market Impact: Reaches 3.1 billion in cover

Asian Fleet And Cargo Growth Shifts Premium Eastward

Chinese, Japanese, Korean and Singaporean markets now write a substantial share of global marine premium, following fleet ownership, shipbuilding and trade volumes that have moved decisively in that direction over two decades. India grows fastest at 8.0%. Local capacity has developed to the point where risks that would once have been placed in London are retained regionally, and only the largest or most complex placements still travel. Traditional markets notice the change only when submissions that used to arrive at every renewal season simply stop arriving there at all any more.
Market Impact: Involves over 600 vessels

Market Restraints and Challenges

The Baltimore Loss Reaches Everybody Through Pooling

The March 2024 bridge collapse will very likely stand as the largest marine loss on record, and because liability sits with a mutual club it passes through the pooling agreement above 10 million dollars and into collective reinsurance toward 3.1 billion. Root cause is a structure designed precisely for this. Commercial impact reaches every club and every reinsurer on the placement. Mitigation is repricing, which is already visible in renewal calls. Every club and every reinsurer on that placement now pays out for one bridge in one single American port.
Market Impact: Repriced from 0.05% to 0.9%

Unrecognised Tonnage Carries No Funded Liability Response

A substantial fleet of ageing tankers now trades sanctioned cargoes under opaque ownership with insurance from entities no coastal state recognises, which means a serious spill would have no funded liability response behind it at all. Root cause is sanctions avoidance rather than any insurance failure. Commercial impact is reputational and political pressure on the legitimate market. Mitigation involves port state inspection and certificate verification, neither of which reaches vessels avoiding regulated waters. Legitimate carriers carry the political consequences of exposure they never wrote and cannot influence at all either.
Market Impact: Covers 1.8 billion per vessel
3 additional market trends, 2 additional growth drivers, and 4 additional restraints and challenges are covered in the full report. Contact sales@marketmindsadvisory.com to access the complete intelligence.

Segment CAGR and Growth Architecture

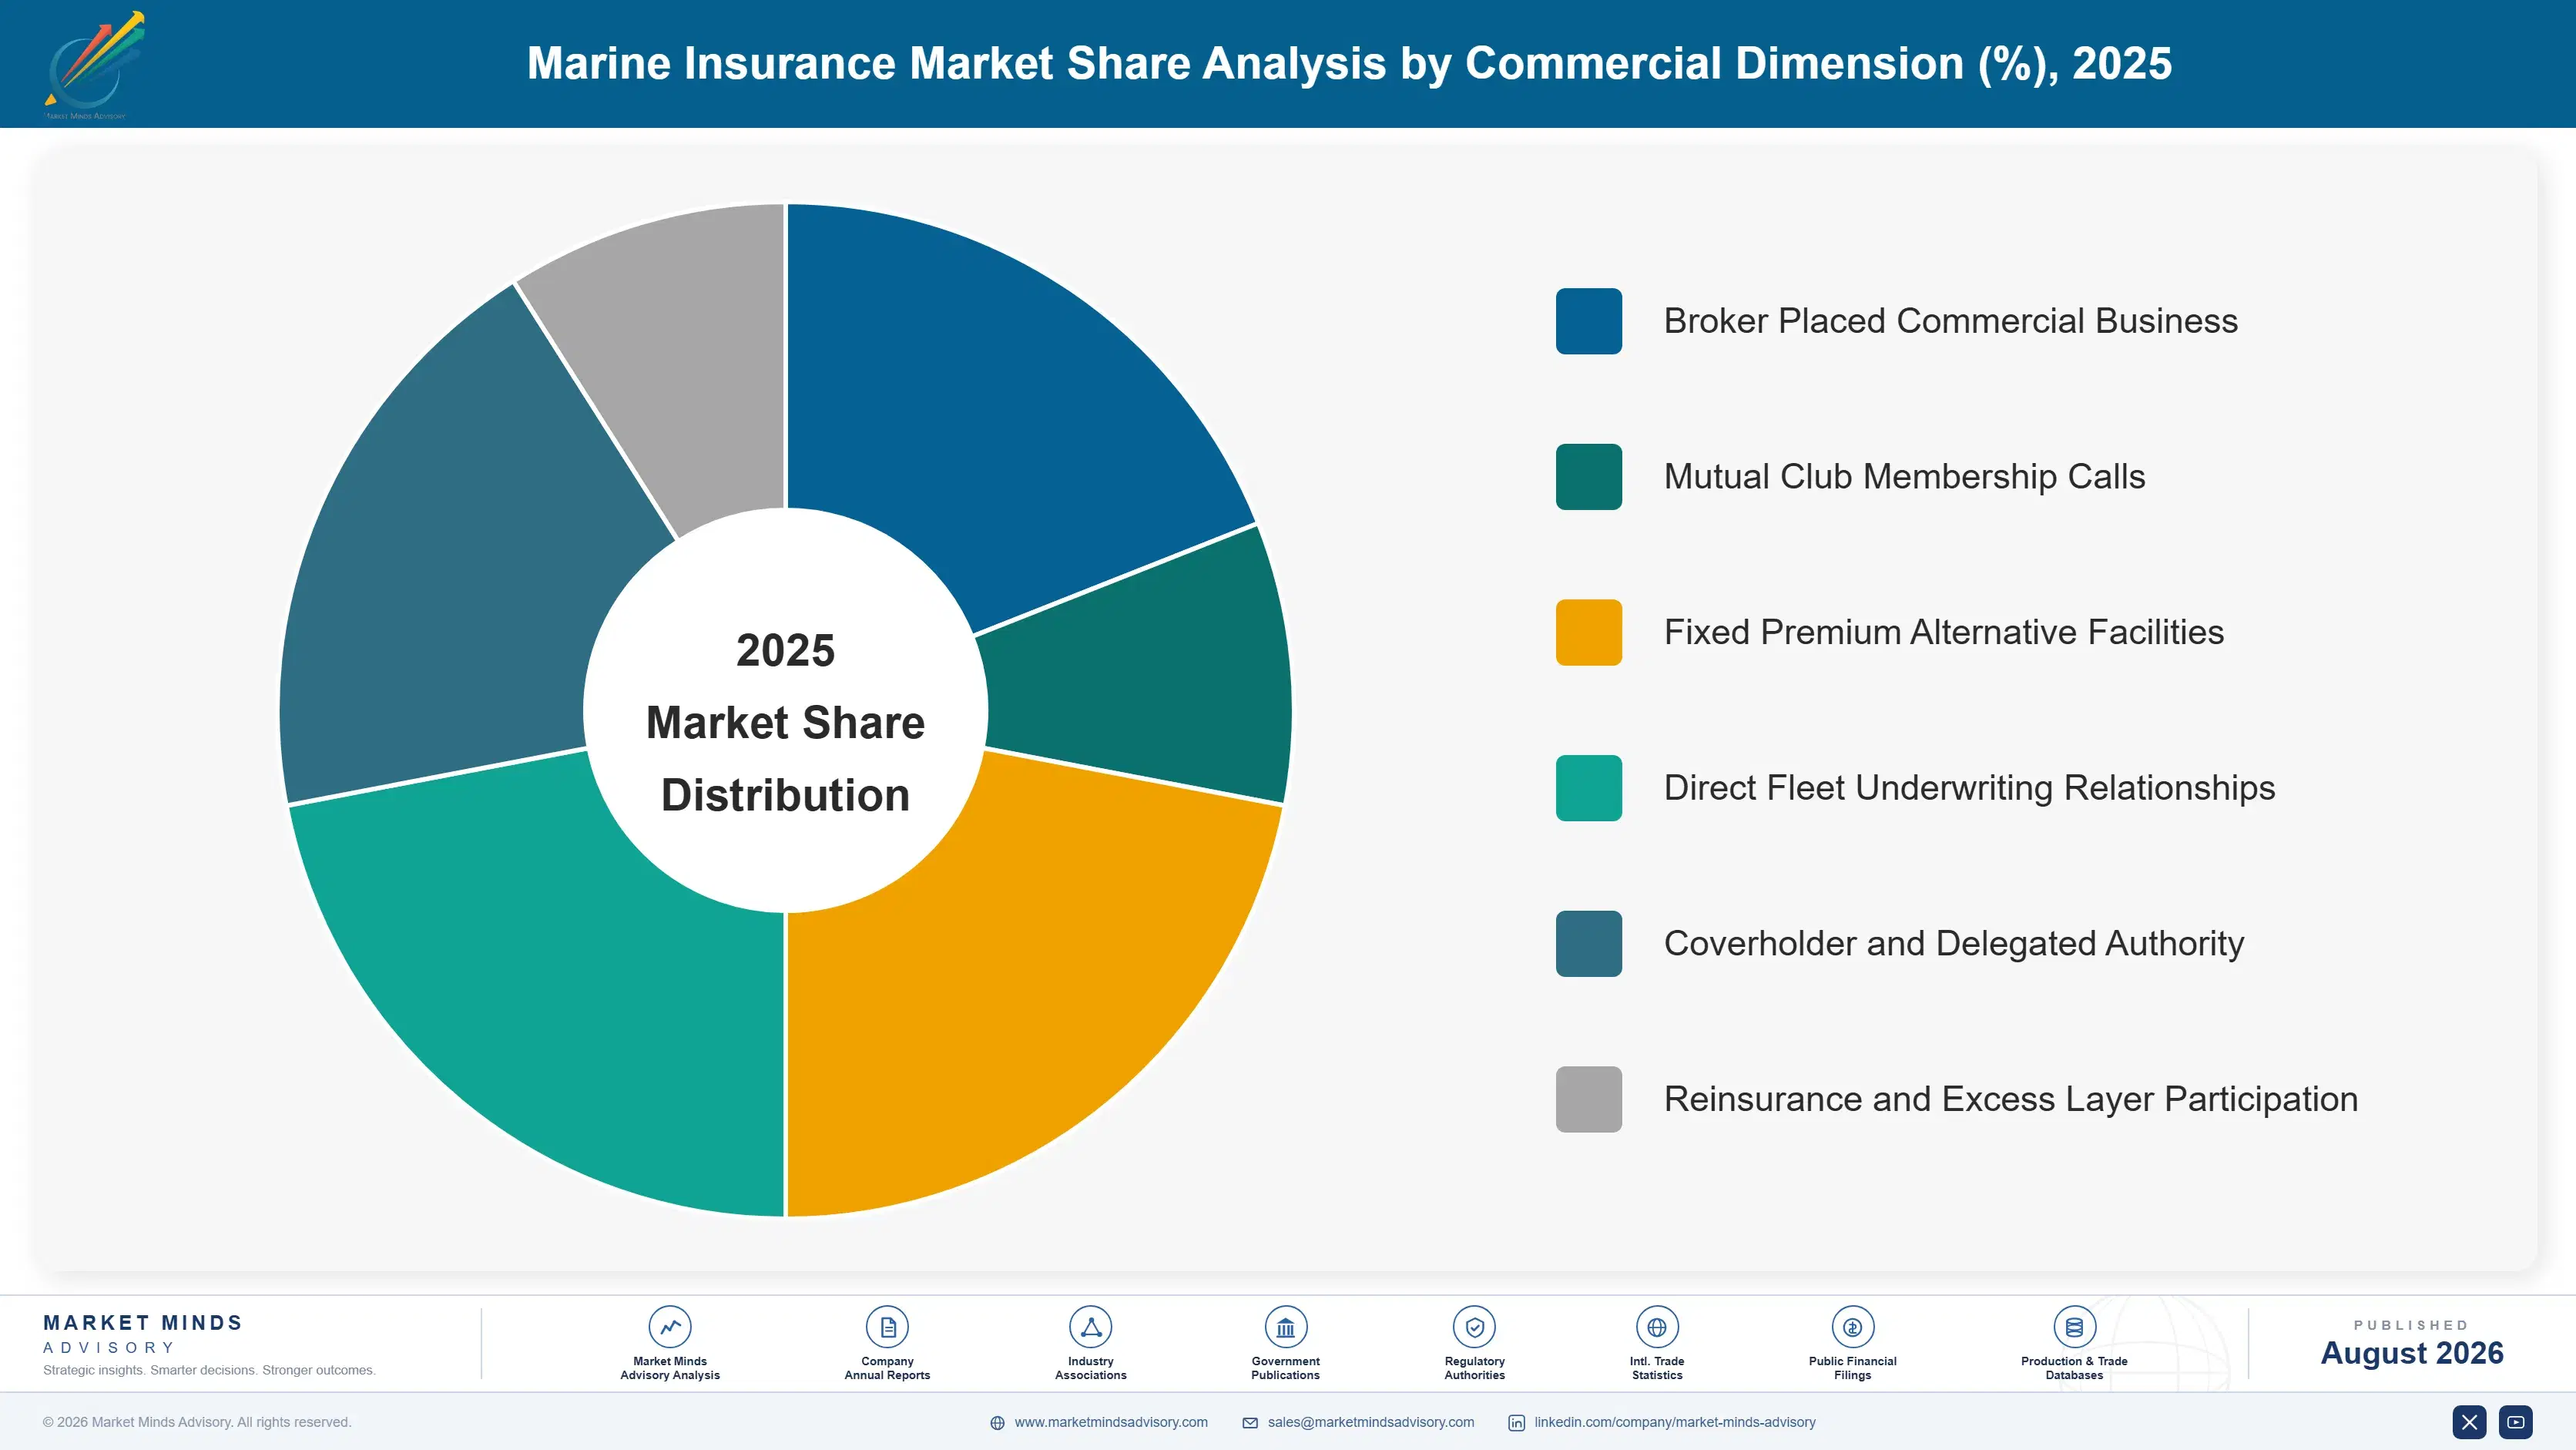
Segmentation follows class of marine business, since capital structure, claims profile and underwriting discipline all differ by class rather than by vessel type or trade route. Six categories cover the market without overlap. Fleet type, trade route and placement channel are treated as separate commercial dimensions throughout this report rather than as segmentation logic here.
marine-insurance-market-market-share-analysis-1787913430451

War Risk and Political Violence Cover

War risk cover grows at 9.0%, half again the market rate of 6.0%, after Red Sea transit rates moved from roughly 0.05% of hull value to about 0.9% inside a single quarter and Black Sea cover repriced comparably before that. Several underwriters withdrew entirely rather than quote a risk they could not model. Capacity is returning slowly, and the discipline currently visible in pricing has survived longer than most people in the class expected it to when the repricing began. Nobody in the class had ever priced a transit anywhere near that level before, which is why several carriers preferred to decline the business entirely rather than guess at a number.
CAGR 9.0%

Offshore Energy Insurance

Offshore energy premium grows at 7.2% as capital expenditure returns and floating production units carrying multi-billion dollar values enter service in water depths previous generations never operated in. Construction and installation phases carry the sharpest exposure and attract genuinely limited specialist capacity, which supports pricing in a way operational cover never has. A single unit concentrates value comparable to a small city onto one mooring, and nobody has found a way to spread that meaningfully. Operators buying this cover are sophisticated and few in number, which makes the underwriting relationship personal in a way that broker-placed cargo business has never been, and reputations in this class travel very quickly indeed.
CAGR 7.2%
Full segment breakdown across 6 segments available in the complete report.

Regional Architecture and Country Demand Map

Premium follows where business is placed rather than where vessels are owned or where they trade, and those three geographies have diverged considerably more over the past two decades than most observers realise. Placement geography is the thing that actually determines regional premium share here.

North America

Share sits at 9%, far below the standard regional band, because American marine premium has always been small relative to the economy and hull and liability business is placed in London or the Nordic market rather than domestically. That justification reflects genuine placement geography rather than any view on importance. Cargo and inland marine written domestically is substantial in dollar terms but definitionally narrower than the international classes. The Baltimore loss occurred here and will be paid almost entirely from elsewhere. Domestic hull capacity has shrunk over three decades to the point where a substantial American fleet placement now goes abroad almost automatically, and nobody in the market treats that as remarkable any longer.
Share: 9% | CAGR: 5.2% (2026 to 2036)

Western Europe

Share sits at 38%, above the standard regional band, because London and the Nordic markets remain where the world places hull, liability and specialty marine business regardless of vessel ownership or trading pattern. That justification reflects placement structure rather than any regional demand assumption. Lloyd's syndicates carry the specialty and war risk capacity that matters. Nordic hull practice operates on genuinely different clause wordings and claims philosophy. Most International Group clubs are managed from within the region. War risk capacity concentrates here too, which is why the Red Sea repricing was decided in a handful of London and Nordic underwriting rooms rather than anywhere closer to the vessels actually making the transit.
Share: 38% | CAGR: 4.4% (2026 to 2036)
Regional intelligence for 5 additional markets available in the complete report: East Asia, South Asia and Pacific, Latin America, Middle East and Africa, Eastern Europe. Contact sales@marketmindsadvisory.com.
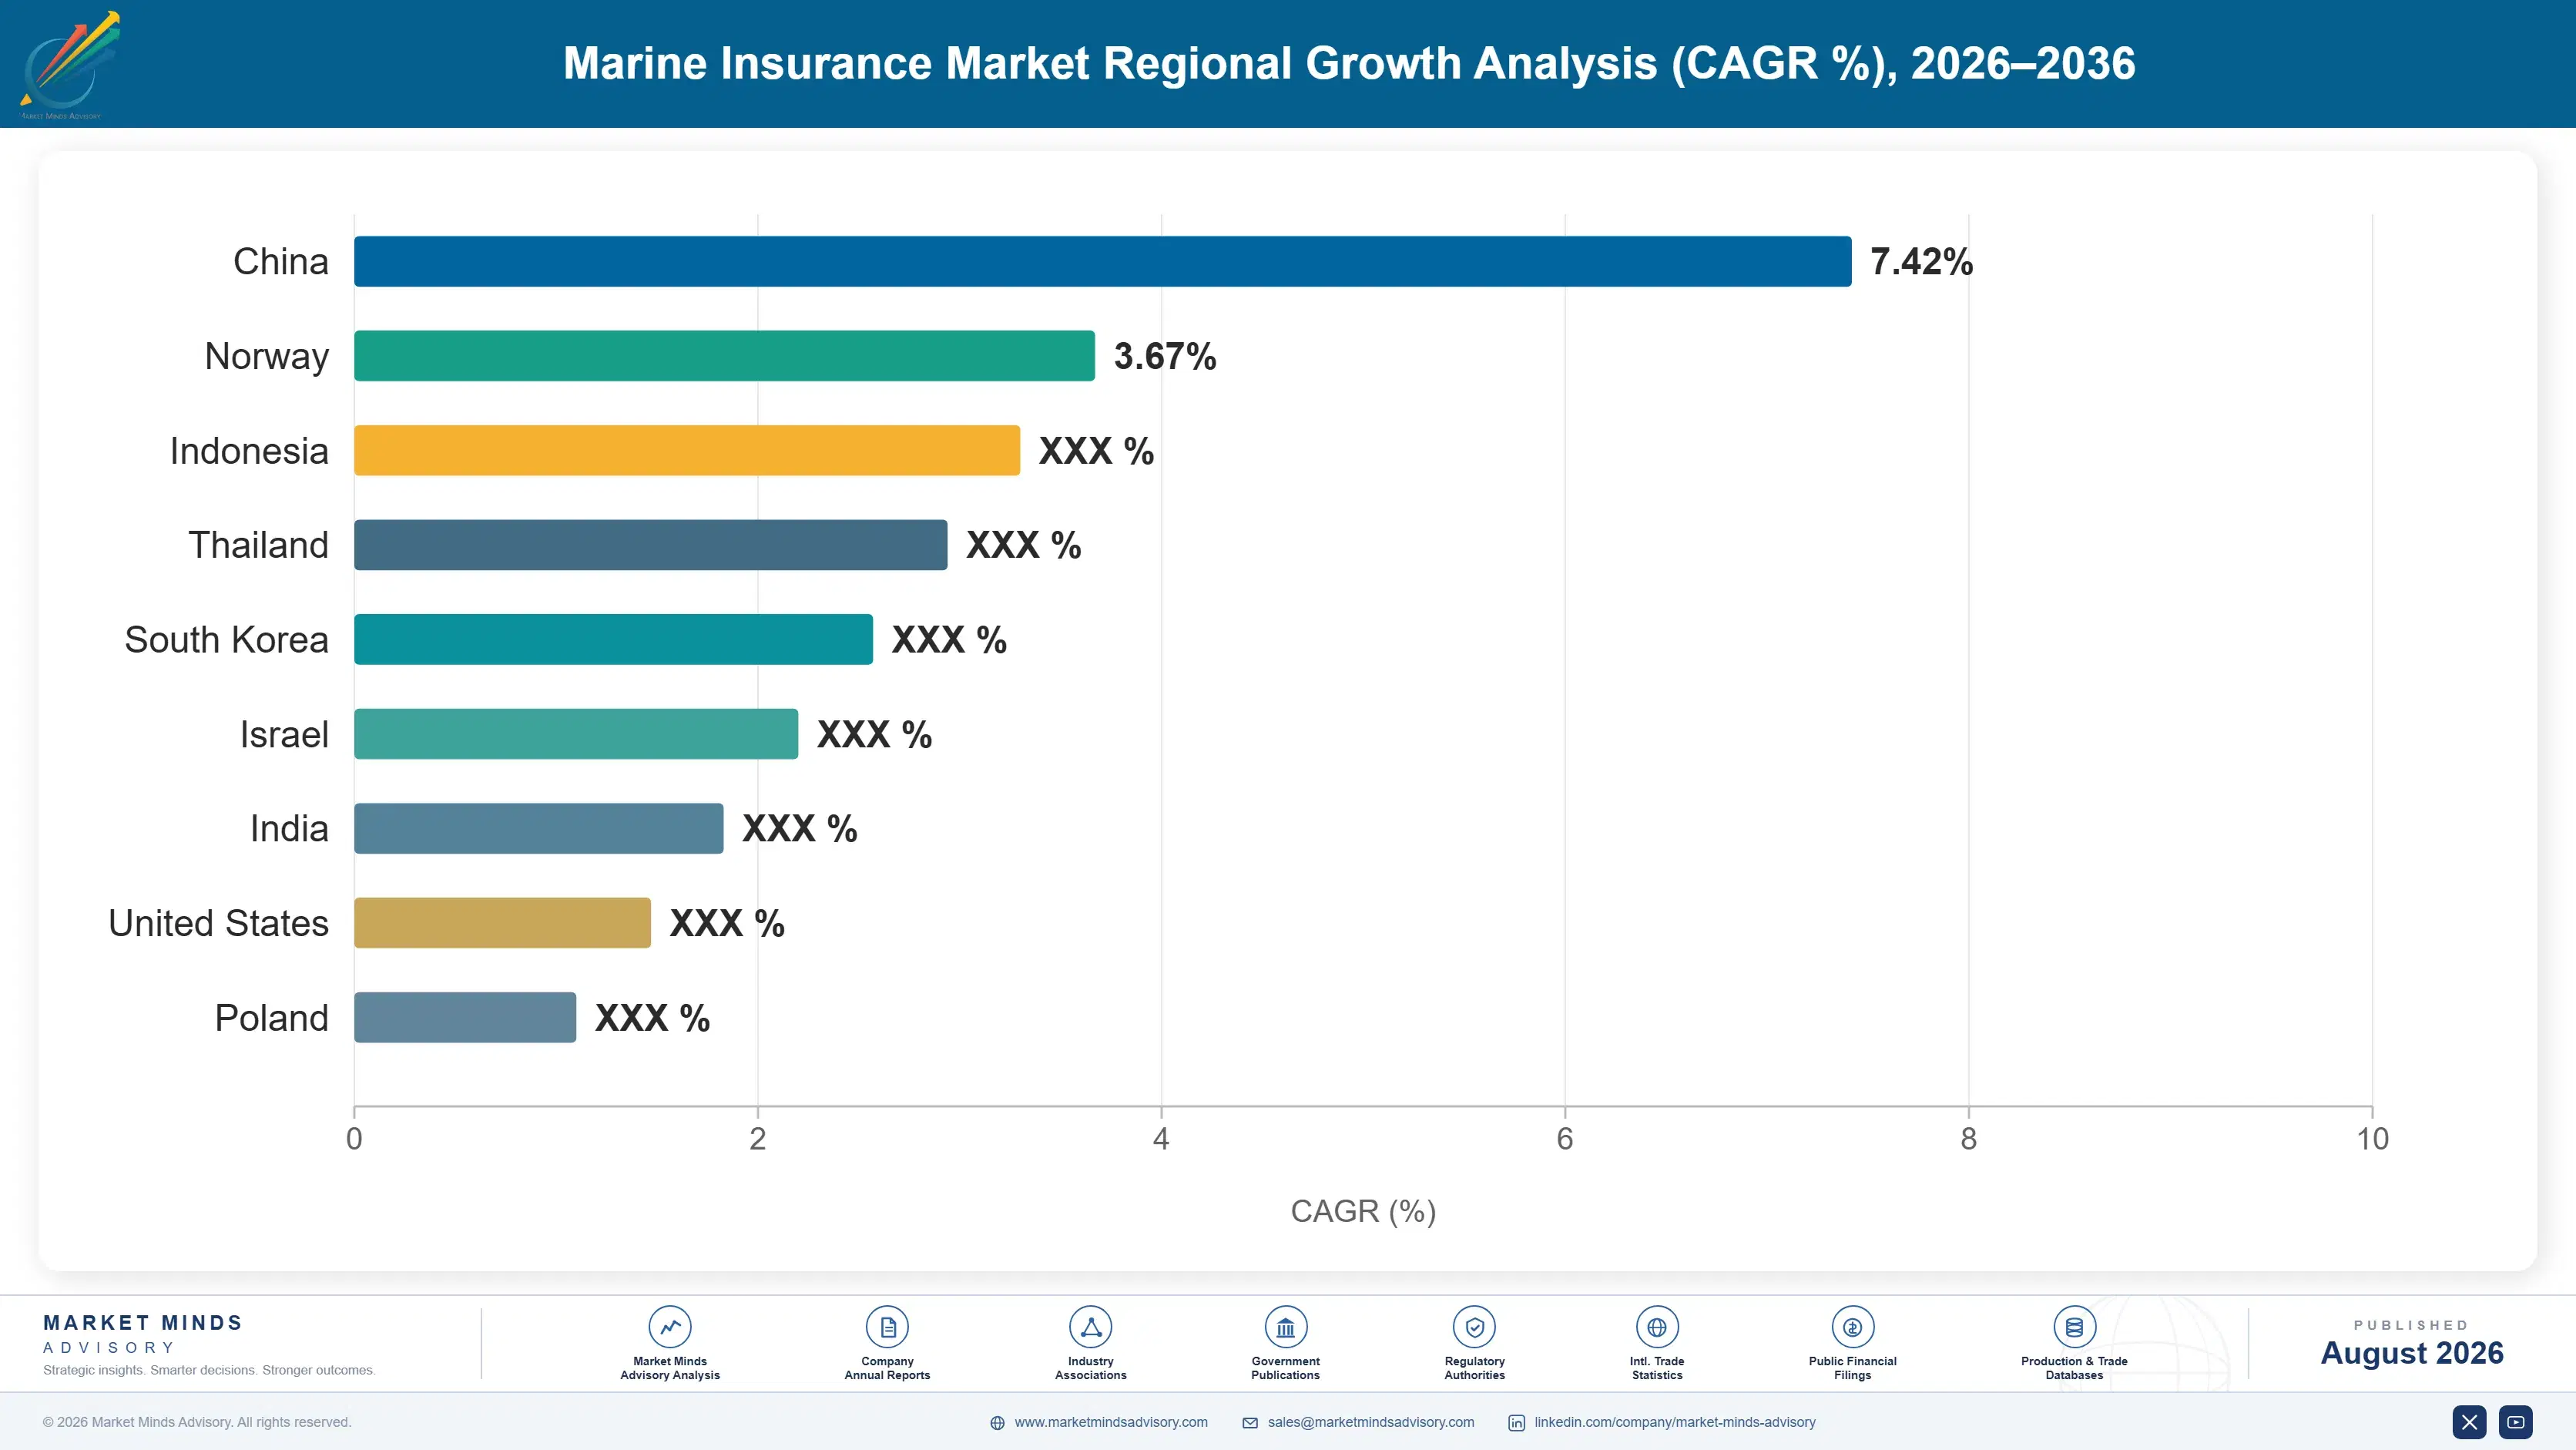
marine-insurance-market-country-cagr-analysis-1787913430971

Price What Nobody Can Model

War risk repriced from 0.05% to 0.9% of hull value, cargo holds 57% of premium, vessels carry 1.8 billion dollars of goods and mutual pooling reaches 3.1 billion. Four levers work on volatile classes, accumulation data, mutual structures and regional retention rather than on rating adequacy generally, which every carrier already claims to have.

Hold Discipline In War Risk Through Returning Capacity

Red Sea transits moved from roughly 0.05% of hull value to about 0.9% and underwriters who withdrew rather than guess have been vindicated. Capacity is now returning, and the class has always given back its gains faster than it earned them. Carriers who hold rating through the softening keep the class profitable across a cycle; those who chase share as competitors return will fund the next loss from premium they never should have accepted. Market share won at inadequate rates is not really an asset in this particular class ever.
Market Impact: Holds rates nearer to 0.9% of hull value

Build Accumulation Data Before The Next Loss

A single vessel carries around 1.8 billion dollars of insured cargo spread across hundreds of policies, and no carrier can see the aggregate exposure it holds on any one hull. Building vessel-level accumulation tracking from booking and bill of lading data is genuinely difficult and nobody has done it well. The carrier who manages it prices accumulation properly while competitors continue rating each shipment as though it travelled entirely alone. The data already exists inside most carriers' own systems and simply nobody has ever gone and aggregated it by vessel now.
Market Impact: Tracks the 1.8 billion across one single hull

Understand Mutual Structures Before Competing With Them

Protection and indemnity is written by mutuals charging calls with the ability to levy more, pooling above 10 million dollars and reinsuring collectively to around 3.1 billion, which is not a structure a commercial carrier can replicate on rated capital. Competing head-on is a losing proposition. Supplying the excess layers, the fixed-premium alternatives for smaller operators, and the reinsurance behind the pool is where commercial capital actually earns here. Members accept underwriting decisions from an entity they collectively own, which is not a relationship any shareholder-owned carrier can offer them.
Market Impact: Supports the 3.1 billion of collectively pooled cover

Follow Retention Eastward Rather Than Await Placements

Asian markets now retain risks that would once have travelled to London automatically, and only the largest or most complex placements still travel outward at all. That segment grows at 7.2%. Carriers waiting in traditional markets for business that no longer arrives are watching a placement pattern that changed a decade ago. Establishing genuine underwriting presence regionally reaches premium that will never be brokered outward again. Broker relationships built over generations count for remarkably little when the risk is being written in a room the broker never enters at all now.
Market Impact: Follows regional premium now growing at 7.2% annually

Who Controls the Margin Pool

Measured on disclosed marine and specialty gross written premium, the five largest carriers hold a CR5 of just 29%, which reflects a market where mutuals, Lloyd's syndicates and commercial carriers write parts of the same risk on entirely different capital structures. Allianz Commercial and AXA XL carry the broadest commercial marine books, Gard holds the largest mutual position, and Chubb and Zurich Insurance Group hold substantial cargo and specialty franchises. Nobody outside that group writes meaningfully across all six classes at once.
Three contests run at once. Cargo competes on capacity and service against thin margins. Hull competes on wording and claims philosophy, where Nordic and London practice differ genuinely. War risk competes on nerve, since nobody can model the exposure properly. Each of those three rewards a different temperament, which is why very few carriers succeed in more than one of them.

Pressure builds from Asian carriers retaining business that once travelled automatically to traditional markets. Rankings shift toward whoever holds regional underwriting presence rather than whoever holds the longest broker relationships. Broker relationships built over generations are worth remarkably little when the submission never leaves the region it originated in.
marine-insurance-market-company-positioning-matrix-1787913431492

Competitive Moat and Risk Dimensions

ALLIANZ COMMERCIAL

Moat: Global Claims Network And Scale

Marine claims arrive in ports nobody plans for, and a carrier able to appoint surveyors and correspondents anywhere within hours holds an advantage brokers value considerably more than a small rating difference. Building comparable coverage requires decades of correspondent relationships rather than capital. Scale also permits writing very large single risks that specialists must share.
ALLIANZ COMMERCIAL

Risk: Cargo Accumulation Exposure Unquantified

Substantial cargo books carry accumulation exposure on individual vessels and at ports that no carrier currently measures properly, and scale makes the potential aggregate larger rather than safer. A single total loss on a very large container vessel would reveal exposure that pricing never contemplated. The data required to quantify it does not exist in shared form.
GARD

Moat: Mutual Structure And Member Alignment

A mutual owned by its members can charge calls, levy supplementary amounts and take a genuinely long view on individual relationships in ways rated commercial capital cannot approach. Members accept underwriting decisions from an entity they collectively own. That alignment produces loss prevention cooperation and claims behaviour a commercial carrier spends heavily trying to imitate and rarely achieves in practice.
GARD

Risk: Pooled Exposure To Others' Losses

The pooling agreement means every club shares claims above 10 million dollars incurred by any member of any other club, so underwriting quality elsewhere in the group affects results directly. The Baltimore loss demonstrates the scale of that exposure. Individual discipline provides only partial protection when the structure socialises the largest losses by design.

Players Tracked

Prominent Players

Allianz Commercial
AXA XL
Gard
Chubb
Zurich Insurance Group

Other Key Players

Munich Re
Swiss Re Corporate Solutions
Tokio Marine
Sompo
MS&AD Insurance Group
Skuld
NorthStandard
Steamship Mutual
UK P&I Club
Britannia P&I
Beazley
Hiscox
Markel
Generali
PICC Property and Casualty

Recent Developments

FEBRUARY 2025

Mutual clubs raise general increase on renewal calls across membership

International Group clubs applied general increases to renewal calls across their memberships, citing pool claims development and collective reinsurance cost. This was a rating decision by mutual boards rather than any market transaction, and members absorbed it because the alternative structures available to them are considerably less attractive.
Signal: Mutual pricing responds to pooled loss development rather than to any competitive pressure in the market.
JUNE 2025

War risk capacity returns to Red Sea transits at reduced rates

Additional underwriting capacity re-entered Red Sea war risk transits, with quoted rates easing from the peak levels reached during the previous eighteen months. This was a capacity development rather than any change in the underlying exposure, which remained substantially as it had been throughout that period.
Signal: Capacity returned well before the risk changed at all, which is how this class has always behaved.
OCTOBER 2025

Asian carrier retains hull placement previously brokered into London

A regional carrier retained a substantial hull placement for a domestic fleet that had historically been brokered into the London market. This was an underwriting capability development rather than any acquisition, and it reflected regional capacity that has grown steadily over more than a decade.
Signal: Placement patterns are shifting quietly, and traditional markets notice only once the business stops arriving entirely.

Reinsurance, Claims, Acquisition

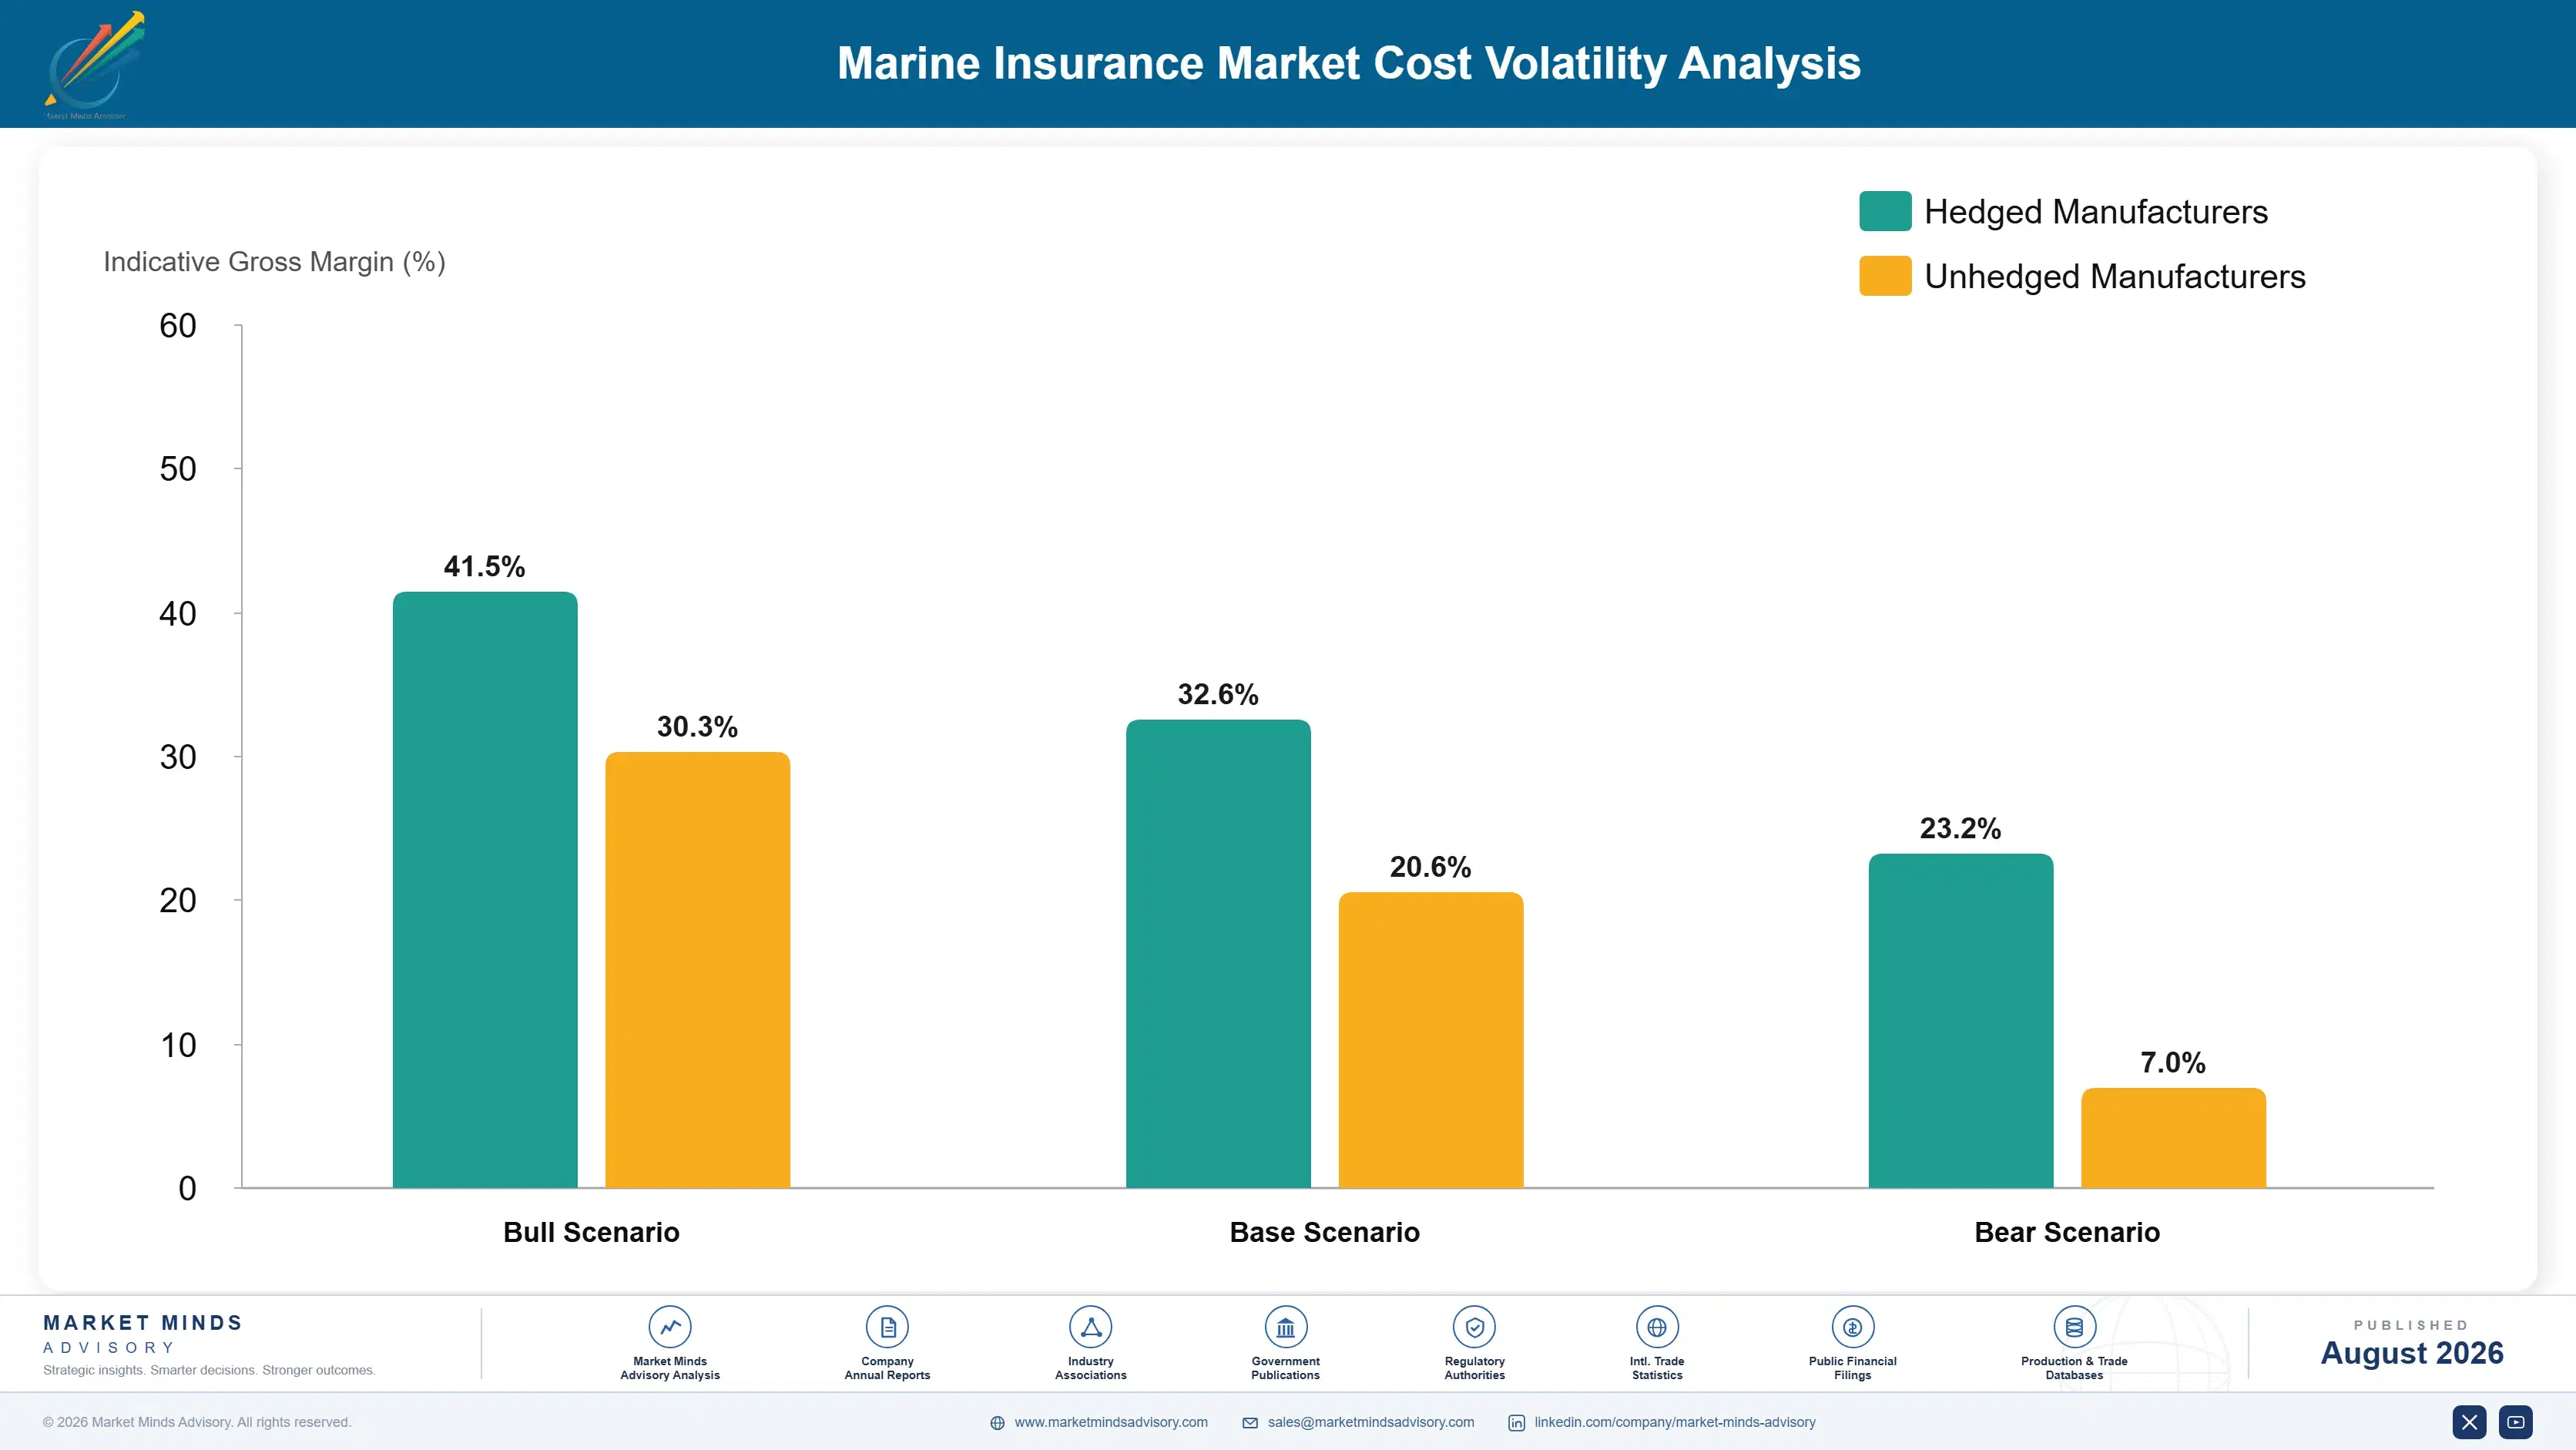
Three costs consume marine premium. Reinsurance purchased on individual books and collectively through the mutual pooling structure, incurred claims across attritional and catastrophe layers, and broker commission and acquisition expense together account for 78 to 91% of gross written premium at a typical carrier. Reinsurance is the swing item, since the collective placement above the mutual pool reaches around 3.1 billion dollars and reprices annually.
Two events moved the cost base together. Red Sea and Black Sea war risk repricing raised both direct rates and the reinsurance cost behind them from late 2023, which IUMI market data records across the affected classes. Then the March 2024 Baltimore bridge collapse produced a loss reaching the pool and the collective reinsurance above it, and Gard Annual Report 2024 disclosures describe how that absorbs a claim of that size.

Exposure divides by capital structure rather than by underwriting quality. Mutuals can levy supplementary calls on members and therefore hold thinner capital against the same exposure. Commercial carriers hold rated capital and answer to shareholders when a single event moves results. Lloyd's syndicates sit between the two, drawing on a central fund. The same loss lands quite differently on each of those balance sheets.
marine-insurance-market-cost-volatility-analysis-1787913431688

Buy reinsurance against accumulation rather than individual risks

Cargo books face accumulation on single vessels carrying around 1.8 billion dollars of goods and at ports where the same problem sits still. Per-risk reinsurance does not respond to that at all. Aggregate and event covers cost more and require exposure data most carriers cannot yet produce properly. They protect against the loss that actually threatens a cargo account.

Hold war risk rating through the softening cycle

Rates moved from around 0.05% of hull value to roughly 0.9% and capacity is already returning while the underlying exposure has not changed. This class has always surrendered its gains faster than it earned them. Holding rating costs market share immediately and visibly. It is the only approach that leaves the class profitable measured across a full cycle.

Verify certificates rather than accepting documentation at face value

A substantial fleet trades under insurance from entities no coastal state recognises, and documentation alone establishes nothing useful about whether a funded liability response actually exists behind a vessel. Verification against recognised providers costs operational effort at every port call. It protects legitimate carriers from association with exposure that they never underwrote at all.

Portfolio Architecture for Margin Defence

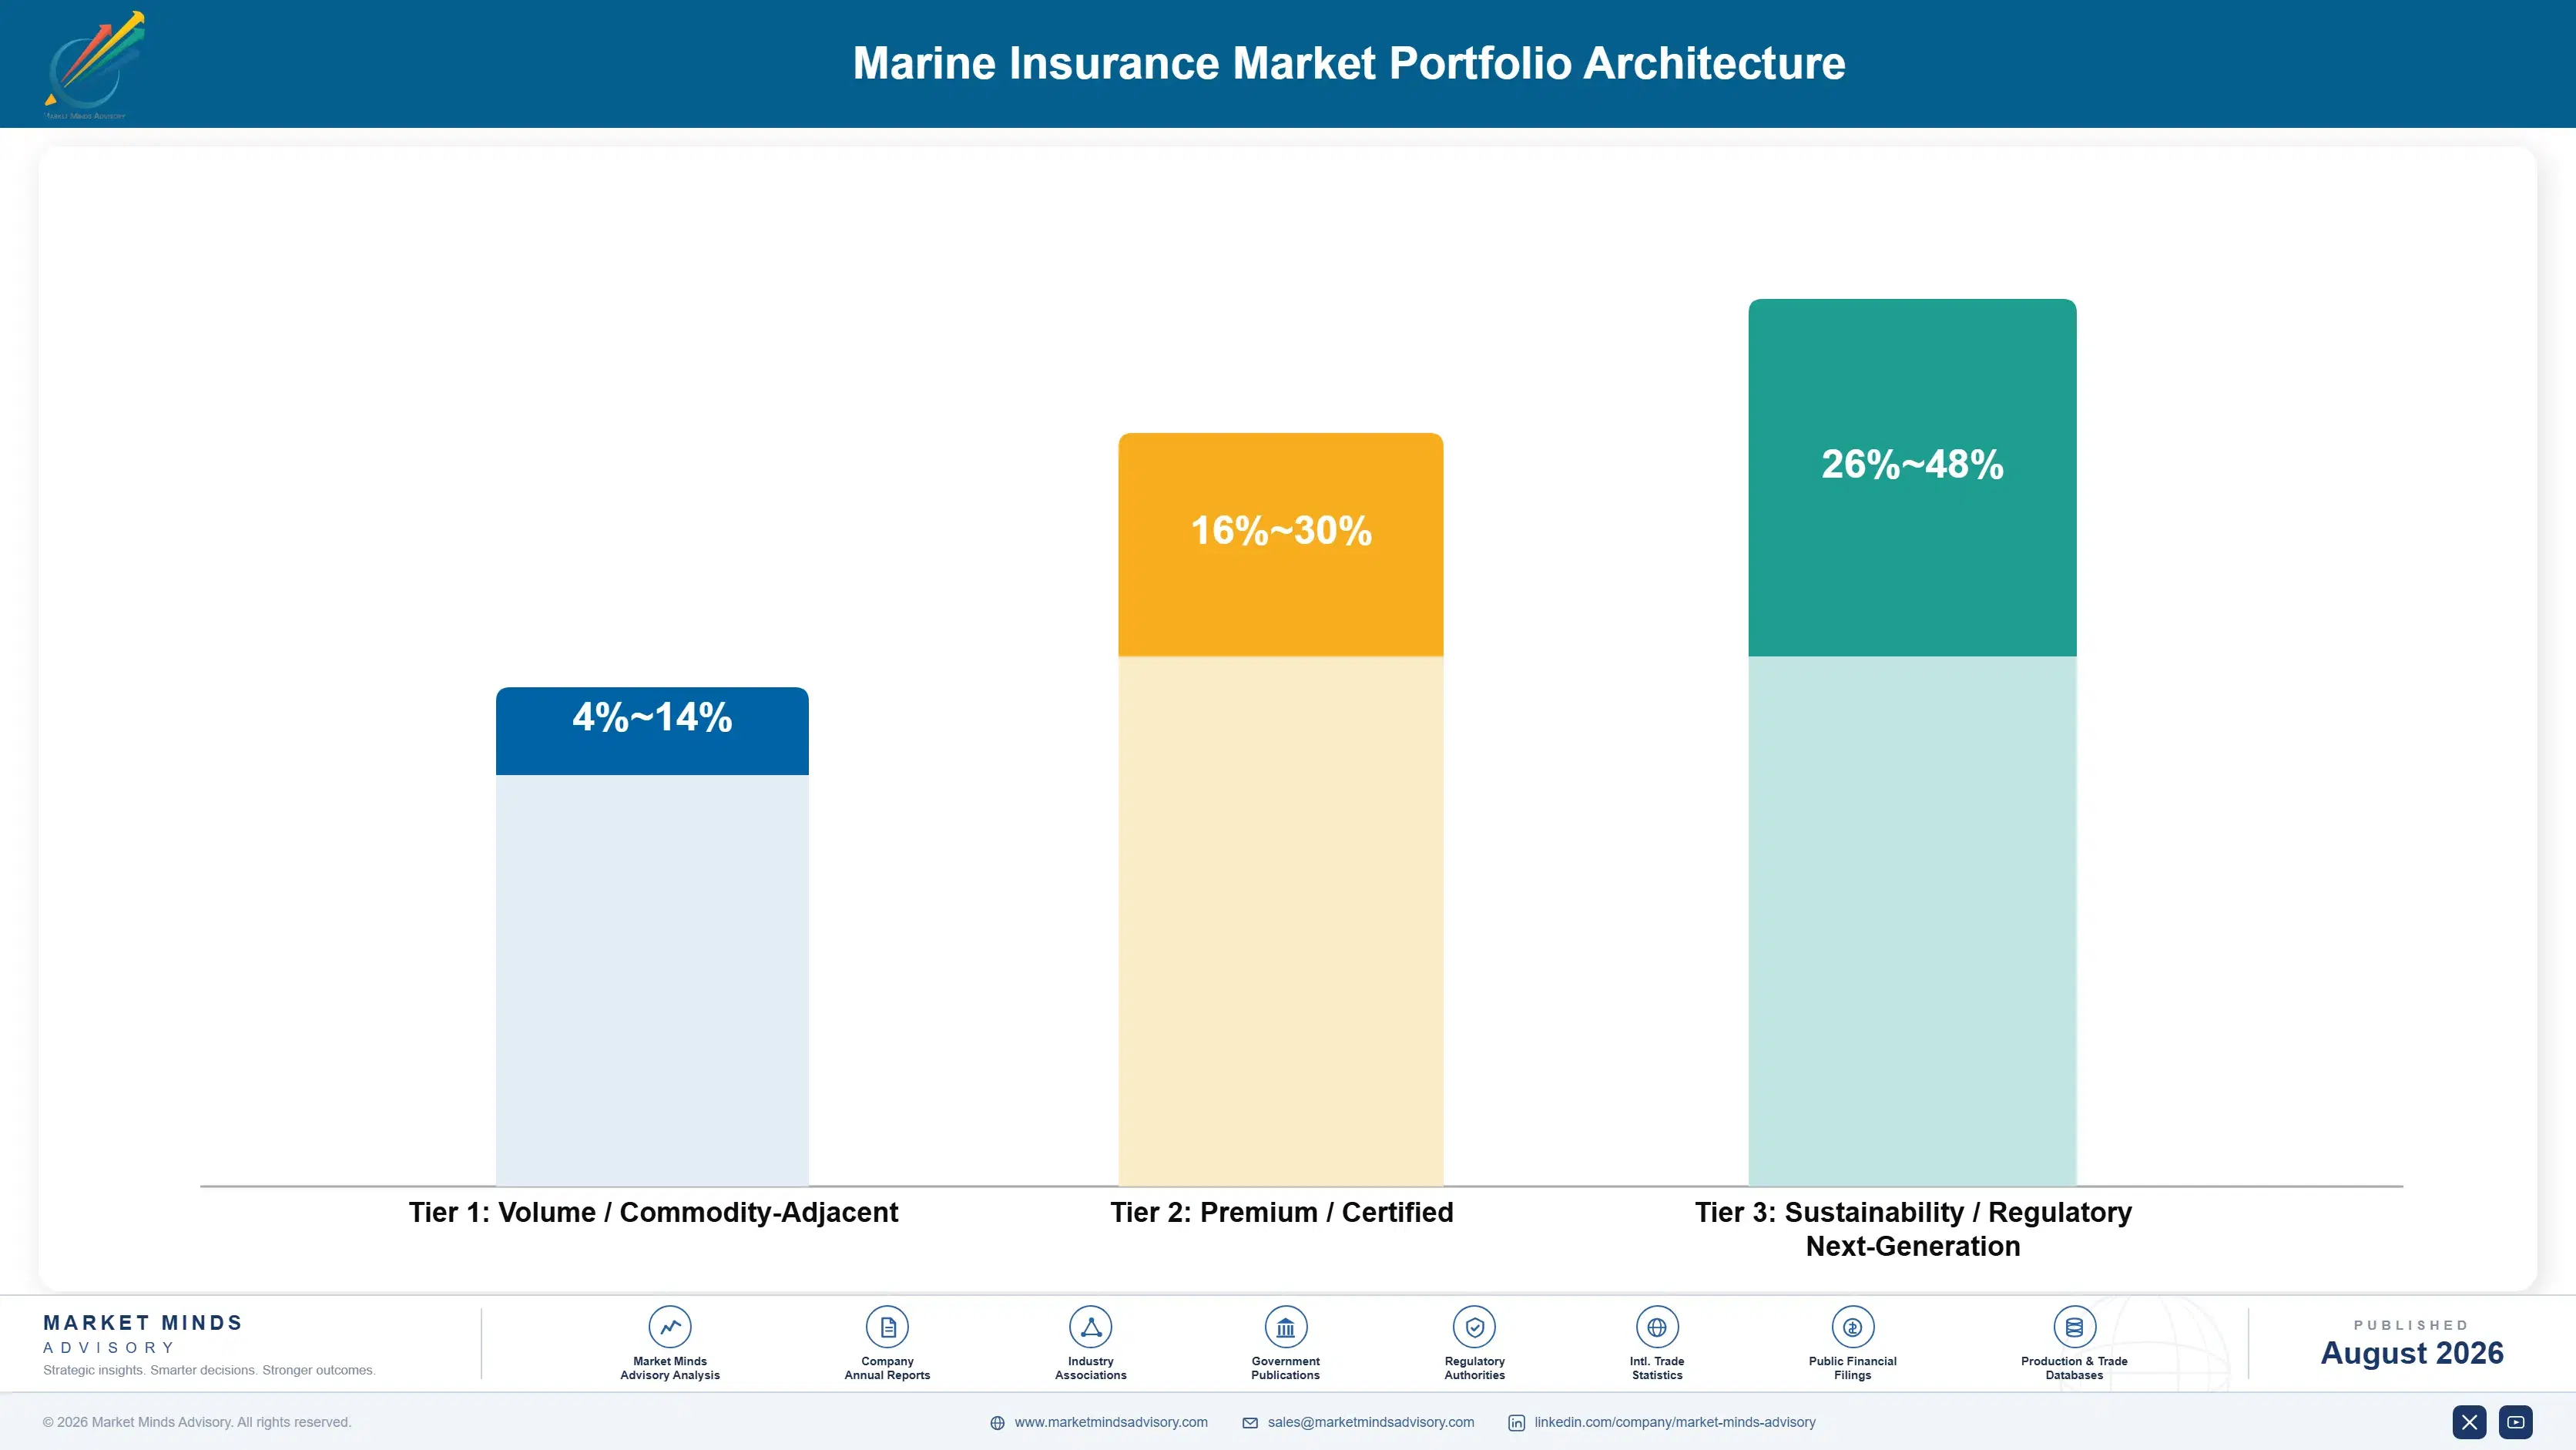
Underwriting margin follows capacity scarcity rather than premium volume, which is why the biggest class earns least. Cargo earns thinly against abundant capacity and thin service differentiation. Hull and machinery earns modestly, with attritional claims consuming most of the rate. Specie and yacht lines earn reasonably on specialist knowledge. Marine liability earns well through mutual structures. Offshore energy earns better on limited construction capacity. War risk earns best, while discipline holds.
The tension is that the classes earning best are precisely the ones nobody can model. War risk pricing rests on judgement rather than data, and offshore construction exposure concentrates enormous value on single assets. Carriers comfortable underwriting uncertainty earn the returns; carriers demanding modelled support before committing capacity end up confined to cargo and hull, where models exist and margins have disappeared.

High-value pools sit in three places. War risk cover while rating discipline survives the return of capacity. Offshore energy construction and installation, where specialist capacity is genuinely scarce. And excess layers above mutual retentions, where commercial capital supports a structure it cannot itself replicate on rated balance sheets. That is where the returns are.

Volume / Commodity-Adjacent

Cargo and hull business written into abundant capacity with limited service differentiation available. The 10-point range separates carriers with genuine claims network reach from those competing largely on rate against the same brokers.
Gross Margin: 4-14%

Premium / Certified

Specie, yacht and marine liability lines requiring specialist knowledge and established claims handling capability. The 14-point spread reflects how differently niche specie business and broader liability accounts perform across a cycle.
Gross Margin: 16-30%

Sustainability / Regulatory / Next-Generation

War risk cover and offshore energy construction phases where capacity is scarce and exposure resists modelling entirely. The 22-point range is wide because war risk margins swing violently with capacity while offshore construction margins move more slowly.
Gross Margin: 26-48%
marine-insurance-market-portfolio-architecture-1787913432182

High-value Sub-segments and Strategic Watch-out

War Risk Underwriting

Highest margin and fastest growth at 9.0%, protected while capacity stays cautious after a repricing from roughly 0.05% to 0.9% of hull value. The risk is that this class has always surrendered its gains faster than it earned them. Memories in this class are notably short.
Gross Margin: 34-48%

Offshore Construction Cover

Strong economics from genuinely scarce specialist capacity willing to write installation phases on units concentrating multi-billion dollar values. The risk is that a single construction loss consumes several years of premium across the whole participating market. That has already happened before, and more than once.
Gross Margin: 28-40%

Cargo Premium Volume

The volume core at 57% of global premium, funding claims networks and broker relationships that everything else depends upon. Carriers hold it for market presence and flow, not because the margin justifies the capital committed. Market presence is really what it actually buys them here.
Gross Margin: 6-16%

Unmeasured Cargo Accumulation

The strategic watch-out. Vessels carry around 1.8 billion dollars of goods across policies no carrier can aggregate. The risk is discovering true exposure only when a very large container vessel is finally lost. Nobody much wants to find that number out in this particular way.
Gross Margin: 2-12%

Renewal Is Never Optional

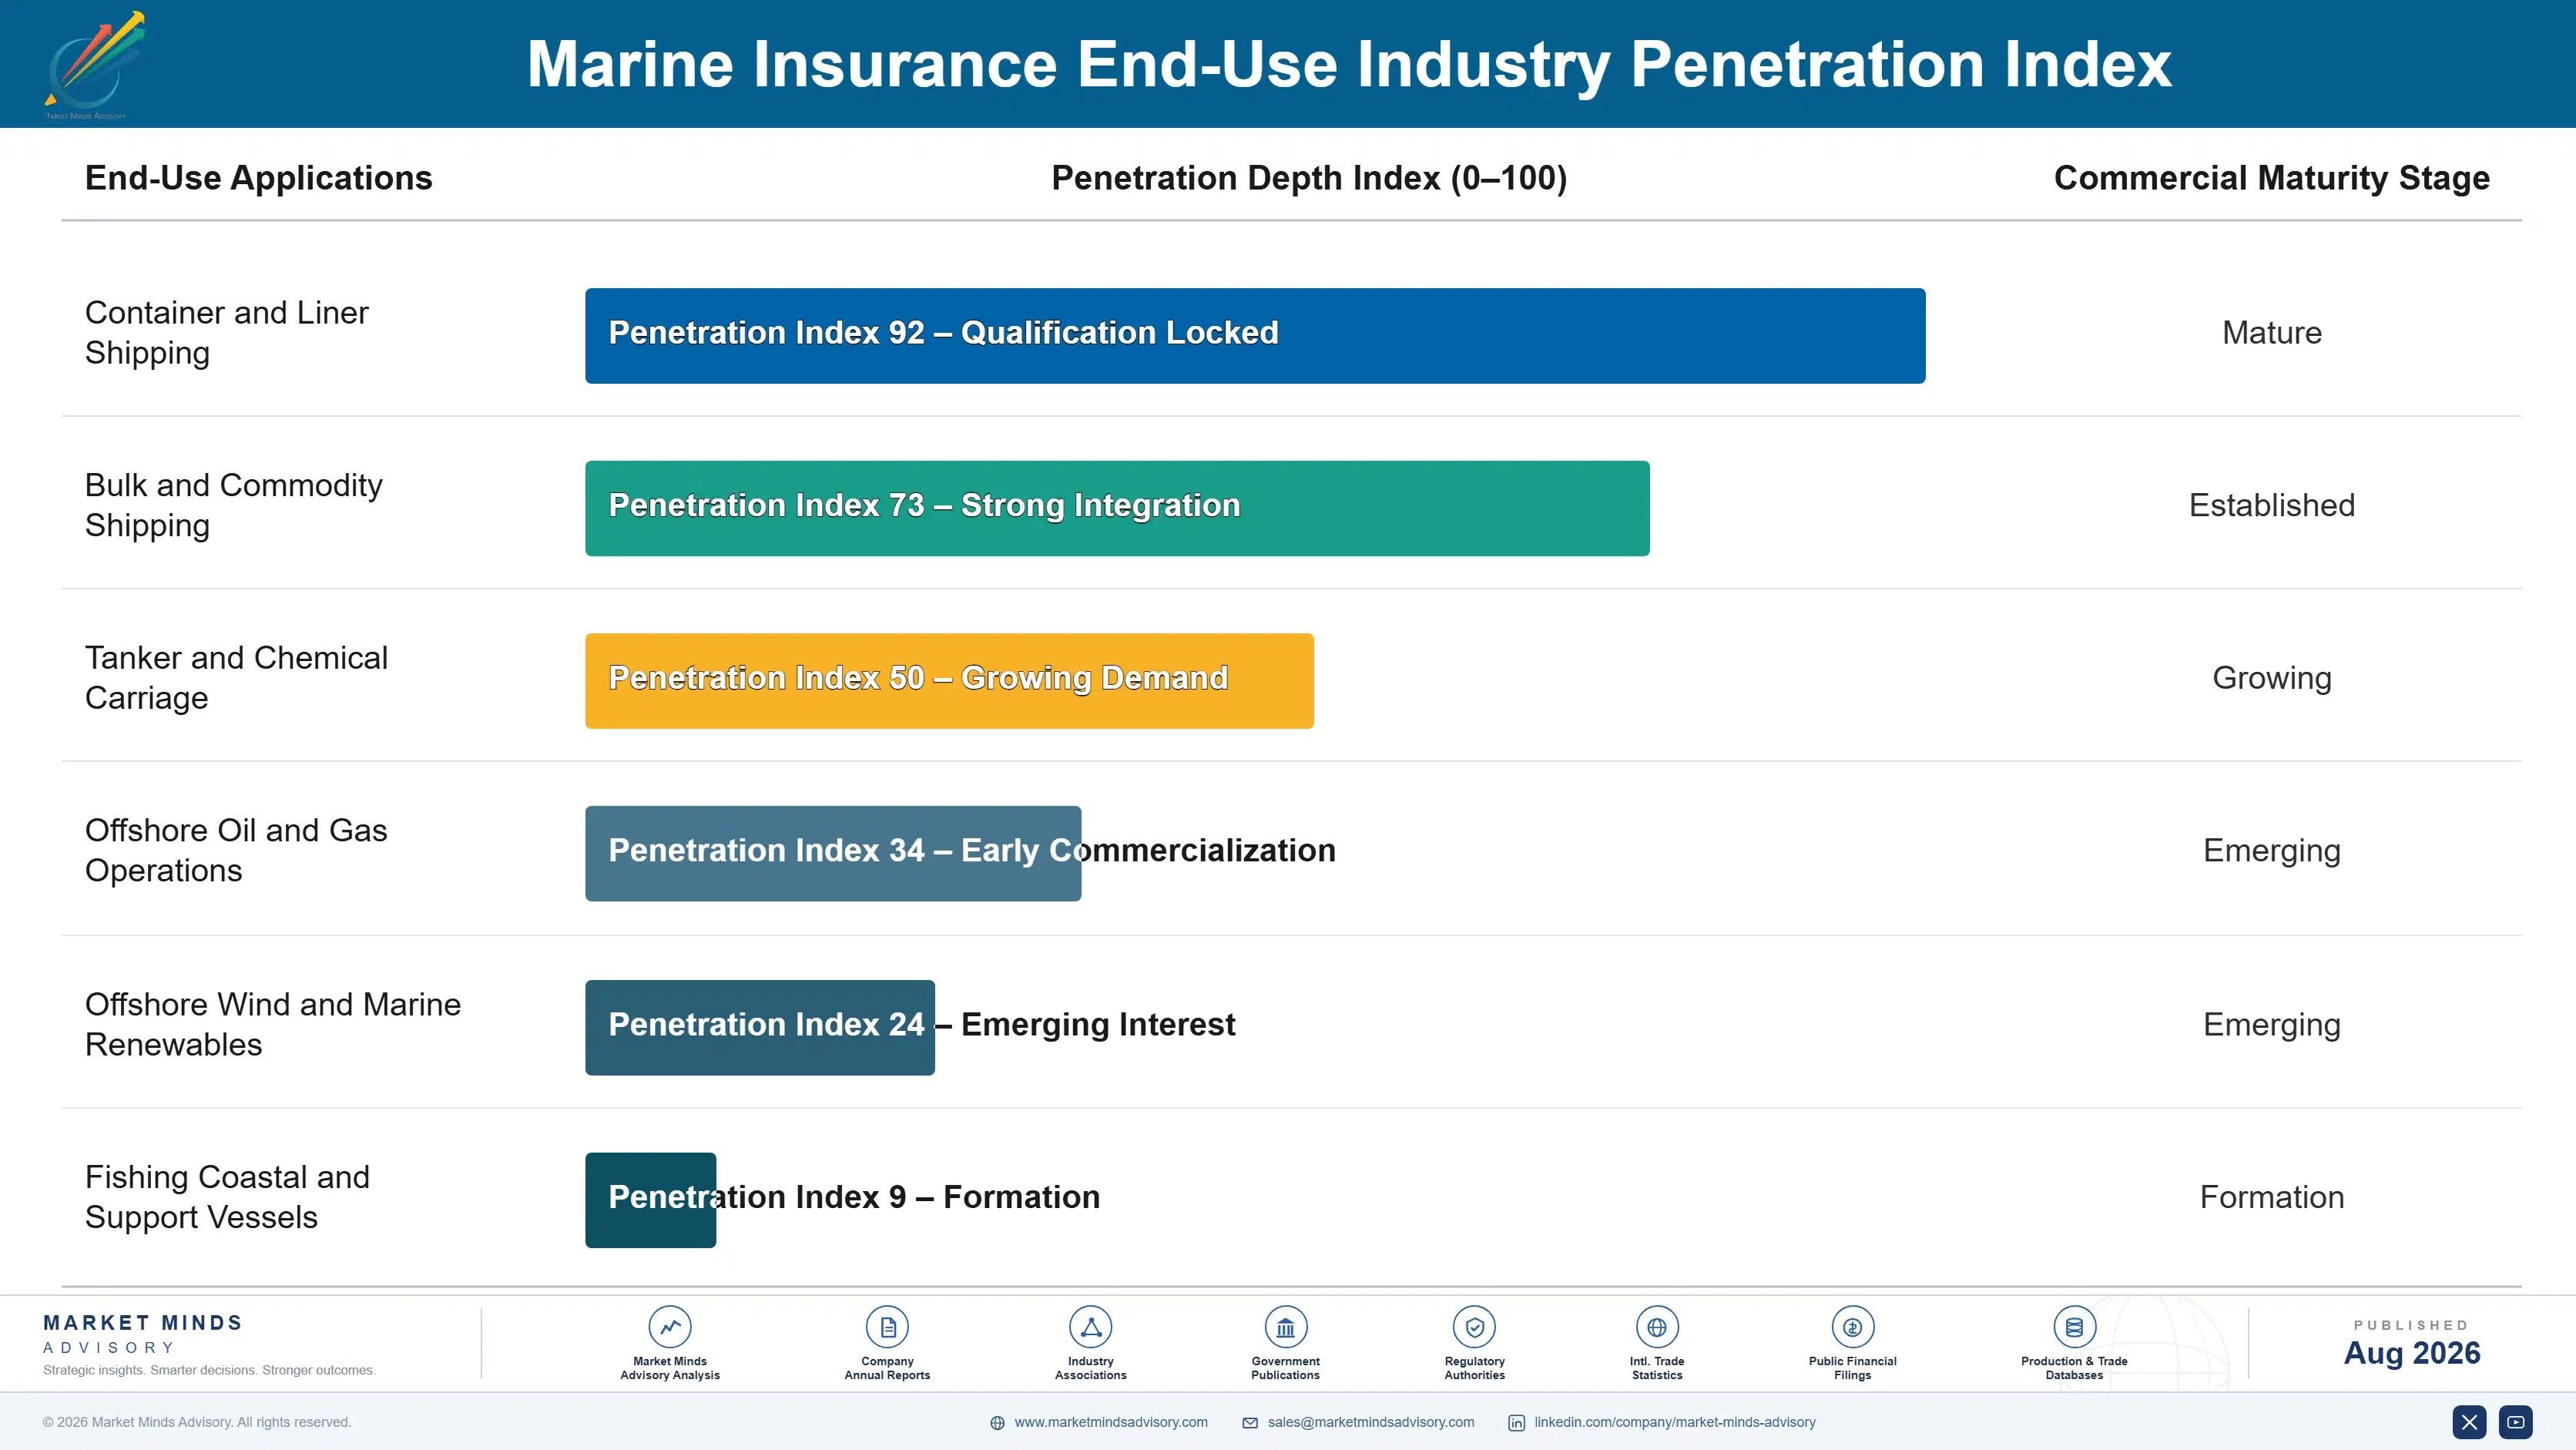
Annuity characteristics here are as strong as anywhere in insurance and considerably stronger than most carriers exploit. A trading vessel cannot sail without hull and liability cover, port state control checks certificates, and charterers require evidence before fixing. Demand therefore does not vary with economic conditions in any meaningful way. What varies is where cover is bought and at what rate, and both move far more than volume ever does.
Stickiness divides sharply between mutual and commercial business. Mutual membership is genuinely sticky, since leaving a club means forfeiting accumulated standing and the alignment that comes with ownership. Commercial hull and cargo accounts move on rate at renewal with limited friction, particularly where brokers control the relationship. Offshore energy sits closer to the mutual end, because the underwriters who understand those risks are few and known personally.

The buyer has professionalised considerably over two decades. Shipowners once bought through a broker they had used for generations and asked few questions. Fleet risk managers now compare club calls against fixed-premium alternatives, model retention economics and negotiate deductibles that would once have been standard. Charterers and cargo interests are similarly sophisticated, which has compressed the information advantage carriers once relied upon.
marine-insurance-market-end-use-penetration-index-1787913432673

Scarcity Pays, Volume Does Not

These are among the four positions where our research anticipates prominent divergence between winners and laggards over the coming forecast period. Each is grounded in the demand model, the regulatory perimeter, and the announced capacity pipeline.
01 / WAR RISK RATING DISCIPLINE

This class always gives the gains back fastest

Red Sea transits repriced from roughly 0.05% of hull value up to about 0.9% inside a single quarter, and capacity is already returning while the underlying exposure itself has changed very little indeed. War risk has surrendered its gains faster than it earned them in every single previous cycle anybody can point to. Carriers who hold rating through the softening keep this class profitable measured across a whole cycle, and those chasing share end up funding the next loss themselves.
02 / ACCUMULATION DATA BUILDING

Nobody knows what they hold on one hull

A large container vessel carries around 1.8 billion dollars of insured cargo across hundreds of separate policies written by dozens of carriers, none of whom can see the aggregate exposure that they all collectively hold on that one single hull. Building vessel-level tracking from booking and bill of lading data is genuinely hard and nobody in the market has yet managed it well. Whoever manages it first will price accumulation properly while everybody else keeps rating each shipment in complete isolation.
03 / MUTUAL STRUCTURE POSITIONING

Commercial capital cannot replicate a members' club

Protection and indemnity clubs charge calls, they can levy supplementary amounts, they pool claims above 10 million dollars and they reinsure collectively to around 3.1 billion, none of which any commercial carrier can possibly replicate on rated capital answerable to its shareholders. Competing head-on against that structure is simply a losing proposition for almost anybody. Supplying the excess layers, the fixed-premium alternatives for smaller operators and the reinsurance sitting behind the pool is where commercial capital actually goes on to earn here.
04 / REGIONAL PRESENCE BUILDING

The placements stopped travelling some time ago

Asian markets now retain the hull and cargo risks that would once have been brokered quite automatically into London, and only the very largest or genuinely complex placements still make that trip at all now. Regional premium there grows at 7.2% a year while traditional markets sit waiting for submissions that are simply no longer being sent to them. Establishing real underwriting presence within the region reaches the business that will never be brokered outward again in any meaningful volume.

Engagement Snapshot From the Field

A live engagement with an industry participant carrying material or product regulatory and market exposure ahead of a defining policy shift, showing how our research translates into a defensible multi-year portfolio strategy.
MARKET MINDS ADVISORY · CLIENT ENGAGEMENT SUMMARY
Marine Insurance Producer Strategic Portfolio Review and Transition Roadmap 2026·Investment Scenario on Marine Insurance Exposure Evaluation 2025-26
CLIENT PROFILE
A composite marine carrier writing cargo, hull and modest specialty lines across European and Asian business, with reported marine gross written premium of 420 million dollars (client-reported, unverified by MMA). Roughly 63% sat in cargo. No vessel-level accumulation tracking existed and war risk capacity had been deployed opportunistically without any dedicated underwriting discipline behind it.
STRATEGIC CHALLENGE
Cargo combined ratios had deteriorated for three consecutive years while the book grew, and the carrier held no view whatsoever of its aggregate exposure on individual vessels. Management proposed growing cargo further to spread fixed costs. That increased an unmeasured accumulation exposure while doing nothing about the underlying rating inadequacy driving the deterioration.
MMA APPROACH
MMA reconstructed the cargo book by vessel using booking and bill of lading data the carrier already held but had never aggregated, then modelled maximum foreseeable loss on single hulls. Twenty-seven expert interviews with brokers, surveyors, mutual club managers and war risk underwriters established how capacity and pricing actually move. The analysis treated accumulation measurement and class mix as the routes available.
KEY FINDINGS
  1. Aggregate cargo exposure on the single largest vessel reached almost four times the carrier's stated per-risk limit, and nobody in the business had ever calculated the figure.
  2. Cargo rate adequacy had fallen consistently while the book grew, and growth had been masking the deterioration in every management report produced.
  3. War risk had been written opportunistically at peak rates without dedicated underwriting, and the carrier had no plan for holding discipline as capacity returned.
  4. The data required for accumulation tracking already existed inside the carrier's own systems and had simply never been aggregated by vessel at all.
CLIENT PROFILE
A composite marine carrier writing cargo, hull and modest specialty lines across European and Asian business, with reported marine gross written premium of 420 million dollars (client-reported, unverified by MMA). Roughly 63% sat in cargo. No vessel-level accumulation tracking existed and war risk capacity had been deployed opportunistically without any dedicated underwriting discipline behind it.
STRATEGIC CHALLENGE
Cargo combined ratios had deteriorated for three consecutive years while the book grew, and the carrier held no view whatsoever of its aggregate exposure on individual vessels. Management proposed growing cargo further to spread fixed costs. That increased an unmeasured accumulation exposure while doing nothing about the underlying rating inadequacy driving the deterioration.
MMA APPROACH
MMA reconstructed the cargo book by vessel using booking and bill of lading data the carrier already held but had never aggregated, then modelled maximum foreseeable loss on single hulls. Twenty-seven expert interviews with brokers, surveyors, mutual club managers and war risk underwriters established how capacity and pricing actually move. The analysis treated accumulation measurement and class mix as the routes available.
KEY FINDINGS
  1. Aggregate cargo exposure on the single largest vessel reached almost four times the carrier's stated per-risk limit, and nobody in the business had ever calculated the figure.
  2. Cargo rate adequacy had fallen consistently while the book grew, and growth had been masking the deterioration in every management report produced.
  3. War risk had been written opportunistically at peak rates without dedicated underwriting, and the carrier had no plan for holding discipline as capacity returned.
  4. The data required for accumulation tracking already existed inside the carrier's own systems and had simply never been aggregated by vessel at all.
RECOMMENDED STRATEGY
Phase 1: Phase one: aggregate existing booking data by vessel immediately, since the information required is already held and is merely unused. Phase 2: Phase two: reprice or decline the cargo accounts driving accumulation concentration rather than simply growing the whole book any further. Phase 3: Phase three: establish dedicated war risk underwriting discipline before returning capacity erodes those rates all the way back toward previous levels again.
OUTCOME
Vessel-level aggregation was built within a quarter from data already held (client-reported, unverified by MMA). Twelve cargo accounts driving concentration were repriced and four declined. War risk underwriting was brought under a dedicated authority. The cargo growth plan was abandoned, having proposed adding volume to an exposure the carrier had never once measured.

Frequently Asked Questions

Foundational context covering the market sizes, CAGR, scope, country, region and competition that inform every finding below. This section is provided to cover basics and most often pre-purchase conversations, answered from the MMA Primary Research Dataset.

What is the current size of the Marine Insurance Market?

The market was worth 41.5 billion dollars in gross written premium in 2025, across cargo, hull, liability, offshore energy, war risk and specialist lines. It reaches 43.99 billion dollars in 2026.

How large will the Marine Insurance Market be by 2036?

MMA forecasts 78.78 billion dollars by 2036, an increase of 34.79 billion dollars over the 2026 base. That represents an expansion multiple of 1.79 times across the forecast period.

What is the CAGR for the Marine Insurance Market 2026 to 2036?

The base case compounds at 6.0% annually. The bull case reaches 7.2% on further war risk repricing and a hardening liability market, while the bear case sits at 4.8%.

Which segment is growing fastest?

War risk and political violence cover, at 9.0%, half again the market rate of 6.0%. Red Sea transits repriced from roughly 0.05% of hull value to about 0.9%.

Who are the major companies in the Marine Insurance Market?

Allianz Commercial, AXA XL, Gard, Chubb and Zurich Insurance Group lead on disclosed marine premium. Concentration is only 29%, since mutuals and syndicates write on different capital structures.

Which country is growing fastest?

India at 8.0%, supported by rising trade volumes, expanding domestic tonnage and insurance capacity that has developed considerably faster than most observers expected it to.

Report Segmentation Architecture

The full report scope spans multiple orthogonal segmentation dimensions, with cross-tabulated demand data provided for each dimension pair. Coverage extends further to regional breakdowns, trend trajectories, and the competitive detail needed to support segment-level decision-making.

By Class of Business

  • Cargo Insurance
  • Hull and Machinery Insurance
  • Marine Liability and Protection and Indemnity
  • Offshore Energy Insurance
  • War Risk and Political Violence Cover
  • Specie Yacht and Specialist Marine Lines

By End-Use Industry

  • Container and Liner Shipping
  • Bulk and Commodity Shipping
  • Tanker and Chemical Carriage
  • Offshore Oil and Gas Operations
  • Offshore Wind and Marine Renewables
  • Fishing Coastal and Support Vessels

By Commercial Dimension

  • Broker Placed Commercial Business
  • Mutual Club Membership Calls
  • Fixed Premium Alternative Facilities
  • Direct Fleet Underwriting Relationships
  • Coverholder and Delegated Authority
  • Reinsurance and Excess Layer Participation

By Region

  • North America
  • Western Europe
  • East Asia
  • South Asia and Pacific
  • Latin America
  • Middle East and Africa
  • Eastern Europe

Scope, Methodology, and Coverage

Every figure in this report is reproducible from documented input assumptions. The scope below maps the historical period, the forecast horizon, the segmentation dimensions, and the countries covered, alongside the underlying primary and qualitative methodology.
Historical Period
2020 to 2025
Forecast Period
2026 to 2036
Base Year
2025 (USD billions; MMA Primary Research Dataset, August 2026)
Market Definition
Scope covers gross written premium and mutual calls across marine insurance classes worldwide, spanning cargo insurance on goods in sea carriage, hull and machinery insurance on commercial and specialist vessels, marine liability including protection and indemnity calls charged by mutual clubs and fixed premium alternatives, offshore energy insurance across construction installation and operational phases, war risk and political violence cover on hulls and cargo, and specie yacht and specialist marine lines. Inland transit cover unconnected to sea carriage, aviation and general transport liability, port terminal and warehouse property insurance, shipbuilders risk prior to launch, marine reinsurance ceded between carriers, and trade credit insurance written on cargo sale transactions are excluded from the market size and all derived figures.
Quantitative Units
USD billions of gross written premium (current prices); premium share by class; war risk rates as percentage of hull value; pooling retention and reinsurance limits in USD; cargo value per vessel
Segmentation Dimensions
By Class of Business; By End-Use Industry; By Commercial Dimension; By Region
Regions Covered
North America, Western Europe, East Asia, South Asia and Pacific, Latin America, Middle East and Africa, Eastern Europe
Countries Covered
UK, Norway, China, Japan, Germany, Singapore, South Korea, USA, France, Brazil, India, Netherlands, Italy, United Arab Emirates, Denmark
Key Companies Profiled
Allianz Commercial, AXA XL, Gard, Chubb, Zurich Insurance Group, Munich Re, Swiss Re Corporate Solutions, Tokio Marine, Sompo, MS&AD Insurance Group, Skuld, NorthStandard, Steamship Mutual, UK P&I Club, Britannia P&I, Beazley, Hiscox, Markel, Generali, PICC Property and Casualty
Quantitative Methodology
Primary survey, n=3,800 respondents, Q4 2025, six countries; demand-side model with trade association cross-validation
Qualitative Methodology
47 expert interviews, Q4 2025; applied to validate demand model assumptions, identify emerging dynamics, and assess competitive positioning
Report Format
PDF and XLSX data workbook (Word format preview document)
Publisher
Market Minds Advisory
Report Code
MMA-2026-TEC-171
Published
August 2026
Contact
sales@marketmindsadvisory.com | www.marketmindsadvisory.com

Purchase the full Marine Insurance Market Report (2026 to 2036).

The full report runs to 200 pages and covers all six classes of business, seven regions and 20 profiled carriers and clubs in detail. It includes the complete segment CAGR set, regional analysis of premium origination against fleet ownership and trade volume, and modelling of mutual pooling economics against commercial capital structures. Company profiles carry evaluation on disclosed marine and specialty gross written premium, with moat and risk assessment for the top five participants. The competitive section extends to 15 tracked rating, capacity and claims developments across 2024 and 2025. Primary research inputs include a quantitative survey of 3,800 respondents and 47 expert interviews conducted in Q4 2025.
Six marine classes with individual CAGR forecasts
Seven regions compared on premium origination against fleet ownership
Twenty carrier and club profiles on consistent premium basis
Fifteen tracked rating and claims developments with commercial interpretation
Mutual pooling economics modelled against commercial capital structures
Cargo accumulation exposure quantified at vessel and port level

Built For The People Who Decide

From boardroom strategy to bench-side execution, this report is read cover-to-cover by leaders shaping the next decade of their industry, turning demand scenarios, market dynamics and valuation benchmarks into decisions.
CXOs/ Presidents/ VPs/ Managers
M&A and Corporate Development
Strategy Teams and R&D Heads
Procurement and Product Directors
Regulatory and Compliance Leaders
Investor Relations and Equity Analysts