Market Minds Advisory
Managed Workplace Services Market

Managed Workplace Services Market: Managed Workplace Services Market. Device Lifecycle, Digital Employee Experience, and Workplace Support, 2026 to 2036

Enterprises abandoning fixed-scope office IT support contracts for consumption-based managed workplace services are forcing vendors to prove measurable employee experience gains rather than simple ticket resolution speed across every device fleet.

Lead Analyst

Published

September 2026

Make Smarter Decisions with Customized Research Insights

Request a free sample report and evaluate market opportunities, growth trends, and competitive dynamics relevant to your business needs.

2025 MARKET VALUE$18.5BMarket Size 2025
2036 FORECAST VALUE$45.4BBase Case , 2026 to 2036
CAGR 2026 TO 20368.5 %Bull 9.8% / Bear 7.2%
INCREMENTAL OPPORTUNITY$25.3BNet 10- year value creation
EXPANSION MULTIPLE2.26x2036 value over 2026 base
Strategic Levers
M&A Pipeline
Regional Outlook
Country Rankings
Competitive Intelligence
Segmental Deep-dive
Call-Us : 91 93563 13602

Executive Snapshot and Market Trajectory.

Managed workplace services have shifted decisively from reactive break-fix IT support contracts into proactive, analytics-driven platforms that predict device failures and resolve employee issues before a support ticket is ever filed at all, fundamentally changing how enterprises budget for and manage end-user technology support across the entire global organization.
Device lifecycle and endpoint management is growing fastest as enterprises consolidate hardware procurement, deployment, and disposal into a single managed contract rather than handling each stage separately through different internal teams and vendors across the organization. North America leads regional demand given its concentration of large enterprises with hybrid workforces spanning corporate offices, home offices, and satellite locations requiring consistent device support and troubleshooting everywhere across every business unit and job function.
Competitive character increasingly centers on digital employee experience scoring and proactive issue resolution rather than simple ticket volume metrics tracked historically, since enterprises now measure vendor performance by how rarely employees notice any IT problems at all during a typical workday across every department. Vendors offering AI-driven predictive maintenance and self-healing endpoint software win disproportionate share of new enterprise contracts signed each fiscal quarter.
Market Definition
The Managed Workplace Services Market covers outsourced IT services that manage employee-facing technology, including device lifecycle management, helpdesk support, unified communications, and workplace cybersecurity, delivered under a consumption-based or per-seat contract. It excludes core data center infrastructure management, enterprise application development, and networking equipment sales unrelated to end-user device support.
Base Year Value
$18.5B in 2025 (MMA Primary Research Dataset, September 2026)
Forecast Period
2026 to 2036, eleven discrete annual values
CAGR
8.5% base case. Bull 9.8%. Bear 7.2%.
Fastest Growth Segment
Managed Device Lifecycle and Endpoint Management: 12.5% CAGR
Fastest Growth Country
Philippines: 12.0% CAGR
Fastest Growth Region
South Asia and Pacific: 10.5% CAGR
Largest Region
North America: 32% of 2025 global value
Market Leaders
Leading vendors: HP Inc., Dell Technologies, Lenovo, Unisys, NTT DATA. Source: MMA Primary Research Dataset, July 2026.
Primary Survey
n=3,800 procurement and R&D decision-makers, Q4 2025, six countries
Methodology
Demand-side build-up, cross-validated against public data, 47 expert interviews

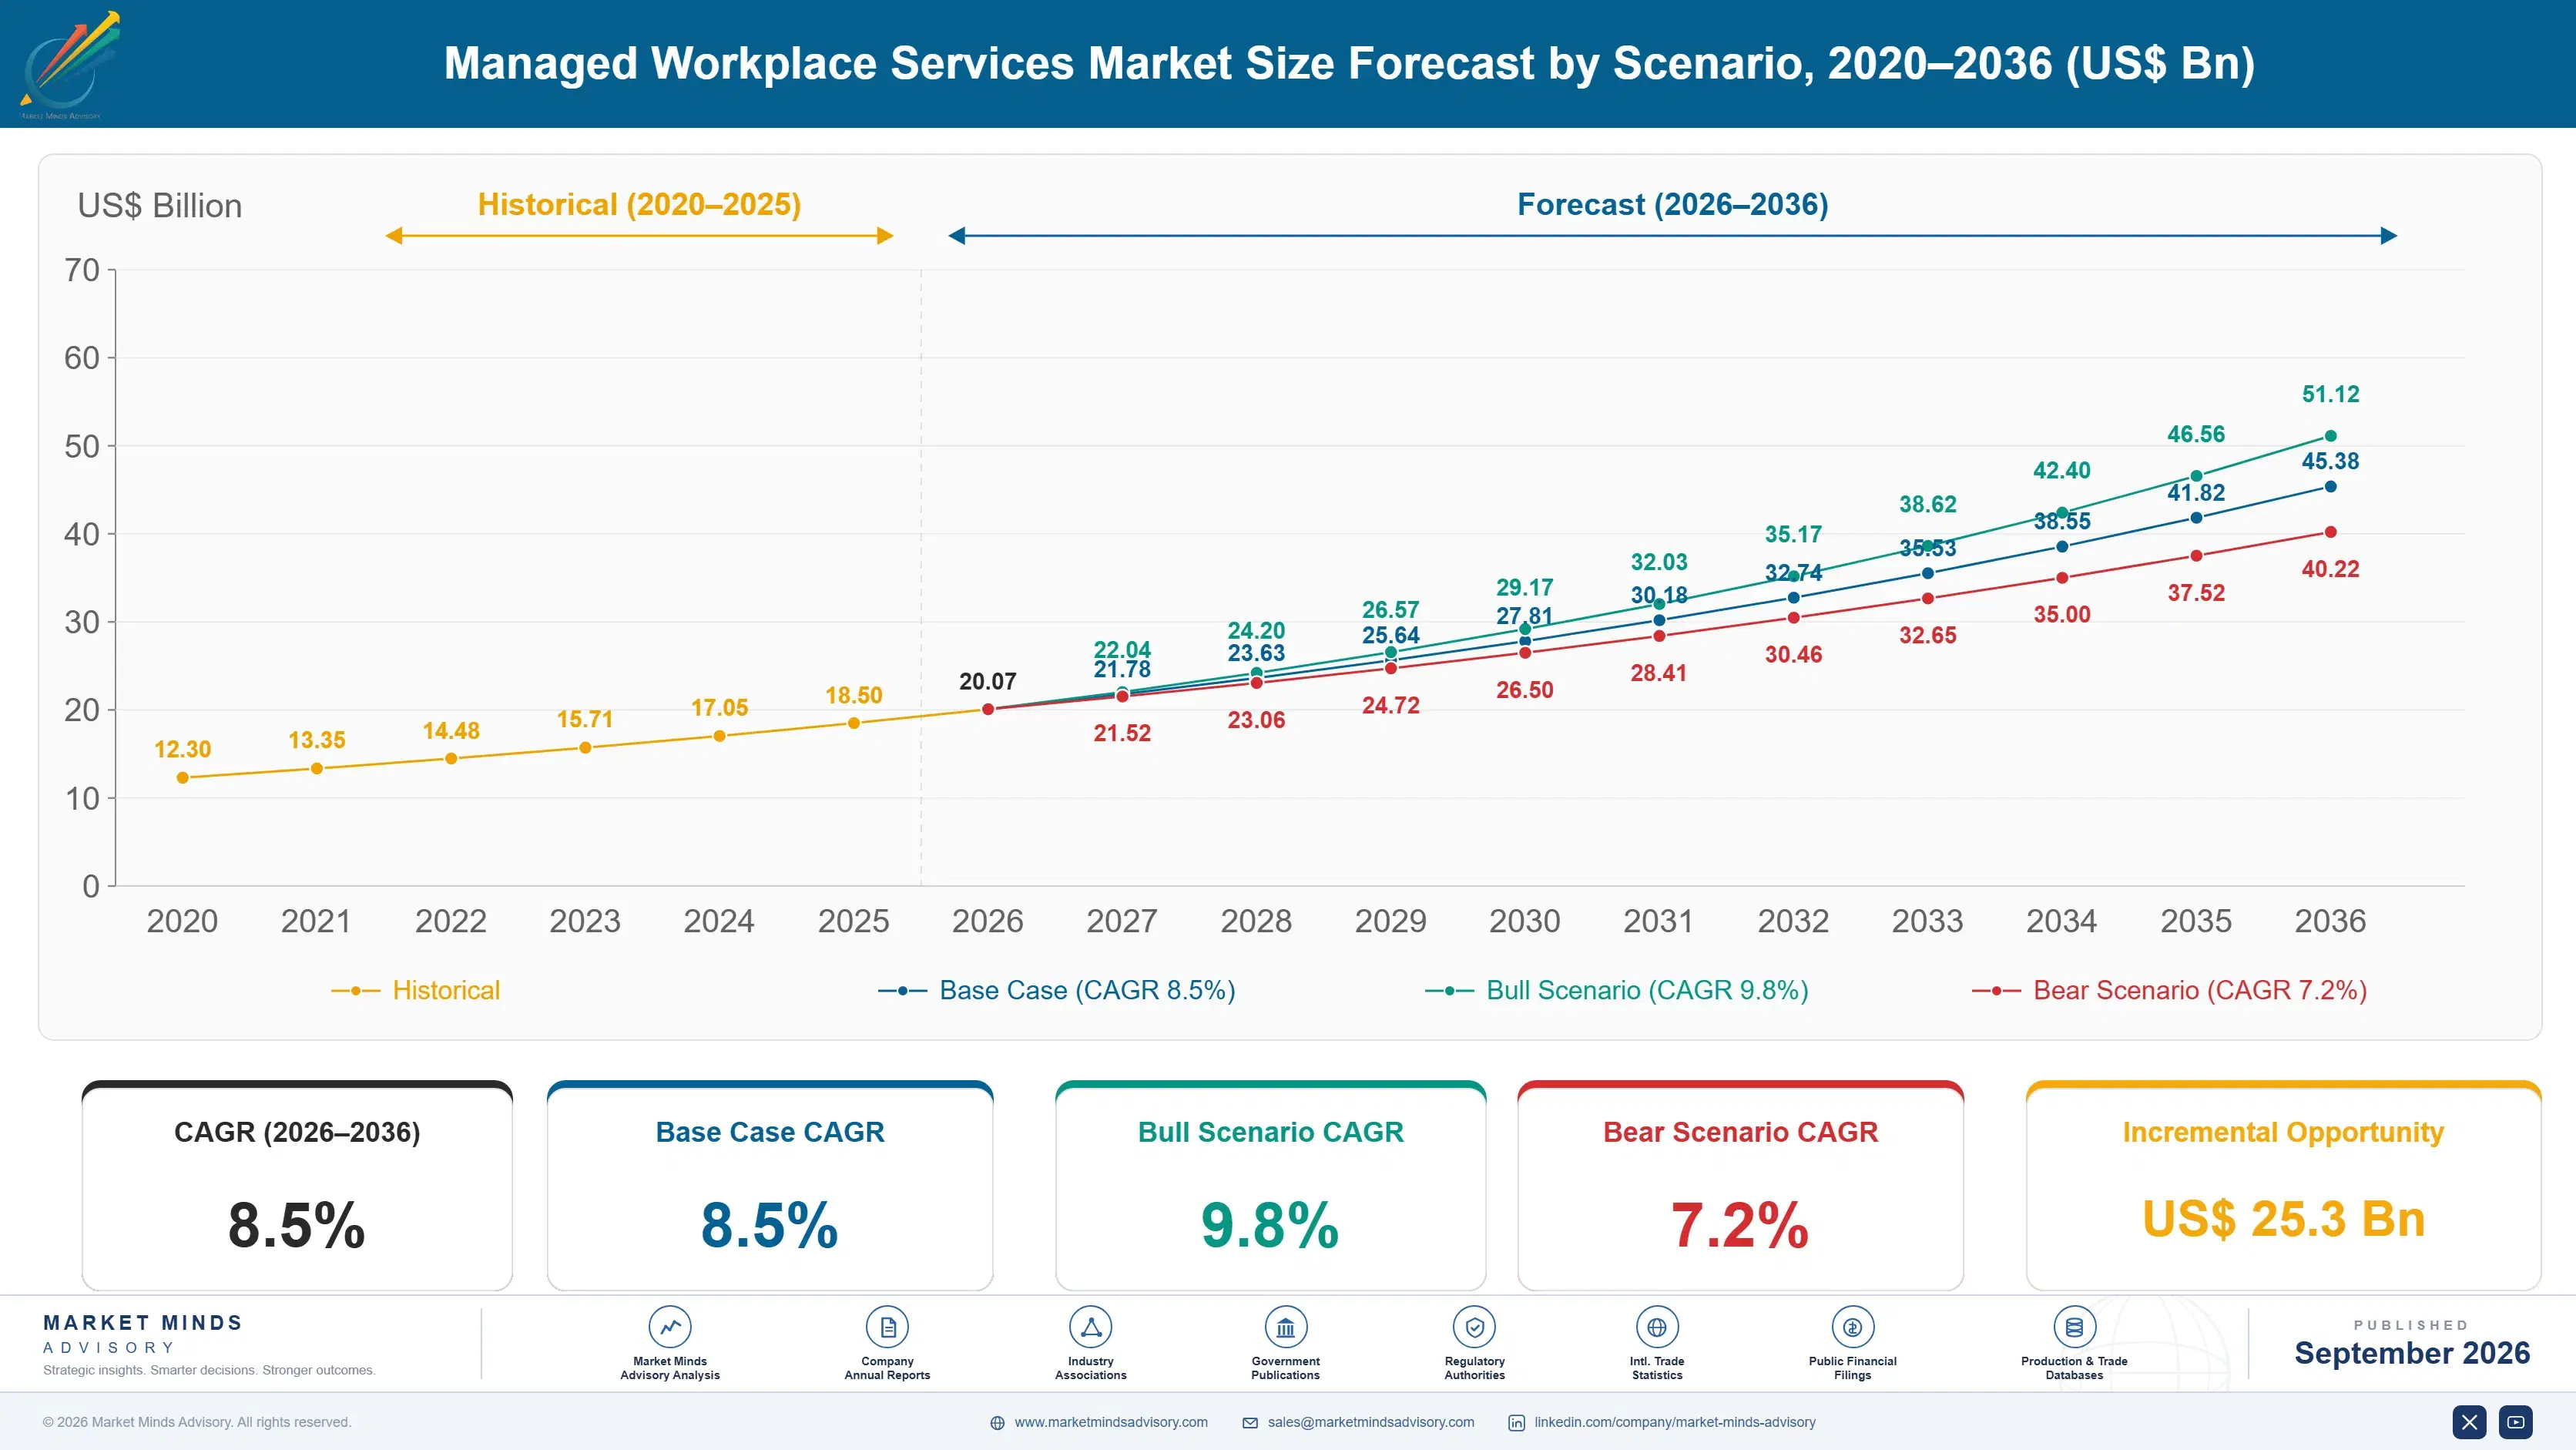
Managed Workplace Services Market Forecast Scenarios

managed-workplace-cervices-market-size-forecast-scenario-1789995764455
Growth through 2020 to 2025 accelerated as hybrid work arrangements forced enterprises to extend device management and helpdesk support across dispersed home offices rather than a single centralized corporate campus, a shift that permanently expanded the addressable scope of managed workplace services contracts well beyond traditional office-only coverage models that dominated the industry for decades prior.
Base case growth through 2036 rests on three commercial mechanisms: continued enterprise consolidation of fragmented device management, helpdesk, and disposal contracts into a single managed provider relationship covering every device type deployed, expanding digital employee experience monitoring adoption as enterprises quantify productivity loss from IT friction more precisely than ever before, and growing demand for workplace cybersecurity management bundled directly into existing device support contracts rather than purchased separately from a different vendor.
A bull scenario turns on faster enterprise adoption of AI-driven predictive maintenance that meaningfully reduces device downtime and support ticket volume, strengthening the return on investment case for outsourcing this function entirely. The bear risk is that enterprises increasingly bring device management back in-house using low-cost automation tools, reducing the addressable market for external managed service providers over the coming years and decades.

The Experience Economics Behind Every Device Contract

Vendors no longer compete primarily on how quickly a technician can resolve a support ticket after it has already been filed, since that baseline capability has become table stakes across nearly every credible provider in the market, but rather on how effectively the platform prevents the ticket from ever being filed at all through proactive, predictive device monitoring built directly in.
MARKET CONCENTRATIONCR5: 28%Top five vendors hold barely over a quarter share
COST PER MANAGED SEAT$42/monthTypical monthly per-employee fee for full device coverage
TOP DEPLOYING COUNTRY SHAREUSA: 30%Reflects concentration of large enterprises and hybrid workforces
MEAN TICKET RESOLUTION TIME38 minutesTypical benchmark vendors cite for standard support requests
PREDICTIVE MAINTENANCE ADOPTION34%Share of contracts now including proactive failure prediction
MULTI-YEAR CONTRACT RENEWAL RATE82%Reflects strong customer retention once fully deployed enterprise-wide
Pricing has shifted decisively from per-incident billing toward per-seat consumption models bundling device lifecycle, helpdesk, and basic cybersecurity coverage into a single predictable monthly fee, since enterprises increasingly resist the budget unpredictability that per-incident billing created during periods of unusually high support volume across the fiscal year. Vendors offering flexible, all-inclusive pricing win larger initial deployments because procurement teams value predictable annual budgeting above nearly everything else.
Digital employee experience scoring has become the single largest differentiator behind renewal decisions, since enterprises increasingly measure vendor performance by how rarely employees notice IT friction at all rather than by raw ticket closure speed alone across the fiscal year. Vendors that provide transparent, real-time experience dashboards report meaningfully higher renewal rates than those relying solely on traditional service level agreement metrics that employees themselves never actually see or understand.
"Nobody wins a renewal by closing tickets fast anymore. The vendors keeping accounts are the ones whose employees never noticed there was a problem to begin with."
Practice Lead, Digital Workplace and IT Services Research · MMA Technology Practice · September 2026

Market Trends

AI Agents Now Resolve Tickets Without Human Technicians

Vendors have deployed conversational AI agents capable of resolving common password reset, software installation, and connectivity issues entirely without routing the request to a human technician, cutting average ticket resolution time sharply for the categories of issues that historically consumed the largest share of helpdesk labor across most enterprise deployments worldwide and every industry served. Roughly 38 percent of tier-one support tickets in 2025 were resolved entirely by an AI agent with zero human involvement, up from under 12 percent just two years earlier as the underlying technology matured rapidly.
Market Impact: 55% cite staffing shortages as driver
Device-as-a-Service Consolidates Procurement and Support Contracts

Enterprises increasingly bundle hardware procurement, deployment, ongoing support, and end-of-life disposal into a single device-as-a-service contract rather than managing each stage through separate vendors and internal budget lines, simplifying both vendor management overhead and total cost of ownership tracking considerably across the entire device fleet lifecycle from initial purchase all the way through final retirement and fully responsible disposal. Roughly 42 percent of large enterprises surveyed in 2025 reported consolidating at least half of their device fleet onto a device-as-a-service model, up sharply from under 18 percent three years earlier.
Market Impact: Contracts now cover 3x more locations

Market Opportunities and Growth Drivers

IT Talent Shortage Pushes Support Functions to Outsourcing

Enterprises face persistent difficulty hiring and retaining internal helpdesk and device support staff, pushing many to outsource these functions entirely to managed service providers who can spread specialized technician talent across many client accounts simultaneously rather than maintaining dedicated headcount for a single organization alone at significant fixed cost. Roughly 55 percent of large enterprises surveyed in 2025 reported that internal IT support staffing shortages directly influenced their decision to expand a managed workplace services contract, up from under 30 percent three years earlier as the talent gap widened considerably.
Market Impact: Delayed deployment in 3 countries

Hybrid Work Expands Device Support Geography Dramatically

Hybrid and remote work arrangements have permanently expanded the geographic footprint that device support and helpdesk services must cover, since employees now work from home offices, co-working spaces, and satellite locations rather than a single centralized corporate campus that internal IT teams could physically visit easily and inexpensively before this shift occurred. Enterprises report that the average managed workplace services contract now covers roughly 3 times more physical locations than it did five years earlier, a scale expansion that internal IT teams struggle to staff and coordinate without outside support and expertise.
Market Impact: Cycles now stretch past 9 months

Market Restraints and Challenges

Data Privacy Concerns Slow Endpoint Monitoring Adoption

Employees and labor representatives in several countries have raised genuine privacy objections to the granular endpoint monitoring that digital employee experience platforms rely on, since these tools often capture application usage patterns and productivity metrics employees never explicitly consented to having tracked in this level of detail. The root cause is that vendors built monitoring capability faster than clear consent frameworks could be established. Works councils in several European countries have blocked or delayed deployment pending renegotiated terms. Some vendors now offer opt-in, anonymized aggregate reporting instead of individual-level tracking.
Market Impact: 38% of tickets resolved by AI

Contract Complexity Slows Enterprise Procurement Decisions

Consolidating device lifecycle, helpdesk, and cybersecurity coverage into a single managed contract requires enterprises to navigate genuinely complex service level agreement structures spanning multiple functional areas that were previously procured and managed entirely separately by different internal teams and budget owners. The underlying cause is that no standardized industry framework yet exists for structuring these multi-function bundled contracts consistently across vendors. This complexity routinely extends the average enterprise procurement cycle to nine months or longer. Several vendors have responded by publishing standardized contract templates to speed up buyer evaluation and reduce legal review time considerably.
Market Impact: 42% now consolidate onto device-as-a-service
4 additional market trends, 3 additional growth drivers, and 4 additional restraints and challenges are covered in the full report. Contact sales@marketmindsadvisory.com to access the complete intelligence.

Segment CAGR and Growth Architecture

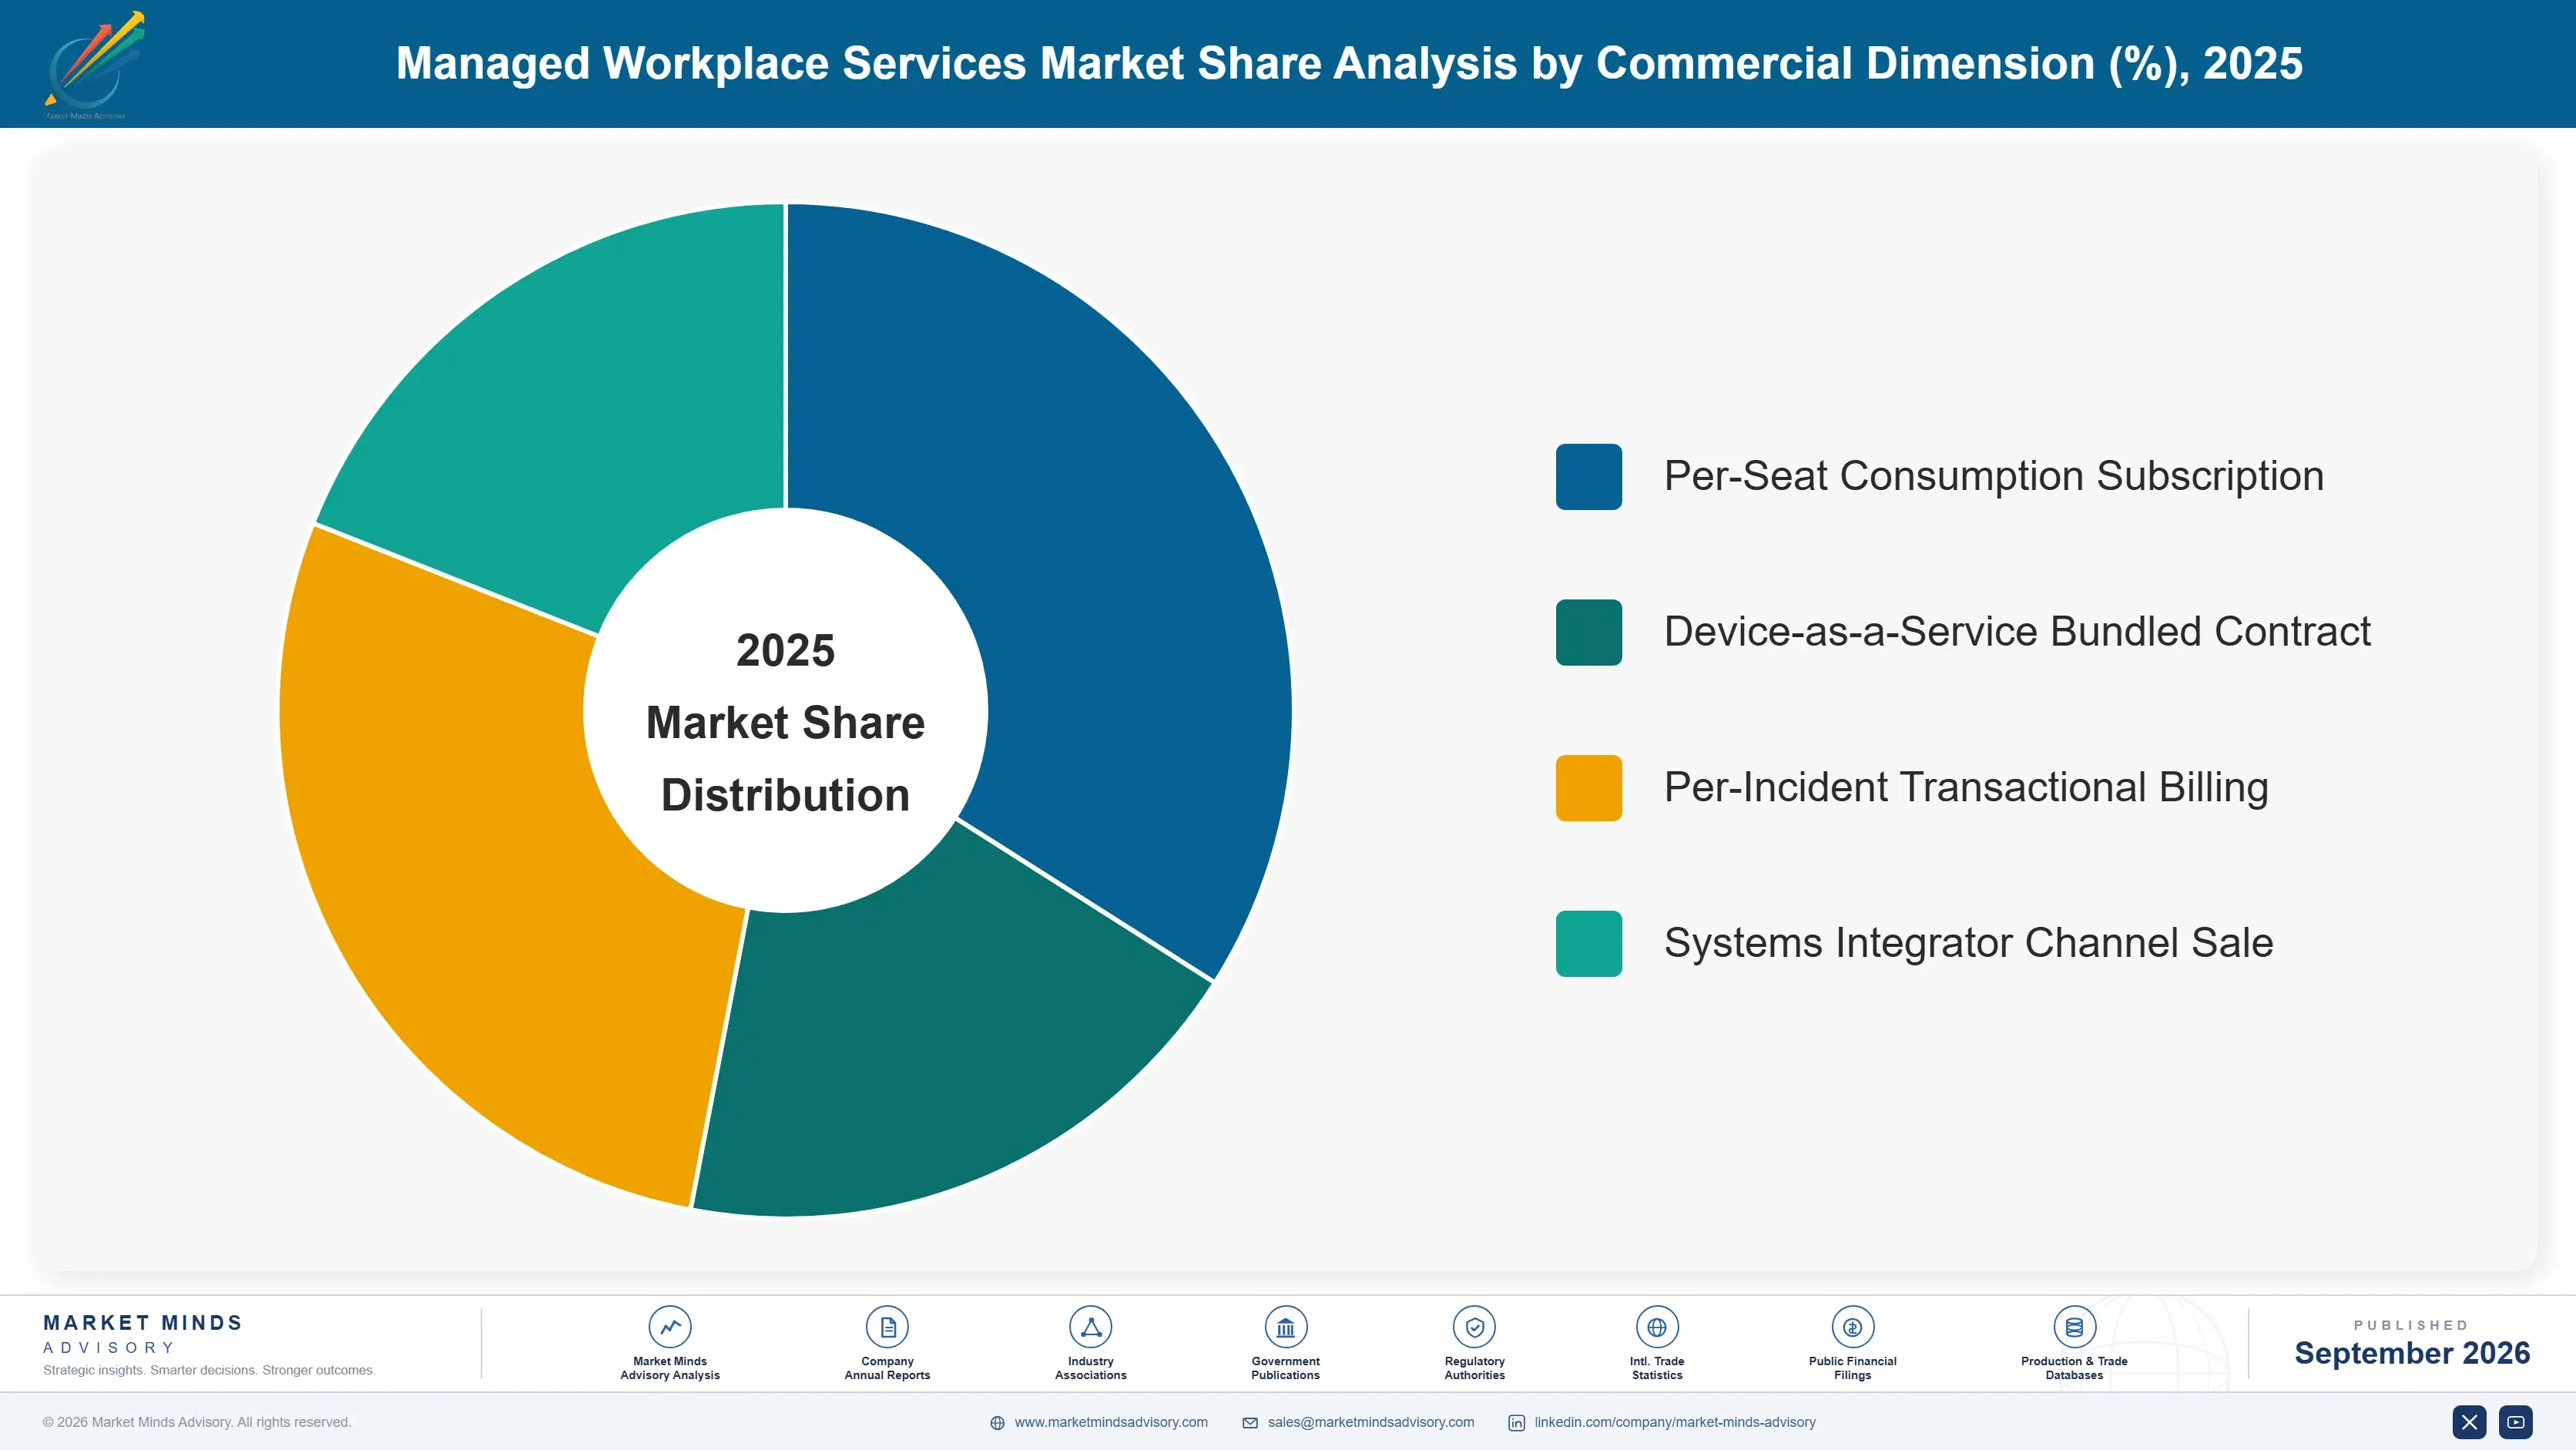
The market splits by service function rather than by industry vertical or delivery geography, since pricing, staffing model, and contract structure vary sharply across each category. Six categories cover the field: device lifecycle and endpoint management, digital employee experience and helpdesk automation, managed print services, unified communications management, workplace cybersecurity, and IT asset disposition.
managed-workplace-cervices-market-market-share-analysis-1789995765017

Managed Device Lifecycle and Endpoint Management

Managed device lifecycle and endpoint management is the fastest-growing category by a wide margin, driven by enterprises consolidating procurement, deployment, ongoing support, and end-of-life disposal into a single vendor relationship rather than managing each stage separately through different internal teams and budget lines. Adoption started among large enterprises with complex, geographically dispersed device fleets but has spread into mid-market companies seeking to reduce internal IT headcount burden. Pricing has shifted from per-device transactional billing toward per-seat consumption models that bundle every lifecycle stage into one predictable monthly fee, and vendors increasingly bundle predictive maintenance software directly into the base contract rather than selling it as a separate add-on to the same enterprise buyer.
CAGR 12.5%

Digital Employee Experience and Helpdesk Automation

Digital employee experience and helpdesk automation addresses a genuinely distinct commercial need, since enterprises increasingly want quantifiable proof that IT friction is not silently eroding employee productivity across the organization and its many departments and job functions. Adoption has concentrated among large enterprises with sophisticated internal analytics functions capable of interpreting experience scores and correlating them against measurable productivity and retention outcomes over time. This category commands premium pricing relative to basic helpdesk support given the specialized analytics engineering required, and vendors report that customers adopting these tools do so specifically because generic ticket-based support failed to surface friction employees never bothered reporting through a formal ticket in the first place.
CAGR 11.0%
Full segment breakdown across 6 segments available in the complete report.

Regional Architecture and Country Demand Map

North America leads on enterprise scale and hybrid workforce concentration, the Philippines leads on the fastest growth rate through business process outsourcing sector expansion, and East Asia contributes steady growth tied to large-scale corporate device fleet modernization programs across its rapidly expanding regional technology sector and manufacturing base.

North America

US large enterprises account for the single largest concentration of managed workplace services spending anywhere, driven by hybrid workforce arrangements that expanded device support geography dramatically beyond what internal IT teams could reasonably staff and coordinate on their own across every corporate location. Canada follows a similar enterprise-led pattern on a somewhat smaller scale, concentrated heavily in its own financial services and government sectors. The region's lead reflects genuine buyer sophistication and willingness to pay premium pricing for digital employee experience monitoring rather than any unique technological advantage held only by vendors headquartered here in this specific market. Federal government agencies also run large-scale device modernization initiatives adding a separate demand channel.
Share: 32% | CAGR: 8.5% (2026 to 2036)

Western Europe

Germany, France, and the United Kingdom lead regional enterprise adoption, though GDPR-driven employee monitoring restrictions and works council approval requirements have slowed digital employee experience platform deployment compared with less regulated markets elsewhere in the world. The financial services sector across the region has adopted managed device lifecycle services fastest, driven by regulatory pressure for demonstrable device security compliance across every employee endpoint. Growth trails North America meaningfully since enterprise adoption of consolidated managed contracts started later here, with many large organizations only recently completing the shift away from fragmented, per-function vendor relationships toward a single unified provider. Nordic countries have moved fastest within the region on consolidated single-vendor contract adoption specifically.
Share: 21% | CAGR: 7.0% (2026 to 2036)
Regional intelligence for 5 additional markets available in the complete report: East Asia, South Asia and Pacific, Latin America, Middle East and Africa, Eastern Europe. Contact sales@marketmindsadvisory.com.
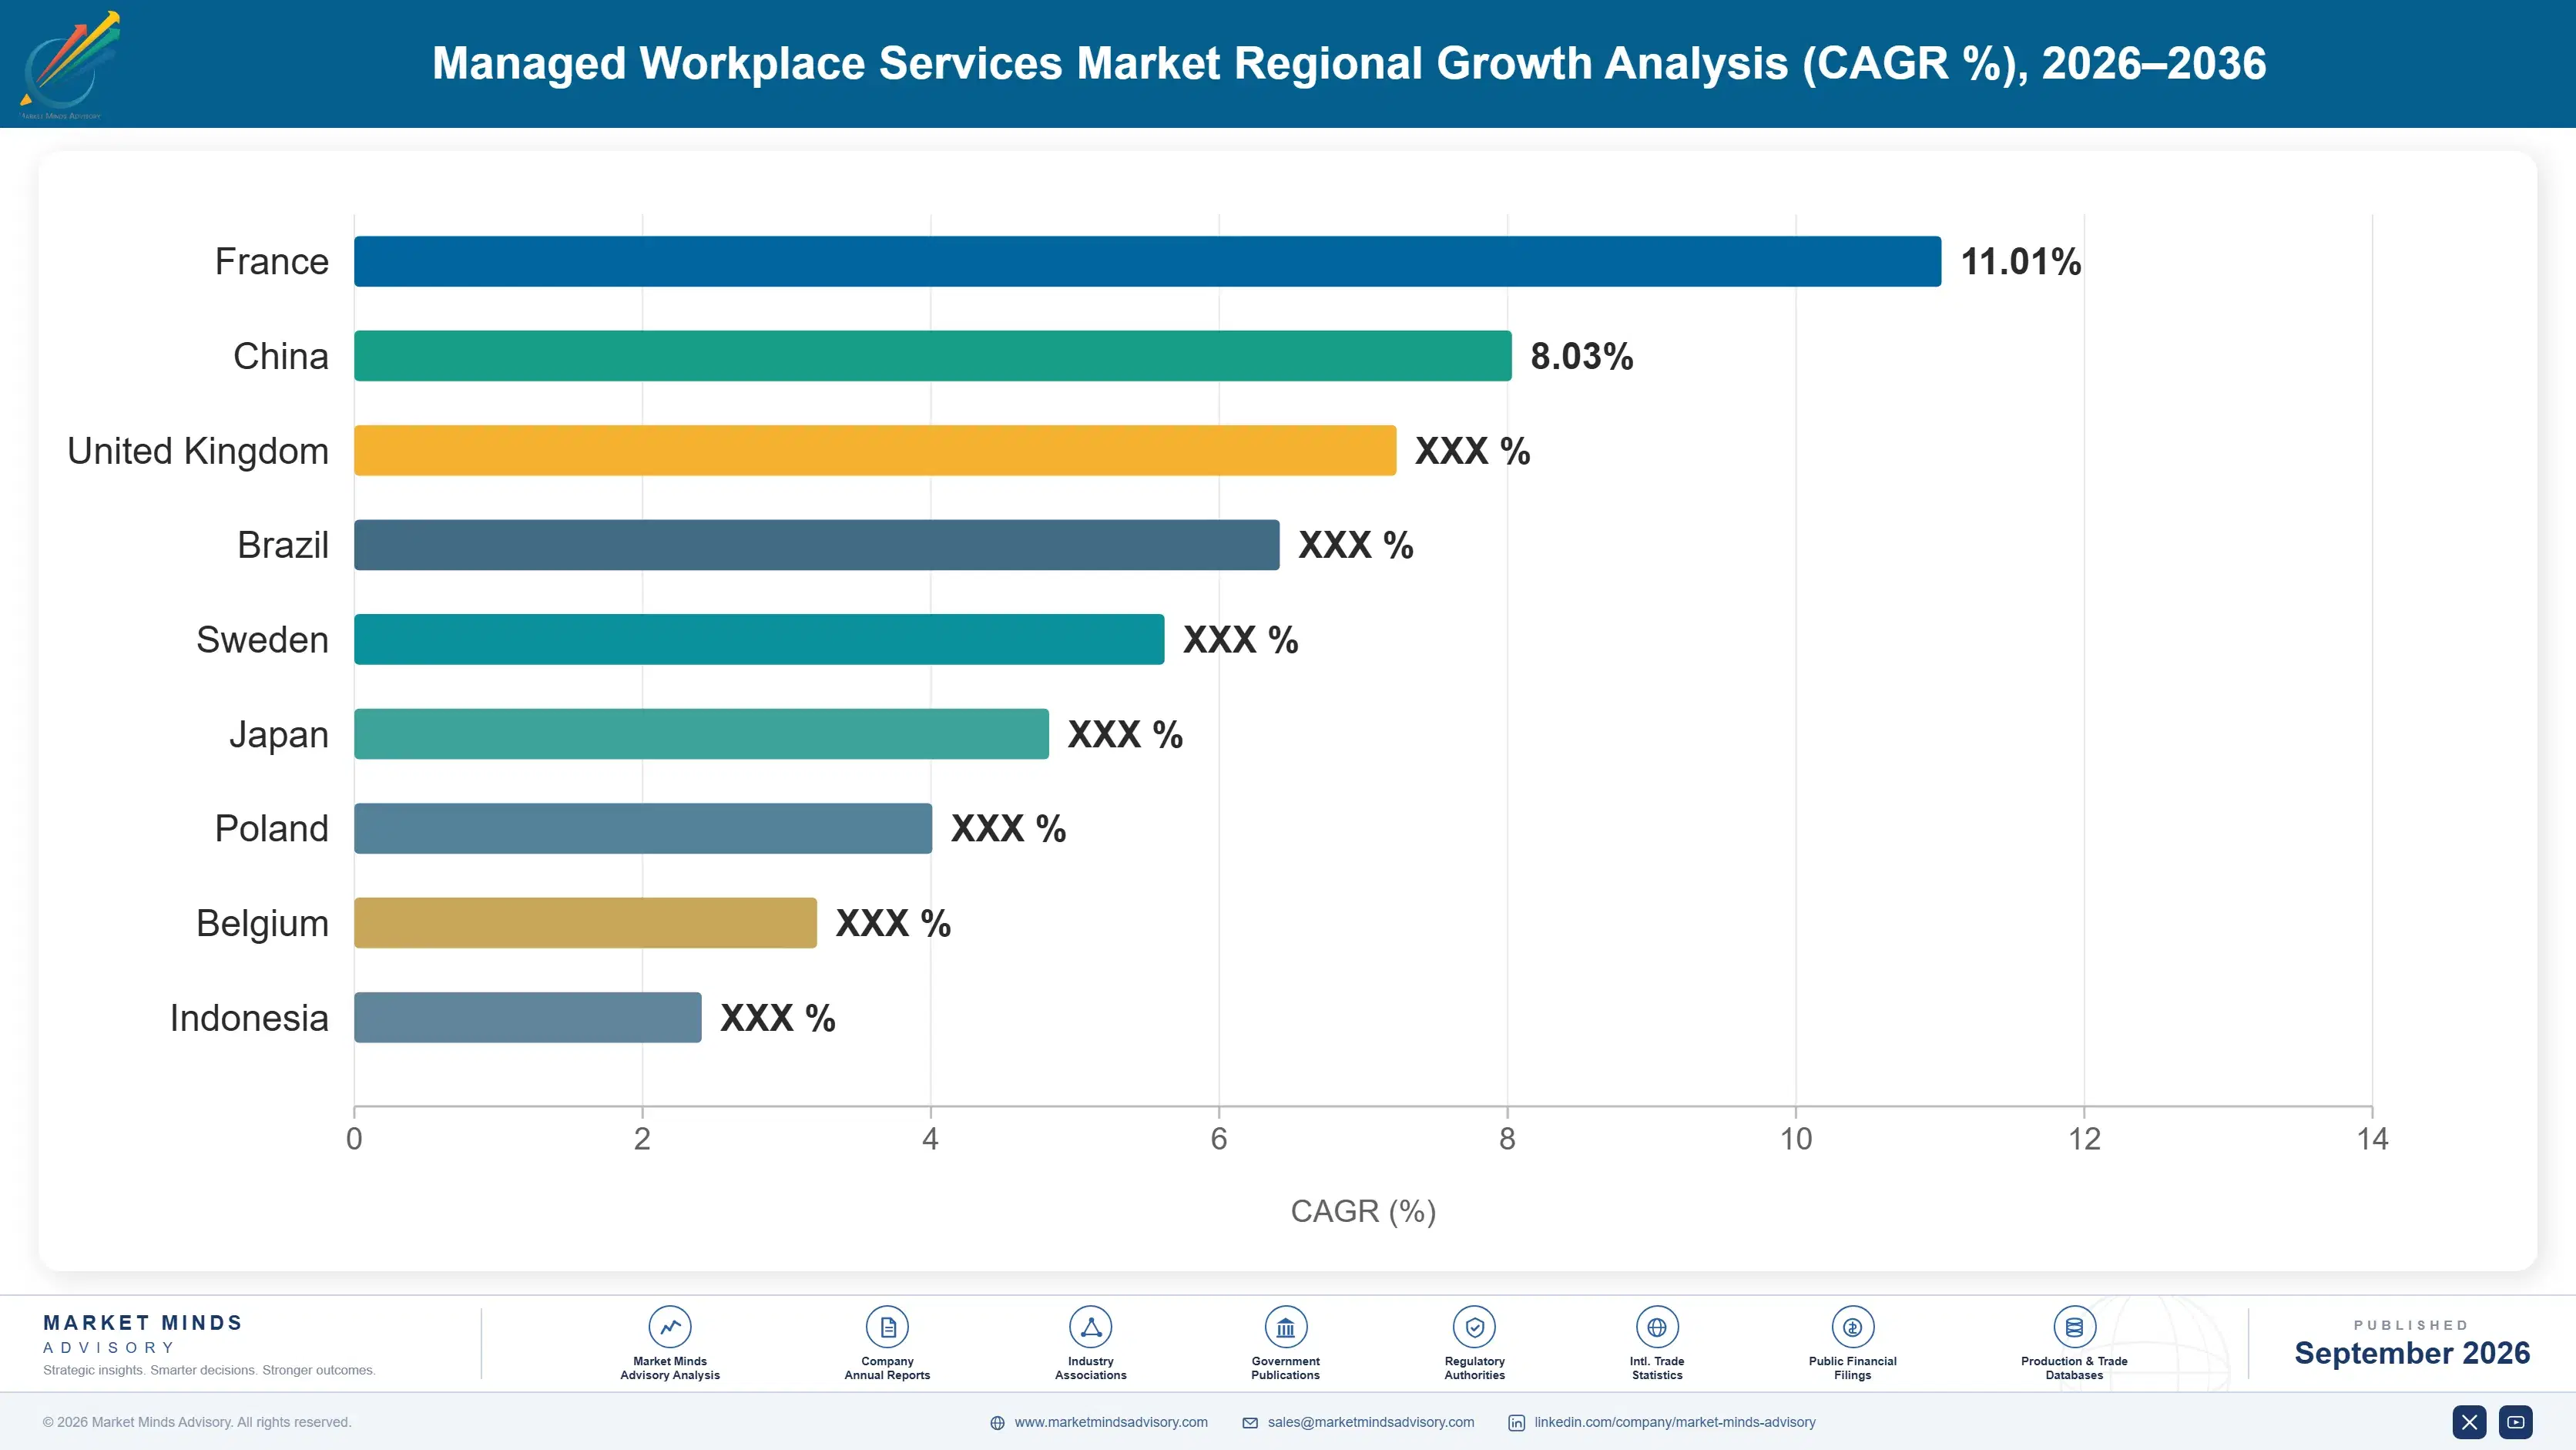
managed-workplace-cervices-market-country-cagr-analysis-1789995765538

How Providers Actually Capture Margin Here

Base device support and ticket resolution has commoditized across leading providers, so the strongest performers capture additional margin through digital employee experience add-ons, workplace cybersecurity bundling, device-as-a-service consumption pricing, and custom integration fees layered on top of the core support contract rather than through the base per-seat fee alone across every deployed customer account and renewal cycle.

Bundle Workplace Cybersecurity Into the Base Device Contract

Providers that bundle workplace cybersecurity monitoring directly into the base device support contract capture 20 to 30 percent more revenue per account than those selling security separately, since enterprises increasingly prefer a single vendor accountable for both device health and endpoint security rather than coordinating between two separate providers with overlapping responsibilities and unclear accountability across internal teams and functions. This bundling also raises switching costs meaningfully once security policy configuration becomes deeply embedded in the provider's platform and workflow. Contract renewal conversations increasingly start from this bundled security baseline directly.
Market Impact: Security bundling adds 20 to 30% more revenue

Sell Digital Employee Experience Scoring as a Premium Tier

Digital employee experience scoring, trained on device telemetry and employee feedback data, commands a price premium of roughly 25 to 35 percent above the base support tier, since enterprises increasingly value quantifiable proof that IT friction is not silently eroding productivity across the organization and its many teams and functions company-wide. Providers that built this capability early now report considerably longer average contract lengths than competitors offering only traditional ticket-based support metrics and reporting. Renewal rates in these accounts run noticeably higher as a direct result of this deeper engagement.
Market Impact: Experience scoring commands 25 to 35% price premium

Charge Consumption Fees for Device-as-a-Service Refresh Cycles

Providers increasingly charge a consumption-based fee tied to device refresh frequency rather than a flat annual hardware allowance, capturing 15 to 20 percent more revenue from enterprises that refresh devices more frequently than the industry-standard three-year cycle across their entire deployed device fleet nationwide. This pricing structure also lowers the barrier to initial adoption, letting enterprises start with a smaller device population and expand spend organically as the program proves its value internally over successive budget cycles. Larger enterprise fleets routinely pay well above this stated baseline figure each contract cycle.
Market Impact: Refresh-cycle fees add 15 to 20% more revenue

Charge Setup Fees for Custom Integration With Enterprise Systems

Providers that build deep, custom integration into a customer's existing identity management and asset tracking systems now charge a one-time setup fee often exceeding 12 percent of first-year contract value, capturing revenue for the specialized engineering work involved in every customized deployment across the entire customer account and relationship. This fee structure also raises switching costs meaningfully once a customer has invested in a tailored integration that a competing vendor would need to rebuild entirely from scratch. Larger custom deployments routinely exceed this stated baseline threshold considerably each contract year.
Market Impact: Setup fees run above 12% of contract value

Who Controls the Margin Pool

CR5 sits at 28 percent, evaluated on annual managed workplace services revenue across each vendor's full contract portfolio, reflecting a market meaningfully more fragmented than most adjacent enterprise IT services categories tracked. HP Inc. holds the clearest lead given its combined hardware and device management heritage, though the gap to Dell Technologies has narrowed noticeably as bundled device-as-a-service offerings gain traction among large enterprise buyers.
Competitive activity today centers on how deeply a provider bundles cybersecurity, employee experience monitoring, and device lifecycle management into one contract rather than on hardware brand alone, which has largely converged in commodity performance terms. HP Inc., Dell Technologies, and Lenovo have all launched dedicated AI-driven predictive maintenance platforms over the past year, while regional IT services firms focus on localized, white-glove support relationships larger vendors deprioritize.

Emerging pressure comes from IT outsourcing giants expanding from pure application development and infrastructure management into workplace services, using their existing global delivery centers to undercut hardware-vendor pricing on labor-intensive support functions. Rankings are most likely to shift in digital employee experience monitoring, where analytics-driven specialist vendors hold no guaranteed advantage over well-capitalized hardware incumbents entering the category.
managed-workplace-cervices-market-company-positioning-matrix-1789995766067

Competitive Moat and Risk Dimensions

HP INC.

Moat: Combined Hardware and Services Heritage

HP manufactures its own devices and layers managed services directly on top, giving it end-to-end visibility into hardware telemetry that pure services vendors sourcing third-party devices cannot replicate as easily or cheaply. This integration also lets HP bundle device warranty and support into one contract.
HP INC.

Risk: Slower Software Platform Innovation

HP's hardware manufacturing heritage has left its digital employee experience software platform less mature than specialist analytics vendors focused solely on that capability, occasionally costing it deals to competitors offering deeper experience scoring capability at a comparable price point across large enterprise accounts evaluating multiple bids.
DELL TECHNOLOGIES

Moat: Enterprise Relationship Depth and Scale

Dell's deep, longstanding enterprise procurement relationships give it a distribution advantage in large account renewals that smaller specialist competitors struggle to match, since many enterprises already run Dell hardware across their broader infrastructure footprint. This existing relationship lowers the sales cost of cross-selling managed services.
DELL TECHNOLOGIES

Risk: Bundling Complexity for Buyers

Dell's broad product and services portfolio can make it harder for buyers to evaluate managed workplace services pricing in isolation from adjacent hardware and infrastructure offerings bundled into the same proposal, occasionally slowing procurement decisions compared with focused competitors offering simpler, more transparent standalone service contracts.

Players Tracked

Prominent Players

HP Inc.
Dell Technologies
Lenovo
Unisys
NTT DATA

Other Key Players

Atos
Wipro
Infosys
HCLTech
Tech Mahindra
DXC Technology
Capgemini
Fujitsu
Ricoh
Konica Minolta
CDW
Insight Enterprises
SHI International
Kyndryl
Presidio

Recent Developments

FEBRUARY 2026

Lenovo Launches AI-Driven Predictive Device Maintenance Suite

Lenovo launched a predictive device maintenance suite using on-device AI to detect early hardware failure signals across its enterprise fleet management platform, aiming to reduce unplanned downtime before employees ever notice a device performance issue during their normal workday, an important client meeting, or scheduled business travel.
Signal: Confirms predictive maintenance has become a required baseline capability across every major hardware vendor competing today.
OCTOBER 2025

NTT DATA Acquires Regional Workplace Services Provider

NTT DATA acquired a mid-sized regional workplace services provider to expand its device support footprint across additional European markets, adding several thousand newly managed seats and a well-established local technician network to its existing global delivery capability, geographic reach, and native language support coverage nationwide.
Signal: Shows global IT services vendors continuing to acquire regional providers for local support scale and specific depth.
JUNE 2025

Dell Technologies Expands Device-as-a-Service Consumption Pricing

Dell Technologies expanded its device-as-a-service offering to include consumption-based pricing tied to actual device usage patterns rather than a flat per-seat fee, targeting enterprises seeking more granular cost control across large, variable device fleets nationwide, across international borders, and across every individual business unit served.
Signal: Signals consumption-based pricing is spreading beyond software into hardware-centric managed service contracts across the broader industry.

Labor Cost Exposure Behind Every Contract

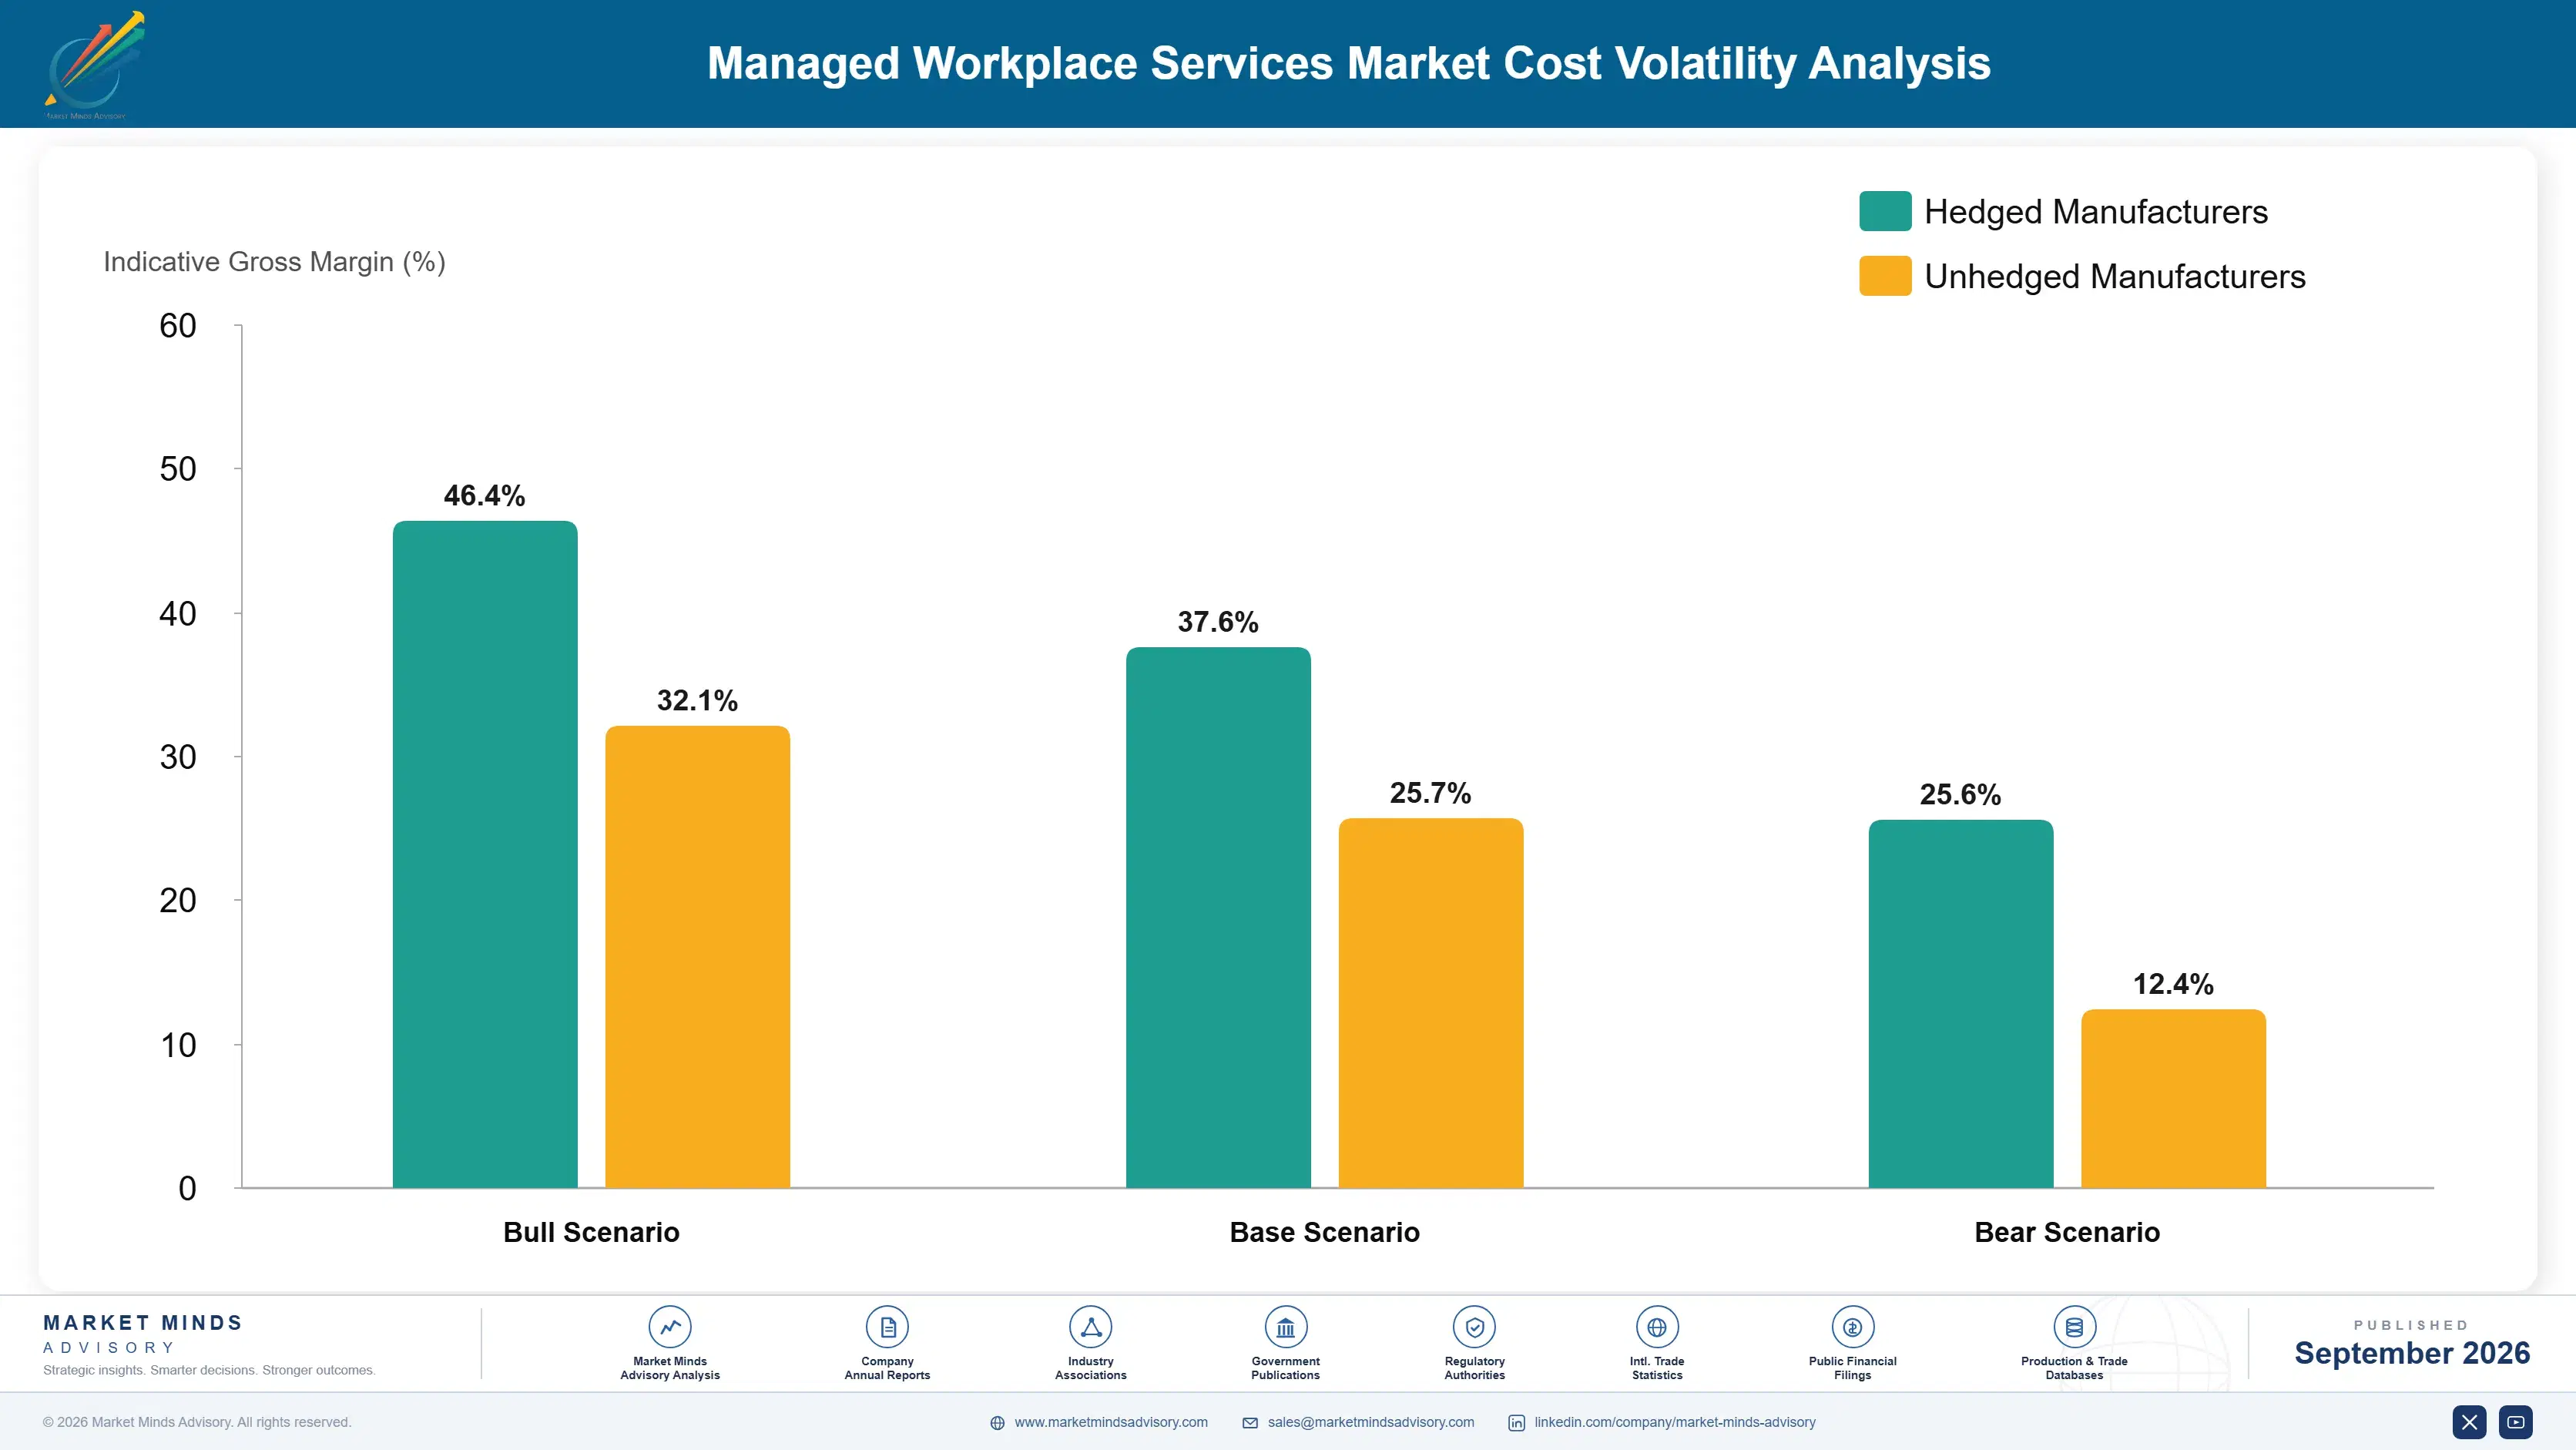
Technician labor accounts for roughly 48 percent of cost of goods sold for a typical managed workplace services provider, with the remainder split across hardware procurement, software licensing, and remote monitoring infrastructure costs paid monthly. Labor demand concentrates in lower-cost delivery centers across India, the Philippines, and Eastern Europe rather than the higher-wage markets where the end customer actually operates day to day.
A 2025 wage inflation surge across major IT outsourcing delivery hubs, documented in provider annual reports reviewed by MMA analysts, pushed technician compensation costs up roughly 14 percent industrywide within a single year as competition for skilled technical talent intensified sharply across the sector worldwide. Providers without long-term staffing contracts and structured wage escalation clauses in place absorbed the increase directly in their own gross margin that year.

Smaller regional providers relying entirely on local labor markets face far more wage volatility than the largest global providers that can shift work across multiple delivery geographies to manage cost dynamically and efficiently. That flexibility gap increasingly determines which providers can sustain competitive, fixed-price contracts during a wage spike without eroding margin to an unsustainable level relative to larger, geographically diversified competitors operating at far greater scale.
managed-workplace-cervices-market-cost-volatility-analysis-1789995766264

Diversify Delivery Centers Across Multiple Wage Geographies

Larger providers maintain delivery centers across several different countries with distinctly different wage trajectories, letting them shift support volume toward lower-cost geographies whenever wage inflation strikes any single market, shielding overall margin from the swings smaller, single-location providers face during periods of unusually high compensation pressure each and every fiscal year and entire budget cycle.

Automate Tier-One Support to Reduce Labor Dependence

Several providers have deployed AI-driven tier-one ticket resolution to handle routine password reset and connectivity issues without any human technician involvement at all, cutting overall labor cost per ticket by roughly 30 percent while freeing remaining technician capacity for the more complex issues that genuinely require human judgment, specialized expertise, and years of accumulated training.

Negotiate Multi-Year Wage Escalation Clauses Upfront

Providers increasingly negotiate multi-year contracts with pre-agreed wage escalation clauses tied to published national inflation indices, protecting overall margin from unpredictable compensation spikes while giving enterprise customers budget certainty over the entire contract term rather than exposure to unpredictable annual repricing negotiations each and every single contract renewal cycle going forward from year to year.

Portfolio Architecture for Margin Defence

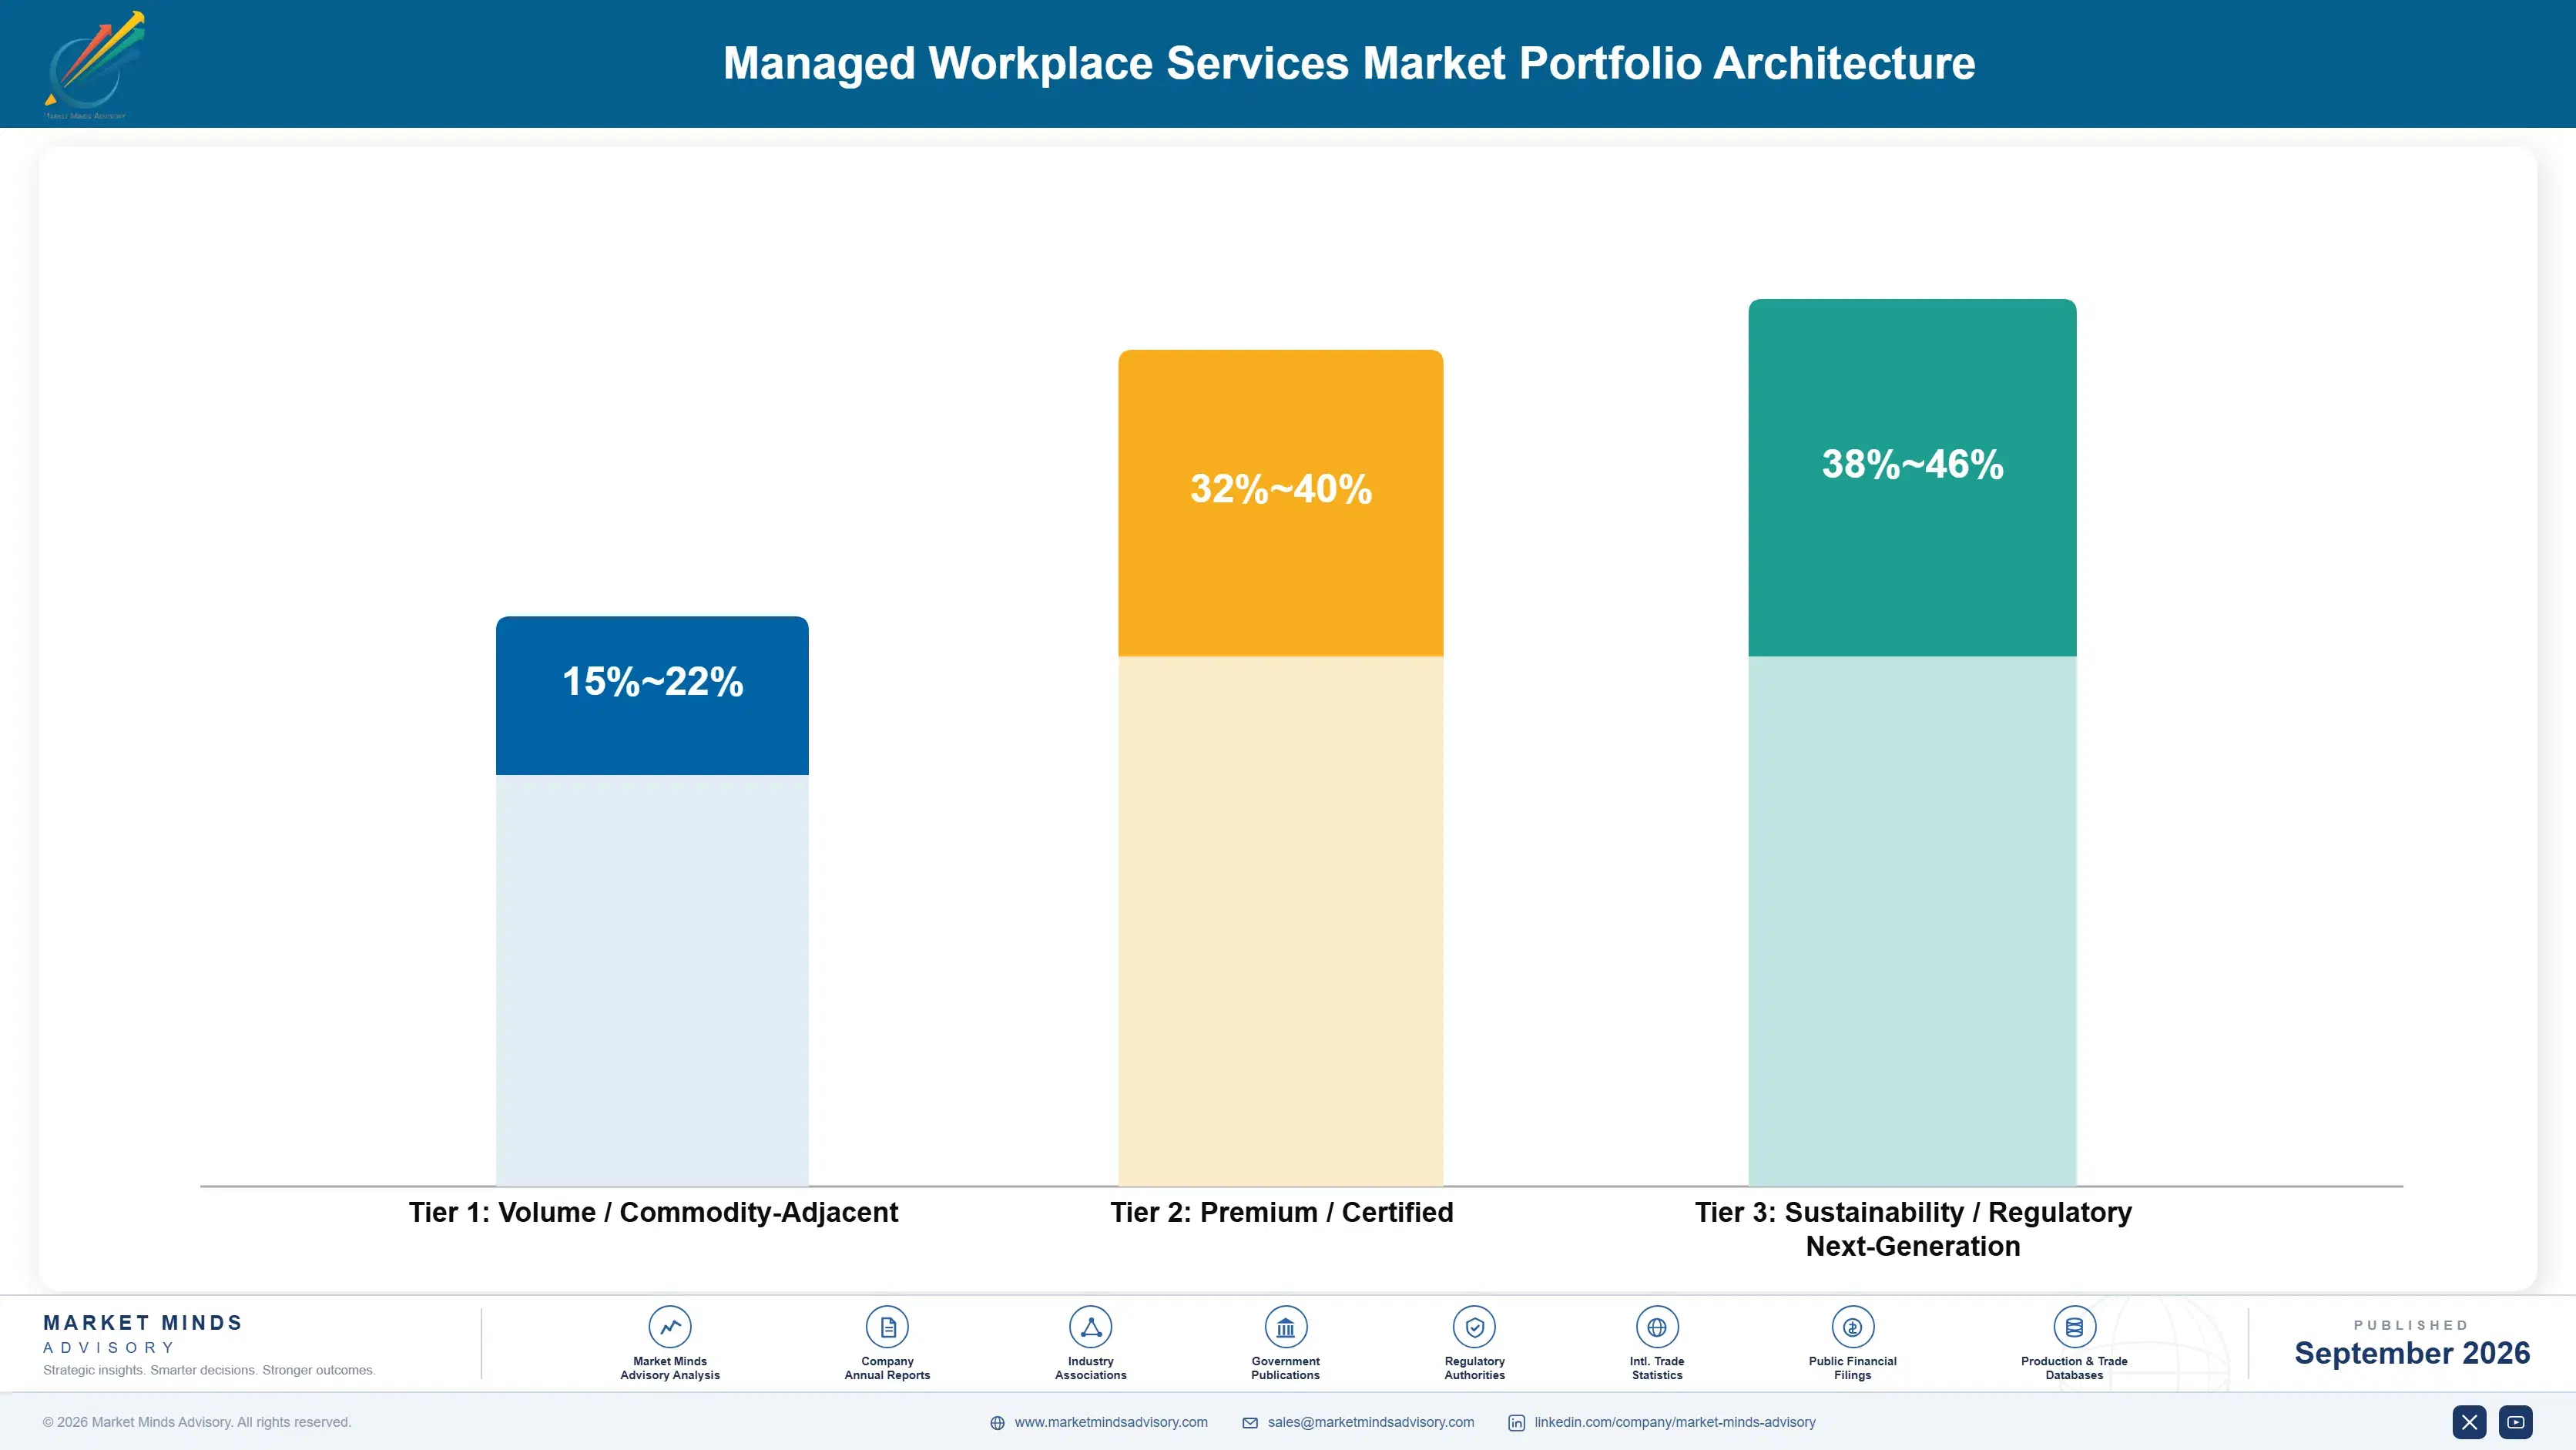
Gross margin in managed workplace services spreads widely depending on how much of the contract sits in commodity device support versus premium digital employee experience and cybersecurity bundling layered on top. A basic per-incident support contract clears margin well below what a fully bundled, consumption-priced device-as-a-service contract commands, since the latter embeds specialized analytics and predictive maintenance capability that buyers pay a real, sustained premium to access reliably.
Volume and premium tiers pull providers toward genuinely different customer bases and delivery models. Volume players compete on low-cost, offshore-delivered basic helpdesk support sold broadly across small and mid-sized organizations, while premium players concentrate on large enterprises willing to pay substantially more for digital employee experience monitoring and proactive device management built in. Few providers execute both strategies at once, since delivery infrastructure and staffing models diverge sharply between the two approaches.

High-value margin pools concentrate specifically in digital employee experience scoring, workplace cybersecurity bundling, and long-term device-as-a-service contracts rather than in basic ticket resolution, which increasingly functions as a low-margin, high-volume entry point that funds delivery infrastructure supporting the much higher-margin experience and security business built on the same underlying support platform and shared technician workforce.

Volume / Commodity-Adjacent

Basic offshore-delivered helpdesk and per-incident device support sold at low, competitive pricing to smaller organizations, competing mainly on ticket volume, response time, and delivery cost efficiency across every regional market worldwide.
Gross Margin: 15-22%

Premium / Certified

Device-as-a-service contracts bundled with digital employee experience monitoring, proactive maintenance, and dedicated account management sold to large enterprise accounts across multiple industry verticals, geographic regions, and company sizes worldwide today.
Gross Margin: 32-40%

Sustainability / Regulatory / Next-Generation

Workplace cybersecurity compliance modules and IT asset disposition services meeting emerging environmental and data governance standards demanded by regulated financial services and healthcare buyers operating under strict continuous oversight requirements.
Gross Margin: 38-46%
managed-workplace-cervices-market-portfolio-architecture-1789995766765

High-value Sub-segments and Strategic Watch-out

Digital Employee Experience Scoring

The highest-margin pool in the category, growing fastest as enterprises seek quantifiable proof that IT friction is not silently eroding employee productivity across the organization and its many departments, teams, and job functions nationwide. Adoption keeps rising sharply among sophisticated buyers with mature internal analytics functions.
Gross Margin: 36-44%

Workplace Cybersecurity Bundling

High-value, software-driven add-ons commanding strong margin as enterprises increasingly prefer a single vendor accountable for both device health and endpoint security across their entire device fleet, workforce, and full geographic footprint worldwide. Renewal rates in these bundled accounts run consistently higher than the base tier.
Gross Margin: 34-42%

Commodity Helpdesk Support

The largest volume core of the market, mature and increasingly low-margin, facing continued commoditization pressure as AI-driven tier-one automation steadily reduces the human labor content required per support ticket handled each day. Providers increasingly treat this tier as a lead generation channel for premium upsell.
Gross Margin: 14-20%

In-House IT Reshoring

A strategic watch-out segment where some large enterprises bring basic device management back in-house using low-cost automation tools, threatening to compress the addressable market for external providers over time and at meaningful scale. Providers must differentiate sharply through analytics to avoid losing this segment entirely.
Gross Margin: N/A

Why Support Contracts Become Sticky Fast

A managed workplace services contract behaves more like an annuity than a one-time procurement decision once device inventory, employee identity systems, and support workflows become deeply embedded in a provider's platform. Migrating to a new provider means re-inventorying every device, retraining every technician on new tools, and rebuilding every integration point with internal identity and asset management systems, a cost most enterprises would rather avoid entirely.
Stickiness varies sharply by contract scope and depth of integration achieved during initial onboarding. Enterprises that bundle device lifecycle, cybersecurity, and experience monitoring into a single provider relationship show the deepest lock-in, since unwinding one function without disrupting the others proves genuinely difficult in practice. Enterprises buying only basic helpdesk support show comparatively shallow stickiness, since that narrower function is easier to migrate to a competing provider.

Buyer profiles are shifting generationally as chief information officers increasingly delegate workplace technology decisions to dedicated digital employee experience leaders rather than treating device support as a purely operational, cost-minimization function handled by procurement alone. This generational shift favors providers offering strong analytics and measurable experience outcomes over providers competing primarily on unit price and raw ticket closure speed metrics.
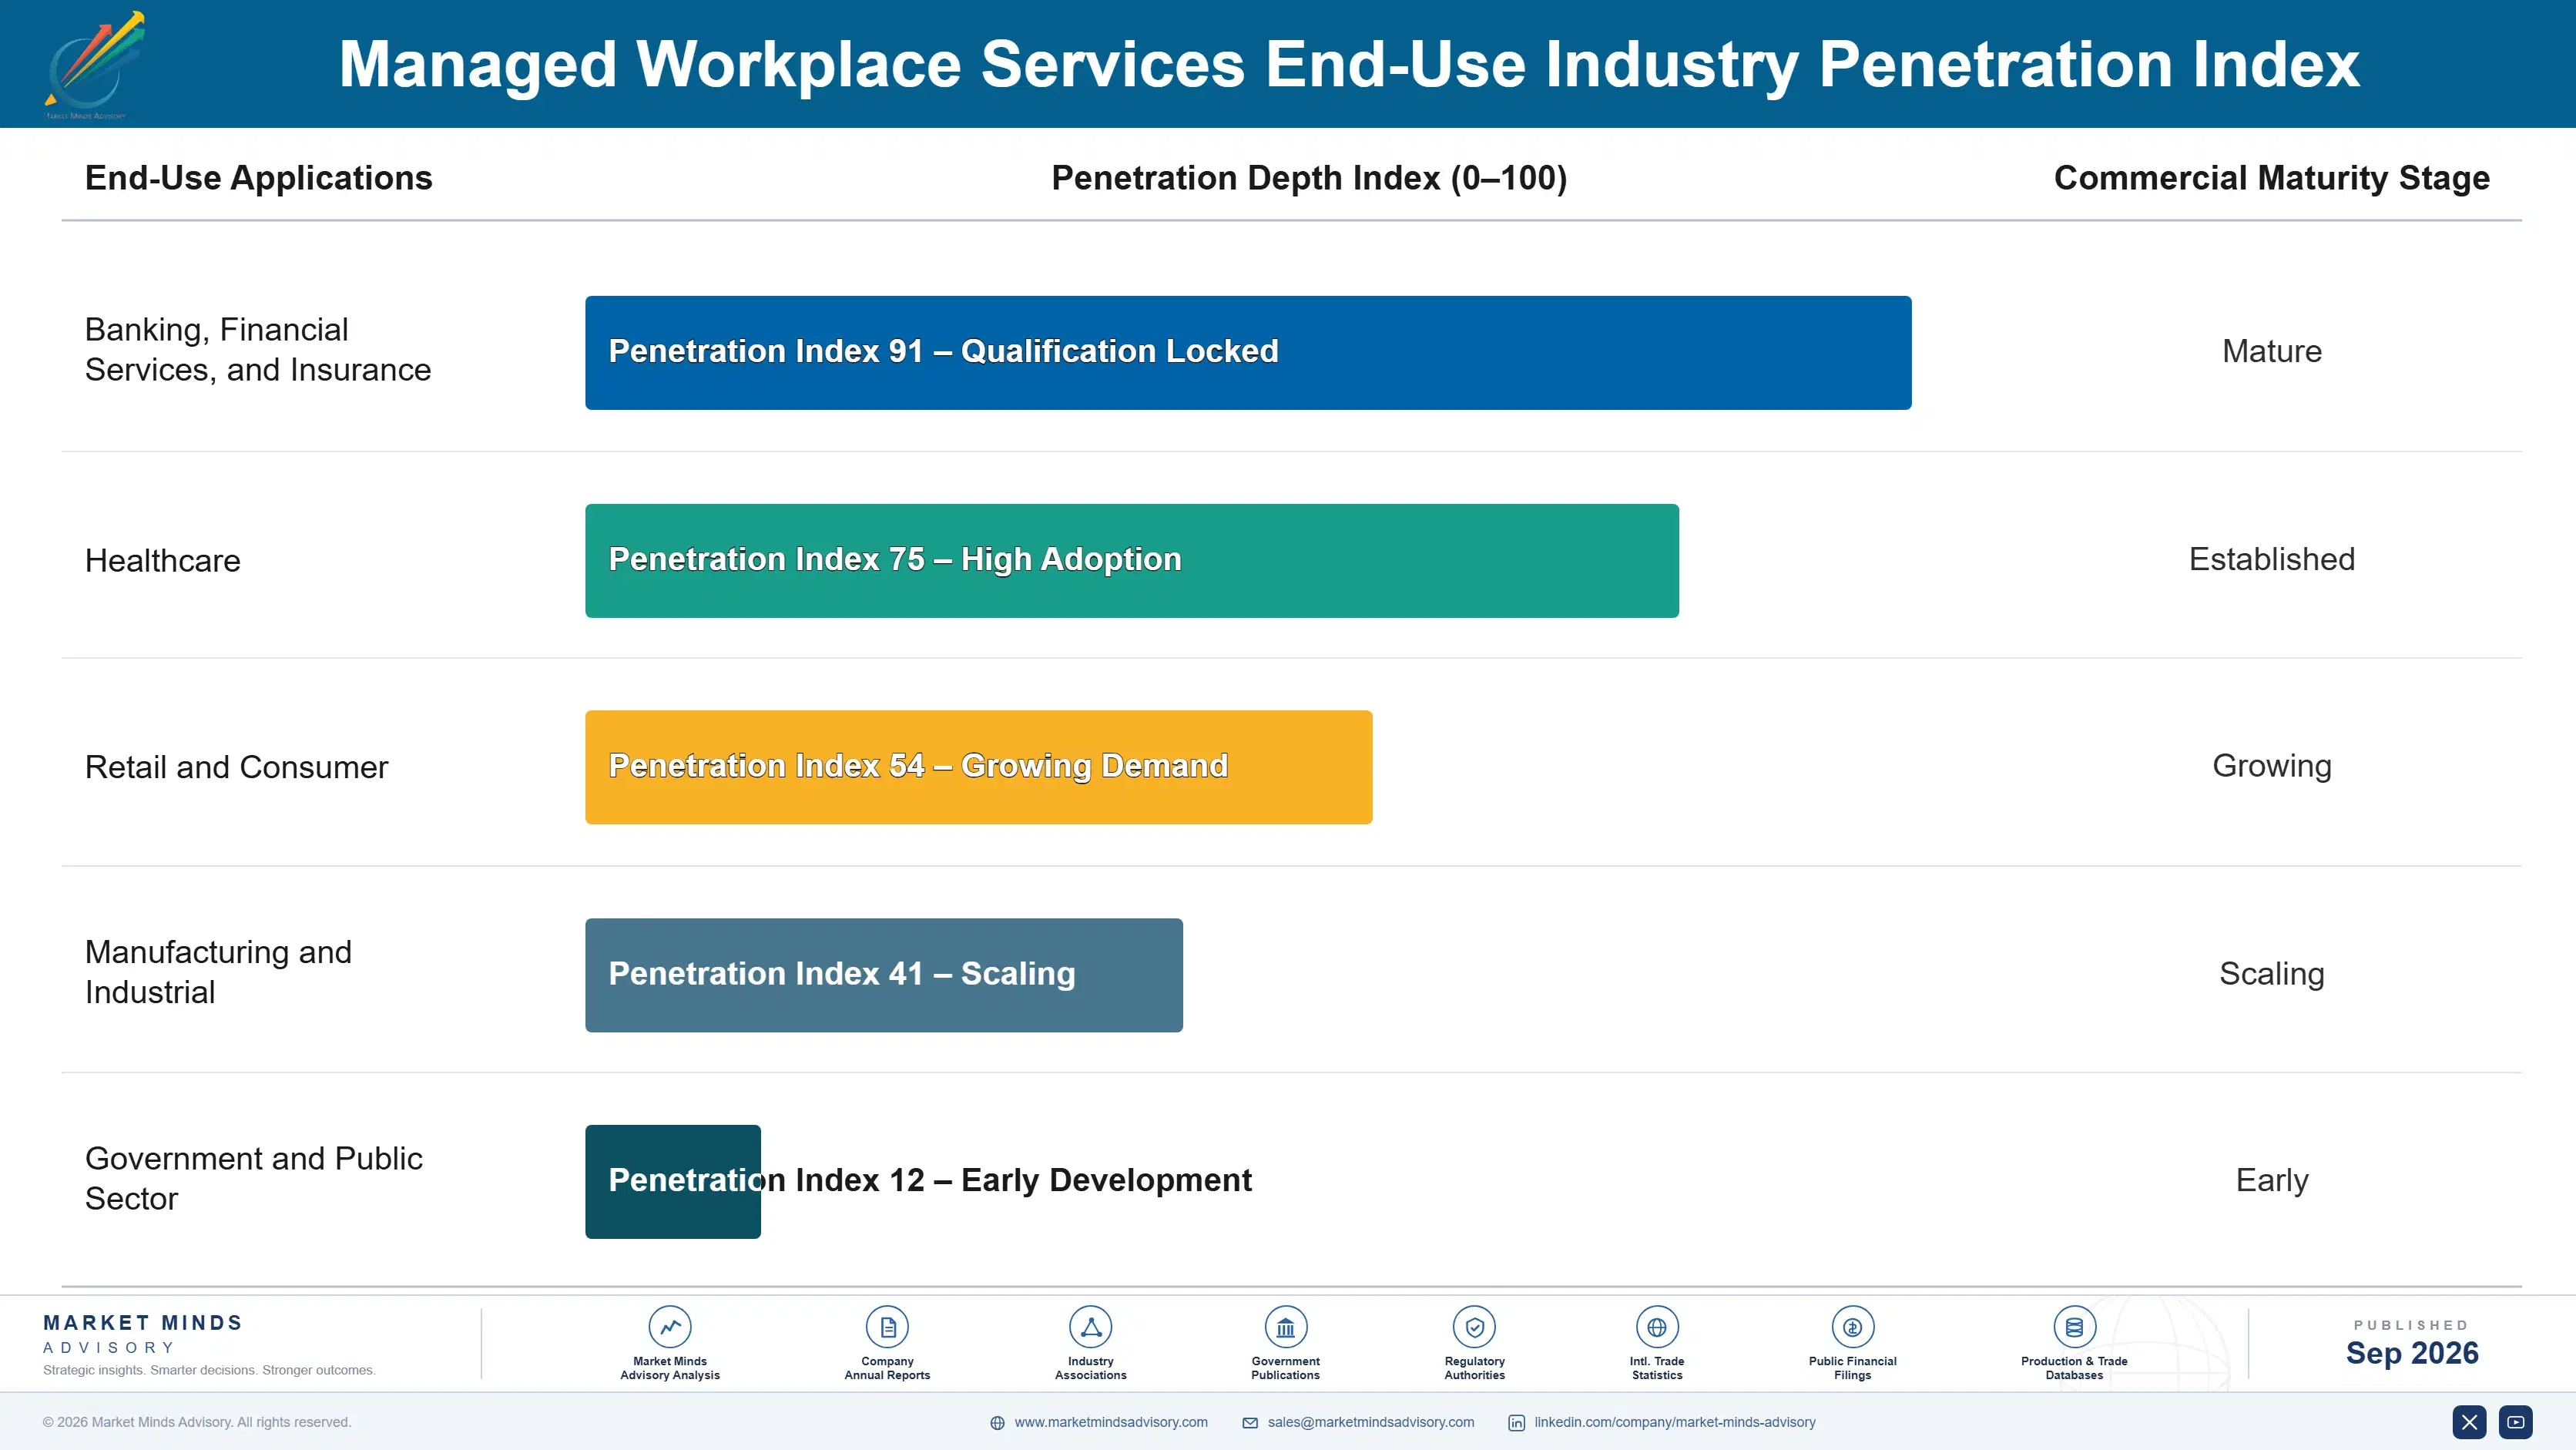
managed-workplace-cervices-market-end-use-penetration-index-1789995767256

Where to Compete in Workplace Services

These are among the four positions where our research anticipates prominent divergence between winners and laggards over the coming forecast period. Each is grounded in the demand model, the regulatory perimeter, and the announced capacity pipeline.
01 / EXPERIENCE ANALYTICS INVESTMENT

Build measurable experience scoring before it becomes table stakes

Digital employee experience scoring already commands a substantial price premium over basic ticket-based support, yet many providers still lack a genuinely credible measurement platform of their own to compete on this specific basis today. A challenger investing early in real experience analytics engineering can win large enterprise accounts on demonstrated capability before this becomes a baseline requirement every competitor offers as standard practice. That differentiation window narrows measurably each year as analytics platforms mature and spread more broadly across the entire industry.
02 / BUNDLED CONTRACT CONSOLIDATION

Expand bundling breadth to win consolidation-minded enterprise buyers

Enterprises increasingly prefer a single provider covering device lifecycle, cybersecurity, and experience monitoring rather than managing several specialist point vendors separately across the organization and its many teams, departments, and business units. A provider that expands bundling breadth, whether through acquisition or internal capability build, can win consolidation-minded buyers away from narrower specialist competitors selling only one function of the broader stack. Providers that stay narrow indefinitely risk losing renewal negotiations entirely to broader, more capable rivals over time and across many accounts.
03 / AI AUTOMATION EXPANSION

Deploy AI ticket resolution to protect margin against wage inflation

Rising technician wages across major delivery hubs are compressing margin for providers still relying heavily on human tier-one support for routine, repetitive issues that AI agents now resolve reliably and consistently at meaningful scale across most customer accounts. Providers that invest in AI-driven automation now protect their own margin against the next wage inflation cycle far better than competitors relying on human labor alone for these routine tasks. This automation investment increasingly separates resilient providers from margin-squeezed, exposed ones over time.
04 / DELIVERY GEOGRAPHY DIVERSIFICATION

Diversify delivery centers before the next regional wage spike hits

The 2025 wage inflation surge demonstrated clearly how exposed single-geography providers are to a sudden compensation spike in their primary delivery hub location and local workforce pool. Providers that diversify delivery centers across multiple wage geographies now protect their own margin against the next inevitable wage shock far better than competitors concentrated in just one single region alone without any real alternatives available. This diversification decision increasingly separates resilient, well-prepared providers from fragile, exposed ones facing real ongoing operational risk.

Engagement Snapshot From the Field

A live engagement with an industry participant carrying material or product regulatory and market exposure ahead of a defining policy shift, showing how our research translates into a defensible multi-year portfolio strategy.
MARKET MINDS ADVISORY · CLIENT ENGAGEMENT SUMMARY
Managed Workplace Services Producer Strategic Portfolio Review and Transition Roadmap 2026·Investment Scenario on Managed Workplace Services Exposure Evaluation 2025-26
CLIENT PROFILE
The client operates a regional healthcare system with fourteen hospital facilities and roughly 6,500 employees across clinical and administrative roles, reporting client-reported annual operating revenue of approximately $2.1 billion (client-reported, unverified by MMA). Facing device support delivered through six separate vendor contracts with inconsistent service levels, leadership sought an independent evaluation of consolidating onto a single managed workplace services provider.
STRATEGIC CHALLENGE
The client's fragmented vendor landscape created inconsistent device support quality across facilities, duplicated administrative overhead managing six separate contracts and billing relationships across departments and cost centers, and left leadership with no unified visibility into device health or employee experience across the entire hospital network's technology footprint and workforce nationwide.
MMA APPROACH
MMA analysts mapped the client's existing device and support spend across all six vendor contracts, built a total cost of ownership model comparing consolidation against the status quo, and evaluated three candidate consolidated providers against healthcare-specific compliance and clinical workflow uptime requirements over a full eight-week assessment period involving site visits.
KEY FINDINGS
  1. The client was paying roughly 22 percent more in combined vendor fees than a single consolidated contract would cost, once duplicated administrative overhead was accounted for properly.
  2. Device support response times varied by more than 3 times across the six existing vendors, with the slowest vendor consistently serving the system's largest hospital facility.
  3. None of the six existing vendors offered healthcare-specific compliance reporting the system needed for its upcoming accreditation review, requiring manual reporting workarounds each quarter.
  4. The selected consolidated vendor's proposed pricing, once fully modeled, would save the system roughly $1.4 million annually (client-reported, unverified by MMA) compared with current spend.
CLIENT PROFILE
The client operates a regional healthcare system with fourteen hospital facilities and roughly 6,500 employees across clinical and administrative roles, reporting client-reported annual operating revenue of approximately $2.1 billion (client-reported, unverified by MMA). Facing device support delivered through six separate vendor contracts with inconsistent service levels, leadership sought an independent evaluation of consolidating onto a single managed workplace services provider.
STRATEGIC CHALLENGE
The client's fragmented vendor landscape created inconsistent device support quality across facilities, duplicated administrative overhead managing six separate contracts and billing relationships across departments and cost centers, and left leadership with no unified visibility into device health or employee experience across the entire hospital network's technology footprint and workforce nationwide.
MMA APPROACH
MMA analysts mapped the client's existing device and support spend across all six vendor contracts, built a total cost of ownership model comparing consolidation against the status quo, and evaluated three candidate consolidated providers against healthcare-specific compliance and clinical workflow uptime requirements over a full eight-week assessment period involving site visits.
KEY FINDINGS
  1. The client was paying roughly 22 percent more in combined vendor fees than a single consolidated contract would cost, once duplicated administrative overhead was accounted for properly.
  2. Device support response times varied by more than 3 times across the six existing vendors, with the slowest vendor consistently serving the system's largest hospital facility.
  3. None of the six existing vendors offered healthcare-specific compliance reporting the system needed for its upcoming accreditation review, requiring manual reporting workarounds each quarter.
  4. The selected consolidated vendor's proposed pricing, once fully modeled, would save the system roughly $1.4 million annually (client-reported, unverified by MMA) compared with current spend.
RECOMMENDED STRATEGY
Phase 1: Phase 1 (Months 1 to 3): Migrate the two lowest-performing vendor contracts to the selected provider first, closing the most acute service gaps immediately. Phase 2: Phase 2 (Months 4 to 8): Complete migration of remaining vendor contracts and implement unified healthcare-specific compliance reporting across all facilities. Phase 3: Phase 3 (Months 9 to 12): Deploy digital employee experience monitoring system-wide and formally renegotiate pricing based on actual consolidated volume.
OUTCOME
The system completed full vendor consolidation two months ahead of schedule and passed its accreditation review with the new unified compliance reporting cited favorably by reviewers. Device support response times became consistent across all facilities, and annual IT support spend dropped by approximately 19 percent (client-reported, unverified by MMA) from the prior fragmented arrangement.

Frequently Asked Questions

Foundational context covering the market sizes, CAGR, scope, country, region and competition that inform every finding below. This section is provided to cover basics and most often pre-purchase conversations, answered from the MMA Primary Research Dataset.

What is the current size of the Managed Workplace Services Market?

The Managed Workplace Services Market reached $18.5 billion in base-year value in 2025, spanning device lifecycle, helpdesk automation, unified communications, and workplace cybersecurity services worldwide.

How large will the Managed Workplace Services Market be by 2036?

The market is projected to reach $45.38 billion by 2036, expanding roughly 2.26 times its 2026 value as enterprises consolidate fragmented IT support contracts into unified provider relationships.

What is the CAGR for the Managed Workplace Services Market 2026 to 2036?

The market is forecast to grow at a compound annual growth rate of 8.5 percent between 2026 and 2036, driven by device lifecycle consolidation and hybrid workforce expansion.

Which segment is growing fastest?

Managed device lifecycle and endpoint management leads all segments at a 12.5 percent CAGR, roughly 1.47 times the overall market rate, as enterprises consolidate hardware contracts.

Who are the major companies in the Managed Workplace Services Market?

HP Inc., Dell Technologies, Lenovo, Unisys, and NTT DATA lead the competitive field, evaluated on annual managed workplace services contract revenue across their full portfolios.

Which country is growing fastest?

The Philippines leads all countries tracked at a 12.0 percent CAGR, fueled by its position as a major business process outsourcing hub for managed device support.

Report Segmentation Architecture

The full report scope spans multiple orthogonal segmentation dimensions, with cross-tabulated demand data provided for each dimension pair. Coverage extends further to regional breakdowns, trend trajectories, and the competitive detail needed to support segment-level decision-making.

By Primary Market Dimension

  • Managed Device Lifecycle and Endpoint Management
  • Digital Employee Experience and Helpdesk Automation
  • Managed Print and Imaging Services
  • Unified Communications and Collaboration Management
  • Workplace Cybersecurity Management Services
  • IT Asset Disposition and Sustainability Services

By End-Use Industry

  • Banking, Financial Services, and Insurance
  • Healthcare
  • Retail and Consumer
  • Manufacturing and Industrial
  • Government and Public Sector

By Commercial Dimension

  • Per-Seat Consumption Subscription
  • Device-as-a-Service Bundled Contract
  • Per-Incident Transactional Billing
  • Systems Integrator Channel Sale

By Region

  • North America
  • Western Europe
  • East Asia
  • South Asia and Pacific
  • Latin America
  • Middle East and Africa
  • Eastern Europe

Scope, Methodology, and Coverage

Every figure in this report is reproducible from documented input assumptions. The scope below maps the historical period, the forecast horizon, the segmentation dimensions, and the countries covered, alongside the underlying primary and qualitative methodology.
Historical Period
2020 to 2025
Forecast Period
2026 to 2036
Base Year
2025 (USD billions; MMA Primary Research Dataset, September 2026)
Market Definition
The Managed Workplace Services Market covers outsourced IT services that manage employee-facing technology, including device lifecycle management, helpdesk support, unified communications, and workplace cybersecurity, delivered under a consumption-based or per-seat contract. It excludes core data center infrastructure management, enterprise application development, and networking equipment sales unrelated to end-user device support.
Quantitative Units
USD billions (current prices); managed seat and device volume where applicable
Segmentation Dimensions
By Primary Market Dimension; By End-Use Industry; By Commercial Dimension; By Region
Regions Covered
North America, Western Europe, East Asia, South Asia and Pacific, Latin America, Middle East and Africa, Eastern Europe
Countries Covered
USA, China, Germany, France, UK, Japan, South Korea, India, Australia, Canada, Brazil, Mexico, Indonesia, Vietnam, Thailand, Malaysia, UAE, Saudi Arabia, South Africa, Nigeria, Turkey, Poland, Netherlands, Italy, Spain, Sweden, Switzerland, Argentina, Colombia, Philippines, and additional markets relevant to this sector
Key Companies Profiled
HP Inc., Dell Technologies, Lenovo, Unisys, NTT DATA, Atos, Wipro, Infosys, HCLTech, Tech Mahindra, DXC Technology, Capgemini, Fujitsu, Ricoh, Konica Minolta, CDW, Insight Enterprises, SHI International, Kyndryl, Presidio
Quantitative Methodology
Primary survey, n=3,800 respondents, Q4 2025, six countries; demand-side model with trade association cross-validation
Qualitative Methodology
47 expert interviews, Q4 2025; applied to validate demand model assumptions, identify emerging dynamics, and assess competitive positioning
Report Format
PDF and XLSX data workbook (Word format preview document)
Publisher
Market Minds Advisory
Report Code
MMA-2026-TEC-211
Published
September 2026
Contact
sales@marketmindsadvisory.com | www.marketmindsadvisory.com

Purchase the full Managed Workplace Services Market Report (2026 to 2036).

This report delivers a comprehensive assessment of the Managed Workplace Services Market from 2026 through 2036, covering sizing, segmentation, and regional demand patterns across all seven world regions tracked. It profiles twenty companies competing on device lifecycle depth, digital employee experience capability, and delivery geography diversification rather than device brand alone. Readers get detailed analysis of revenue levers, input cost exposure, and portfolio margin economics specific to this services category and its buyers. The report closes with a strategic verdict identifying exactly where new capital should concentrate over the coming decade.
Full seven-region market sizing and forecast data
Twenty-company competitive profiling and moat analysis
Segment-level CAGR and market share breakdown
Labor cost exposure and mitigation pathway analysis
Revenue lever and portfolio margin economics detail
Anonymized client case study with recommended strategy

Built For The People Who Decide

From boardroom strategy to bench-side execution, this report is read cover-to-cover by leaders shaping the next decade of their industry, turning demand scenarios, market dynamics and valuation benchmarks into decisions.
CXOs/ Presidents/ VPs/ Managers
M&A and Corporate Development
Strategy Teams and R&D Heads
Procurement and Product Directors
Regulatory and Compliance Leaders
Investor Relations and Equity Analysts