Market Minds Advisory
Malaysia Plastic Jerry Can Industry

Malaysia Plastic Jerry Can Industry: Palm Oil Export Volume, UN Certification and the Container Behind a Commodity Economy

Malaysia exports palm oil, oleochemicals and speciality chemicals in twenty and twenty-five litre containers, and the certification stamped on the handle decides which of those cargoes a jerry can may legally carry.

Lead Analyst

Bilal Shaikh

Published

September 2026

Make Smarter Decisions with Customized Research Insights

Request a free sample report and evaluate market opportunities, growth trends, and competitive dynamics relevant to your business needs.

2025 MARKET VALUE$0.3BMarket Size 2025
2036 FORECAST VALUE$0.6BBase Case , 2026 to 2036
CAGR 2026 TO 20365.8 %Bull 7.0% / Bear 4.6%
INCREMENTAL OPPORTUNITY$0.2BNet 10- year value creation
EXPANSION MULTIPLE1.76x2036 value over 2026 base
Strategic Levers
M&A Pipeline
Regional Outlook
Country Rankings
Competitive Intelligence
Segmental Deep-dive
Call-Us : 91 93563 13602

Executive Snapshot and Market Trajectory

Malaysia's jerry can industry exists because the country exports liquids. Palm oil, oleochemicals, latex, lubricants and speciality chemicals all leave in twenty and twenty-five litre containers, and what is stamped into the handle decides which of them a can may legally carry. Roughly 72% of production leaves the country full.
UN-certified dangerous goods cans compound at 8.7%, exactly 1.50 times the market, as oleochemical and speciality chemical exports grow faster than commodity palm oil and carry classification requirements that ordinary containers cannot meet. South Asia and Pacific accounts for 46% of destination demand, far above the standard band, since regional export routes dominate. Regional destinations frequently lack the tank farm capacity that would allow bulk discharge at all.
Five moulders hold 41%. Blow moulding a jerry can is straightforward and the barrier is certification: drop testing, stacking and leakproofness approval per design type, held by a competent authority and re-tested periodically rather than granted once. An approval covers a specific wall thickness, resin grade and closure combination, and it lapses after twelve months unless the testing is repeated in full. Administrative discipline matters as much as moulding. Very few moulders sustain that reliably.
Market Definition
The industry covers rigid plastic jerry cans between 3 and 30 litres produced in Malaysia, spanning standard high density polyethylene cans, UN-certified dangerous goods cans, fluorinated and barrier-treated cans, food-grade and edible oil cans, stackable and nestable industrial cans, and recycled content cans. Drums above 30 litres, intermediate bulk containers, bottles below 3 litres, and closures sold separately are excluded.
Base Year Value
$0.3B in 2025 (MMA Primary Research Dataset, August 2026)
Forecast Period
2026 to 2036, eleven discrete annual values
CAGR
5.8% base case. Bull 7.0%. Bear 4.6%.
Fastest Growth Segment
UN-Certified Dangerous Goods Jerry Cans: 8.7% CAGR
Fastest Growth Country
India: 8.2% CAGR
Fastest Growth Region
South Asia and Pacific: 7.8% CAGR
Largest Region
South Asia and Pacific: 46% of 2025 global value
Market Leaders
Greif, Mauser Packaging Solutions, Scientex, Daibochi, Tomypak. Source: MMA Analysis based on company annual reports.
Primary Survey
n=3,800 procurement and R&D decision-makers, Q4 2025, six countries
Methodology
Demand-side build-up, cross-validated against public data, 47 expert interviews

Malaysia Plastic Jerry Can Industry Market Forecast Scenarios

malaysia-plastic-jerry-can-industry-size-forecast-scenario-1787308556880
Growth ran at an implied 4.8% across 2020 to 2025 and it tracked export tonnage rather than domestic consumption. Palm oil prices swung violently across the period without changing the number of containers shipped much at all, while oleochemical and speciality chemical export volumes rose steadily and brought classification requirements that ordinary cans could not satisfy. Export mix moved while tonnage barely did.
The base case at 5.8% rests on three mechanisms. Malaysian downstream chemical processing continues moving from crude palm oil toward oleochemicals and speciality derivatives, which carry dangerous goods classification more often. Regional export destinations across Southeast Asia and South Asia keep growing. And fluorination and barrier treatment demand rises as solvent-containing products displace simple oil shipments. None of the three depends on palm oil pricing. Export mix rather than total volume drives all three.
The bull case at 7.0% assumes downstream chemical investment under national industrial policy accelerates, since every step away from crude commodity export raises both the value and the certification requirement of the container. The bear case at 4.6% follows from palm oil demand weakness in key destination markets alongside bulk shipment displacing packed cargo on high-volume routes.

What the Handle Stamp Actually Decides

A jerry can is about as simple as blow moulding gets, and the industry that makes them in Malaysia is anything but simple. Roughly 72% of production leaves the country holding palm oil, oleochemicals, latex, lubricants or speciality chemicals, and the requirements attached to those cargoes have almost nothing to do with the container's shape. Shape is the least of it.
TOP FIVE CONCENTRATION41%Combined share held by the five largest Malaysian producers
EXPORT APPLICATION SHARE72% of volumeCans filled with product leaving the country rather than domestic
CERTIFICATION RETEST INTERVAL12 monthsPeriod before a design type approval requires renewed testing
RESIN COST SHARE61% of COGSPolymer input as proportion of total moulded can cost
FLUORINATION BARRIER GAIN94% permeation cutSolvent loss reduction against untreated high density polyethylene
STACKING LOAD REQUIREMENT3 tiers highContainer stacking depth required in standard export shipping
Certification decides everything commercially. A United Nations approved dangerous goods can carries a design type approval covering drop testing, stacking, leakproofness and hydraulic pressure, granted by a competent authority against a specific wall thickness, resin grade and closure combination. That approval requires renewed testing at twelve month intervals rather than lasting indefinitely, and producers who let one lapse simply cannot ship the cargo. Approvals lapse rather than persist.
Barrier treatment is the second technical layer. Untreated high density polyethylene loses solvent-containing contents by permeation through the wall, and surface fluorination cuts that by around 94%. Malaysian speciality chemical export has grown faster than commodity palm oil, which is precisely the shift that turns a straightforward moulded container into a specified one. Solvent cargo has no untreated alternative.
"Everybody looks at Malaysian jerry cans and sees palm oil. The interesting volume is what the country does downstream of palm oil, because an oleochemical shipment needs paperwork a cooking oil shipment never did, and the moulders who understood that ten years ago are the ones still growing."
Director, Industrial Rigid Packaging and Chemical Logistics Practice · MMA Indus

Market Trends

Downstream Chemical Processing Raises Certification Requirements

Malaysian industrial policy has pushed steadily from crude palm oil export toward oleochemicals, fatty acids, esters and speciality derivatives, and each step downstream raises the probability that a cargo carries dangerous goods classification. A container shipping refined cooking oil needs food grade compliance; one shipping a fatty amine or a solvent-containing formulation needs United Nations design type approval with periodic retesting. The certified segment compounds at 8.7% against an industry at 5.8%, and it grows with the country's industrial direction rather than with packaging demand. Industrial policy sets the direction.
Market Impact: Regional routes taking 46% of volum
Fluorination Displaces Untreated Cans for Solvent Contents

Untreated high density polyethylene is permeable to hydrocarbons and solvents, and a can that loses several percent of its contents across an ocean voyage fails both on weight and on the resulting headspace. Surface fluorination reacts the inner wall to form a barrier layer that cuts permeation by roughly 94% without altering the moulding process. Malaysian speciality chemical and agrochemical export has grown fast enough that fluorinated cans are becoming a standard rather than a specialist requirement across a widening set of cargoes. Treatment capability rather than moulding decides who can supply that work.
Market Impact: Stacking required to 3 tiers

Market Opportunities and Growth Drivers

Regional Export Destinations Absorb Growing Packed Cargo Volume

Malaysian liquid exports move heavily into Southeast Asian, South Asian and Middle Eastern destinations where receiving infrastructure favours packed cargo over bulk tanker discharge. Buyers in those markets frequently lack tank farm capacity, so a twenty-five litre can is the practical unit of trade rather than a packaging preference. Roughly 46% of destination demand sits within South Asia and Pacific alone, and that share has grown as regional manufacturing and agricultural processing expanded across Vietnam, Indonesia and Bangladesh. Short shipping distances make packed cargo viable. Bulk discharge is simply unavailable there.
Market Impact: Resin at 61% of can cost

Stacking and Handling Requirements Favour Engineered Designs

Export containers are stacked three tiers high in a shipping container and handled repeatedly through consolidation, customs inspection and destination distribution. A can that deforms under stacking load or whose handle fails during manual handling generates claims well beyond the container's value. Engineered wall distribution, rib geometry and handle design address that without adding weight, and buyers shipping high-value oleochemicals increasingly specify stacking performance rather than accepting whatever a moulder supplies as standard. A failed handle generates a claim well beyond the container's own value. Standard construction is no longer simply accepted.
Market Impact: Bulk taking 8% of routes annually

Market Restraints and Challenges

Resin Cost Dominates and Cannot Be Passed Through Quickly

High density polyethylene accounts for 61% of moulded can cost, purchased regionally with no producer influence over pricing. The root cause is that blow moulding a jerry can is mechanically simple and widely available, so buyers negotiate against a resin index and treat conversion as the only variable. Annual export contracts leave moulders absorbing mid-term movements entirely. Producers mitigate by shifting toward certified and fluorinated work where certification rather than delivered price sets the award. Conversion is the only visible variable. Certification rather than price sets those awards, which is the only escape available.
Market Impact: Certified cans compounding at 8.7%

Bulk Shipment Displaces Packed Cargo on High-Volume Routes

Where a destination has tank farm capacity and volumes justify it, liquid cargo moves in bulk tankers or flexitanks rather than in cans, at a fraction of the packaging cost per tonne. The root cause is straightforward economics rather than any container failure, and it removes the largest and most predictable volumes first. Producers mitigate by concentrating on destinations lacking discharge infrastructure and on cargoes where classification, contamination risk or small order size rules bulk handling out entirely. Small order size rules bulk out entirely. Discharge infrastructure decides it. Nothing else defends the volume.
Market Impact: Fluorination cutting permeation 94%
3 additional market trends, 4 additional growth drivers, and 2 additional restraints and challenges are covered in the full report. Contact sales@marketmindsadvisory.com to access the complete intelligence.

Segment CAGR and Growth Architecture

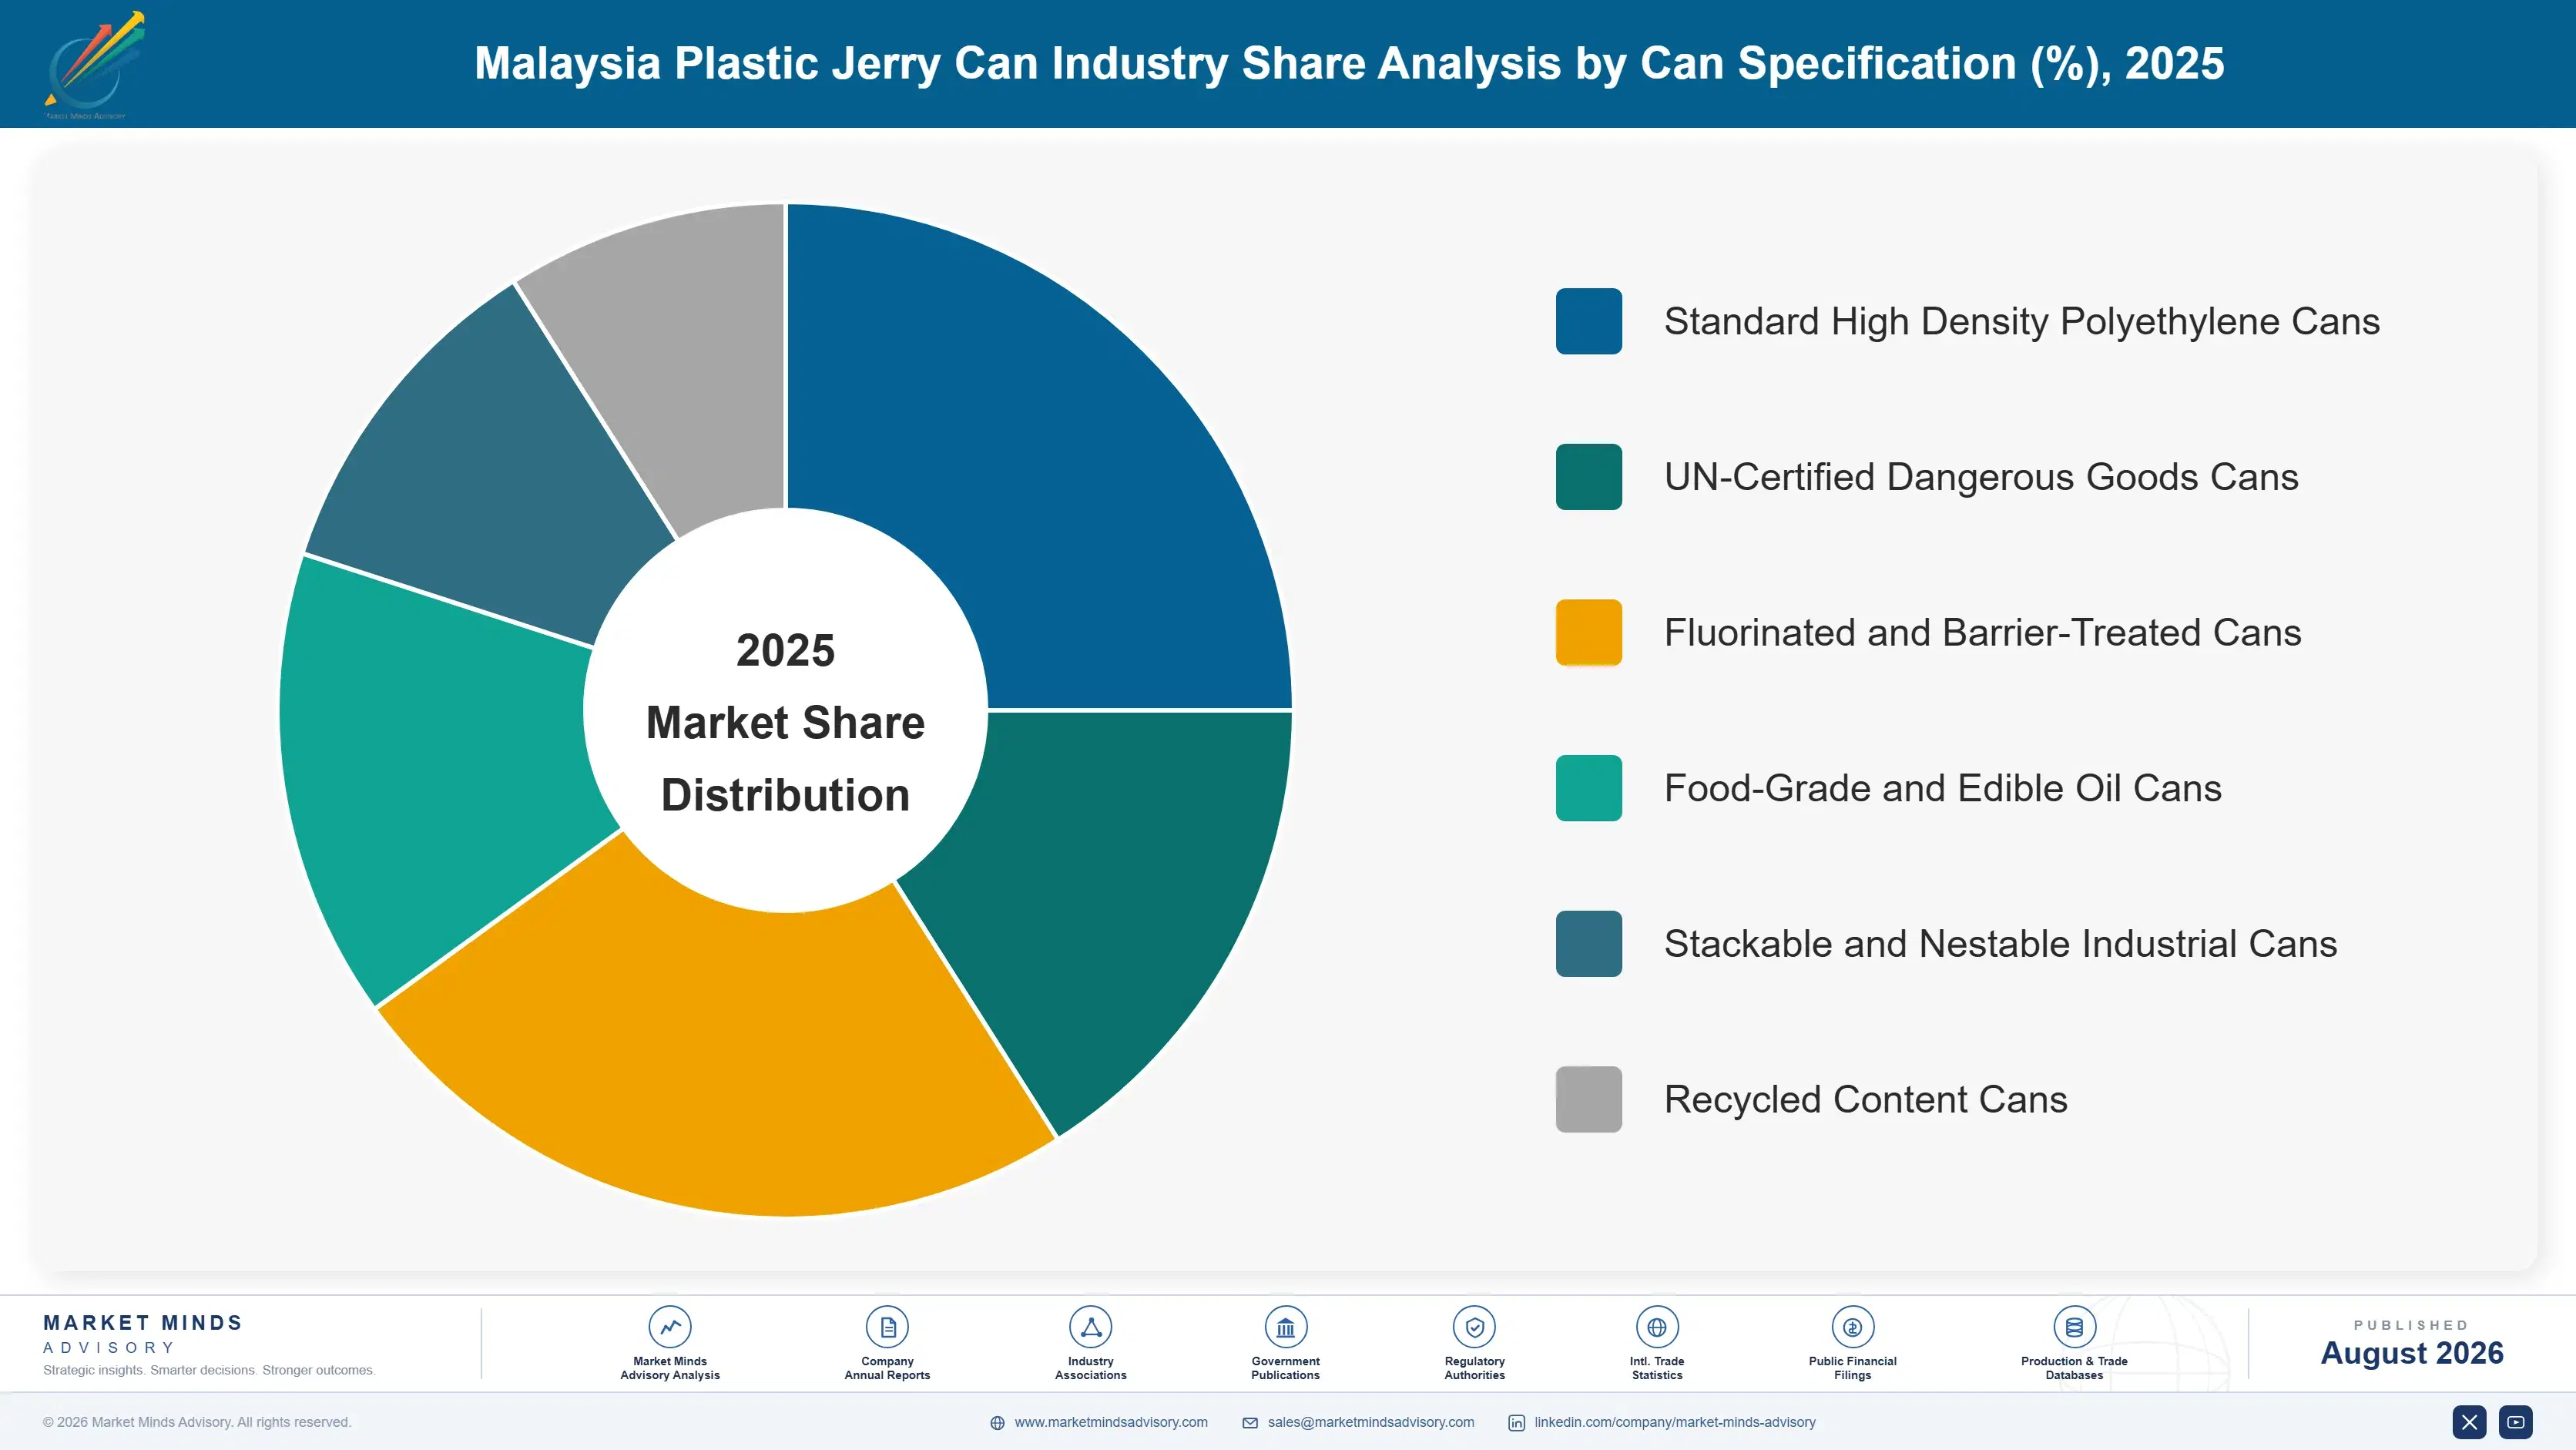
Segmentation follows can specification and certification status, because that determines which cargo the container may legally carry and what testing stands behind it. A UN-certified dangerous goods can and a standard food-grade can are moulded on identical equipment and belong to entirely different regulatory worlds. The stamp rather than the shape decides. Testing stands behind one and not the other.
malaysia-plastic-jerry-can-industry-market-share-analysis-1787308557408

UN-Certified Dangerous Goods Jerry Cans

Certified cans compound at 8.7%, exactly 1.50 times the industry rate, because Malaysia's export mix keeps moving toward cargoes that require them. A United Nations design type approval covers drop testing at low temperature, stacking under load, leakproofness and hydraulic pressure, granted against a specific wall thickness, resin grade and closure combination rather than against a shape. Approval requires renewed testing at twelve month intervals, so it is an ongoing obligation rather than a certificate on a wall. Producers who let one lapse cannot ship the cargo at all until it is restored, which makes the administrative discipline as commercially important as the moulding itself and considerably harder to sustain.
CAGR 8.7%

Fluorinated and Barrier-Treated Cans

Fluorinated cans grow at 7.5% by solving a problem untreated polyethylene cannot. Hydrocarbons, solvents and certain agrochemical formulations permeate through the container wall, and a shipment losing several percent of its contents across a long voyage fails on delivered weight and on the headspace that loss creates. Surface fluorination reacts the inner wall in a post-moulding treatment, cutting permeation by roughly 94% without changing the moulding process at all. In-mould fluorination integrates the step into production for higher volumes. The treatment adds cost and handling requirements, and for solvent-containing cargoes there is simply no untreated alternative that ships intact. Most moulders here cannot offer it. Shippers have no workable alternative for those contents.
CAGR 7.5%
Full segment breakdown across 6 segments available in the complete report.

Regional Architecture and Country Demand Map

This is a Malaysian production industry whose demand is set by where filled containers are shipped. Regional shares describe destination of packed cargo rather than production location, since roughly 72% of output leaves the country full. Discharge infrastructure at destination decides whether cargo travels packed at all.

South Asia and Pacific

South Asia and Pacific absorbs 46% of Malaysian packed liquid cargo. Note: this far exceeds the standard band because the figure describes shipment destination rather than production, and Malaysia's closest and largest export markets sit within the region. Indonesian, Vietnamese, Thai, Indian and Bangladeshi buyers of palm oil, oleochemicals and lubricants frequently lack the tank farm capacity that would allow bulk discharge, which makes a twenty-five litre can the practical unit of trade rather than a packaging choice. Regional demand compounds at 7.8%, with India at 8.2% the fastest of any single destination on manufacturing and agricultural processing growth. Short shipping distances also make packed cargo economically viable where longer routes would favour bulk.
Share: 46% | CAGR: 7.8% (2026 to 2036)

East Asia

East Asia takes 24% of Malaysian packed cargo, principally Chinese, Japanese and Korean buyers of oleochemicals, fatty acids and speciality derivatives rather than commodity palm oil, which moves in bulk on those routes. That mix matters commercially, because oleochemical and speciality chemical shipments carry classification requirements far more often than food oil does, so East Asian destinations pull a disproportionate share of certified and fluorinated can volume. Chinese chemical processors buying Malaysian intermediates are the largest single element. Japanese buyers impose additional contamination and dimensional expectations comparable to those they apply elsewhere. Growth of 6.4% reflects the downstream chemical trade rather than palm oil volumes. Certified and fluorinated volume concentrates on these routes.
Share: 24% | CAGR: 6.4% (2026 to 2036)
Regional intelligence for 5 additional markets available in the complete report: Middle East and Africa, Western Europe, North America, Latin America, Eastern Europe. Contact sales@marketmindsadvisory.com.
malaysia-plastic-jerry-can-industry-country-cagr-analysis-1787308557932

Certification Rather Than Moulding Capability

Blow moulding a jerry can is straightforward and any of forty Malaysian moulders can do it. The commercial positions worth holding all rest on what the container is permitted to carry and whether it arrives intact after a long voyage. Four qualify, and none is defended on conversion cost. Forty Malaysian moulders can make the container.

Maintain Design Type Approvals Across the Certified Range

A United Nations design type approval covers drop testing, stacking, leakproofness and hydraulic pressure against a specific wall thickness, resin grade and closure combination, and requires renewed testing every twelve months rather than lasting indefinitely. Producers who let approvals lapse cannot ship the cargo until they are restored. Maintaining a broad certified range is an administrative and testing discipline rather than a moulding capability, and certified cans compound at 8.7% while carrying gross margins roughly 13 to 20 points above standard. Testing discipline is the product. Moulding capacity is irrelevant to it.
Market Impact: Certified cans carrying 13 to 20 ma

Offer Fluorination for Solvent-Containing Export Cargoes

Untreated polyethylene loses hydrocarbon and solvent contents through the wall, and a shipment arriving several percent light fails on delivered weight and on headspace. Surface fluorination cuts permeation by roughly 94% and requires post-moulding treatment capability or in-mould capacity that most Malaysian moulders do not hold. Malaysian speciality chemical export keeps growing faster than commodity palm oil, so the requirement widens each year, and for those cargoes there is simply no untreated alternative a shipper can use instead. Shippers have no alternative. The requirement widens every year rather than staying niche.
Market Impact: Permeation cut by 94% with the surf

Engineer Stacking Performance for Long Voyage Routes

Export cans stack three tiers high inside a shipping container and sit under that load for weeks, then face repeated handling through consolidation, customs inspection and inland distribution. A deformed can or a failed handle generates a claim far exceeding the container's value, particularly on high-value oleochemical cargo. Engineered wall distribution and rib geometry deliver the performance without adding weight, and buyers on the longest routes into Latin America and Europe increasingly specify it rather than accepting standard construction. Long routes specify it explicitly. Cans stack 3 tiers deep for weeks at sea.
Market Impact: Stacking held at 3 full tiers under

Follow Downstream Chemical Investment Rather Than Palm Volume

Malaysian industrial policy keeps pushing production downstream from crude palm oil into oleochemicals, fatty acids, esters and speciality derivatives, and every step raises the probability that a cargo requires certification. Commodity palm oil volume is flat and increasingly moves in bulk on major routes. Producers tracking downstream chemical investment announcements rather than palm oil tonnage position ahead of the demand, since 72% of output is export-driven and the export mix is shifting rather than the total growing. Roughly 72% of output is export-driven, so the export mix rather than the total is what actually shifts a moulder's opportunity.
Market Impact: Exports now carrying fully 72% of M

Who Controls the Margin Pool

Five producers hold 41% of the Malaysian industry measured on jerry can revenue, the basis applied consistently through this section. Concentration is moderate, and it reflects certification holdings and export customer relationships rather than moulding capacity, since blow moulding equipment is widely available. Greif and Mauser Packaging Solutions lead through international industrial packaging positions. Blow moulding equipment separates nobody.
Competition operates on three dimensions. Design type approval breadth decides which cargoes a producer can serve, and maintaining approvals is an ongoing testing obligation rather than a one-off. Fluorination capability decides participation in solvent-containing export work. And export customer relationships decide access, since the buyer is frequently a chemical exporter rather than a packaging purchaser. All three sit outside the moulding shop. Chemical exporters rather than packaging buyers award the work.

Two pressures are reshaping position. Regional moulders in Indonesia, Vietnam and Thailand compete for the same export packing work as those countries build downstream chemical capacity of their own. Against that, Malaysia's downstream chemical direction keeps raising certification requirements domestically. Rankings will move toward whoever pairs broad certification holdings with genuine barrier treatment capability. Very few hold both today.
malaysia-plastic-jerry-can-industry-company-positioning-matrix-1787308558451

Competitive Moat and Risk Dimensions

GREIF

Moat: Global certification and customer reach

Greif holds industrial packaging positions across many countries, which means a chemical exporter qualifying its containers can carry that qualification across multiple shipping origins rather than repeating the exercise. Certification management practice built for global dangerous goods packaging transfers directly, and the company's relationships sit with chemical producers rather than with packaging purchasing functions.
GREIF

Risk: Regional cost competition

Standard food-grade and non-certified cans face Malaysian and regional moulders with materially lower overhead, and with resin at 61% of cost there is limited room for a global structure to show value on uncertified work. As Indonesian and Vietnamese downstream chemical capacity grows, packing demand may shift toward those origins rather than remaining Malaysian.
MAUSER PACKAGING SOLUTIONS

Moat: Dangerous goods packaging specialism

Mauser's business is built around industrial and dangerous goods packaging rather than general conversion, which means design type approval maintenance, testing discipline and classification knowledge sit at the centre of how it operates rather than at the edge. That focus matters in a market where a lapsed approval stops a shipment entirely and where buyers are shipping classified cargo routinely.
MAUSER PACKAGING SOLUTIONS

Risk: Food-grade and commodity exposure

Food-grade palm and cooking oil cans represent substantial Malaysian volume and require no dangerous goods certification at all, which removes the company's principal advantage on that work. Competing there means matching regional moulders on delivered cost, and a specialist cost structure carries overhead that commodity food oil packing simply will not support.

Players Tracked

Prominent Players

Greif
Mauser Packaging Solutions
Scientex
Daibochi
Tomypak

Other Key Players

Time Packaging Industries
Chin Well Holdings
Kian Joo Group
BP Plastics Holding
Thong Guan Industries
SCGP Malaysia
Berry Global
Schutz Container Systems
Time Technoplast
Balmer Lawrie
Muehlstein
Alpha Packaging
PT Namasindo Plas
Srithai Superware
Zhongshan Jinbang Plastic

Recent Developments

FEBRUARY 2025

Downstream oleochemical investment raises certified packaging demand

Malaysian oleochemical and speciality derivative capacity expansions progressed under national industrial policy, shifting export mix further from crude palm oil toward classified cargoes requiring United Nations certified containers. These were industrial investment decisions rather than commercial developments between packaging producers. Packaging demand follows the industrial direction.
Signal: Every step downstream of crude palm oil ra
JUNE 2025

Solvent-containing exports expand fluorinated can requirements

Malaysian speciality chemical and agrochemical exporters extended use of surface-fluorinated containers as solvent-containing formulations grew as a share of packed cargo. This reflects product mix change rather than any corporate transaction, and untreated cans are not a viable alternative for those contents. Delivered weight rather than quality is what fails.
Signal: Permeation through an untreated wall is a
OCTOBER 2025

Regional downstream capacity competes for export packing volume

Indonesian and Vietnamese oleochemical and speciality chemical capacity expanded, drawing some packed export volume toward those origins rather than through Malaysian processing. This reflects regional industrial development rather than any commercial action by packaging producers themselves. Malaysian moulders face competition from origins that did not previously exist.
Signal: Packing demand now follows downstream chem

Polyethylene, Fluorination and Testing

High density polyethylene accounts for roughly 61% of cost of goods, purchased regionally from Malaysian, Singaporean and Middle Eastern petrochemical producers. Closures, handles and induction seals run a further 12%. Fluorination treatment, certification testing and design type approval maintenance make up most of the remainder, with testing costs falling disproportionately on producers holding broad certified ranges.
Polyethylene pricing moved sharply through 2022 and 2023 as global petrochemical markets absorbed the European energy disruption documented in International Energy Agency reporting, and Asian resin prices followed with a short lag. Malaysian moulders absorbed much of it, since export packaging contracts run annually against shipment programmes agreed in advance. Company annual reports covering industrial packaging segments disclose the resulting margin compression across those quarters.

Exposure divides by certification mix rather than by scale. Producers weighted toward standard food-grade cans compete on delivered price against regional moulders and cannot pass resin movements through at all. Those weighted toward certified and fluorinated work price against approvals competitors do not hold, where a shipper facing a classification requirement will absorb a cost movement rather than find an alternative container. Classification removes the alternative entirely.
malaysia-plastic-jerry-can-industry-cost-volatility-analysis-1787308558646

Index can pricing to regional polyethylene benchmarks

Indexing removes 61% of the cost base from the moulder's risk, and export customers shipping regularly generally accept it once the mechanism is explained clearly. Where a buyer resists, shortening the price review period to quarterly achieves much of the same protection, though it introduces negotiation frequency that annual shipment programmes are not designed around.

Consolidate certification testing across design families

Design type approvals require renewed testing every twelve months and the cost falls per approval rather than per volume, which penalises producers holding many small certified ranges. Rationalising designs so that fewer approvals cover more cargo types reduces the annual testing burden materially without narrowing what the producer can legally ship. Coverage need not narrow.

Bring fluorination in-house rather than subcontracting treatment

Post-moulding fluorination sent to a treatment subcontractor adds handling, transport and lead time to a product already competing on delivery reliability. In-mould fluorination integrates the step into production at higher volumes, and even in-house post-treatment removes a scheduling dependency that becomes acute exactly when export volumes peak. Peak export season is when it matters most.

Portfolio Architecture for Margin Defence

The portfolio separates on what the container is legally permitted to carry. Standard food-grade cans for cooking oil are moulded polyethylene sold on delivered price, and regional moulders across Southeast Asia compete for exactly that work. Certified dangerous goods cans carry design type approval nobody can substitute around. Fluorinated cans solve a permeation problem untreated polyethylene cannot. Stackable engineered designs solve a handling problem long routes create. Legal permission dra
The tension is that food-grade commodity work carries the moulding volume and the export customer relationships from which certified business follows, while returning almost nothing. Conceding it removes the account presence at exporters who will eventually ship a classified cargo. Most successful Malaysian moulders run it deliberately at minimal margin as relationship maintenance rather than as a business in itself. Relationship and margin are separate objectives. That trade is made deliberately.

High-value pools concentrate where a classification, a permeation risk or a voyage length sets the requirement. Certified dangerous goods cans, fluorinated containers and engineered stacking designs all qualify, and none of them is awarded on price per container. Price per container decides none of them.

Volume / Commodity-Adjacent Tier

Standard high density polyethylene and food-grade cans for cooking oil, palm derivatives and general liquid packing. Blow moulded on widely available equipment and sold on delivered price against regional Southeast Asian moulders with comparable capability.
Gross Margin: 14-22%

Premium / Certified Tier

United Nations certified dangerous goods cans carrying design type approval for drop, stacking, leakproofness and pressure, maintained through twelve month retesting. Certification holdings rather than moulding capability determine which cargoes a producer may legally serve.
Gross Margin: 27-38%

Sustainability / Regulatory / Next-Generation Tier

Fluorinated and barrier-treated cans plus recycled content constructions. The wide margin range reflects the gap between established fluorination positions and recycled content work where food contact and dangerous goods approval interact awkwardly.
Gross Margin: 26-46%
malaysia-plastic-jerry-can-industry-portfolio-architecture-1787308559142

High-value Sub-segments and Strategic Watch-out

UN-Certified Dangerous Goods Cans

Compounding at 8.7% as Malaysian export mix shifts downstream toward classified cargoes. Approval covers a specific wall thickness, resin grade and closure combination and requires retesting every twelve months, which makes administrative discipline as important as moulding capability. A lapse stops the shipment entirely. Retesting never stops.
Gross Margin: 30-38%

Fluorinated Barrier Cans

Growing at 7.5% because untreated polyethylene loses solvent contents through the wall, and a shipment arriving light fails on delivered weight. Treatment cuts permeation roughly 94% and requires capability most Malaysian moulders simply do not hold at all. Long routes lose the most. Capability is scarce here.
Gross Margin: 32-46%

Standard Food-Grade Cans

The volume core at 4.2%, sold on delivered price against regional moulders with identical equipment and lower overhead. Run deliberately at minimal margin to hold export customer relationships from which classified cargo work eventually follows. Regional moulders match the equipment exactly. Overhead is the only difference.
Gross Margin: 14-22%

Recycled Content Constructions

The watch-out and the opportunity together. Brand and regulatory pressure is reaching industrial packaging, and recycled polymer interacts awkwardly with both food contact approval and dangerous goods design type testing that assumed virgin material. Design type testing assumed virgin material throughout. Approval interaction is unresolved.
Gross Margin: 20-40%

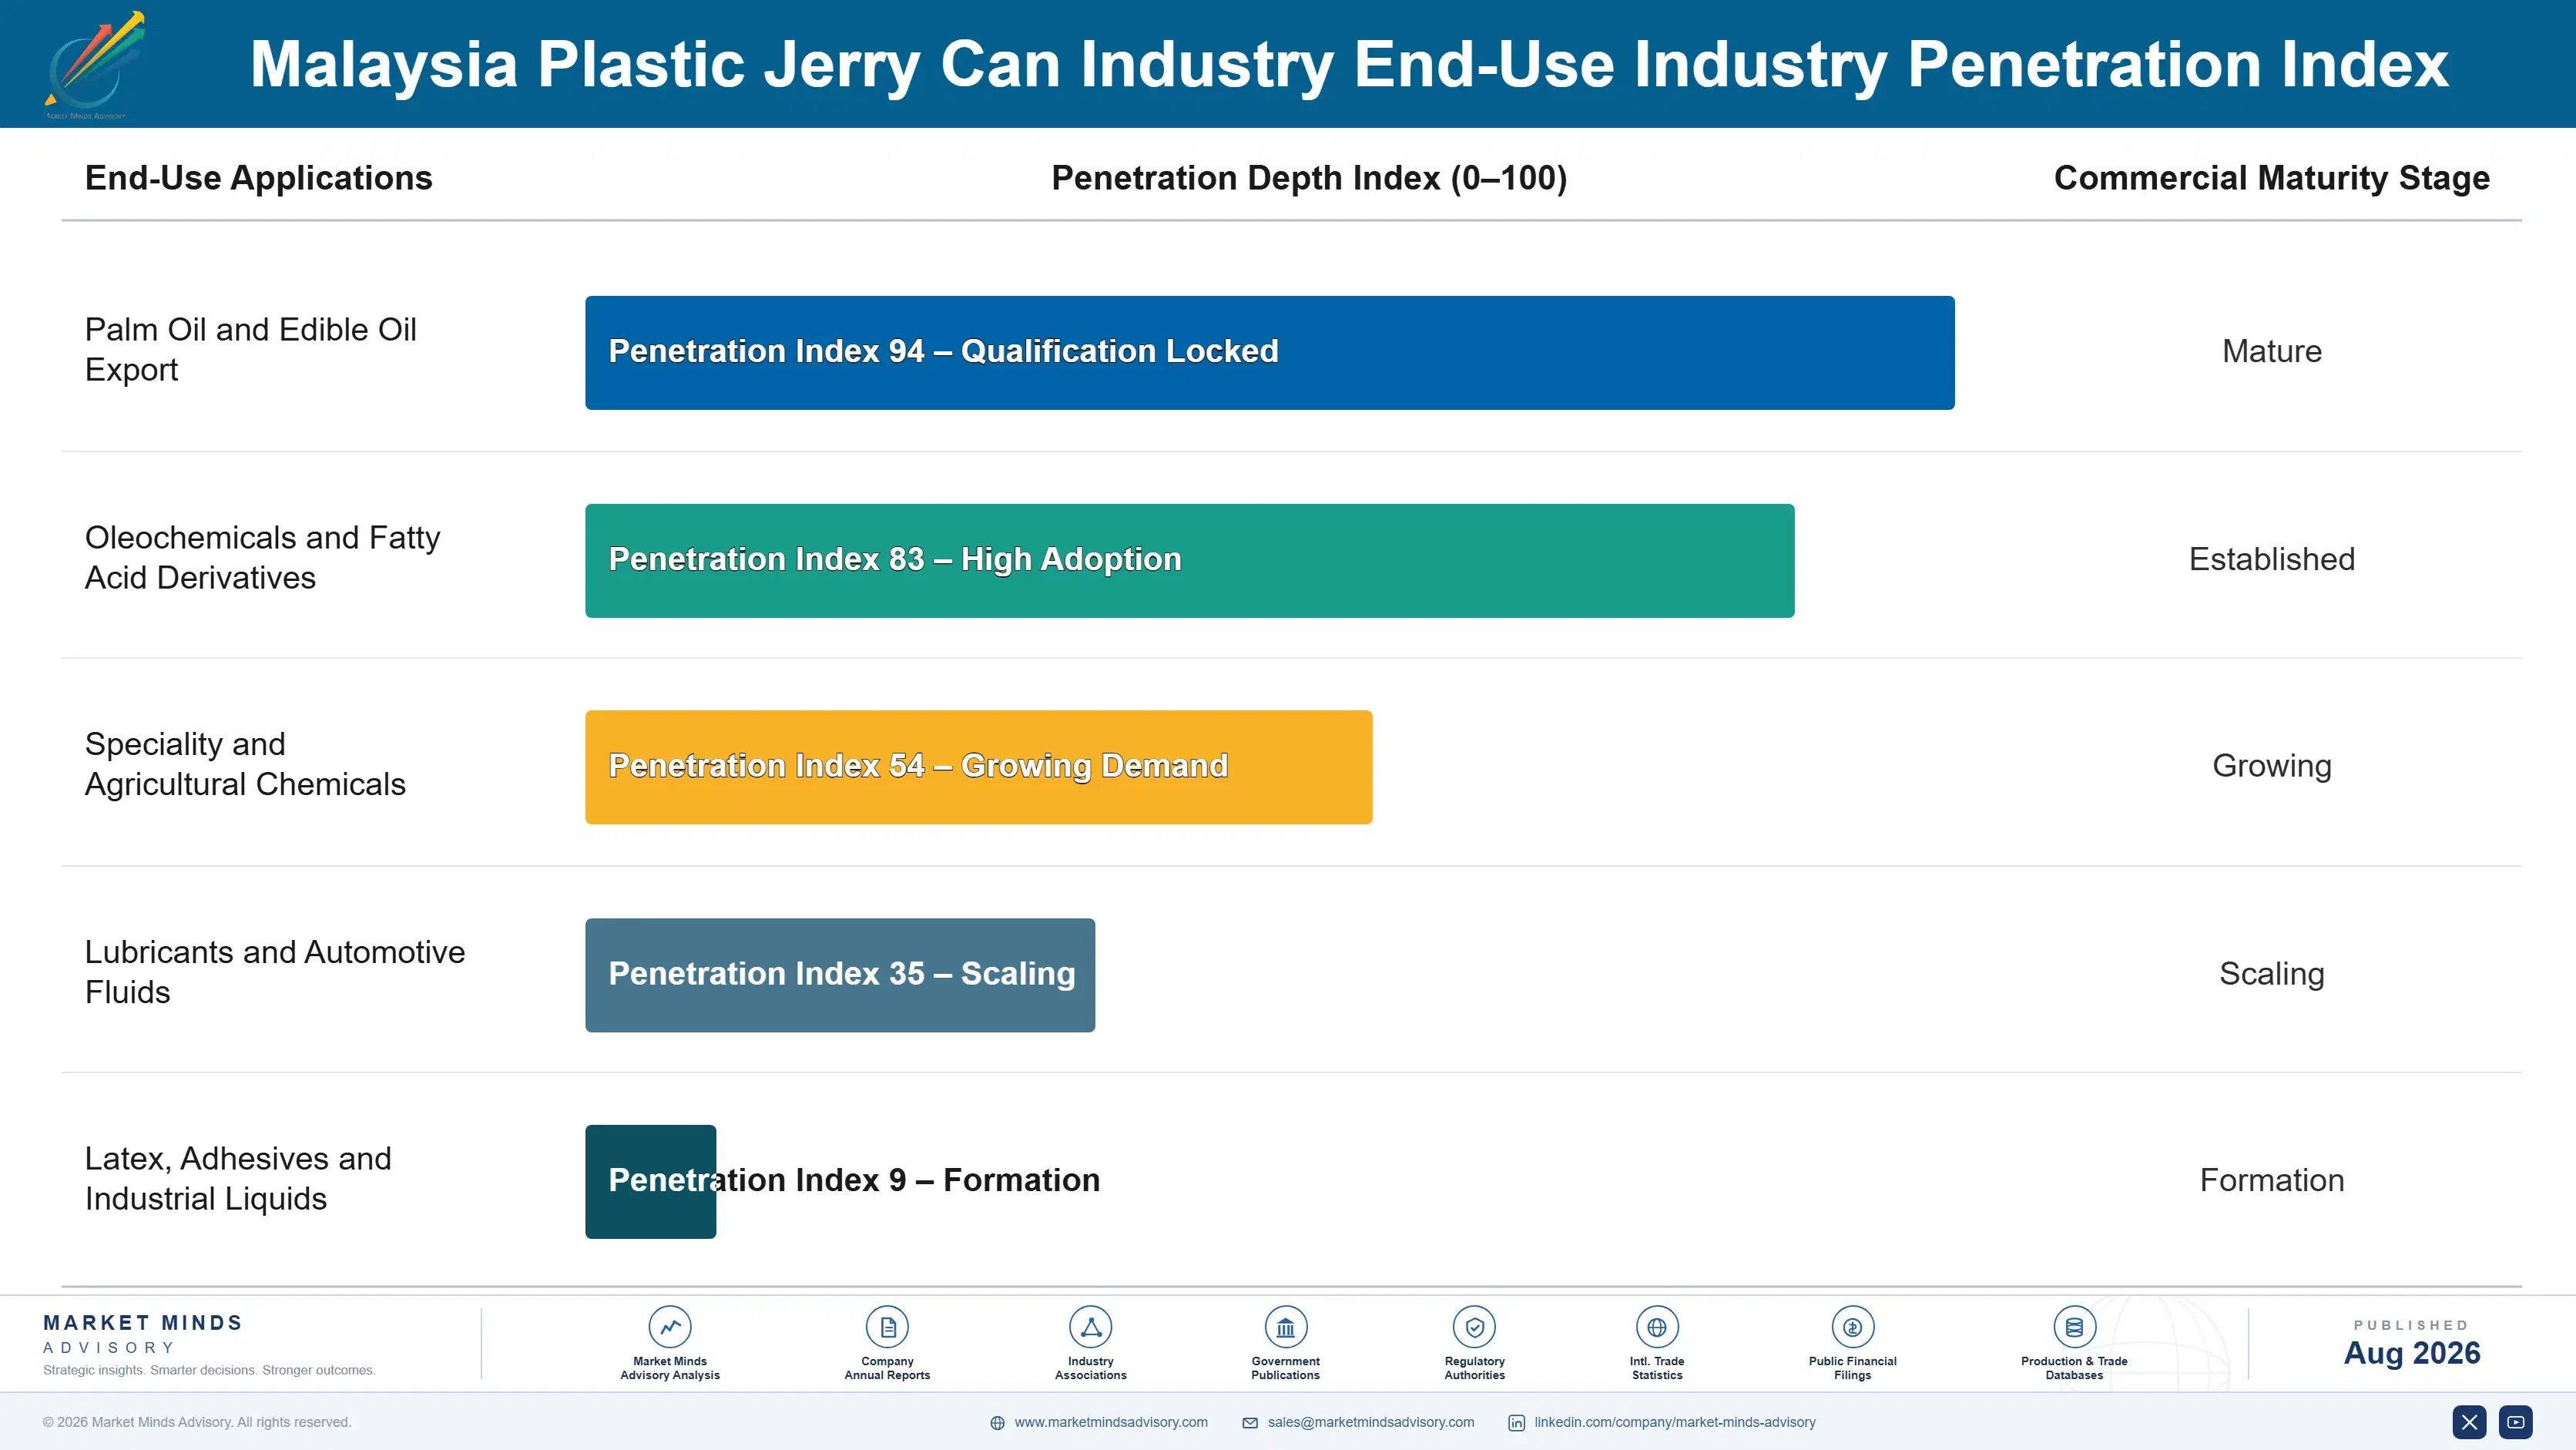
Shipment Programmes Rather Than Contracts

Demand here follows export shipment programmes agreed months ahead rather than packaging contracts in any conventional sense. A chemical exporter plans cargo volumes, destinations and classifications for a season, and the container requirement falls out of that plan. Roughly 72% of Malaysian production leaves the country full, so the moulder's order book is really a reflection of somebody else's export schedule and moves with it. The order book mirrors somebody else's schedule.
Depth varies by cargo classification. Speciality chemical and agrochemical exporters buy deepest, since certification and barrier treatment leave them very few supplier options and switching means requalifying a container against a classification. Oleochemical shippers buy on certification breadth. Food oil exporters buy on delivered price with genuine freedom. Domestic industrial users sit shallowest, buying whatever is available locally. Classification rather than size sets the depth.

The deciding population sits with logistics and regulatory affairs rather than purchasing. A classified cargo requires a container whose approval covers it, and that determination is made by whoever signs the dangerous goods declaration. Procurement negotiates price afterwards within whatever set of suppliers that determination has already left available. Purchasing arrives after the determination.
malaysia-plastic-jerry-can-industry-end-use-penetration-index-1787308559629

Where Malaysian Moulders Compete

These are among the four positions where our research anticipates prominent divergence between winners and laggards over the coming forecast period. Each is grounded in the demand model, the regulatory perimeter, and the announced capacity pipeline.
01 / APPROVAL MAINTENANCE DISCIPLINE

A lapsed certificate stops the shipment, not just the order

United Nations design type approval covers drop testing, stacking, leakproofness and hydraulic pressure against a specific wall thickness, resin grade and closure combination, and requires renewed testing every twelve months rather than lasting indefinitely. A producer that lets one lapse cannot ship the cargo until it is restored, whatever the moulding capacity available. Maintaining breadth across a certified range is an administrative and testing discipline rather than a manufacturing one, and certified cans carry 13 to 20 margin points above standard work.
02 / PERMEATION BARRIER CAPABILITY

Solvent cargo simply cannot travel in an untreated container

Untreated high density polyethylene loses hydrocarbon and solvent contents straight through the container wall, and a shipment arriving several percent light fails on delivered weight and on the headspace that loss creates. Surface fluorination cuts permeation by roughly 94% and requires post-moulding treatment capability that most Malaysian moulders simply do not hold. Malaysian speciality chemical export keeps growing faster than commodity palm oil does, so the requirement widens every year rather than remaining a specialist niche for a handful of cargoes.
03 / DOWNSTREAM INVESTMENT TRACKING

Follow the chemical plant announcements, not the palm oil price

Malaysian industrial policy keeps pushing production downstream from crude palm oil into oleochemicals, fatty acids, esters and other speciality derivatives, and each successive step raises the probability that a given cargo will need certification. Commodity palm oil volume is flat and increasingly moves in bulk on the major routes anyway, which removes it from the packed market. With 72% of output export-driven, producers that track downstream chemical investment announcements position ahead of demand, while those watching palm tonnage miss the shift entirely.
04 / BULK DISPLACEMENT DEFENCE

The largest and most predictable volumes leave first

Where a destination has tank farm capacity and volumes justify it, liquid cargo moves in bulk tankers or flexitanks at a fraction of the packaging cost per tonne, and that displacement takes the biggest and steadiest routes first of all. Producers should therefore concentrate deliberately on destinations that lack discharge infrastructure, which is why South Asia and Pacific absorbs 46% of packed volume. Cargoes where classification or contamination risk rules bulk handling out entirely are the other genuinely defensible ground available.

Engagement Snapshot From the Field

A live engagement with an industry participant carrying material or product regulatory and market exposure ahead of a defining policy shift, showing how our research translates into a defensible multi-year portfolio strategy.
MARKET MINDS ADVISORY · CLIENT ENGAGEMENT SUMMARY
Malaysia Plastic Jerry Can Industry Producer Strategic Portfolio Review and Transition Roadmap 2026·Investment Scenario on Malaysia Plastic Jerry Can Industry Exposure Evaluation 2025-26
CLIENT PROFILE
An oleochemical producer exporting roughly 340,000 tonnes annually (client-reported, unverified by MMA) of fatty acids, esters and derivatives from two Malaysian plants into Asian, Middle Eastern and European destinations. Packaging spend across jerry cans and drums ran near MYR 92 million (client-reported, unverified by MMA), with container specification decided by plant logistics teams independently of one another.
STRATEGIC CHALLENGE
Two shipments had been held at destination ports over dangerous goods documentation discrepancies, and a third had arrived measurably light on delivered weight. Logistics attributed the weight loss to filling variation. Procurement had separately consolidated can supply on delivered price without reference to certification scope or barrier treatment. Nobody had connected the three events.
MMA APPROACH
MMA mapped each exported product against its dangerous goods classification and the design type approvals held by the awarded supplier, then measured delivered weight loss against voyage length and container treatment across a sample of shipments. Certification retest status was verified directly with the competent authority rather than from supplier documentation.
KEY FINDINGS
  1. Two product classifications were being shipped in cans whose design type approval did not cover them, which explained both port holds and had gone unnoticed because the documentation was internally consistent.
  2. Delivered weight loss correlated with voyage length and absence of fluorination rather than with filling variation, and the longest European routes showed losses several times those on regional shipments.
  3. The consolidated supplier held approvals covering roughly half the client's classified product range, and no internal function had checked scope before the award was made.
  4. Retest dates on two of the supplier's approvals had passed, and neither the supplier nor the client had a process for tracking expiry against shipment schedules.
CLIENT PROFILE
An oleochemical producer exporting roughly 340,000 tonnes annually (client-reported, unverified by MMA) of fatty acids, esters and derivatives from two Malaysian plants into Asian, Middle Eastern and European destinations. Packaging spend across jerry cans and drums ran near MYR 92 million (client-reported, unverified by MMA), with container specification decided by plant logistics teams independently of one another.
STRATEGIC CHALLENGE
Two shipments had been held at destination ports over dangerous goods documentation discrepancies, and a third had arrived measurably light on delivered weight. Logistics attributed the weight loss to filling variation. Procurement had separately consolidated can supply on delivered price without reference to certification scope or barrier treatment. Nobody had connected the three events.
MMA APPROACH
MMA mapped each exported product against its dangerous goods classification and the design type approvals held by the awarded supplier, then measured delivered weight loss against voyage length and container treatment across a sample of shipments. Certification retest status was verified directly with the competent authority rather than from supplier documentation.
KEY FINDINGS
  1. Two product classifications were being shipped in cans whose design type approval did not cover them, which explained both port holds and had gone unnoticed because the documentation was internally consistent.
  2. Delivered weight loss correlated with voyage length and absence of fluorination rather than with filling variation, and the longest European routes showed losses several times those on regional shipments.
  3. The consolidated supplier held approvals covering roughly half the client's classified product range, and no internal function had checked scope before the award was made.
  4. Retest dates on two of the supplier's approvals had passed, and neither the supplier nor the client had a process for tracking expiry against shipment schedules.
RECOMMENDED STRATEGY
Phase 1: Phase 1 (months 1 to 5): Map every exported classification against required approval scope and move affected products to suppliers holding valid coverage. Phase 2: Phase 2 (months 5 to 14): Specify fluorinated containers on every solvent-containing cargo that travels beyond the short regional shipping routes. Phase 3: Phase 3 (months 14 to 24): Establish group-level tracking of every supplier approval retest date against the forward shipment programme.
OUTCOME
Port holds ceased following the reassignment of classified products (client-reported, unverified by MMA). Delivered weight losses on long-haul routes fell to negligible levels after fluorination. Packaging spend rose by roughly MYR 6 million annually against claim and demurrage costs the client valued near MYR 21 million (client-reported, unverified by MMA).

Frequently Asked Questions

Foundational context covering the market sizes, CAGR, scope, country, region and competition that inform every finding below. This section is provided to cover basics and most often pre-purchase conversations, answered from the MMA Primary Research Dataset.

What is the current size of the Malaysia Plastic Jerry Can Industry?

The industry was worth USD 0.31 billion in 2025, reaching USD 0.33 billion in 2026. South Asia and Pacific absorbs 46% of packed cargo by destination.

How large will the Malaysia Plastic Jerry Can Industry be by 2036?

MMA forecasts USD 0.57 billion by 2036, an expansion multiple of 1.76 times the 2026 base. That represents roughly USD 0.24 billion of incremental value.

What is the CAGR for the Malaysia Plastic Jerry Can Industry 2026 to 2036?

The base case compounds at 5.8% annually, with a bull case of 7.0% and a bear case of 4.6%. Historical growth from 2020 to 2025 ran at 4.8%.

Which segment is growing fastest?

UN-certified dangerous goods jerry cans compound at 8.7%, exactly 1.50 times the industry rate. Malaysia's export mix keeps shifting toward classified downstream chemical cargoes requiring approval.

Who are the major companies in the Malaysia Plastic Jerry Can Industry?

Greif, Mauser Packaging Solutions, Scientex, Daibochi and Tomypak hold a combined 41% of the industry. Certification holdings rather than moulding capacity are what sustain those positions.

Which country is growing fastest?

India compounds at 8.2% as a destination market, ahead of every other. Manufacturing and agricultural processing growth there is drawing packed liquid cargo from Malaysia.

Report Segmentation Architecture

The full report scope spans multiple orthogonal segmentation dimensions, with cross-tabulated demand data provided for each dimension pair. Coverage extends further to regional breakdowns, trend trajectories, and the competitive detail needed to support segment-level decision-making.

By Can Specification

  • Standard High Density Polyethylene Cans
  • UN-Certified Dangerous Goods Cans
  • Fluorinated and Barrier-Treated Cans
  • Food-Grade and Edible Oil Cans
  • Stackable and Nestable Industrial Cans
  • Recycled Content Cans

By End-Use Industry

  • Palm Oil and Edible Oil Export
  • Oleochemicals and Fatty Acid Derivatives
  • Speciality and Agricultural Chemicals
  • Lubricants and Automotive Fluids
  • Latex, Adhesives and Industrial Liquids

By Commercial Dimension

  • Direct Supply to Chemical Exporters
  • Contract Filler and Packer Supply
  • Distributor and Trading Channel
  • Domestic Industrial and Retail Supply

By Region

  • South Asia and Pacific
  • East Asia
  • Middle East and Africa
  • Western Europe
  • North America
  • Latin America
  • Eastern Europe

Scope, Methodology, and Coverage

Every figure in this report is reproducible from documented input assumptions. The scope below maps the historical period, the forecast horizon, the segmentation dimensions, and the countries covered, alongside the underlying primary and qualitative methodology.
Historical Period
2020 to 2025
Forecast Period
2026 to 2036
Base Year
2025 (USD billions; MMA Primary Research Dataset, August 2026)
Market Definition
The industry covers rigid plastic jerry cans of between 3 and 30 litres capacity produced in Malaysia, spanning standard high density polyethylene cans, United Nations certified dangerous goods cans, fluorinated and barrier-treated cans, food-grade and edible oil cans, stackable and nestable industrial constructions, and recycled content cans, together with the closures supplied fitted to them. Drums above 30 litres, intermediate bulk containers, bottles below 3 litres, metal containers and closures sold separately are excluded. Sizing is measured at producer revenue in current prices, with regional shares describing destination of packed cargo.
Quantitative Units
USD billions (current prices); container units and tonnes of packed cargo where applicable
Segmentation Dimensions
By Can Specification; By End-Use Industry; By Commercial Dimension; By Region
Regions Covered
South Asia and Pacific, East Asia, Middle East and Africa, Western Europe, North America, Latin America, Eastern Europe
Countries Covered
USA, China, Germany, France, UK, Japan, South Korea, India, Australia, Canada, Brazil, Mexico, Indonesia, Vietnam, Thailand, Malaysia, UAE, Saudi Arabia, South Africa, Nigeria, Turkey, Poland, Netherlands, Italy, Spain, Sweden, Switzerland, Argentina, Colombia, Singapore, and additional markets relevant to this sector
Key Companies Profiled
Greif, Mauser Packaging Solutions, Scientex, Daibochi, Tomypak, Time Packaging Industries, Chin Well Holdings, Kian Joo Group, BP Plastics Holding, Thong Guan Industries, SCGP Malaysia, Berry Global, Schutz Container Systems, Time Technoplast, Balmer Lawrie, Muehlstein, Alpha Packaging, PT Namasindo Plas, Srithai Superware, Zhongshan Jinbang Plastic
Quantitative Methodology
Primary survey, n=3,800 respondents, Q4 2025, six countries; demand-side model with trade association cross-validation
Qualitative Methodology
47 expert interviews, Q4 2025; applied to validate demand model assumptions, identify emerging dynamics, and assess competitive positioning
Report Format
PDF and XLSX data workbook (Word format preview document)
Publisher
Market Minds Advisory
Report Code
MMA-2026-PAC-801
Published
August 2026
Contact
sales@marketmindsadvisory.com | www.marketmindsadvisory.com

Purchase the full Malaysia Plastic Jerry Can Industry Report (2026 to 2036).

The full report sizes the Malaysian jerry can industry across six specifications, three commercial dimensions and seven destination regions, with annual forecasts to 2036 under base, bull and bear scenarios. Design type approval holdings are mapped producer by producer against cargo classifications, showing which exporters can legally use which containers. Permeation loss is quantified by voyage length and treatment status, which is where delivered weight failures actually originate. Downstream chemical investment is tracked against certified container demand. Twenty producers are profiled on a consistent jerry can revenue basis.
Design type approval holdings mapped against cargo classifications
Permeation loss quantified by voyage length and treatment
Downstream chemical investment tracked against certified demand
Bulk displacement risk assessed by destination and route volume
Stacking performance requirements compared across shipping routes
Certification retest obligations benchmarked across the producer set

Built For The People Who Decide

From boardroom strategy to bench-side execution, this report is read cover-to-cover by leaders shaping the next decade of their industry, turning demand scenarios, market dynamics and valuation benchmarks into decisions.
CXOs/ Presidents/ VPs/ Managers
M&A and Corporate Development
Strategy Teams and R&D Heads
Procurement and Product Directors
Regulatory and Compliance Leaders
Investor Relations and Equity Analysts