Market Minds Advisory
Machine Vision System And Services Market

Machine Vision System And Services Market: Machine Vision System and Services Market. Turnkey Retrofit Programs Reshape Integrator Economics.

Manufacturers upgrading legacy two-dimensional inspection lines to AI-enabled systems without full production stoppage are pushing integrators toward turnkey retrofit programs, reshaping how vision system services get priced and delivered industry-wide.

Lead Analyst

Published

September 2026

Make Smarter Decisions with Customized Research Insights

Request a free sample report and evaluate market opportunities, growth trends, and competitive dynamics relevant to your business needs.

2025 MARKET VALUE$9.8BMarket Size 2025
2036 FORECAST VALUE$24.0BBase Case , 2026 to 2036
CAGR 2026 TO 20368.5 %Bull 9.8% / Bear 7.3%
INCREMENTAL OPPORTUNITY$13.4BNet 10- year value creation
EXPANSION MULTIPLE2.26x2036 value over 2026 base
Strategic Levers
M&A Pipeline
Regional Outlook
Country Rankings
Competitive Intelligence
Segmental Deep-dive
Call-Us : 91 93563 13602

Executive Snapshot and Market Trajectory.

Manufacturers running legacy two-dimensional inspection lines are commissioning turnkey retrofit programs that swap in AI-enabled systems without extended production stoppages, a shift integrators say is happening faster than any prior technology transition they have managed for existing customers this year. Few integrators saw this shift coming so quickly even recently.
Persistent skilled integration labor shortages and rising retrofit demand are the dominant commercial forces, with retrofit and upgrade services growing fastest as manufacturers refuse to tolerate the multi-week production halts that full system replacement historically required. North America leads systems and services revenue given higher labor-cost delivery economics, even as East Asia retains the largest installed factory base requiring integration work. Integrators without dedicated retrofit capability are struggling to keep pace.
Competitive intensity remains fragmented across dozens of regional systems integrators, none commanding dominant overall share, since integration expertise varies considerably by industry vertical and legacy equipment compatibility requirements. Robot manufacturers continue bundling vision integration services directly into automation cell sales, forcing standalone integrators to specialize narrowly around retrofit and multi-vendor compatibility work. Rankings shift slowly given how long qualification cycles lock in vendor relationships across the industry.
Market Definition
The machine vision system and services market covers pre-integrated turnkey inspection systems and the surrounding integration, installation, calibration, maintenance, training, and retrofit services delivered to end-use manufacturers. It excludes standalone camera, sensor, and software components sold directly to system integrators or OEMs.
Base Year Value
$9.8B in 2025 (MMA Primary Research Dataset, September 2026)
Forecast Period
2026 to 2036, eleven discrete annual values
CAGR
8.5% base case. Bull 9.8%. Bear 7.3%.
Fastest Growth Segment
Retrofit and Upgrade Services: 13.5% CAGR
Fastest Growth Country
India: 12.5% CAGR
Fastest Growth Region
South Asia and Pacific: 10.5% CAGR
Largest Region
North America: 30% of 2025 global value
Market Leaders
Cognex Corporation, ISRA VISION AG, FANUC Corporation, SICK AG, Siemens Digital Industries lead the field. Source: MMA Primary Research Dataset, July 2026.
Primary Survey
n=3,800 procurement and R&D decision-makers, Q4 2025, six countries
Methodology
Demand-side build-up, cross-validated against public data, 47 expert interviews

Machine Vision System And Services Market Forecast Scenarios

machine-vision-system-and-services-market-size-forecast-scenario-1788421085353
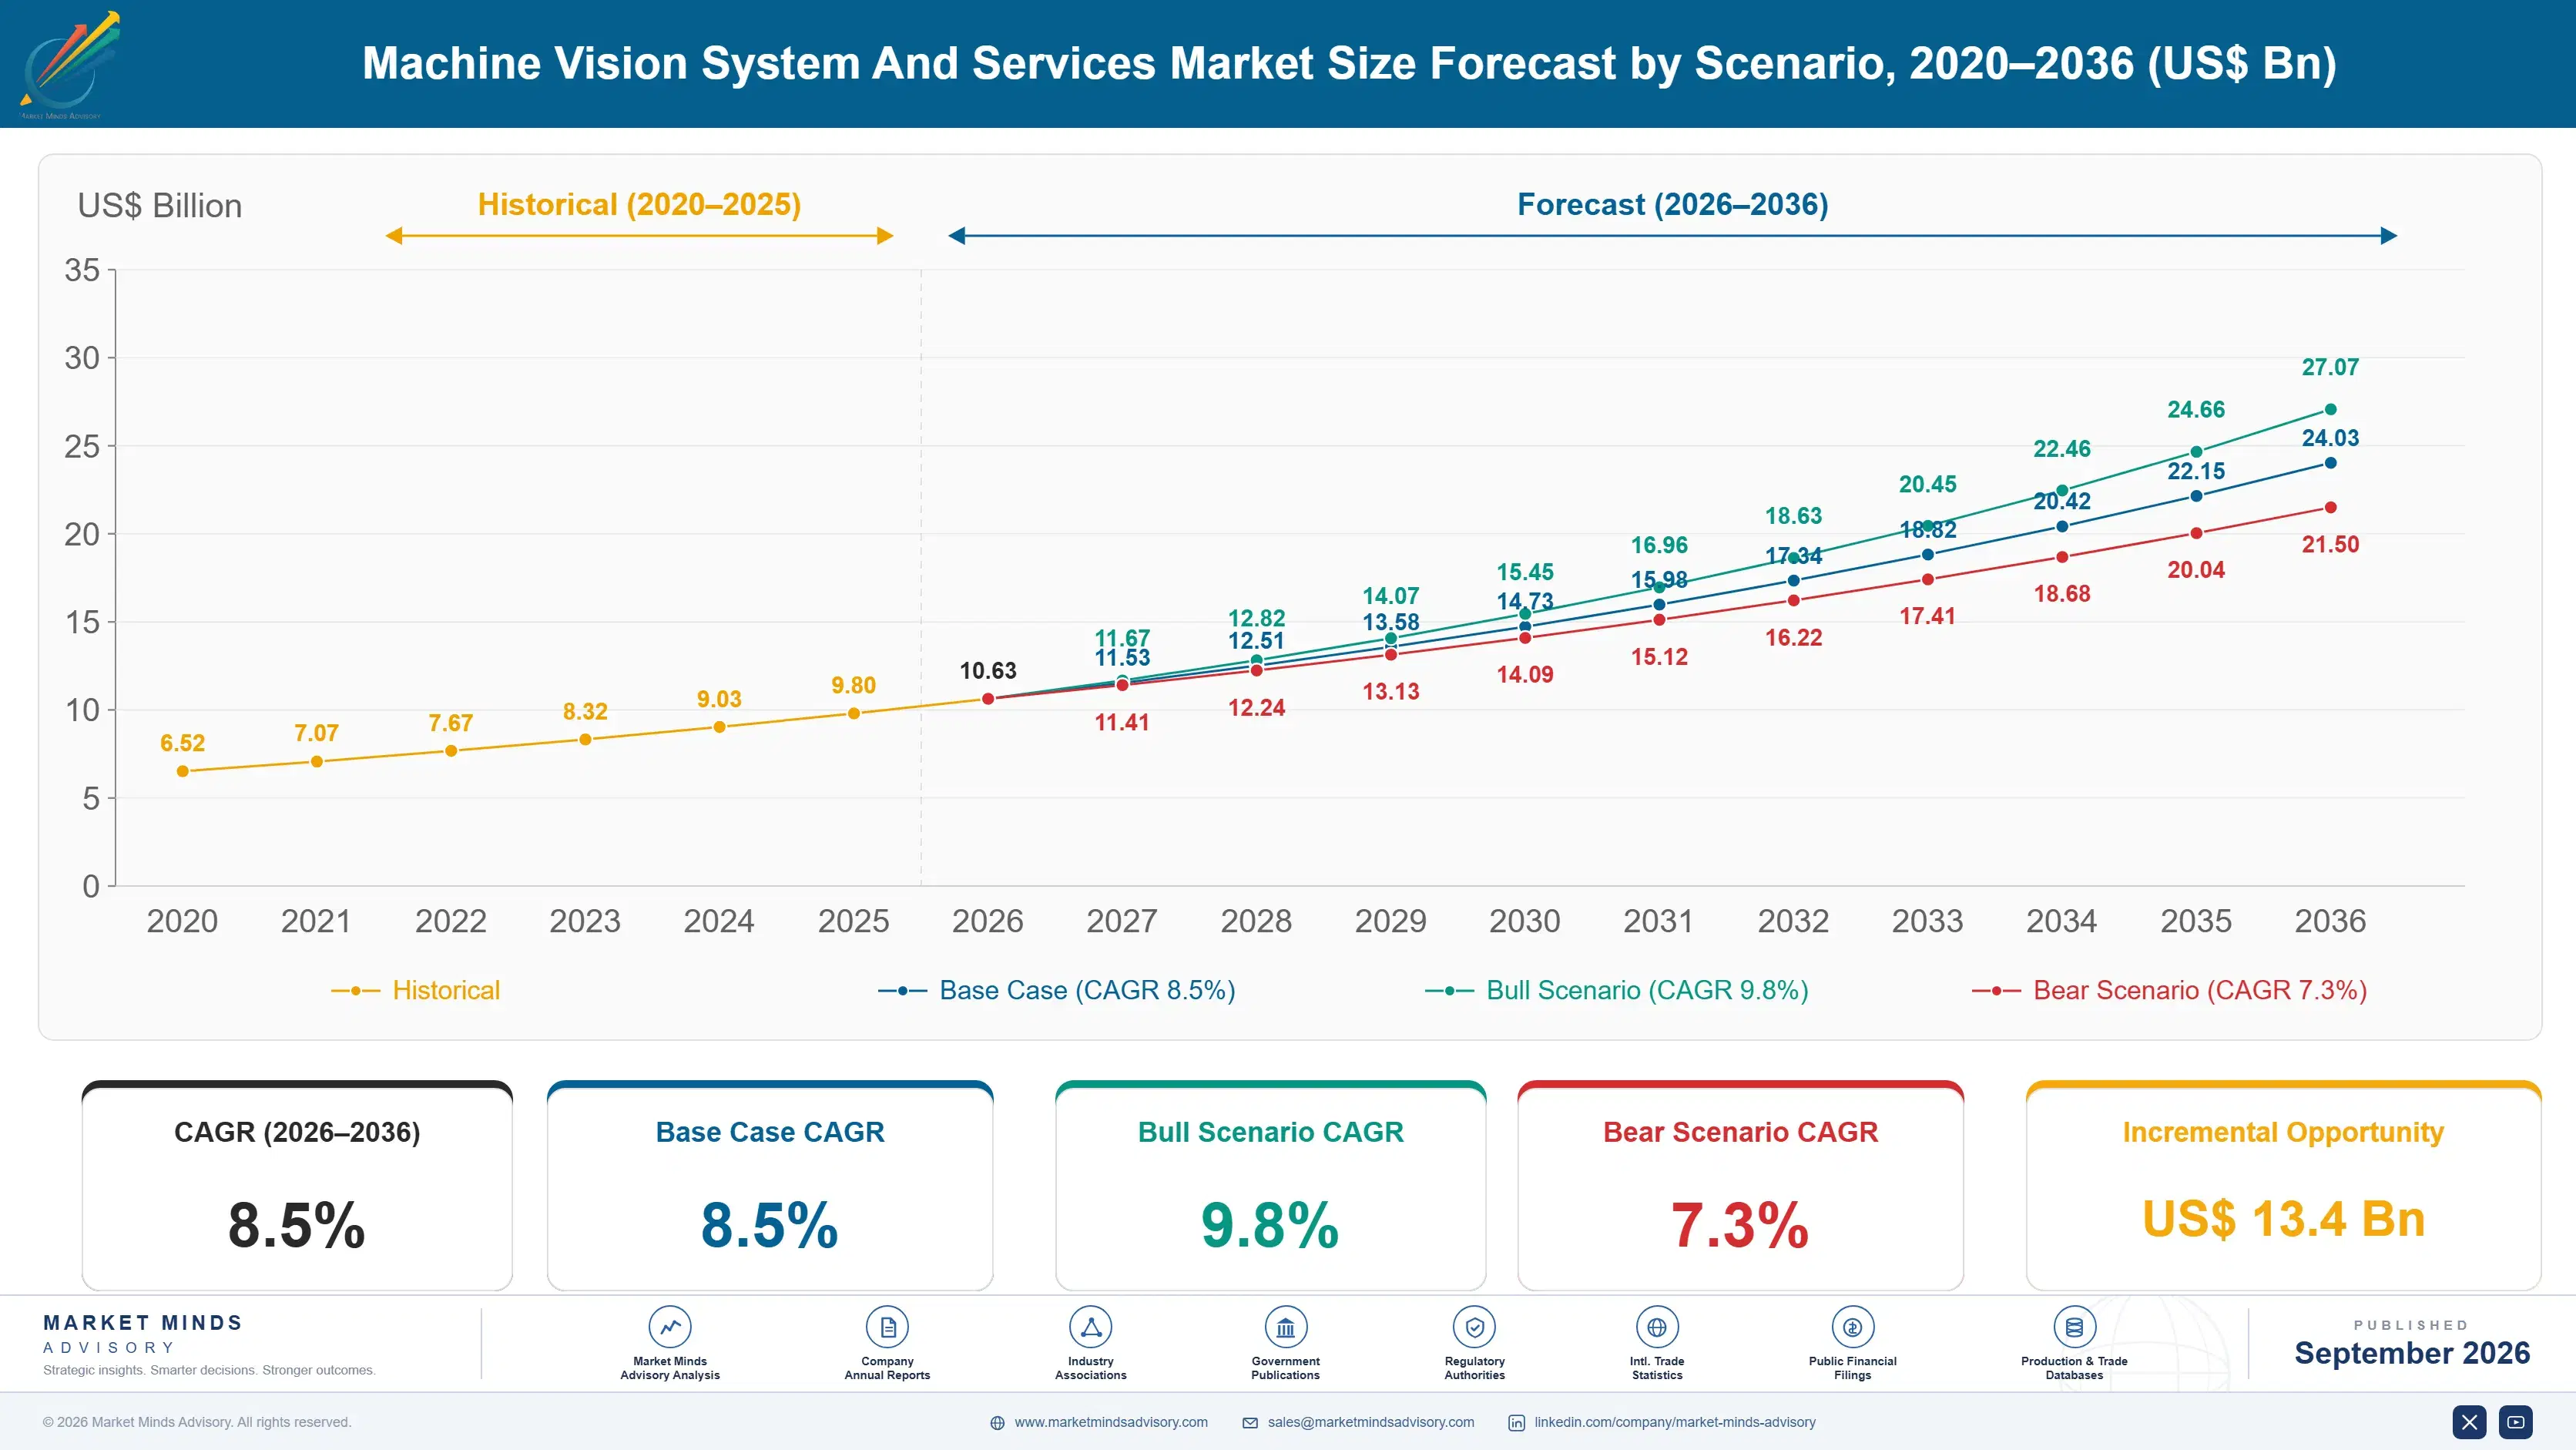
Between 2020 and 2025 the machine vision system and services market grew steadily as manufacturers expanded automated inspection deployments and integration expertise matured across a growing number of specialized regional service providers worldwide. Pandemic-era supply disruptions briefly slowed installation schedules in 2021. The historical annual growth rate held near 7.5 percent across the full period.
The base case assumes manufacturers keep prioritizing retrofit programs that avoid the production stoppages full system replacement historically required, deep learning-enabled turnkey systems continue lowering the integration burden for smaller manufacturers previously priced out of automation nationwide, and skilled integrator labor remains scarce enough to sustain pricing power. These three mechanisms together sustain a forecast compound annual growth rate near 8.5 percent through 2036, with retrofit services capturing an outsized share of incremental revenue.
The bull case assumes retrofit demand accelerates faster than currently anticipated forecasts suggest, pushing growth toward 9.8 percent as manufacturers rush to modernize legacy inspection lines nationwide. The bear case assumes turnkey system simplification reduces the integration labor required per deployment, capping growth near 7.3 percent as customers need fewer billable service hours per system installed.

Turnkey Reliability Commands Premium Integration Pricing

System and services economics hinge on the trade-off between turnkey simplicity and custom integration depth, since manufacturers increasingly want pre-validated systems that work with minimal on-site configuration rather than fully bespoke integration projects. Integrators that deliver reliable turnkey deployment capture premium pricing over pure custom integration labor, even when the underlying hardware components are otherwise identical between competing offerings. Buyers increasingly frame turnkey reliability as insurance against unplanned production downtime.
MARKET CONCENTRATION36% CR5Top five providers hold well under half revenue overall
AVERAGE CONTRACT VALUE$220,000 annuallyTypical annual service contract cost per facility account
TOP DEPLOYING COUNTRY SHARE24%United States accounts for largest single-country revenue share
INSTALLATION CYCLE LENGTH3 monthsAverage months from contract signing to full commissioning
TURNKEY SYSTEM ATTACH RATE44%Share of new deployments using pre-integrated turnkey systems
CONTRACT RENEWAL RATE83%Share of facilities renewing service contracts each year
Market concentration remains moderate, with the top five providers controlling roughly 36 percent of revenue, reflecting a fragmented landscape spanning global system vendors, national integrators, and boutique retrofit specialists serving specific industry verticals. Engagement cycles run considerably longer than typical equipment purchases because manufacturers validate integration performance against actual production line conditions before committing to full-scale rollout across multiple facilities. This dynamic favors specialists over generalist system integrators entering the category.
Average contract values vary enormously by facility scale and integration complexity, from single-line retrofit projects to enterprise-wide multi-facility system rollouts commanding contract values many times higher per account. Providers increasingly bundle predictive maintenance and remote diagnostics services into system contracts, since manufacturers value proactive downtime prevention as much as pure installation and calibration work when evaluating provider selection.
"Nobody pays for cameras anymore, they pay for the guarantee that the line does not stop for three weeks during the upgrade. The integrators who figured out how to make that promise credible are winning every retrofit bid worth having."
Lead Analyst, Industrial Automation Services Practice · MMA Technology Practice · September 2026

Market Trends

Retrofit Programs Avoid Costly Production Line Stoppages

Manufacturers increasingly demand retrofit programs that swap in AI-enabled vision systems during scheduled maintenance windows rather than accepting the multi-week production halts that full system replacement historically required across an entire manufacturing facility floor. Providers report retrofit service revenue growing over 40 percent faster than new system installation revenue during 2025, confirming the category's outsized momentum among manufacturers reluctant to disrupt existing operations. This shift is reshaping provider staffing models, with integrators increasingly investing in modular retrofit toolkits that reduce on-site installation time considerably compared to legacy custom integration approaches.
Market Impact: Booking lead time reaches 4 months
Turnkey Systems Lower Small Manufacturer Adoption Barrier

Pre-integrated turnkey vision systems, requiring minimal on-site configuration, are letting smaller manufacturers previously priced out of custom integration projects access automated inspection capability for the very first time ever seen in the category's entire history. Turnkey system shipments grew roughly 33 percent in 2025 as more component and system vendors expanded pre-validated product lines targeting this underserved customer segment directly across several manufacturing sectors. This shift is expanding the addressable market beyond large enterprise manufacturers into mainstream small and mid-size manufacturing customers previously unable to justify dedicated integration engineering investment.
Market Impact: Predictive maintenance attach exceeds 55 percent

Market Opportunities and Growth Drivers

Skilled Integrator Labor Shortage Drives Pricing Power

Persistent shortages of experienced vision system integrators, running near 15 percent unfilled positions across major industrial regions in 2025, are letting established providers sustain premium pricing even as customer procurement teams push back against rising installation quotes. Providers with deep bench strength report booking projects three to four months out, considerably longer than the typical scheduling window from just a few years earlier. Manufacturers facing the tightest scheduling constraints are increasingly willing to pay premium rates to secure priority scheduling slots rather than wait for lower-cost competitors with available capacity.
Market Impact: Adds 6 weeks to retrofit timelines

Predictive Maintenance Bundling Expands Service Attach Rate

Providers increasingly bundle predictive maintenance and remote diagnostics capability into system contracts, using sensor telemetry to flag calibration drift and mechanical wear before inspection accuracy actually degrades in active daily production runs. Predictive maintenance attach rates on new system contracts now exceed 55 percent, considerably higher than the attach rate on comparable contracts from just three years earlier when this capability barely existed commercially. This shift is pushing providers to invest heavily in cloud-based monitoring infrastructure that smaller regional integrators historically could not justify building independently for their customer base.
Market Impact: Extends project timelines by 3 months

Market Restraints and Challenges

Legacy Equipment Compatibility Complicates Retrofit Projects

Retrofitting vision systems onto legacy production lines built decades ago often requires custom interface engineering to bridge modern camera and sensor protocols with older programmable logic controllers and mechanical fixturing never designed for digital integration. The root cause is that manufacturing equipment often remains in service for twenty years or more, far outlasting the communication standards and software interfaces prevalent when the equipment was originally installed. Integrators are mitigating this through modular adapter hardware and protocol translation software libraries built specifically for common legacy controller families, a mitigation path that reduces but does not eliminate custom engineering time required.
Market Impact: Retrofit revenue grew 40 percent faster

Skilled Integrator Shortage Limits Provider Capacity

The specialized combination of optical engineering, software development, and manufacturing process knowledge required for machine vision integration work remains scarce relative to overall demand, limiting how quickly established providers can expand capacity to meet backlog growth. The root cause is that few academic programs specifically train this integration skill combination, forcing providers to build expertise primarily through years of on-the-job apprenticeship rather than formal credentialing. Providers are mitigating this by partnering with technical schools on specialized training curricula and by investing in remote diagnostic tools that let fewer engineers support more installed systems simultaneously.
Market Impact: Turnkey shipments grew 33 percent
3 additional market trends, 4 additional growth drivers, and 2 additional restraints and challenges are covered in the full report. Contact sales@marketmindsadvisory.com to access the complete intelligence.

Segment CAGR and Growth Architecture

The machine vision system and services market segments by offering type, spanning turnkey inspection systems, systems integration services, installation and commissioning, calibration and maintenance, training and support, and retrofit and upgrade services, each addressing a distinct stage of the deployment lifecycle. Product life cycles and pricing models vary considerably across these six categories tracked in this analysis.
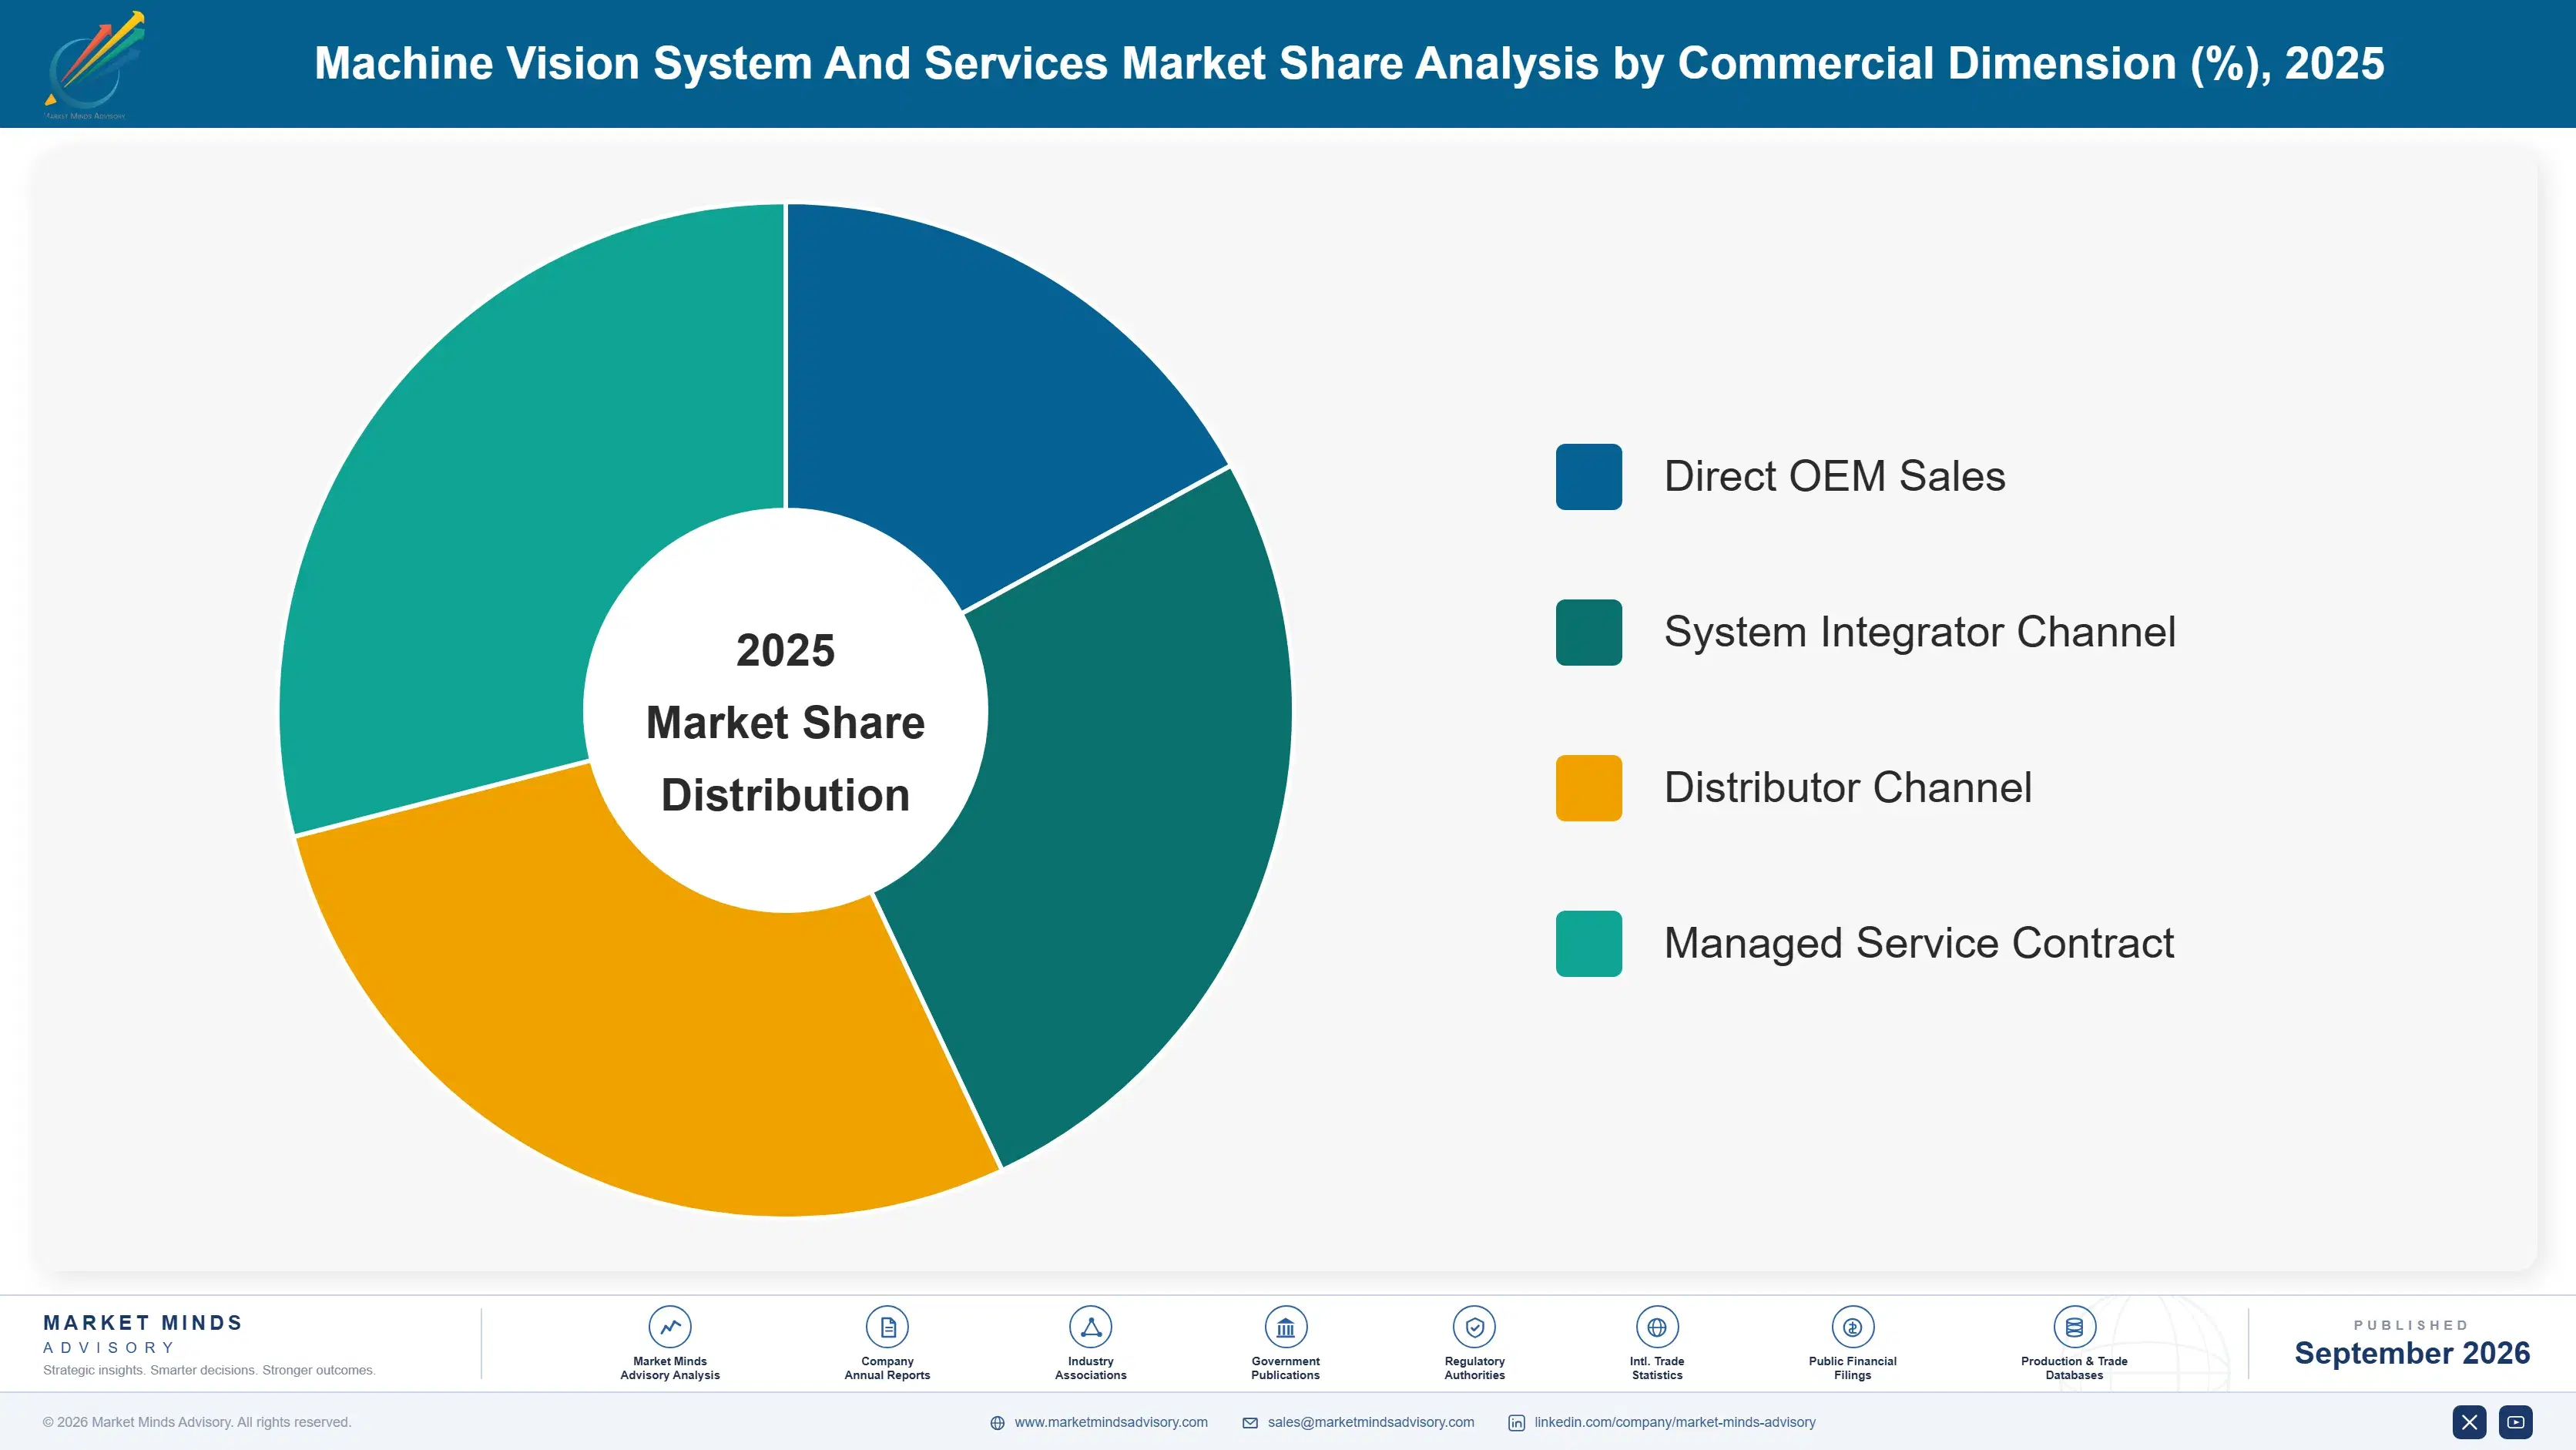
machine-vision-system-and-services-market-market-share-analysis-1788421085966

Retrofit and Upgrade Services

Retrofit and upgrade services replace legacy vision components on existing production lines with modern AI-enabled systems, typically performed during scheduled maintenance windows rather than requiring dedicated production stoppage for the conversion project itself. This segment is growing fastest because manufacturers increasingly refuse to accept the multi-week downtime full system replacement historically required, unlike new installations that already occur on greenfield production lines without competing operational constraints. Providers have invested heavily in modular retrofit toolkits and pre-engineered adapter hardware that shorten on-site installation time considerably, lowering the barrier that historically limited retrofit projects to only the most patient manufacturing customers. Pricing for this segment carries a meaningful premium over conventional new-installation projects given the added engineering complexity required.
CAGR 13.5%

Turnkey Inspection Systems

Turnkey inspection systems arrive pre-integrated and pre-validated by the vendor, requiring only facility-specific mounting and basic configuration rather than the extensive custom integration engineering that bespoke systems traditionally required from specialized integrators. Growth is strong as smaller manufacturers increasingly demand automated inspection capability without the engineering overhead and project risk that custom integration projects historically carried. Manufacturers increasingly demand turnkey systems that integrate directly with existing manufacturing execution systems, letting inspection results flow into production quality databases without requiring additional custom software development work. Several major equipment manufacturers have already standardized on specific turnkey platforms for their global distribution networks and customer bases. Adoption keeps broadening steadily each year across most industry verticals.
CAGR 11.5%
Full segment breakdown across 7 segments available in the complete report.

Regional Architecture and Country Demand Map

North America leads systems and services revenue given higher labor-cost delivery economics for on-site integration work performed nationwide, while East Asia retains the largest installed factory base requiring integration, and South Asia and Pacific posts the fastest regional growth off a comparatively smaller current base.

North America

Major systems integrators and service providers headquartered in the United States drive this region's leading revenue share, serving automotive, aerospace, and semiconductor manufacturers facing the strictest quality and traceability requirements. Higher domestic labor costs for skilled integration engineers translate directly into higher per-project revenue recognition compared to lower labor-cost regions delivering comparable installation work. Canada contributes a smaller but growing deployment base tied to shared North American automotive and aerospace supply chains. The region's growth rate slightly outpaces the global average as retrofit programs expand across an aging domestic manufacturing base. Financing structures common in this market let mid-size manufacturers join without heavy balance sheet strain during upgrade cycles. This baseline demand remains steady each budget cycle.
Share: 30% | CAGR: 9.5% (2026 to 2036)

Western Europe

Germany's automotive and industrial automation sector anchors this region's system and services demand, particularly for Industry 4.0-aligned retrofit projects tied to precision manufacturing requirements across the country. France and the United Kingdom contribute meaningful aerospace and pharmaceutical integration demand tied to strict regulatory validation requirements in those industries specifically. The region hosts a mature systems integration culture with established regional specialists serving specific industry verticals rather than broad generalist providers. The region's growth trails North America and East Asia as retrofit demand has already matured relative to newer adoption cycles emerging in developing manufacturing markets. Nordic countries add modest additional demand tied to their own strong industrial automation cultures and standards.
Share: 21% | CAGR: 7.0% (2026 to 2036)
Regional intelligence for 5 additional markets available in the complete report: East Asia, South Asia and Pacific, Latin America, Middle East and Africa, Eastern Europe. Contact sales@marketmindsadvisory.com.
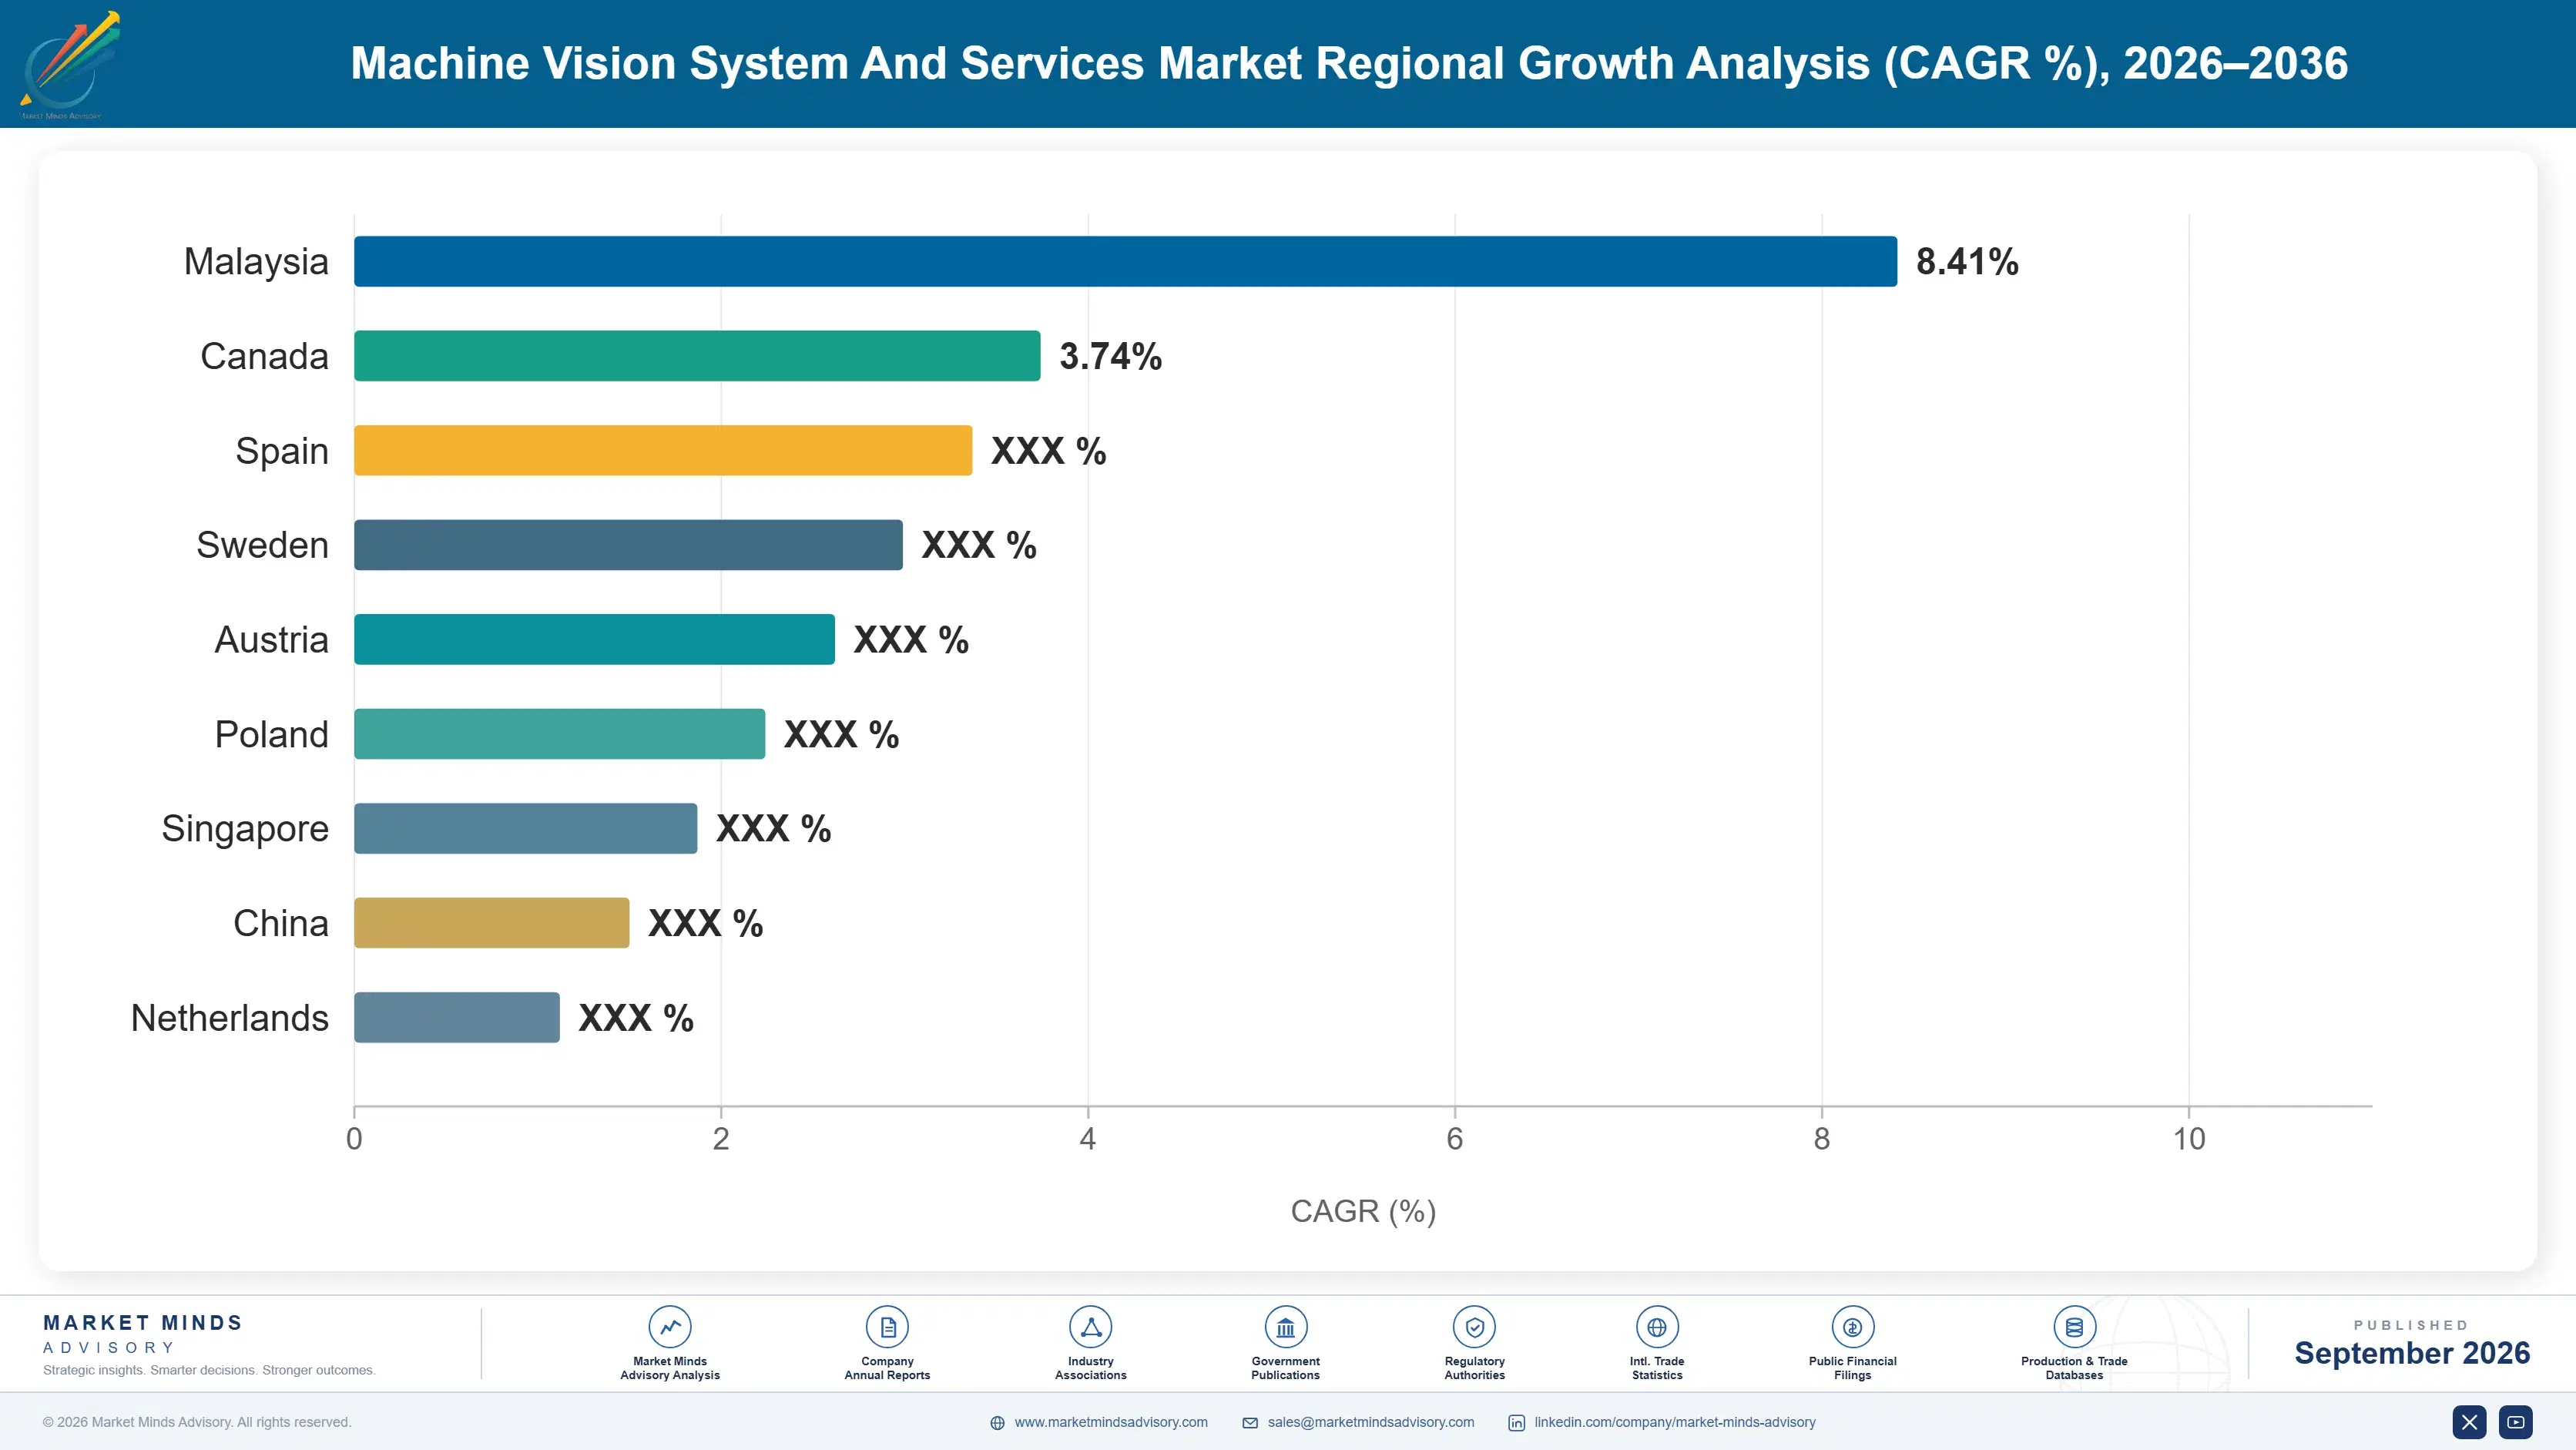
machine-vision-system-and-services-market-country-cagr-analysis-1788421086508

Where Integrator Margins Concentrate Fastest

Provider profitability increasingly concentrates in predictive maintenance subscriptions and retrofit specialization rather than one-time installation fees, as leading integrators bundle remote diagnostics and cloud analytics into multi-year facility contracts that reduce reliance on project-based revenue. This shift rewards the deepest retrofit engineering expertise. Fewer providers compete effectively across every one of these dimensions simultaneously today.

Bundling Predictive Maintenance Into System Contracts

Providers that bundle predictive maintenance monitoring directly into system contracts capture recurring subscription revenue that persists across a facility's entire equipment lifecycle rather than selling a one-time installation project alone. This shifts provider economics toward a services-attached model that scales naturally as customer facility counts grow over time. Providers report predictive maintenance attach rates now averaging 55 percent of new system contracts, a figure growing steadily as manufacturers recognize the value of proactive downtime prevention over reactive service calls. Providers extend this model to smaller facilities each year as monitoring infrastructure standardizes.
Market Impact: Predictive maintenance now reaches roughly 55 percent overall

Charging Retrofit Premium For Legacy Compatibility Work

Providers with proven legacy equipment compatibility expertise capture meaningful pricing premiums for retrofit projects, since manufacturers value providers who can demonstrate a track record navigating older programmable logic controllers and mechanical fixturing without production disruption. This retrofit expertise requires specialized protocol translation knowledge that most new-installation-focused providers have historically lacked, creating differentiation opportunity. Retrofit-specialized providers report project margins averaging 20 percent higher than providers handling only new-installation work on greenfield production lines. Few competitors possess comparable legacy protocol expertise across as many controller families, vendor generations, and installed equipment vintages today.
Market Impact: Retrofit specialists now earn a 20 percent more

Expanding Cloud Analytics Dashboards For Enterprise Accounts

Providers offering cloud-based analytics dashboards that aggregate defect and downtime data across a customer's entire multi-facility network command meaningfully higher enterprise contract values than providers selling single-facility service agreements alone. This capability requires specialized data infrastructure investment that most installation-focused providers have historically lacked, creating a genuine differentiation opportunity for firms willing to build this analytics layer. Enterprise multi-facility contracts now average roughly 2.8 times the contract value of single-facility service agreements, rewarding providers that invest early in this reporting architecture. Few competitors possess comparable multi-tenant reporting depth to compete confidently here.
Market Impact: Multi-facility deals now average roughly 2.8 times value

Offering Financing For Smaller Manufacturer Retrofit Projects

Providers offering flexible financing structures that spread retrofit project costs across monthly operating budgets rather than large upfront capital commitments are capturing smaller manufacturers previously priced out of full system modernization. This financing approach lowers the barrier to entry meaningfully for regional manufacturers competing against larger national operations on automation sophistication and quality consistency. Roughly 28 percent of new retrofit contracts signed in 2025 used this subscription financing structure, expanding the addressable customer base considerably beyond the largest enterprise manufacturers alone. Adoption keeps accelerating among smaller regional manufacturers each quarter.
Market Impact: Roughly 28 percent of new retrofit contracts financed

Who Controls the Margin Pool

Competitive concentration sits at a low 36 percent CR5, reflecting an even more fragmented landscape than the underlying component market, since integration expertise varies considerably by industry vertical and legacy equipment familiarity. Participants are evaluated here on revenue, the most commercially consistent basis across providers with very different business models. The gap between Cognex, the clear leader through its systems division, and the fifth-ranked competitor remains moderate.
Current activity centers on retrofit specialization, as providers race to build modular adapter toolkits fast enough to serve manufacturers seeking to avoid production line replacement disruption. Several providers have also expanded predictive maintenance subscription offerings, bundling remote diagnostics into system contracts rather than selling one-time installation projects alone. Cloud analytics dashboard investment has intensified as providers seek enterprise account differentiation.

Emerging pressure is coming from robot manufacturers bundling vision integration services directly into automation cell sales, threatening standalone integrators that built their entire business on independent camera and sensor installation work. This threatens established providers' pricing power in simpler installation projects specifically. Rankings are most likely to shift as retrofit engineering depth, not raw installation capacity, increasingly determines which providers win the largest manufacturing accounts.
machine-vision-system-and-services-market-company-positioning-matrix-1788421087119

Competitive Moat and Risk Dimensions

COGNEX CORPORATION

Moat: Broadest Systems Integration Service Reach

Cognex's systems division combines proprietary hardware with established global service infrastructure, letting it serve multinational manufacturers with a single vendor relationship spanning multiple facilities and countries simultaneously. This breadth reduces coordination overhead for large enterprise clients who would otherwise need to manage separate regional integrators across different manufacturing sites and support contracts.
COGNEX CORPORATION

Risk: Premium Pricing Limits Facility Reach

Cognex's premium pricing structure, reflecting its broad service infrastructure, sometimes prices out smaller facilities who cannot justify the platform's full service cost relative to their limited production line count and integration complexity needs, creating an opening for lower-cost regional providers to win early customer relationships.
ISRA VISION AG

Moat: Deep European Industrial Automation Relationships

ISRA VISION has built extensive relationships with European industrial automation customers over decades of engagements with major automotive and metals manufacturers, giving it credibility that newer entrants struggle to establish quickly in these markets. This vertical depth continues expanding as the company accumulates more application-specific engineering expertise each year across product generations.
ISRA VISION AG

Risk: Limited Scale Versus Global Competitors

As a smaller specialist relative to broader global competitors, ISRA VISION faces real constraints scaling service capacity quickly enough to serve the largest multinational manufacturing accounts without straining its regional engineering resources during peak demand periods across many simultaneous client engagements and every contract renewal.

Players Tracked

Prominent Players

Cognex Corporation
ISRA VISION AG
FANUC Corporation
SICK AG
Siemens Digital Industries

Other Key Players

ABB Robotics
Festo SE
Bosch Rexroth AG
Rockwell Automation
Yaskawa Electric Corporation
Universal Robots A/S
Recognition Robotics Inc
Aptura Machine Vision
Applied Vision Corporation
Perceptron Inc
Vitronic GmbH
Qualitest Group
Innovatia Automation
Retrotech Solutions
Elunic AG

Recent Developments

APRIL 2026

Cognex Launches Modular Retrofit Toolkit Program

Cognex launched a new modular retrofit toolkit program designed to shorten on-site installation time for manufacturers upgrading legacy inspection lines to AI-enabled systems. The launch responds directly to customer demand for retrofit programs that avoid the extended production stoppages full system replacement historically required across facilities.
Signal: Signals that leading providers are now actively racing to reduce retrofit installation friction meaningfully across accounts.
NOVEMBER 2025

FANUC Wins Automotive Battery Line Integration Contract

FANUC secured a brand-new multi-year systems integration contract with a major electric vehicle manufacturer to provide vision-guided robotics and full inspection coverage across several battery production facilities opening soon this year. The contract covers multiple manufacturing sites across the customer's expanding global battery production footprint.
Signal: Signals that electric vehicle battery manufacturing is now actively expanding demand for integrated vision robotics systems.
FEBRUARY 2026

SICK Acquires Predictive Maintenance Software Startup

SICK AG acquired a smaller predictive maintenance software startup specializing in vision system telemetry analytics, adding entirely new capability to its existing sensor hardware and integration services portfolio and roadmap. The acquisition strengthens SICK's ability to compete against integrators expanding into recurring analytics subscription revenue streams.
Signal: Signals that established hardware providers are now actively building analytics capability through targeted acquisition deals strategically.

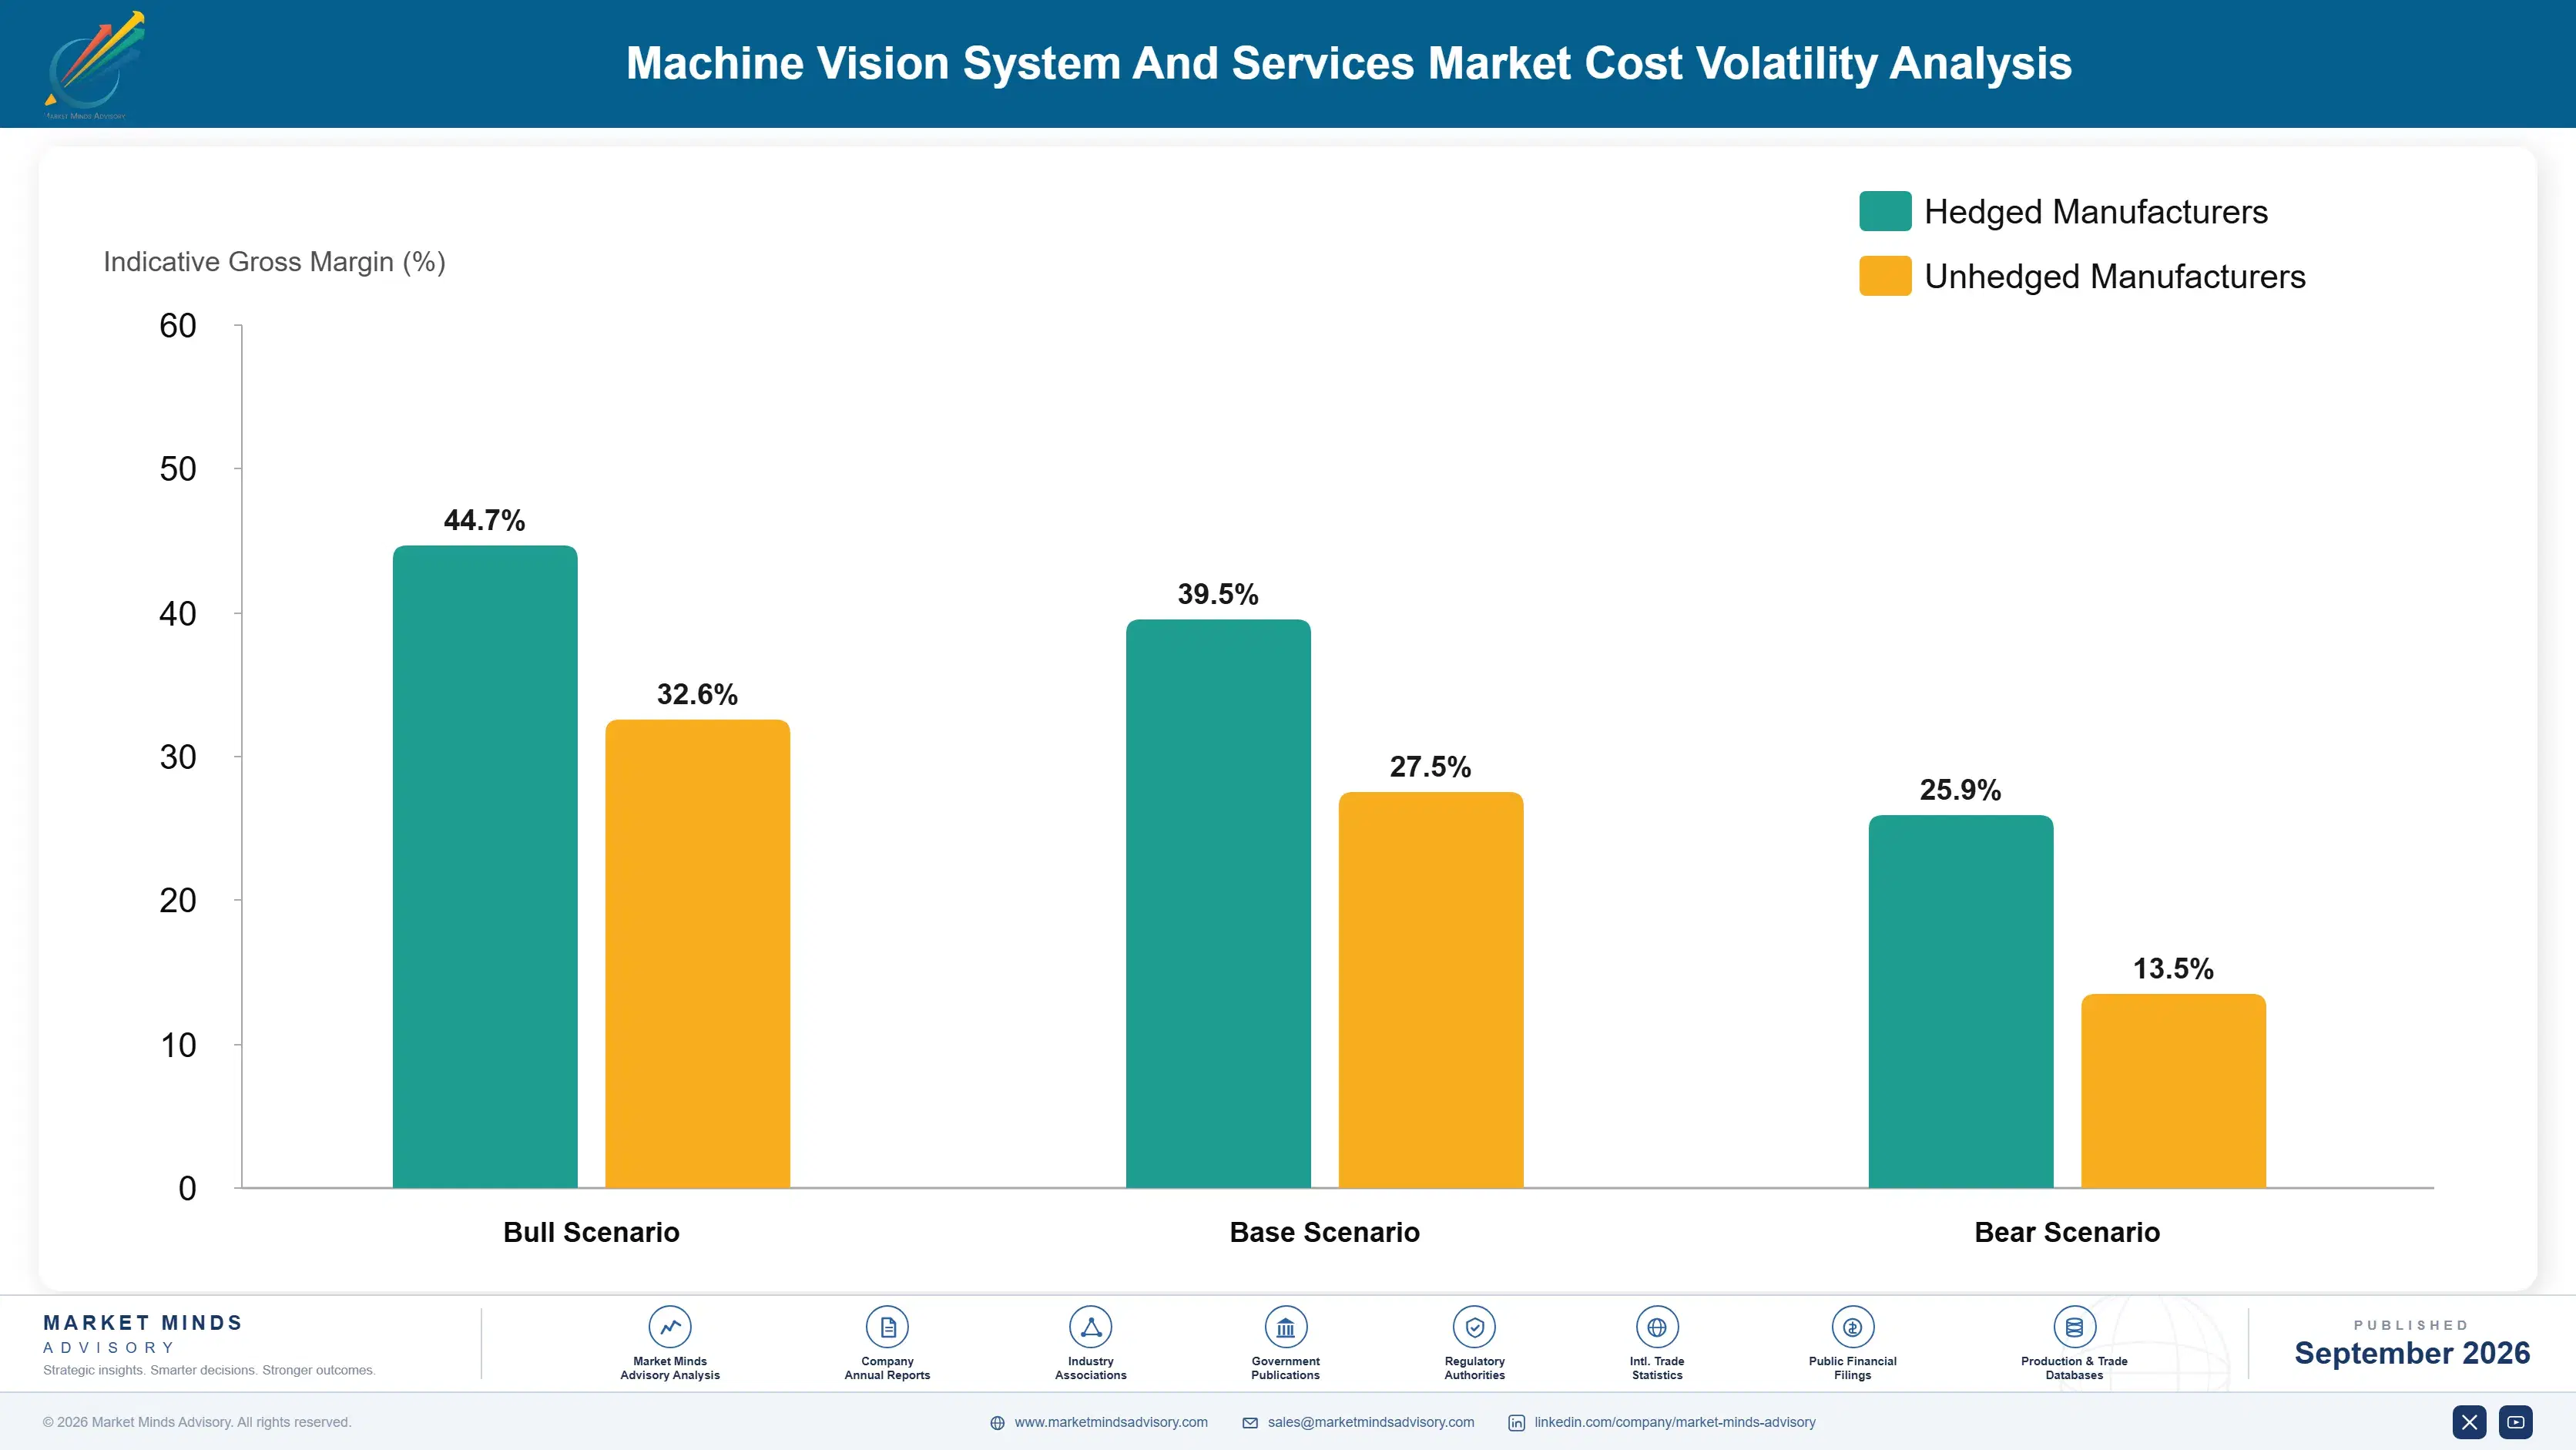
Skilled Integration Engineer Labor Cost

Skilled integration engineering labor accounts for roughly 60 percent of total service delivery cost for machine vision system providers, reflecting the specialized combination of optics, software, and manufacturing process knowledge required for each retrofit or installation project. Component and hardware costs make up most of the remainder, passed through from upstream camera and sensor suppliers.
Skilled integration engineer compensation rose meaningfully during 2024 and into 2025 as providers competed intensely for experienced staff capable of handling increasingly complex retrofit projects involving legacy equipment, a trend documented across provider annual reports and industry compensation surveys conducted this year. This compressed gross margins for smaller providers unable to match the compensation packages that larger, better-capitalized competitors could offer to retain their most experienced integration engineers.

Providers without efficient remote diagnostic tools face a meaningful competitive disadvantage as talent costs keep rising, since manual on-site troubleshooting requires considerably more engineer travel time than remote monitoring workflows built for distributed facility support. This exposure varies by provider scale: larger providers like Cognex can invest in proprietary remote diagnostic platforms that smaller specialists simply cannot afford to build at comparable depth and reliability.
machine-vision-system-and-services-market-cost-volatility-analysis-1788421087328

Building Remote Diagnostic Support Infrastructure

Leading providers now invest heavily in remote diagnostic platforms that let engineers troubleshoot installed systems without traveling on-site, reducing dependence on expensive additional integration engineer headcount for routine support tasks across most customer accounts. This infrastructure requires meaningful upfront engineering investment before reducing ongoing travel and labor cost, a trade-off only well-capitalized providers can consistently afford.

Partnering With Technical Schools For Talent Pipeline

Providers are building recruiting partnerships with technical and vocational schools to develop a pipeline of integration engineers familiar with manufacturing process terminology and vision system workflows already in place. This partnership approach reduces recruiting cost meaningfully but requires sustained relationship investment that smaller providers sometimes struggle to prioritize against more immediate service delivery needs.

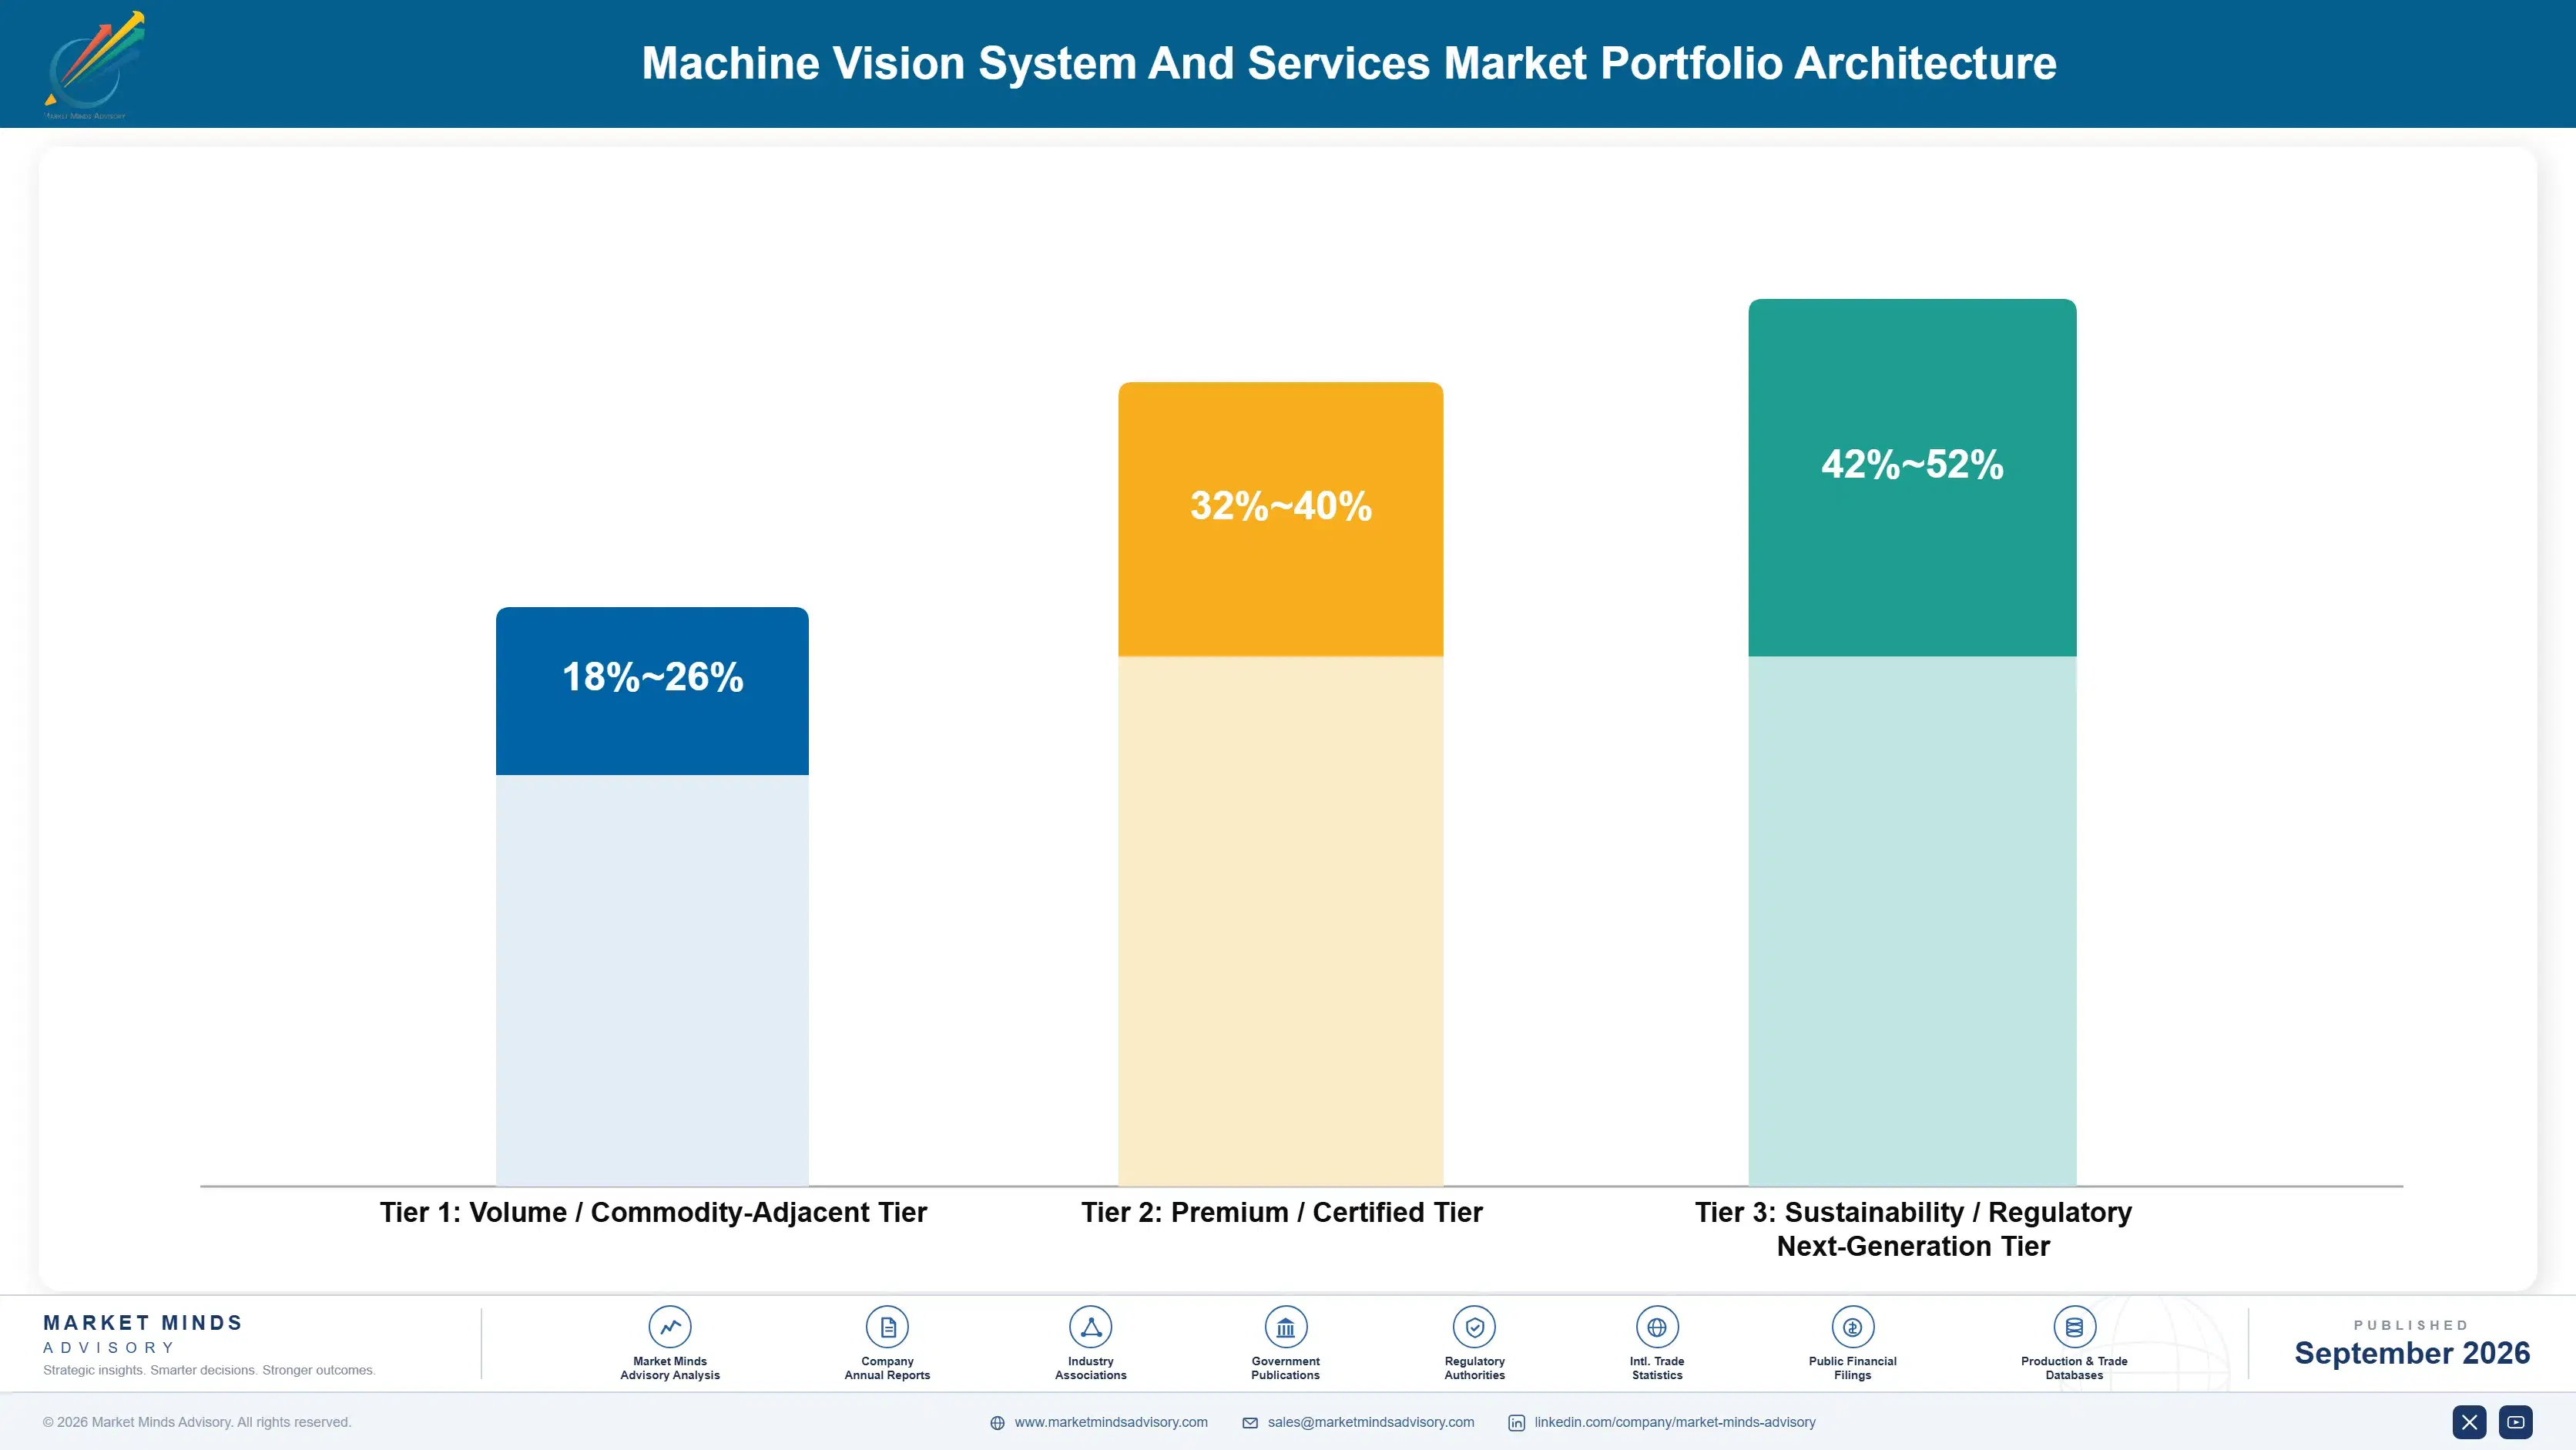
Portfolio Architecture for Margin Defence

Portfolio economics split across three tiers running from commodity installation projects sold near competitive service pricing up through certified vertical-specific integration and next-generation retrofit programs bundled with predictive maintenance subscriptions. Gross margin widens considerably moving up this ladder, since retrofit expertise and analytics depth create defensibility that pure installation labor alone cannot provide. Investors increasingly value providers by their revenue mix across these three tiers.
Volume tier services compete almost entirely on project price and delivery speed, leaving providers with thin margins that depend on scale to remain profitable across large numbers of smaller installation engagements. Premium tier services instead compete on vertical expertise and reference credentials, letting providers charge meaningfully more per engagement while facing far less price pressure during contract renewal negotiations. This tension shapes capital allocation across every provider's roadmap.

High-value margin pools concentrate almost entirely in the next-generation tier, where retrofit services bundled with predictive maintenance generate premium recurring revenue unavailable to providers still selling standalone installation projects. Providers positioned only in the volume tier face real profitability ceilings that next-generation-tier competitors do not share, regardless of project volume signed across any given fiscal year of operation.

Volume / Commodity-Adjacent Tier

Commodity installation and calibration services sold mainly to smaller manufacturers prioritizing project cost over vendor reputation, competing largely on delivery speed against several established suppliers operating at meaningful scale nationwide.
Gross Margin: 18-26%

Premium / Certified Tier

Certified vertical-specific integration services tailored to stricter regulatory requirements than generic engagements, commanding premium pricing from customers requiring deep industry expertise and strong reference credentials from many prior client engagements.
Gross Margin: 32-40%

Sustainability / Regulatory / Next-Generation Tier

Next-generation retrofit programs bundled with predictive maintenance subscriptions, positioned for large enterprise customers prioritizing guaranteed uptime and recurring risk reduction well above pure project cost considerations entirely each contract cycle.
Gross Margin: 42-52%
machine-vision-system-and-services-market-portfolio-architecture-1788421087858

High-value Sub-segments and Strategic Watch-out

Retrofit and Upgrade Services

Retrofit and upgrade services sit in the high-value high-growth quadrant, combining the fastest revenue growth rate tracked with the widest gross margin band once predictive maintenance premiums layer on top of installation pricing, making it the clearest priority for provider capital allocation across this entire decade of investment.
Gross Margin: 42-52%

Turnkey Inspection Systems

Turnkey inspection systems occupy the high-value moderate-growth quadrant, generating strong per-project margin from pre-validated system sales even though growth trails retrofit services, because turnkey adoption still requires manufacturers to accept standardized configurations rather than the fully custom engineering approaches tailored to each very specific need.
Gross Margin: 32-40%

Systems Integration Services

Systems integration services remain the volume core segment, generating the bulk of current project shipments at thinner margins, still essential for provider scale economics even as growth slows relative to retrofit and turnkey alternatives entering the category more aggressively with each successive contract cycle today.
Gross Margin: 18-26%

Training and Support Services

Training and support services form the strategic watch-out segment, facing real commoditization risk as broader system contracts increasingly bundle basic training natively at no added cost today, threatening standalone providers that never expanded beyond simple documentation and classroom instruction into much richer categories over time.
Gross Margin: 18-24%

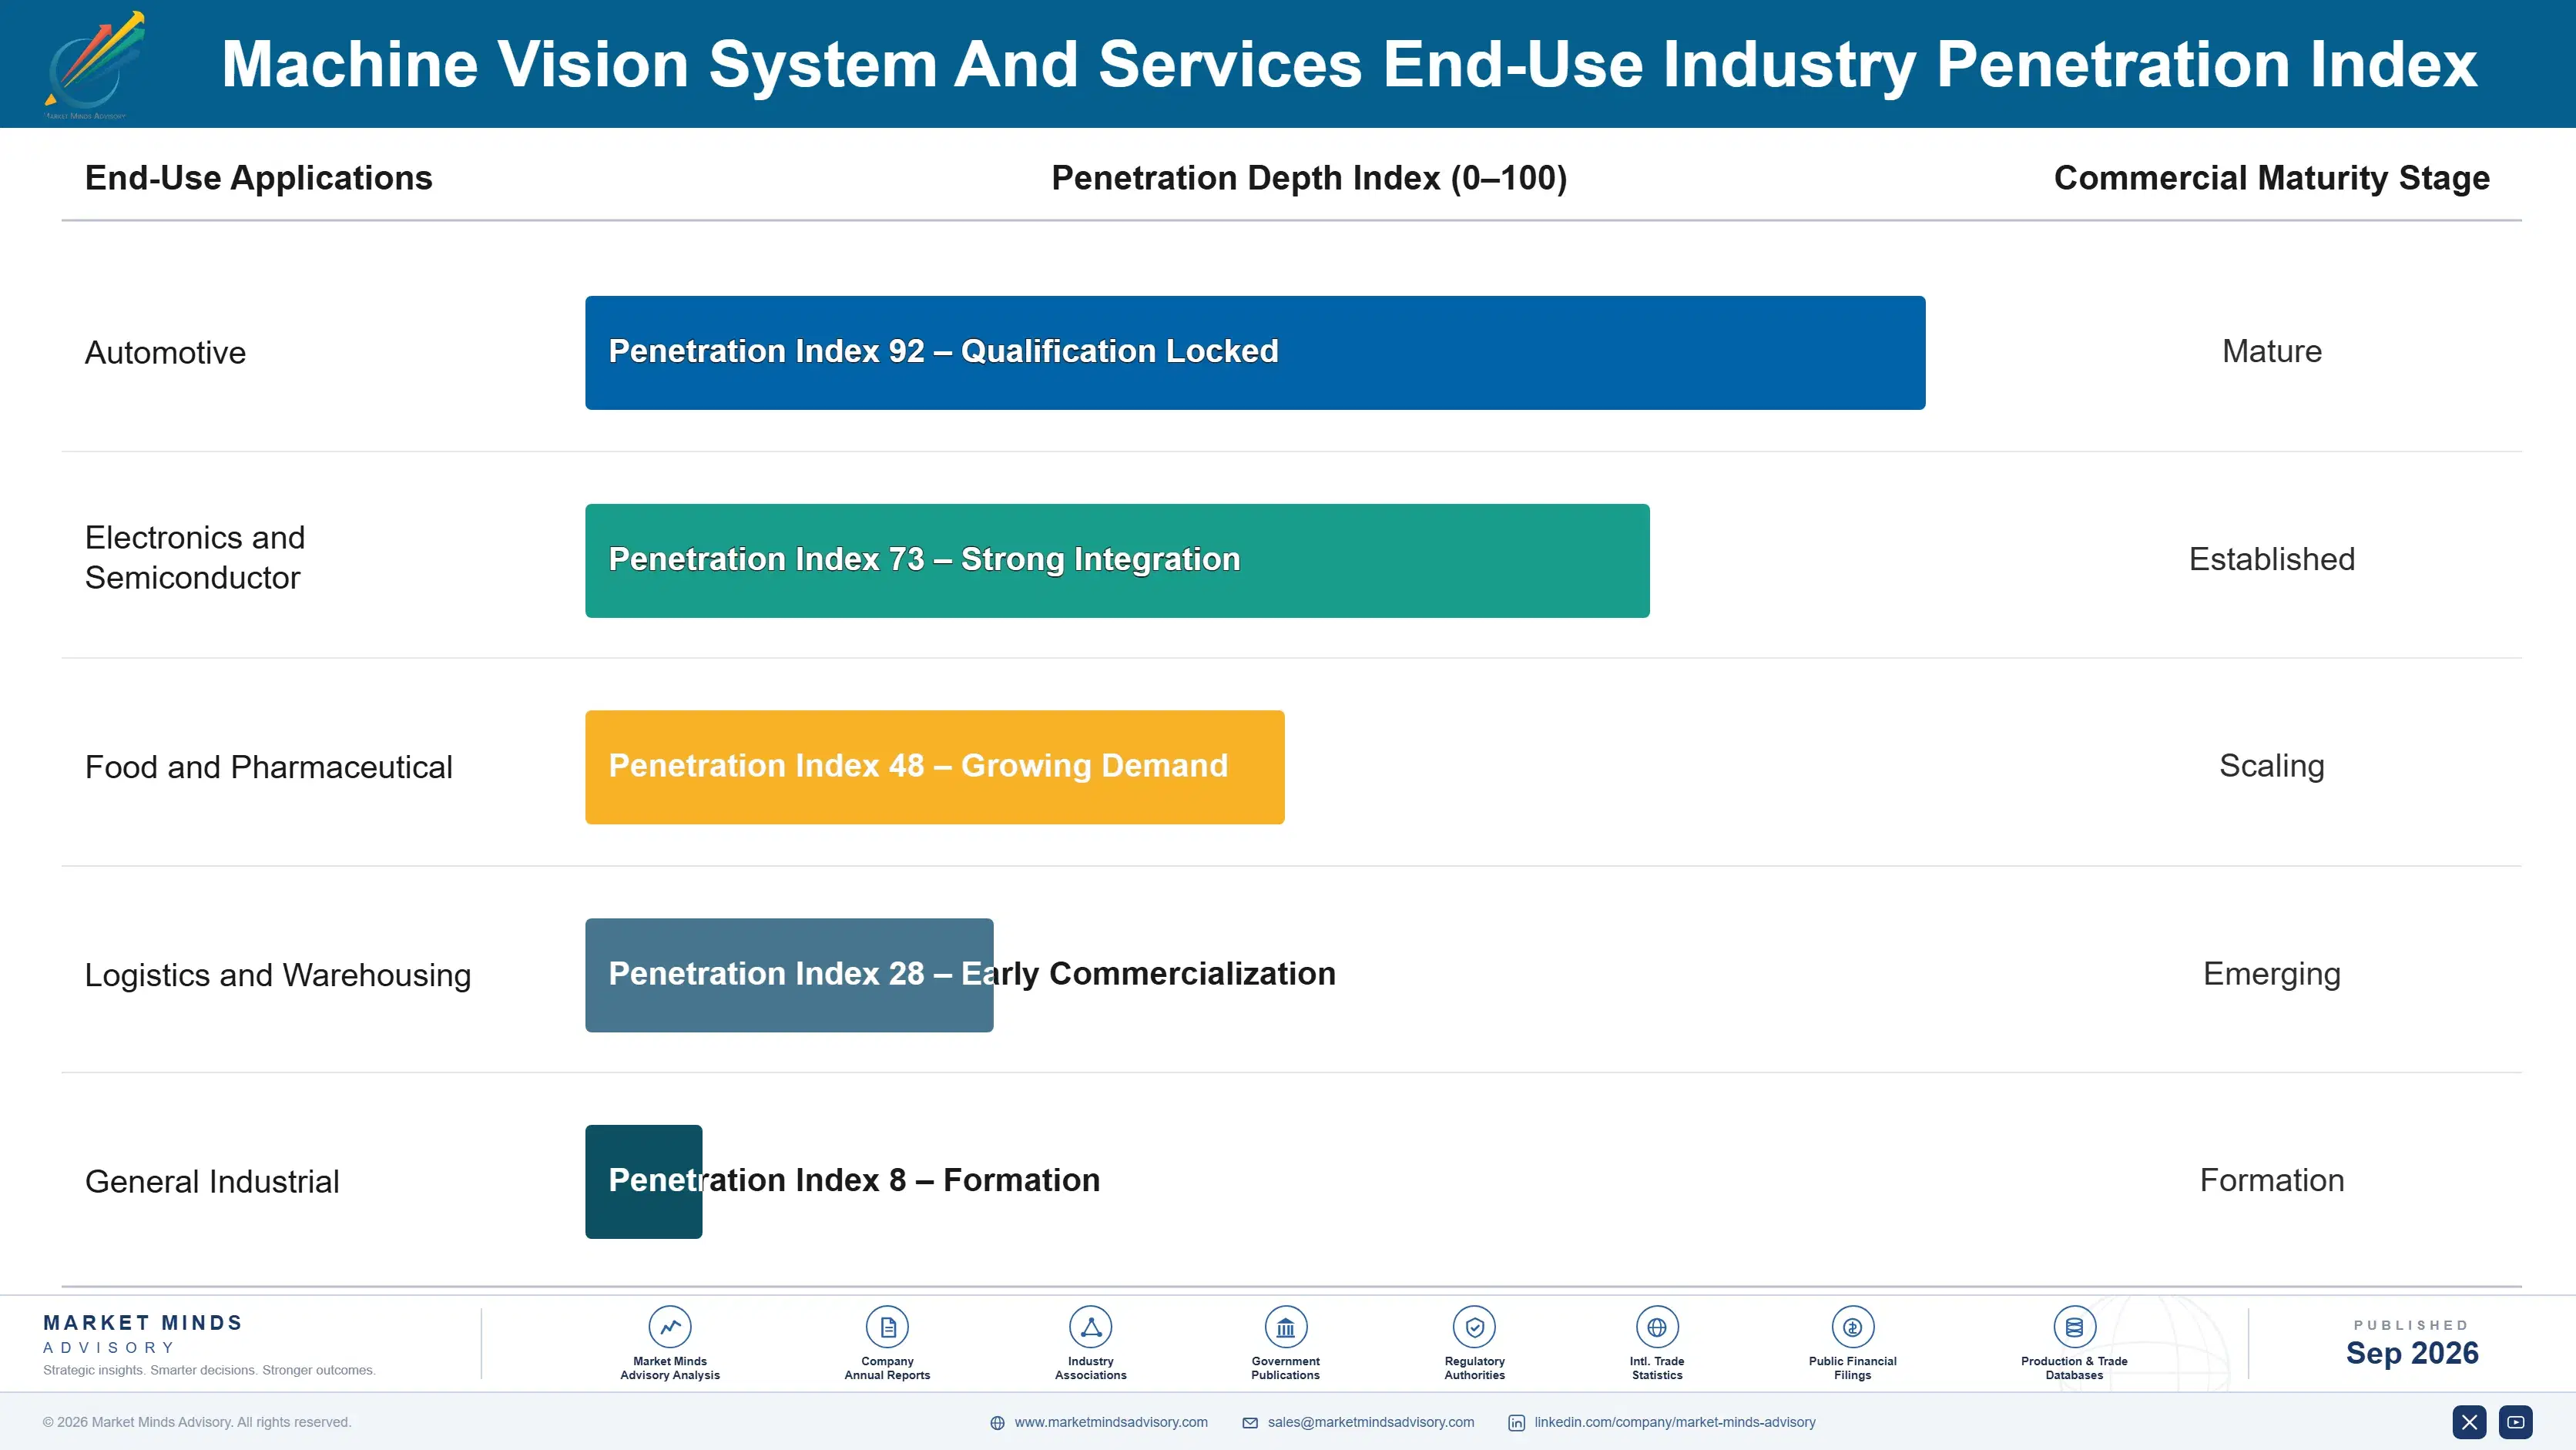
Bundled Contracts Extend Integrator Client Relationships

Providers increasingly bundle predictive maintenance, remote diagnostics, and software update subscriptions into system contracts, converting what was once a project-based installation fee into a longer-tail relationship spanning a facility's entire equipment lifecycle. This bundled model gives providers recurring revenue visibility through service renewal rather than relying entirely on the initial installation project fee. Investors increasingly value providers on this recurring service revenue mix rather than initial project count alone.
Adoption depth varies sharply by industry vertical: automotive and semiconductor manufacturers commit to multi-year service contracts and rarely switch providers once integration with production line control systems is complete, while smaller general manufacturing customers remain more price-sensitive at each contract renewal decision point. Pharmaceutical customers sit between these extremes, valuing regulatory validation over pure unit cost considerations. This tension shapes provider capacity allocation priorities across every major client segment served.

Buyer profiles are shifting generationally as plant automation engineers, rather than traditional maintenance supervisors, increasingly drive provider selection given growing emphasis on data integration with manufacturing execution systems alongside pure installation quality. This generational shift is reshaping which service capabilities providers prioritize, favoring remote diagnostics and predictive analytics over the reactive on-site service calls that historically dominated the industry.
machine-vision-system-and-services-market-end-use-penetration-index-1788421088346

Where Vision Integrators Should Focus Now

These are among the four positions where our research anticipates prominent divergence between winners and laggards over the coming forecast period. Each is grounded in the demand model, the regulatory perimeter, and the announced capacity pipeline.
01 / RETROFIT ENGINEERING INVESTMENT

Build Retrofit Engineering Capability Before Backlogs Consolidate

Providers still focused primarily on new-installation projects are missing the fastest-growing opportunity in the industry, since retrofit service revenue is growing over 40 percent faster than new system installation revenue across most manufacturing sectors tracked this year and every quarter since. Providers with early retrofit engineering investment are capturing manufacturer relationships that competitors focused on greenfield installation cannot match today. Providers slow to build this capability risk ceding the highest-growth customer segment entirely to faster-moving competitors within the next two engagement cycles.
02 / PREDICTIVE MAINTENANCE BUNDLING

Bundle Predictive Maintenance Into Every New System Contract

Providers without predictive maintenance bundling are missing attach rates that now exceed 55 percent of new system contracts, a gap that keeps widening as manufacturers demand proactive downtime prevention over reactive service calls across nearly every industry vertical served. Providers offering this capability are capturing recurring subscription revenue that persists across a facility's entire equipment lifecycle rather than ending at project completion. Providers should prioritize this bundling now, since renewal economics increasingly determine long-term provider profitability more than initial project wins alone.
03 / LEGACY COMPATIBILITY SPECIALIZATION

Specialize In Legacy Compatibility Before Rivals Build Expertise

Providers without proven legacy equipment compatibility expertise are missing pricing premiums averaging 20 percent above providers handling only new-installation work on greenfield production lines built entirely without any legacy equipment constraint whatsoever to navigate. Providers with established protocol translation knowledge are capturing retrofit projects that generalist competitors simply cannot execute reliably without extended engineering delays and rework. Providers should invest in this specialization now, since manufacturing equipment routinely remains in service for twenty years or more across most industrial facilities worldwide.
04 / CLOUD ANALYTICS DEVELOPMENT

Build Multi-Facility Analytics Before Enterprise Accounts Consolidate

Providers without cloud-based analytics dashboards are missing enterprise multi-facility contracts that now average roughly 2.8 times the contract value of single-facility service agreements, a gap that keeps widening meaningfully with each successive contract renewal cycle across the industry. Plant automation engineers increasingly drive purchasing decisions and want network-wide performance benchmarking that isolated facility-level reporting simply cannot provide today or in the near future. Providers should invest in scalable multi-tenant reporting architecture now, before competitors consolidate the largest enterprise accounts entirely across the industry.

Engagement Snapshot From the Field

A live engagement with an industry participant carrying material or product regulatory and market exposure ahead of a defining policy shift, showing how our research translates into a defensible multi-year portfolio strategy.
MARKET MINDS ADVISORY · CLIENT ENGAGEMENT SUMMARY
Machine Vision System And Services Producer Strategic Portfolio Review and Transition Roadmap 2026·Investment Scenario on Machine Vision System And Services Exposure Evaluation 2025-26
CLIENT PROFILE
The client operates six stamping and assembly plants across the midwestern United States supplying major automotive OEM customers, running legacy two-dimensional inspection systems installed over a decade ago that increasingly struggle to catch subtle dimensional defects on newer part geometries. Facing rising OEM quality requirements, leadership needed a framework for evaluating retrofit versus full replacement. Annual revenue was reported at approximately 620 million dollars (client-reported, unverified by MMA).
STRATEGIC CHALLENGE
Leadership faced a choice between a full system replacement requiring extended production downtime and a retrofit program preserving existing mechanical fixturing while upgrading only cameras and inspection software components entirely across all facilities. Operations teams worried about defect detection reliability during any transition period given tight OEM delivery schedules and contractual penalties.
MMA APPROACH
MMA conducted a comparative downtime and total cost of ownership assessment across both approaches, incorporating primary interview data on retrofit project outcomes from comparable automotive stamping plants that had already completed similar upgrades. The analysis modeled production disruption risk across all six plant locations. Findings were presented to the client's operations committee alongside a recommended retrofit sequencing plan.
KEY FINDINGS
  1. The retrofit approach delivered meaningfully lower total downtime cost than full replacement despite requiring more careful legacy fixturing compatibility engineering work upfront.
  2. Plants that retrofitted during already-scheduled maintenance windows reported near-zero incremental production disruption compared to plants requiring entirely dedicated downtime for the upgrade.
  3. Retrofit vendor selection correlated closely with prior experience on the client's specific legacy controller family, confirming vendor experience as a critical selection factor.
  4. Sequencing retrofits from the least to most complex plant meaningfully reduced the client's overall program risk and improved vendor learning curve efficiency.
CLIENT PROFILE
The client operates six stamping and assembly plants across the midwestern United States supplying major automotive OEM customers, running legacy two-dimensional inspection systems installed over a decade ago that increasingly struggle to catch subtle dimensional defects on newer part geometries. Facing rising OEM quality requirements, leadership needed a framework for evaluating retrofit versus full replacement. Annual revenue was reported at approximately 620 million dollars (client-reported, unverified by MMA).
STRATEGIC CHALLENGE
Leadership faced a choice between a full system replacement requiring extended production downtime and a retrofit program preserving existing mechanical fixturing while upgrading only cameras and inspection software components entirely across all facilities. Operations teams worried about defect detection reliability during any transition period given tight OEM delivery schedules and contractual penalties.
MMA APPROACH
MMA conducted a comparative downtime and total cost of ownership assessment across both approaches, incorporating primary interview data on retrofit project outcomes from comparable automotive stamping plants that had already completed similar upgrades. The analysis modeled production disruption risk across all six plant locations. Findings were presented to the client's operations committee alongside a recommended retrofit sequencing plan.
KEY FINDINGS
  1. The retrofit approach delivered meaningfully lower total downtime cost than full replacement despite requiring more careful legacy fixturing compatibility engineering work upfront.
  2. Plants that retrofitted during already-scheduled maintenance windows reported near-zero incremental production disruption compared to plants requiring entirely dedicated downtime for the upgrade.
  3. Retrofit vendor selection correlated closely with prior experience on the client's specific legacy controller family, confirming vendor experience as a critical selection factor.
  4. Sequencing retrofits from the least to most complex plant meaningfully reduced the client's overall program risk and improved vendor learning curve efficiency.
RECOMMENDED STRATEGY
Phase 1: Phase 1 (Months 1 to 2): Retrofit the least complex plant first during an already-scheduled maintenance window this quarter alone. Phase 2: Phase 2 (Months 3 to 7): Retrofit the remaining five plants in sequence, applying lessons learned from the first plant. Phase 3: Phase 3 (Months 8 to 10): Validate inspection accuracy improvements against OEM quality benchmarks across all six client plant locations.
OUTCOME
The client completed retrofit across all six plants within the recommended ten-month timeline, avoiding an estimated 3.4 million dollars (client-reported, unverified by MMA) in downtime costs compared to full system replacement. Defect detection accuracy improved measurably, and OEM quality audit scores rose meaningfully across all locations.

Frequently Asked Questions

Foundational context covering the market sizes, CAGR, scope, country, region and competition that inform every finding below. This section is provided to cover basics and most often pre-purchase conversations, answered from the MMA Primary Research Dataset.

What is the current size of the Machine Vision System And Services Market?

The machine vision system and services market reached approximately 10.63 billion dollars in 2026, according to MMA Primary Research Dataset, July 2026. This figure covers turnkey systems, integration, and retrofit service revenue combined globally.

How large will the Machine Vision System And Services Market be by 2036?

MMA projects the market will reach approximately 24.03 billion dollars by 2036 under the base case scenario. That represents roughly a 2.26 times expansion over the ten-year forecast period from 2026 through 2036.

What is the CAGR for the Machine Vision System And Services Market 2026 to 2036?

The base case compound annual growth rate is 8.5 percent through 2036. Bull and bear scenarios range from 9.8 percent to 7.3 percent depending on retrofit demand and turnkey simplification trends.

Which segment is growing fastest?

Retrofit and upgrade services are growing fastest at 13.5 percent CAGR, roughly 1.59 times the overall market rate. Manufacturer reluctance to accept extended production stoppages is driving this segment's outsized expansion versus new system installation.

Who are the major companies in the Machine Vision System And Services Market?

Leading companies include Cognex Corporation, ISRA VISION AG, FANUC Corporation, SICK AG, and Siemens Digital Industries. These five players hold a combined 36 percent share on a revenue basis.

Which country is growing fastest?

India is growing fastest at approximately 12.5 percent CAGR, driven by a rapidly expanding electronics and automotive manufacturing sector professionalizing quality control practices. This outpaces the United States and other mature service markets considerably.

Report Segmentation Architecture

The full report scope spans multiple orthogonal segmentation dimensions, with cross-tabulated demand data provided for each dimension pair. Coverage extends further to regional breakdowns, trend trajectories, and the competitive detail needed to support segment-level decision-making.

By Primary Market Dimension

  • Turnkey Inspection Systems
  • Systems Integration Services
  • Installation and Commissioning Services
  • Calibration and Maintenance Services
  • Training and Support Services
  • Retrofit and Upgrade Services

By End-Use Industry

  • Automotive
  • Electronics and Semiconductor
  • Food and Pharmaceutical
  • Logistics and Warehousing
  • General Industrial

By Commercial Dimension

  • Direct OEM Sales
  • System Integrator Channel
  • Distributor Channel
  • Managed Service Contract

By Region

  • North America
  • Western Europe
  • East Asia
  • South Asia and Pacific
  • Latin America
  • Middle East and Africa
  • Eastern Europe

Scope, Methodology, and Coverage

Every figure in this report is reproducible from documented input assumptions. The scope below maps the historical period, the forecast horizon, the segmentation dimensions, and the countries covered, alongside the underlying primary and qualitative methodology.
Historical Period
2020 to 2025
Forecast Period
2026 to 2036
Base Year
2025 (USD billions; MMA Primary Research Dataset, September 2026)
Market Definition
The machine vision system and services market covers pre-integrated turnkey inspection systems and the surrounding integration, installation, calibration, maintenance, training, and retrofit services delivered to end-use manufacturers. It excludes standalone camera, sensor, and software components sold directly to system integrators or OEMs.
Quantitative Units
USD billions (current prices); facility deployments where applicable
Segmentation Dimensions
By Offering Type; By End-Use Industry; By Commercial Dimension; By Region
Regions Covered
North America, Western Europe, East Asia, South Asia and Pacific, Latin America, Middle East and Africa, Eastern Europe
Countries Covered
USA, China, Germany, France, UK, Japan, South Korea, India, Australia, Canada, Brazil, Mexico, Indonesia, Vietnam, Thailand, Malaysia, UAE, Saudi Arabia, South Africa, Nigeria, Turkey, Poland, Netherlands, Italy, Spain, Sweden, Switzerland, Argentina, Colombia, Singapore, and additional markets relevant to this sector
Key Companies Profiled
Cognex Corporation, ISRA VISION AG, FANUC Corporation, SICK AG, Siemens Digital Industries, ABB Robotics, Festo SE, Bosch Rexroth AG, Rockwell Automation, Yaskawa Electric Corporation, Universal Robots A/S, Recognition Robotics Inc, Aptura Machine Vision, Applied Vision Corporation, Perceptron Inc, Vitronic GmbH, Qualitest Group, Innovatia Automation, Retrotech Solutions, Elunic AG
Quantitative Methodology
Primary survey, n=3,800 respondents, Q4 2025, six countries; demand-side model with trade association cross-validation
Qualitative Methodology
47 expert interviews, Q4 2025; applied to validate demand model assumptions, identify emerging dynamics, and assess competitive positioning
Report Format
PDF and XLSX data workbook (Word format preview document)
Publisher
Market Minds Advisory
Report Code
MMA-2026-TEC-702
Published
September 2026
Contact
sales@marketmindsadvisory.com | www.marketmindsadvisory.com

Purchase the full Machine Vision System And Services Market Report (2026 to 2036).

This report delivers a comprehensive assessment of the global machine vision system and services market, covering historical performance from 2020 through 2025 and forecasts through 2036 across all seven major world regions. It profiles the twenty leading providers shaping turnkey systems, integration, and retrofit service delivery, including detailed competitive positioning and recent contract developments. The analysis quantifies segment-level growth across six offering categories and evaluates revenue diversification opportunities including predictive maintenance and cloud analytics bundling. Primary research draws on a 3,800-respondent survey and 47 expert interviews conducted in Q4 2025.
Ten-year revenue forecast by segment and region
Competitive benchmarking of twenty profiled providers
Regional demand driver analysis across seven markets
Skilled integration engineer labor cost assessment
Revenue diversification and predictive maintenance lever analysis
Anonymized client case study with strategic recommendations

Built For The People Who Decide

From boardroom strategy to bench-side execution, this report is read cover-to-cover by leaders shaping the next decade of their industry, turning demand scenarios, market dynamics and valuation benchmarks into decisions.
CXOs/ Presidents/ VPs/ Managers
M&A and Corporate Development
Strategy Teams and R&D Heads
Procurement and Product Directors
Regulatory and Compliance Leaders
Investor Relations and Equity Analysts