Market Minds Advisory
Lubricant Additives Market

Lubricant Additives Market: Specification licensing barriers, rising treat rates and electrified driveline chemistry to 2036

Engine oil volumes are shrinking as drain intervals stretch and vehicles electrify, and additive demand keeps rising anyway because every new specification forces still more chemistry into every single litre.

Lead Analyst

Bilal Shaikh

Published

September 2026

Make Smarter Decisions with Customized Research Insights

Request a free sample report and evaluate market opportunities, growth trends, and competitive dynamics relevant to your business needs.

2025 MARKET VALUE$18.4BMarket Size 2025
2036 FORECAST VALUE$29.6BBase Case , 2026 to 2036
CAGR 2026 TO 20364.4 %Bull 5.6% / Bear 3.2%
INCREMENTAL OPPORTUNITY$10.3BNet 10- year value creation
EXPANSION MULTIPLE1.54x2036 value over 2026 base
Strategic Levers
M&A Pipeline
Regional Outlook
Country Rankings
Competitive Intelligence
Segmental Deep-dive
Call-Us : 91 93563 13602

Executive Snapshot and Market Trajectory

Four companies hold most of this market and the barrier is not manufacturing. Getting an additive package licensed against a new engine oil specification costs tens of millions in engine testing across several years. That expense, not any patent, is why the concentration has held for decades.
Friction modifiers and electrified driveline additives grow at 6.6%, half again the market rate of 4.4%, because an electric axle fluid has to control electrical conductivity and protect copper windings that conventional anti-wear chemistry attacks directly. East Asia holds 30% of value on Chinese lubricant consumption and Japanese additive manufacture together. Treat rates now average around 12% of finished lubricant. Each specification upgrade pushes that number further, and nothing suggests the pattern breaks.
Five suppliers hold 84% of additive package volume, which makes this among the most concentrated markets anywhere in chemicals. The commercially interesting mechanism is that lubricant volume is falling in developed markets while additive demand keeps rising, because drain intervals stretching past 25,000 kilometres require chemistry that lasts, and every specification upgrade raises the treat rate. Volume decline and value growth coexist here. Nobody expected that.
Market Definition
This report covers chemical additives supplied for blending into finished lubricants across automotive, industrial, marine and metalworking applications, spanning detergents, dispersants, anti-wear and extreme pressure additives, viscosity index improvers, friction modifiers and electrified driveline additives, and antioxidants and corrosion inhibitors. Value is measured at additive supplier level on tonnage. Excluded are base oils and synthetic base stocks, finished lubricants and greases, fuel additives, functional fluids without a lubricating role, and coolant formulations.
Base Year Value
$18.4B in 2025 (MMA Primary Research Dataset, August 2026)
Forecast Period
2026 to 2036, eleven discrete annual values
CAGR
4.4% base case. Bull 5.6%. Bear 3.2%.
Fastest Growth Segment
Friction Modifiers and Electrified Driveline Additives: 6.6% CAGR
Fastest Growth Country
India: 7.2% CAGR
Fastest Growth Region
South Asia and Pacific: 6.6% CAGR
Largest Region
East Asia: 30% of 2025 global value
Market Leaders
Lubrizol Corporation, Infineum International, Chevron Oronite, Afton Chemical and BASF lead the market. Source: MMA Primary Research Dataset, July 2026.
Primary Survey
n=3,800 procurement and R&D decision-makers, Q4 2025, six countries
Methodology
Demand-side build-up, cross-validated against public data, 47 expert interviews

Lubricant Additives Market Forecast Scenarios

lubricant-additives-market-trends-size-forecast-scenario-1787555344108
Growth ran at 3.4% between 2020 and 2025 and two forces pulled against each other throughout. Finished lubricant volume in developed markets fell as drain intervals extended and battery vehicles took share from combustion. Additive treat rates rose across the same period as specification upgrades demanded more chemistry per litre, and Asian lubricant consumption expanded steadily. Value growth came from concentration in the bottle rather than from litres sold.
The 4.4% base case rests on three mechanisms. Specification upgrades keep arriving on roughly eight year cycles and each raises the additive content a licensed formulation requires, which grows tonnage even where lubricant volume falls. Asian industrial and automotive lubricant consumption keeps expanding with manufacturing output and vehicle fleets. And electrified driveline fluids keep taking share at 6.6% on chemistry that conventional engine oil packages cannot deliver at all. That last segment starts small.
The 5.6% bull case is electric driveline fluid specification consolidating around demanding thermal and conductivity requirements, which would raise treat rates in a segment currently formulated conservatively. The 3.2% bear case is combustion vehicle decline running ahead of forecast across Europe and China simultaneously, since passenger car engine oil remains the largest single application by tonnage.

The Moat Built From Engine Tests

Four companies have held most of this market for decades, and the reason is not scale, patents or feedstock access. Licensing an additive package against an engine oil specification requires a programme of fired engine tests costing tens of millions of dollars and running across several years, and the specification changes again roughly every eight years. A challenger funds that repeatedly before earning anything, against incumbents holding forty years of test data. Very few balance sheets absorb it.
TOP-FIVE CONCENTRATION84%Combined position across additive package supply held by leaders
ADDITIVE TREAT RATE12%Portion of a finished lubricant made up of additives
SPECIFICATION CYCLE LENGTH8 yearsTypical period between successive engine oil specification upgrades
PHOSPHORUS CONTENT LIMIT800 ppmCeiling imposed to protect catalytic converters from poisoning
BASE CHEMICAL COST SHARE52%Portion of additive manufacturing cost attributable to feedstock chemicals
EXTENDED DRAIN INTERVAL25,000 kmDistance between oil changes on modern passenger car engines
The commercially useful fact about this market is that it grows while its host shrinks. Finished lubricant volume is falling across developed markets as drain intervals stretch past 25,000 kilometres and battery vehicles take share from combustion engines. Additive tonnage keeps rising anyway, because oil that must survive four times as long requires substantially more antioxidant, dispersant and detergent chemistry to do it. Treat rates now average around 12% and every specification upgrade pushes them further.
Low-speed pre-ignition showed how fast this chemistry can be forced to change. Turbocharged direct-injection engines suffered destructive pre-ignition traced to calcium detergent chemistry, and the industry reformulated toward magnesium within a specification cycle. That is not a slow-moving business.
"People describe this as a concentrated market as though somebody arranged it that way. Nobody arranged anything: the engine test bill for a new specification is roughly what a mid-sized chemical company earns in a year, and that has done the work no cartel could."
Director, Lubricants and Performance Chemicals Practice · MMA Chemicals and Materials Practice · August 2026

Market Trends

Extended drain intervals raise chemistry demand per litre

Passenger car drain intervals have stretched past 25,000 kilometres in several markets from roughly 5,000 twenty years ago, which means the same volume of oil has to survive four or five times the thermal and oxidative stress it once did. That requires substantially more antioxidant, dispersant and detergent chemistry per litre rather than merely better chemistry. Treat rates now average around 12% and rise with each specification upgrade. The commercial consequence is counterintuitive and important: additive tonnage grows even as finished lubricant volume falls, which is why this market has held up against a shrinking host.
Market Impact: Renews demand every 8 years

Electrified drivelines need chemistry engine oil cannot provide

An electric axle fluid lubricates gears and bearings while sitting in direct contact with copper motor windings and while carrying a defined electrical conductivity, and conventional zinc dialkyldithiophosphate anti-wear chemistry attacks copper aggressively. That single incompatibility means an electric driveline fluid is a genuinely different formulation problem rather than an adapted engine oil. Thermal management adds a further requirement, since many designs cool the motor with the same fluid. Growth at 6.6% follows a small base and a specification landscape that has not yet consolidated, which leaves considerable room for treat rates to rise further.
Market Impact: Delivers 30% of global value

Market Opportunities and Growth Drivers

Specification upgrades force reformulation on eight year cycles

Engine oil specifications from the American Petroleum Institute and the European automobile manufacturers association get revised on roughly eight year cycles, and each revision obsoletes formulations that met the previous one. That forces every blender to buy a newly licensed additive package rather than continuing with what worked, which converts a technical requirement into guaranteed commercial renewal across the entire installed customer base. Each successive specification has also raised the additive content required, so the reformulation grows tonnage as well as replacing it. No other chemical market has a mechanism quite like it working this reliably.
Market Impact: Erodes 30% of engine tonnage

Asian industrial and automotive lubricant consumption keeps expanding

Chinese manufacturing output consumes industrial lubricants at volumes nothing else approaches, and the vehicle fleet across China and India continues growing even as new vehicle powertrains shift. Indian consumption in particular rises with both commercial vehicle activity and a two-wheeler fleet running into the hundreds of millions, and those engines have short drain intervals and high thermal stress. Industrial gear, hydraulic and metalworking fluid demand tracks manufacturing investment across the region directly. This is the volume growth that offsets developed market decline, and it depends on nothing more exotic than industrial activity continuing.
Market Impact: Caps phosphorus at 800 ppm

Market Restraints and Challenges

Passenger car engine oil volume falls in developed markets

Engine oil remains the largest single application by tonnage and it is shrinking across Europe and North America as battery vehicles take share and drain intervals extend. The root cause is regulatory and technical simultaneously: emissions rules make combustion expensive to sell while engine and oil improvements let the same fill last four times longer. Commercially this erodes the base that additive tonnage sits on, though rising treat rates have offset most of it so far. Suppliers are responding by pursuing industrial, marine and driveline applications where volume behaves entirely differently and by pushing electrified fluid development.
Market Impact: Lifts treat rates toward 12%

Phosphorus limits constrain the most effective anti-wear chemistry

Zinc dialkyldithiophosphate is the most effective and cheapest anti-wear additive available and its phosphorus poisons catalytic converters, which is why specifications cap content around 800 parts per million. The root cause is that the same element delivering the tribological performance also deactivates the emissions catalyst downstream. Commercially this forces formulators toward ashless anti-wear chemistries costing considerably more and performing less well, which raises package cost without any customer-visible benefit. Suppliers are developing phosphorus-free alternatives and several are qualifying, though none yet matches zinc chemistry on cost and performance together. Nobody has closed that gap.
Market Impact: Segment compounds at 6.6% annually
3 additional market trends, 4 additional growth drivers, and 2 additional restraints and challenges are covered in the full report. Contact sales@marketmindsadvisory.com to access the complete intelligence.

Segment CAGR and Growth Architecture

Additives are classified here by the function they perform in the finished fluid, since that determines the chemistry involved, the specification requirement it satisfies and what a formulator can substitute. Lubricant type, end application and supply arrangement are handled separately in the framework, because one functional chemistry appears across engine, gear and industrial formulations alike.
lubricant-additives-market-trends-market-share-analysis-1787555344641

Friction Modifiers and Electrified Driveline Additives

Growing at 6.6%, half again the market rate, this segment covers two things that used to be unrelated and now converge. Friction modifiers reduce parasitic losses in engines and gearboxes, which matters more as fuel economy rules tighten and as electric range becomes the competitive metric. Electrified driveline additives are a genuinely different problem, since an electric axle fluid must control electrical conductivity, protect copper windings that conventional zinc anti-wear chemistry corrodes, and often cool the motor as well as lubricate the gears. No engine oil package adapts into that role. The specification landscape has not consolidated, which leaves both formulation freedom and considerable commercial uncertainty for everybody involved. That uncertainty is the opportunity.
CAGR 6.6%

Antioxidants and Corrosion Inhibitors

Oil that must last 25,000 kilometres rather than 5,000 fails through oxidation long before it fails through anything else, which is why antioxidant demand has grown faster than the market for two decades and continues to. Higher operating temperatures in downsized turbocharged engines compound the problem, and electrified drivelines running hot fluid through motor windings add a new corrosion requirement entirely. Growth at 5.8% follows drain interval extension more directly than any other functional chemistry. Hindered phenolics and aminic antioxidants both face feedstock cost exposure that formulators manage through blending rather than substitution. The chemistry is mature and the demand curve is not, which is a comfortable combination. Demand keeps outrunning the chemistry.
CAGR 5.8%
Full segment breakdown across 6 segments available in the complete report.

Regional Architecture and Country Demand Map

East Asia holds 30% of value on Chinese lubricant consumption at a scale nothing else matches, alongside Japanese additive manufacture. North America follows at 27%, where three of the four dominant package suppliers are headquartered. Consumption and formulation capability sit in different places. That separation matters commercially.

North America

Three of the four companies dominating global additive package supply are headquartered here, which gives the region formulation and specification capability far beyond what its consumption alone would justify. The American Petroleum Institute specification system originates here and effectively sets the technical agenda for much of the world, meaning suppliers with the deepest relationships to that process shape what everybody else has to formulate against. Engine oil volume is falling as drain intervals extend and battery vehicles take share, offset by industrial and heavy duty demand. Growth at 4.0% sits below the market average and reflects a mature consumption base rather than any loss of technical leadership. Specification influence remains concentrated here.
Share: 27% | CAGR: 4.0% (2026 to 2036)

Western Europe

European specification sequences run alongside the American system with different priorities, particularly on emissions system protection and on the low-ash chemistry that diesel particulate filters demand, which gives formulators here a distinct technical tradition. Infineum and several specialist producers hold substantial capability across the region. Engine oil volume is falling faster here than anywhere, since carbon dioxide fleet targets have pushed combustion vehicle sales down sharply and drain intervals were already long. Industrial and marine lubricant demand holds up considerably better. Growth at 2.8% is the weakest of the seven regions and reflects the automotive decline rather than any weakness in the region's formulation capability, which stays strong. Capability outlasts the application here.
Share: 20% | CAGR: 2.8% (2026 to 2036)
Regional intelligence for 5 additional markets available in the complete report: East Asia, South Asia and Pacific, Latin America, Middle East and Africa, Eastern Europe. Contact sales@marketmindsadvisory.com.
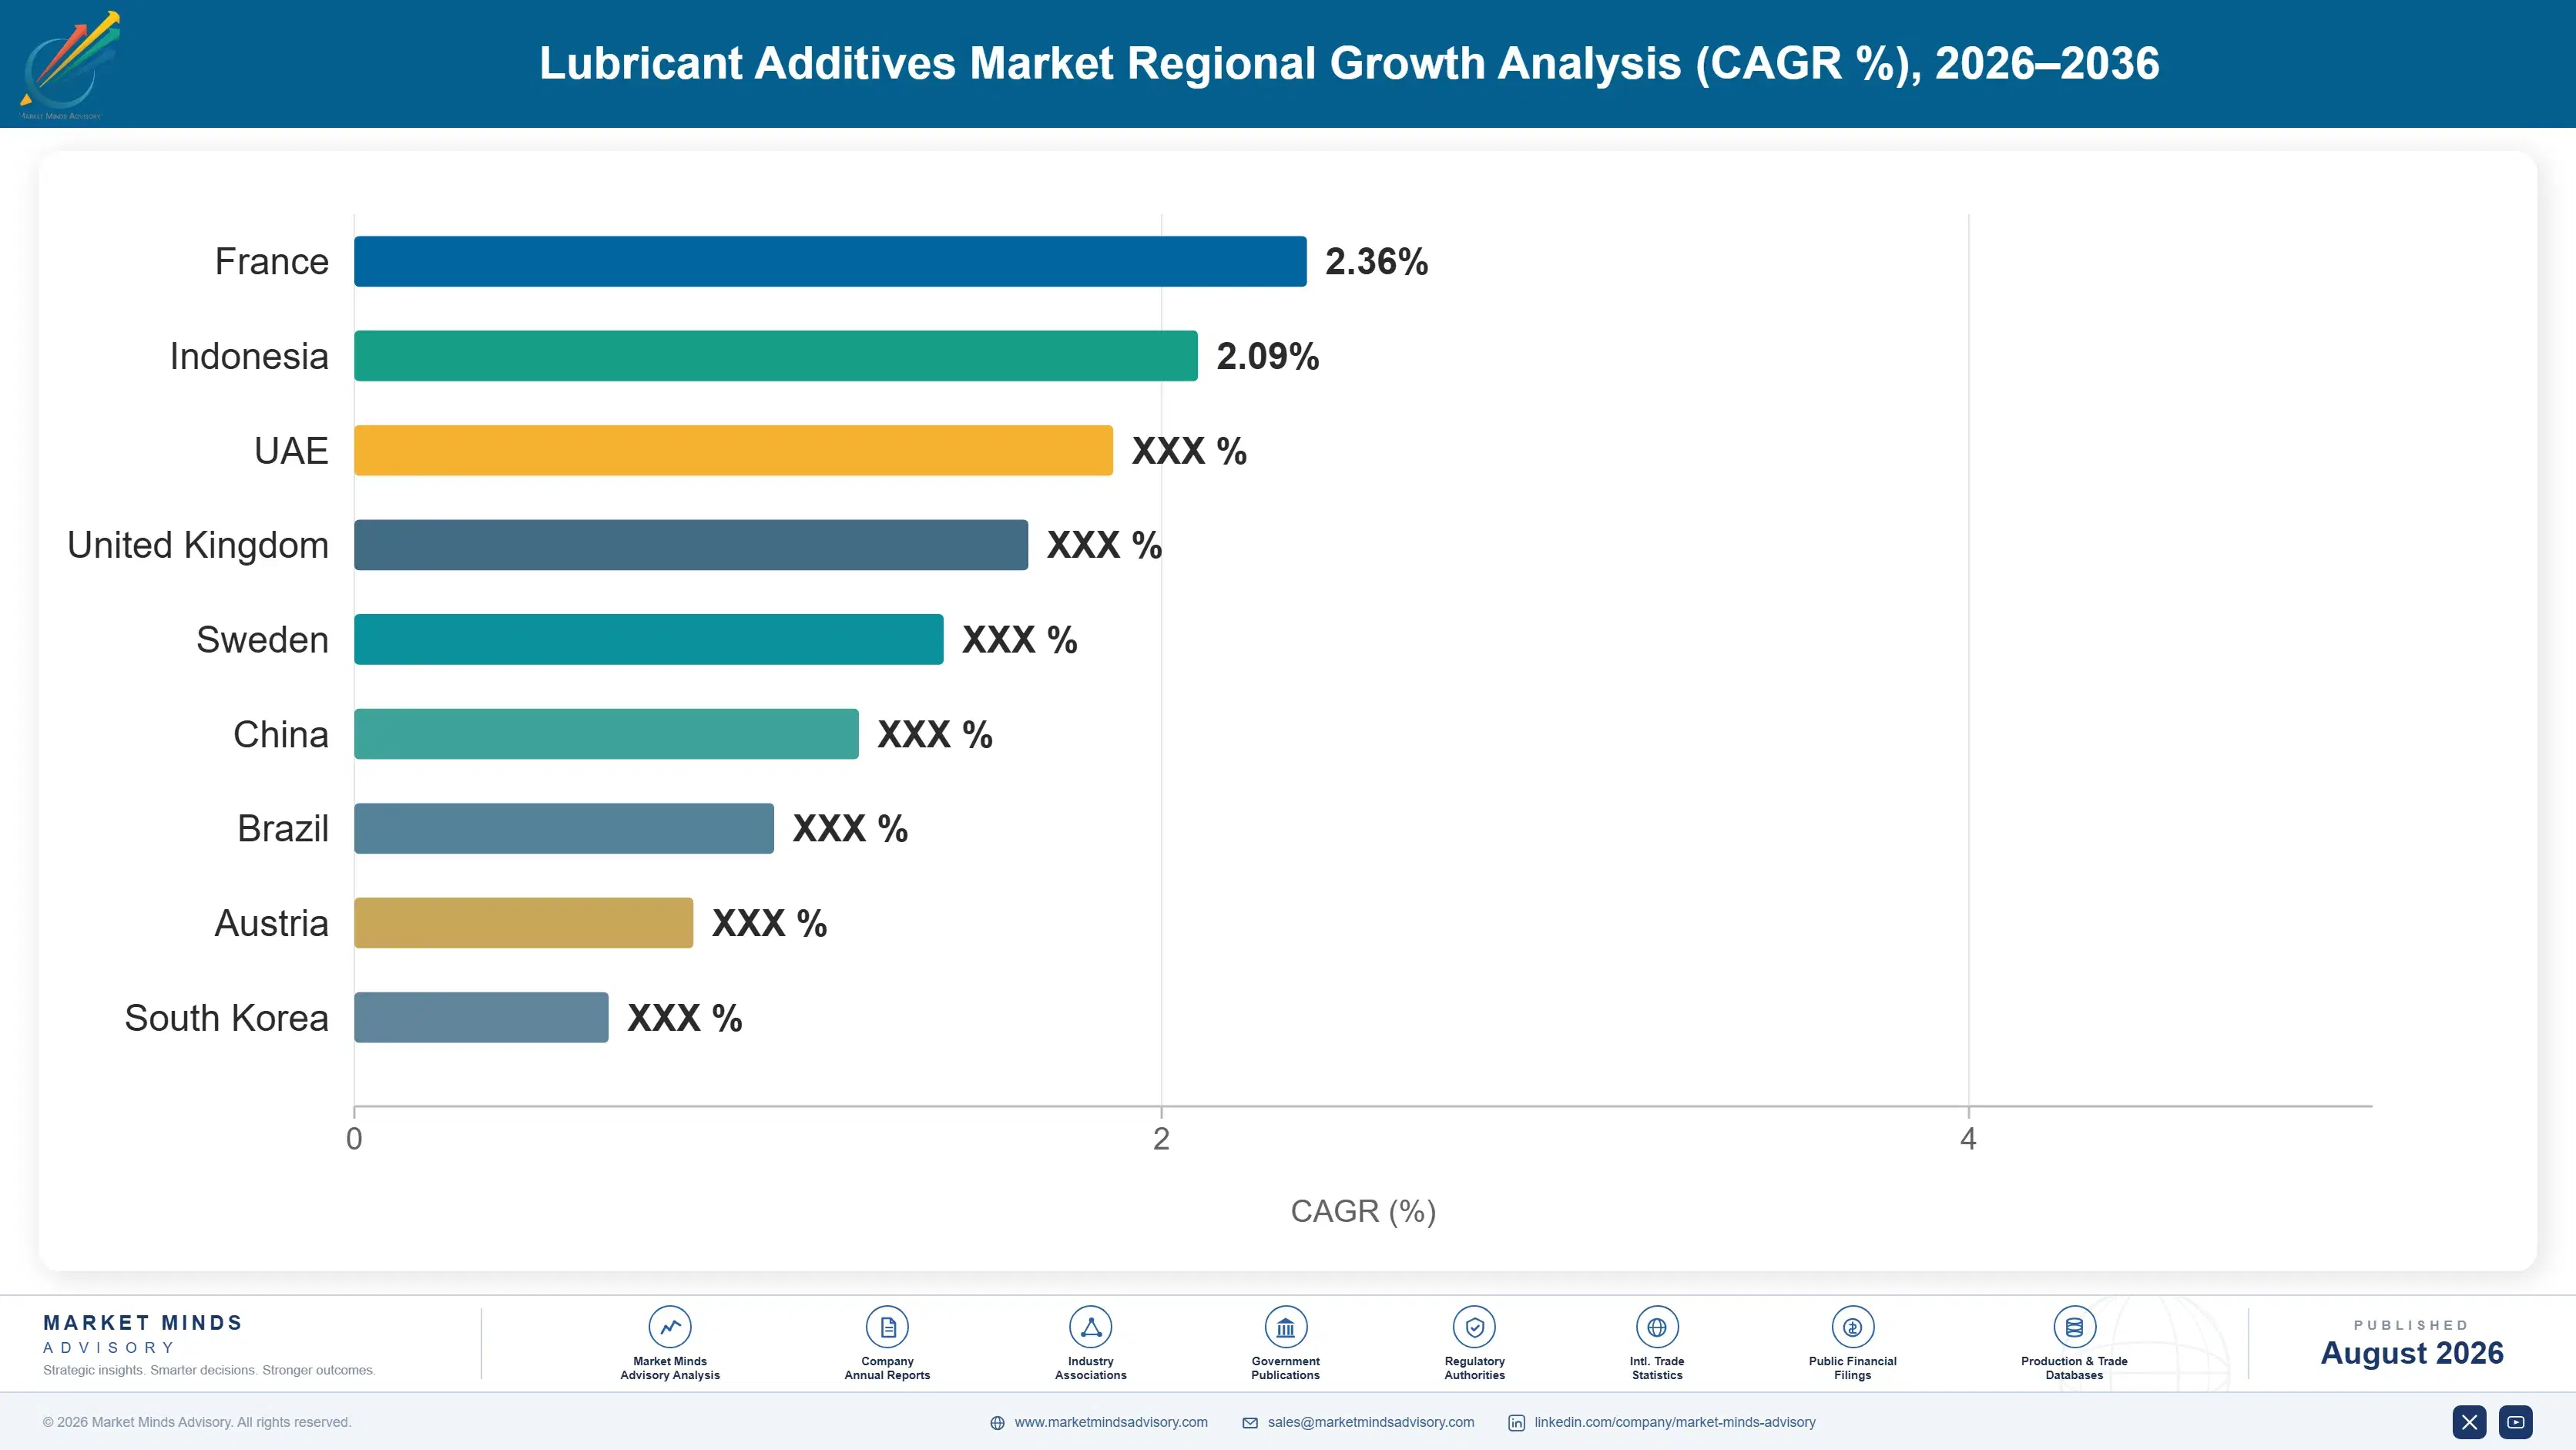
lubricant-additives-market-trends-country-cagr-analysis-1787555345158

Where Additive Margin Actually Sits

Four moves matter in a market where four companies hold most of the volume and the barrier is a testing bill rather than any technology. Two are about the applications where the incumbent position does not automatically transfer, and two are about the mechanism that renews demand without anybody selling anything. Competing on package price is not among them.

Take a position in electrified driveline fluids early

An electric axle fluid must control electrical conductivity, protect copper windings that conventional zinc anti-wear chemistry actively corrodes, and frequently cool the motor as well, which makes it a different formulation problem rather than an adapted engine oil. Decades of engine test data confer no advantage there at all, which is why this is the one place the incumbent moat does not transfer. The segment compounds at 6.6% from a small base and the specification landscape has not consolidated. Whoever shapes the specifications now will hold the position for the following twenty years.
Market Impact: Enters a new segment compounding at 6.6% annually

Price against the specification cycle, not the litre

Every specification revision arriving on roughly eight year cycles obsoletes existing formulations and forces every blender onto a newly licensed package, which is guaranteed commercial renewal across an entire customer base without any selling effort. Each successive specification has raised required additive content, so treat rates have climbed toward 12% and continue rising. Suppliers pricing per tonne against competitors are ignoring that they hold a renewable licence rather than a commodity. Package pricing should reflect the licensing and test investment that made the formulation legal, which is what the customer is genuinely buying.
Market Impact: Renews all demand across an 8 year cycle

Follow tonnage into short drain interval markets

Indian and Southeast Asian fleets run drain intervals a fraction of developed market practice, on vehicles doing enormous distances in harsh conditions, which means volume per vehicle runs considerably higher rather than lower. Growth at 7.2% in India runs well ahead of anywhere else and rests on industrial and fleet activity rather than on regulation. Suppliers organised around developed market specification cycles are optimising for a shrinking tonnage base. The commercial requirement here is local technical service and blender relationships rather than specification influence, which is a different capability entirely and cheaper to build.
Market Impact: Enters fleet markets now growing at 7.2% annually

Solve phosphorus-free anti-wear before regulation tightens further

Zinc dialkyldithiophosphate remains the cheapest and most effective anti-wear chemistry available and its phosphorus poisons catalytic converters, which is why specifications cap it around 800 parts per million and why that ceiling keeps falling. Every reduction forces formulators toward ashless alternatives that cost more and perform less well, raising package cost with no benefit a customer can see. Whoever delivers phosphorus-free performance matching zinc on both cost and durability takes an advantage across every automotive formulation simultaneously. Several programmes are qualifying and none has closed the gap on both measures yet.
Market Impact: Beats a steadily falling 800 ppm phosphorus ceiling

Who Controls the Margin Pool

Five suppliers hold 84% of additive package volume, measured on tonnage supplied annually at additive supplier level, the basis used throughout this section. That is among the most concentrated positions anywhere in chemicals and it rests on a single barrier: licensing a package against an engine oil specification requires fired engine testing costing tens of millions across several years, repeated every cycle. Manufacturing scale and feedstock access matter comparatively little.
Competition runs on three dimensions. Specification licensing depth, which decides what a blender can legally claim on a bottle. Technical service to blenders, since a package has to work in that blender's base oils and equipment. And formulation breadth across engine, driveline, industrial and marine applications. Price competes hardest in commodity single components rather than in complete packages.

Rankings shift where the specification moat does not apply, which means electrified driveline fluids above all. Chinese producers have moved from single components into packages and now compete directly across the middle of the automotive market. Industrial and metalworking applications have always been more contestable, since no equivalent licensing system governs them at all. That contestability is finally spreading upward.
lubricant-additives-market-trends-company-positioning-matrix-1787555345677

Competitive Moat and Risk Dimensions

LUBRIZOL CORPORATION

Moat: Specification test data depth

Lubrizol holds engine test data reaching back decades across every specification generation, which lets it predict how a formulation will perform before committing to the programme that proves it. That cuts the cost and risk of each licensing cycle in ways a challenger funding tests blind cannot approach.
LUBRIZOL CORPORATION

Risk: Combustion engine concentration

The deepest capability and the strongest positions sit in engine oil, which is the application shrinking fastest across developed markets as drain intervals extend and vehicles electrify. Test data on combustion engines confers nothing at all in electrified driveline fluids. Competitors starting from equal ignorance in that segment face a genuinely level competitive field for the first time in decades.
INFINEUM INTERNATIONAL

Moat: European specification proximity

Infineum sits closer to European specification development than any competitor, which matters because European sequences prioritise emissions protection and low-ash chemistry differently from the American system. That proximity shapes what the specification asks for as well as how fast a package meets it. Competitors formulating from outside that process are always responding rather than anticipating it.
INFINEUM INTERNATIONAL

Risk: European automotive decline exposure

European passenger car engine oil volume is falling faster than any other regional application, since fleet carbon targets have cut combustion sales sharply and drain intervals were already long. A position built on European specification proximity loses value as the European application shrinks. Competitors weighted toward Asian consumption or industrial applications face far less of that erosion.

Players Tracked

Prominent Players

Lubrizol Corporation
Infineum International
Chevron Oronite
Afton Chemical
BASF

Other Key Players

Evonik Industries
Croda International
Clariant
LANXESS
Dorf Ketal Chemicals
Vanderbilt Chemicals
King Industries
Italmatch Chemicals
Sanyo Chemical Industries
Adeka Corporation
Jinzhou Kangtai Lubricant Additives
Tianhe Chemicals
Wuxi South Petroleum Additive
Solvay
Nouryon

Recent Developments

APRIL 2025

Afton Chemical expanded electrified driveline fluid development capability

Afton Chemical increased laboratory and test capability directed at electric driveline fluids, where conductivity control and copper compatibility requirements differ fundamentally from engine oil chemistry. The investment was organic rather than any partnership or acquisition, and it addresses the one segment where incumbent engine test data confers nothing.
Signal: Incumbents are investing hardest in the segment where their existing moat does not apply, which tells you they understand it
SEPTEMBER 2025

A Chinese producer licensed a complete package against an international specification

A Chinese additive producer completed licensing of a full engine oil package against an internationally recognised specification, moving beyond the single component supply that has defined domestic capability. This was an organic development programme rather than any transaction, and it followed several years of test investment.
Signal: The testing barrier is being paid rather than avoided, which means the concentration this market has held may finally loosen
JANUARY 2026

A specification body proposed a lower phosphorus ceiling for passenger car oils

A specification body proposed reducing the permitted phosphorus content in passenger car engine oils below current limits, citing catalytic converter durability across extended vehicle lifetimes. This was a technical proposal rather than any commercial transaction, and it would force reformulation toward ashless anti-wear chemistry across the industry.
Signal: Every phosphorus reduction raises package cost without customer-visible benefit, which favours whoever solved ashless anti-wear first

What Moves Additive Cost

Base chemical feedstocks account for around 52% of additive manufacturing cost, drawn from petrochemical and oleochemical streams that price on their own logic entirely. Polyisobutylene, alkylphenols, olefins, amines and phosphorus pentasulphide are the principal inputs. Energy for reaction and separation is meaningful without dominating. Specification testing sits outside manufacturing cost and consumes capital at a scale few chemical businesses carry.
Feedstock prices moved sharply through 2021 and 2022 as petrochemical streams tightened and European energy costs rose, and IEA data show European industrial gas far above American levels through that period. Lubrizol's parent recorded raw material cost pressure across specialty chemical operations in its Annual Report 2022. Suppliers holding annual package contracts with blenders absorbed most of the movement, since a blender sets finished lubricant prices against a competitive retail market.

The unusual cost feature here is that the largest investment does not appear in cost of goods at all. Engine test programmes for specification licensing consume tens of millions across several years before a single tonne ships, and that expense sits in development rather than manufacturing. Suppliers comparing gross margins without accounting for it are measuring the wrong thing entirely, and challengers frequently discover this only after committing.
lubricant-additives-market-trends-cost-volatility-analysis-1787555345875

Index blender contracts to published petrochemical benchmarks

Feedstock at 52% of manufacturing cost prices on petrochemical streams that move for reasons unconnected to lubricant demand, and annual fixed package pricing against that is a bet nobody chose. Indexing to published olefin benchmarks with quarterly reset removes the exposure. Blenders resist because their own retail pricing is competitive, which makes this a negotiation rather than a formality.

Spread specification test investment across more applications

An engine test programme costing tens of millions serves the specification it was run for and generates data usable across adjacent formulations if the programme is designed that way from the start. Suppliers treating each licensing cycle as a standalone project are paying repeatedly for knowledge they already hold. Designing test matrices for reuse across applications spreads that cost considerably.

Qualify second sources for phosphorus and amine feedstocks

Phosphorus pentasulphide and several amine intermediates come from a small number of producers globally, which makes availability rather than price the genuine exposure. A supply interruption stops production entirely rather than merely raising cost. Qualifying alternative sources takes development time and delivers continuity worth far more than any single-source discount, and several suppliers learned this expensively during recent outages.

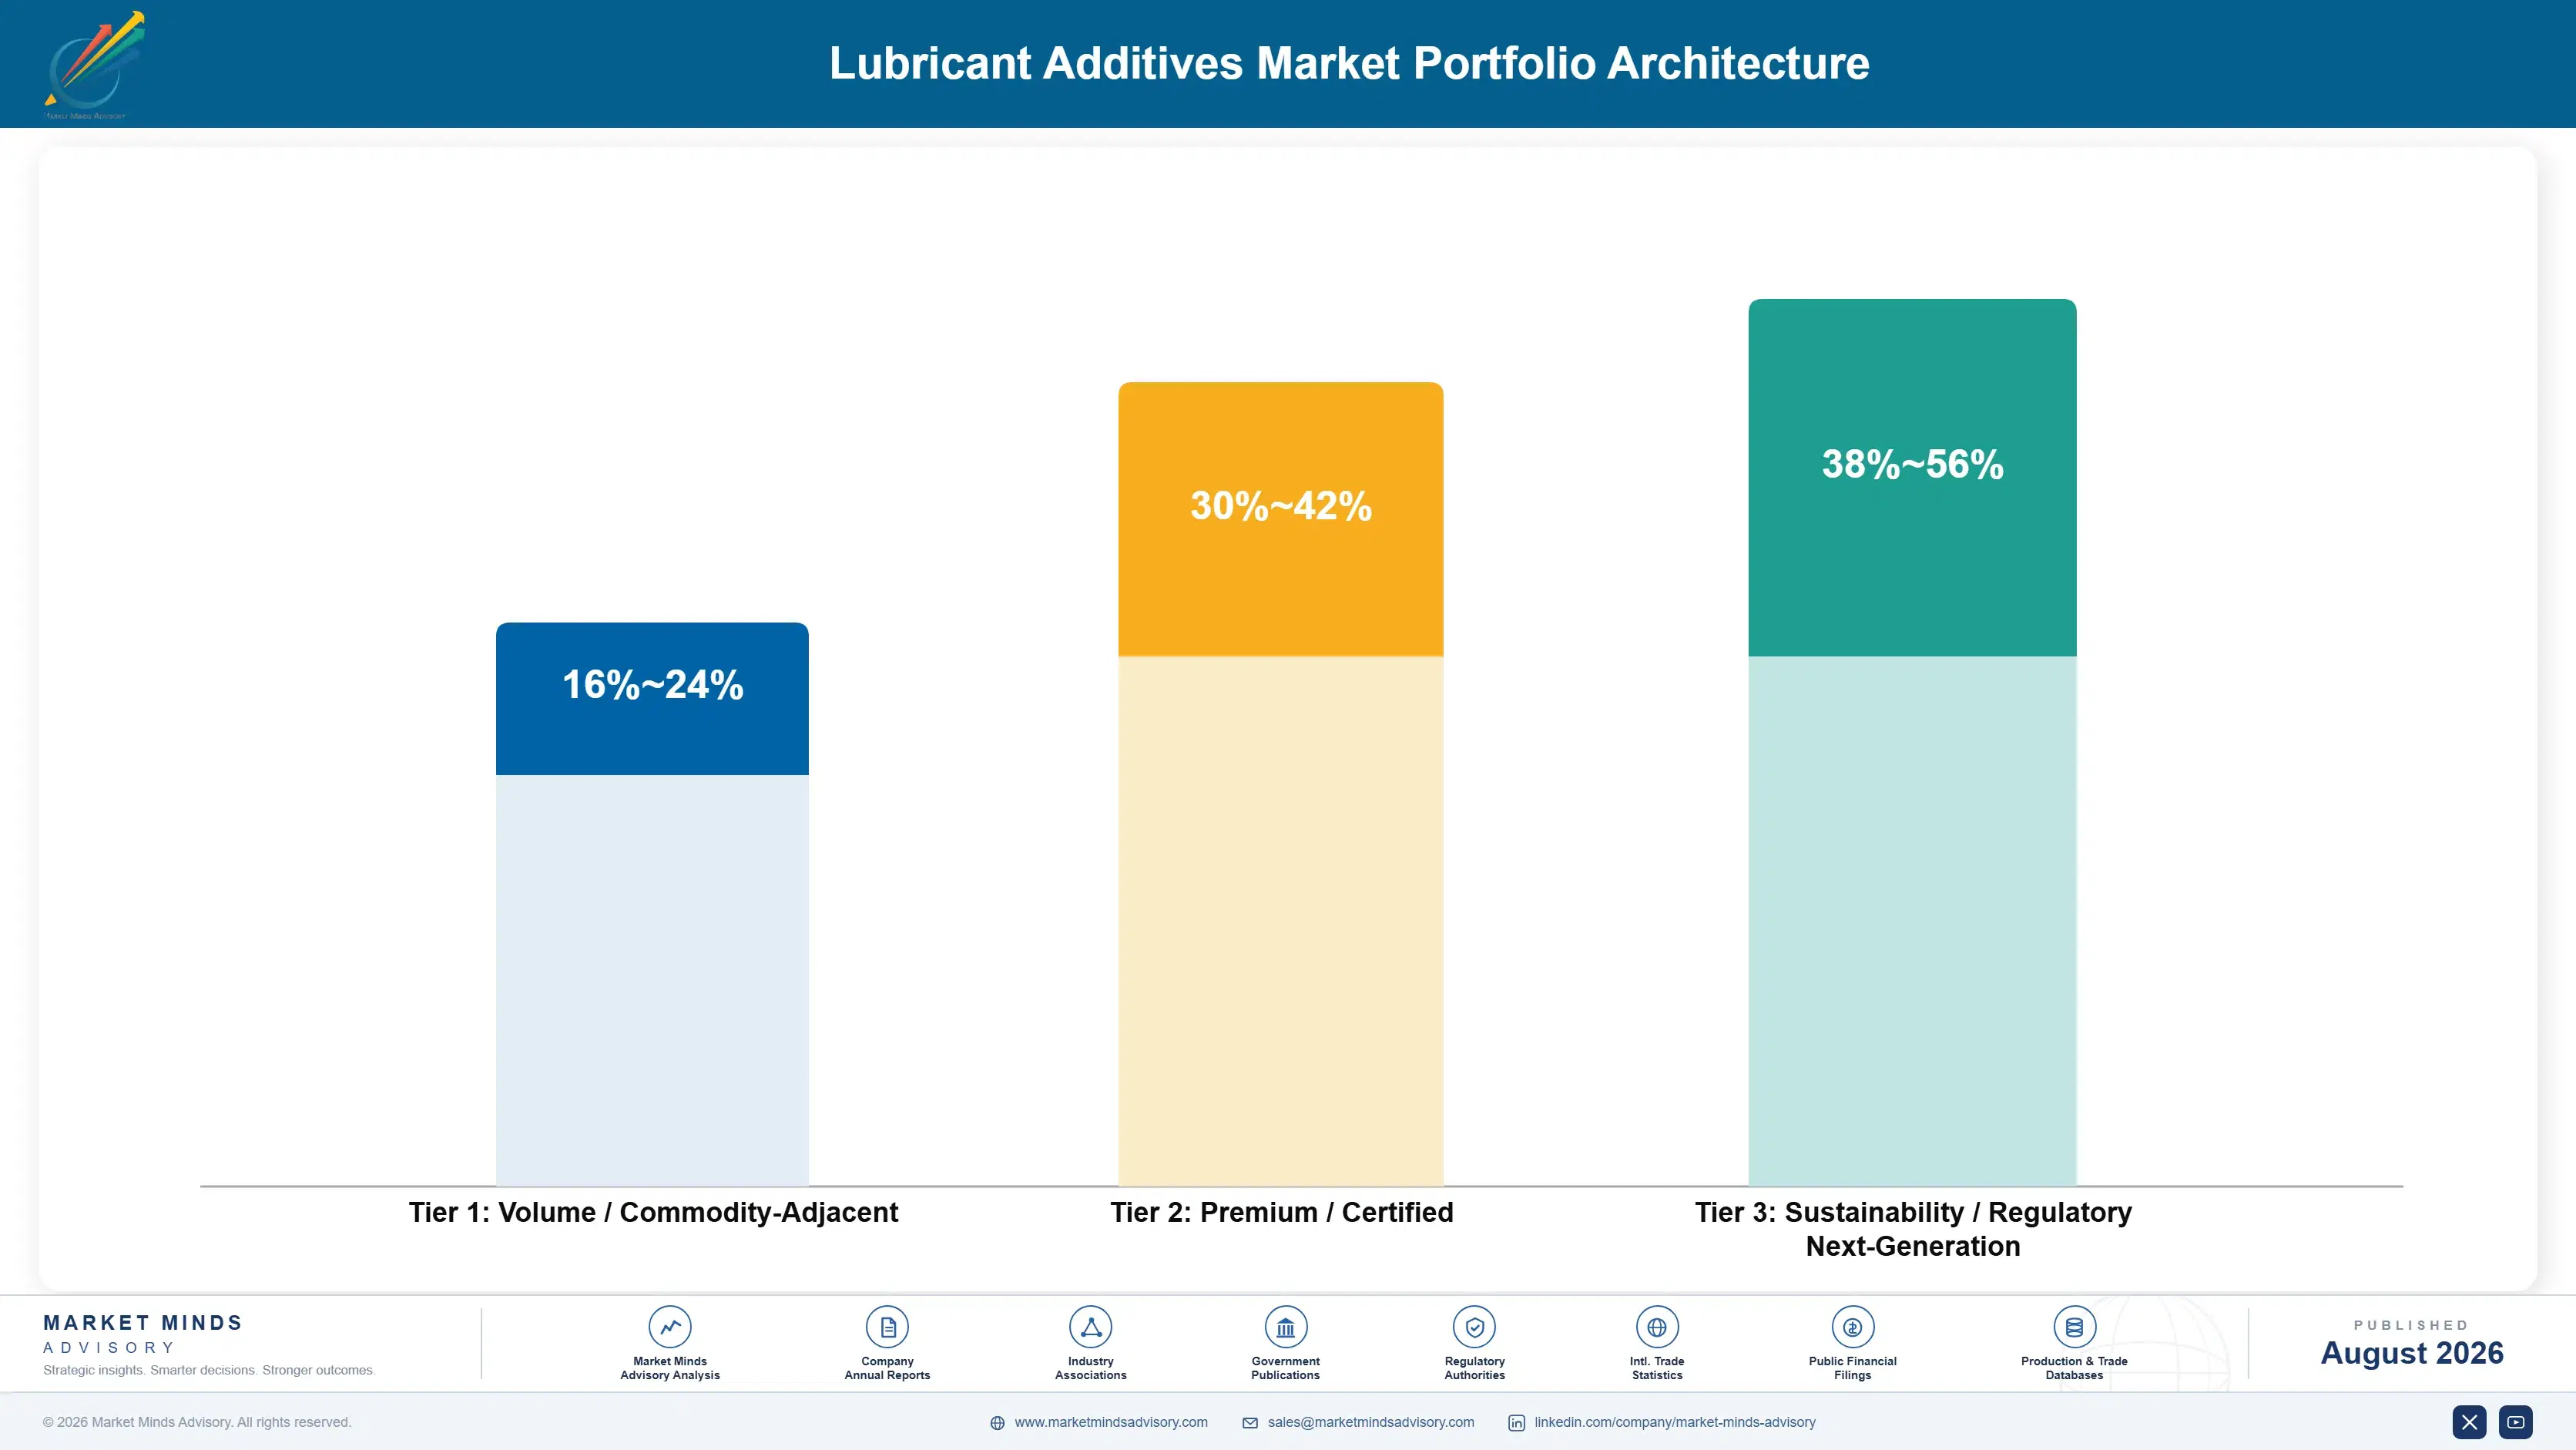
Portfolio Architecture for Margin Defence

Margin here tracks whether a specification licence protects the position rather than how sophisticated the chemistry is. Single component additives sold into industrial and metalworking blending run at gross margins in the high teens, since no licensing system governs those applications and many producers meet the requirement. Licensed heavy duty and passenger car packages run considerably better, because the test investment excludes almost everybody. Electrified driveline and specialty formulations run higher again, on scarcity rather than on any protection.
The tension is that engine oil packages carry the margin and sit in the application shrinking fastest, while industrial and metalworking volumes are growing and earn far less. Redirecting commercial effort toward the growing applications means accepting a materially lower margin structure, which several suppliers have been reluctant to do explicitly. That reluctance shows up as continued investment in a declining tonnage base rather than as any stated strategy anybody would defend.

High-value pools sit in electrified driveline fluids, newly licensed specification packages and Asian technical service positions. Only one of the three is protected by the barrier that built this industry. Test data by itself defends nothing outside the engine.

Volume / Commodity-Adjacent

Single component additives supplied into industrial, metalworking and general blending where no licensing system governs the application and many producers meet the specification. The eight-point range separates producers with integrated feedstock positions from those buying intermediates on merchant terms.
Gross Margin: 16%-24%

Premium / Certified

Licensed passenger car and heavy duty engine oil packages where the specification testing investment excludes nearly every potential competitor. The twelve-point spread reflects how recently a package was licensed, since a formulation at the start of its cycle prices very differently from one near obsolescence.
Gross Margin: 30%-42%

Sustainability / Regulatory / Next-Generation

Electrified driveline fluids, phosphorus-free anti-wear chemistry and marine formulations meeting sulphur cap requirements. The eighteen-point range is wide because these applications price against scarcity and unsettled specifications rather than against any established benchmark.
Gross Margin: 38%-56%
lubricant-additives-market-trends-portfolio-architecture-1787555346375

High-value Sub-segments and Strategic Watch-out

Electrified Driveline Fluids

Compounding at 6.6% and the only significant application where forty years of engine test data confers no advantage whatever. Conductivity control and copper compatibility make it a different problem, and the specifications have not consolidated, which leaves the position genuinely open. Nobody holds a head start here.
Gross Margin: 40%-56%

Newly Licensed Specification Packages

Every eight year revision obsoletes existing formulations and forces every blender onto a new licensed package, which is guaranteed renewal without any selling effort at all. Suppliers pricing this per tonne rather than as a licence are undercharging substantially for what they hold. The committee does the selling.
Gross Margin: 34%-48%

Industrial And Metalworking Components

Growing steadily and governed by no licensing system, which means many producers compete and margin reflects that directly. It is where the tonnage growth increasingly sits. Manage it for volume and feedstock integration rather than for margin recovery. Feedstock integration is the only durable advantage available in it.
Gross Margin: 16%-24%

Asian Blender Technical Service

Indian growth at 7.2% rests on short drain intervals and fleet activity rather than on specification cycles, which means local technical service and blender relationships matter more than licensing depth. That capability is cheaper to build than most incumbents assume it is. Licensing depth matters far less than presence.
Gross Margin: 28%-40%

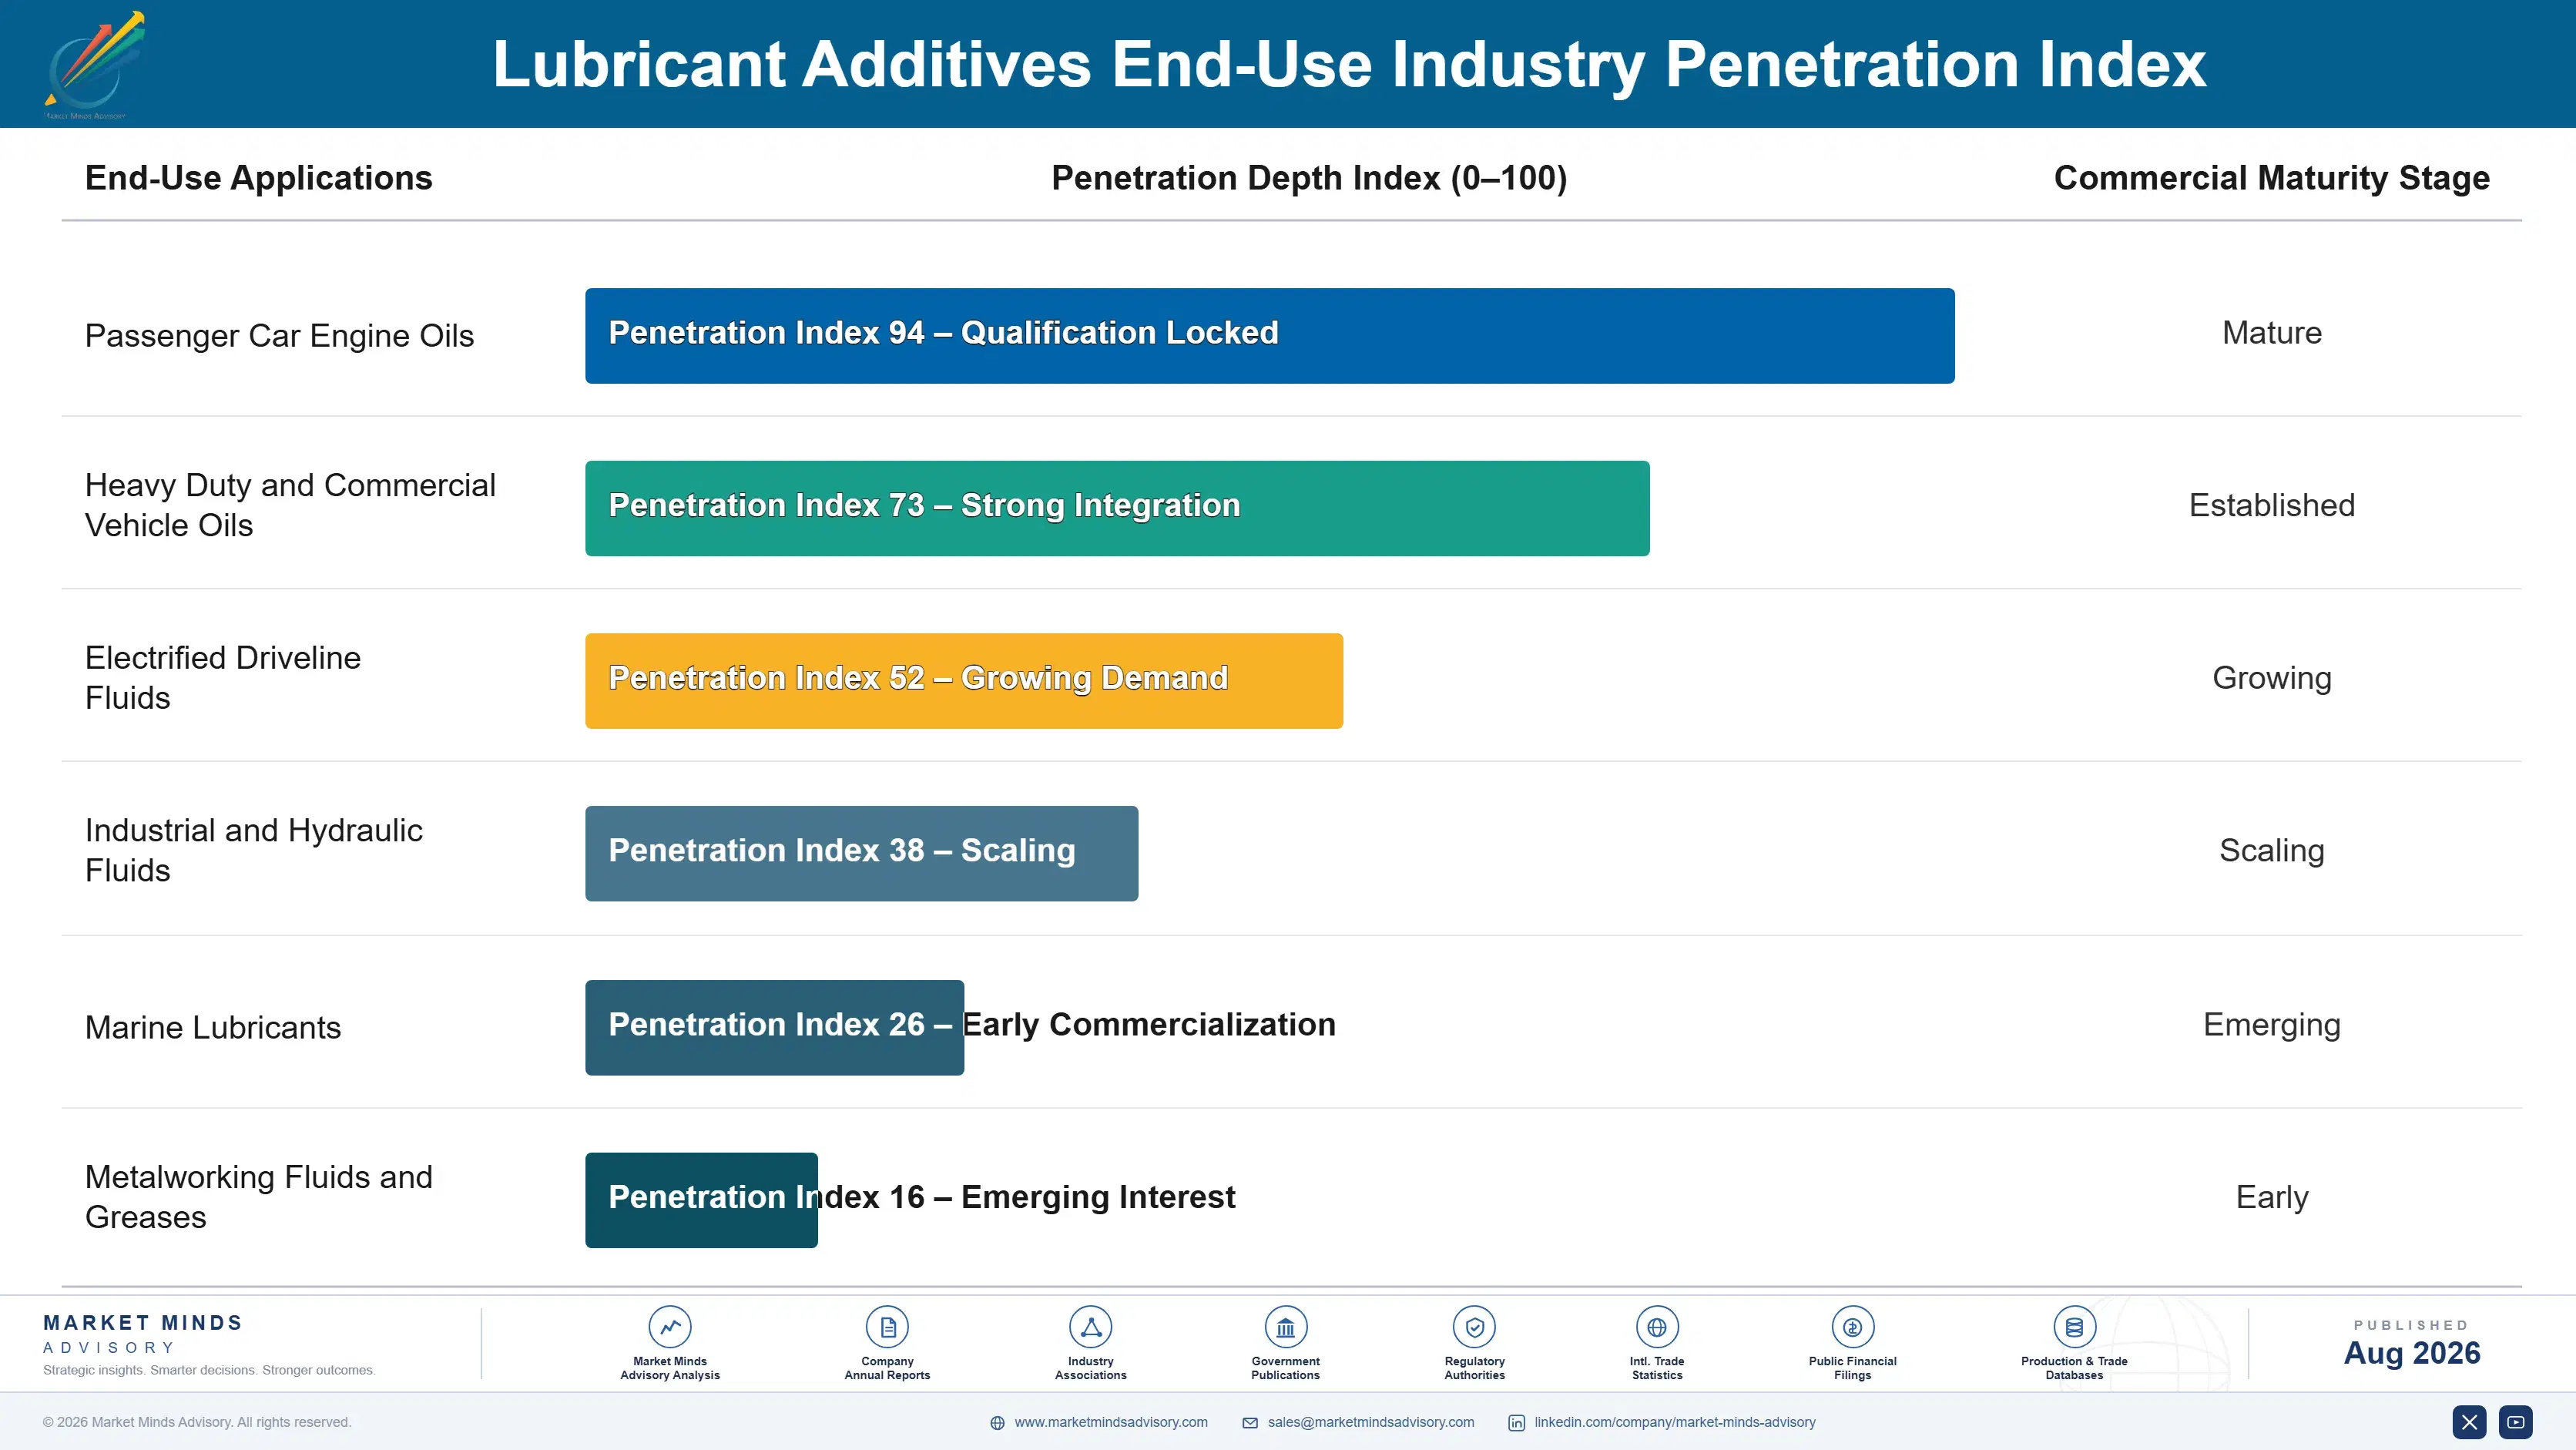
How Additive Demand Renews

Demand here renews through the specification rather than through any purchasing decision, which is genuinely unusual. A blender buys a licensed package continuously for as long as that specification remains current, then is obliged to buy a newly licensed one when it is superseded roughly eight years later. Nobody chooses to switch and nobody chooses to stay. The technical committee that revises the specification is effectively the sales force, and it works for free.
Stickiness varies enormously by application. Licensed engine oil positions are close to permanent within a cycle, since a blender cannot legally claim the specification with an unlicensed package. Industrial and metalworking supply turns over on price at every contract, because no equivalent licensing constrains the choice. Marine sits between the two, held by performance history and by the practical difficulty of testing anything at sea.

The decision-maker sits further from the customer than in almost any market. Blenders buy the packages, and vehicle manufacturers and specification committees decide what those packages must contain. Selling to the blender who writes the cheque without influencing the committee that writes the requirement is competing for a decision somebody else already made.
lubricant-additives-market-trends-end-use-penetration-index-1787555346862

Where To Place The Bet

These are among the four positions where our research anticipates prominent divergence between winners and laggards over the coming forecast period. Each is grounded in the demand model, the regulatory perimeter, and the announced capacity pipeline.
01 / ELECTRIFIED FLUID POSITIONING

Move where the engine test moat does not reach

An electric axle fluid must control electrical conductivity, protect copper windings that conventional zinc anti-wear chemistry actively corrodes, and in many designs cool the motor as well as lubricate the gears. Forty years of fired engine test data, the barrier that has held this market at four suppliers for decades, confers no advantage whatever in solving that problem. The segment compounds at 6.6% from a small base against specifications that have not consolidated, which makes this the one genuinely open competitive field available to anybody.
02 / LICENCE PRICING DISCIPLINE

Charge for the licence, not the tonne

Every specification revision arriving on roughly eight year cycles obsoletes existing formulations and forces every blender onto a newly licensed package, which delivers guaranteed commercial renewal across an entire customer base with no selling effort involved at all. What the blender is genuinely buying is legal permission to make a claim on a bottle, funded by test programmes costing tens of millions. Suppliers still pricing per tonne against competitors are treating a renewable licence as a commodity and undercharging accordingly for it.
03 / ASIAN TONNAGE REDIRECTION

Follow volume into short drain interval fleets

Indian and Southeast Asian fleets run drain intervals a fraction of developed market practice on vehicles covering enormous distances in genuinely harsh conditions, which makes lubricant volume per vehicle considerably higher rather than lower. Growth at 7.2% in India runs well ahead of anywhere else and depends on industrial and fleet activity rather than on any regulatory cycle. Suppliers organised entirely around developed market specification cycles are optimising hard for a tonnage base that is quietly shrinking underneath them every year.
04 / ASHLESS ANTI-WEAR DEVELOPMENT

Beat zinc chemistry before the ceiling drops again

Zinc dialkyldithiophosphate is the cheapest and most effective anti-wear additive available and its phosphorus poisons catalytic converters, which is why specifications cap content near 800 parts per million and why that ceiling keeps falling with each revision. Every reduction pushes formulators toward ashless alternatives costing more and performing worse, raising package cost with no benefit a customer can perceive. Whoever matches zinc on both cost and durability without any phosphorus at all gains a decisive advantage across every automotive formulation at once.

Engagement Snapshot From the Field

A live engagement with an industry participant carrying material or product regulatory and market exposure ahead of a defining policy shift, showing how our research translates into a defensible multi-year portfolio strategy.
MARKET MINDS ADVISORY · CLIENT ENGAGEMENT SUMMARY
Lubricant Additives Producer Strategic Portfolio Review and Transition Roadmap 2026·Investment Scenario on Lubricant Additives Exposure Evaluation 2025-26
CLIENT PROFILE
A European lubricant additive supplier with annual revenue around EUR 380 million (client-reported, unverified by MMA), producing component chemistries and a limited range of licensed packages for European blenders. Roughly 65% of revenue came from passenger car engine oil applications. The business held no electrified driveline capability and a small industrial component portfolio it had never prioritised.
STRATEGIC CHALLENGE
Volume had declined for three consecutive years (client-reported, unverified by MMA) as European engine oil consumption fell, and management proposed funding a new passenger car specification licensing programme to defend share. Nobody had asked whether defending share in a shrinking application was worth tens of millions in engine testing that would need repeating within a decade.
MMA APPROACH
MMA modelled European engine oil tonnage decline against the licensing investment required to hold share, establishing whether the programme could recover its cost across the specification cycle. Electrified driveline fluid requirements were assessed against the client's existing chemistry capability. Industrial and metalworking application economics were benchmarked, and Asian blender technical service costs were established through the expert interview programme.
KEY FINDINGS
  1. The proposed licensing programme would not have recovered its test cost within the specification cycle at any realistic share, because the underlying application tonnage was falling faster than share gains could offset.
  2. The client's existing antioxidant and corrosion inhibitor chemistry transferred directly into electrified driveline formulation, where no competitor held any established specification advantage at all.
  3. Industrial and metalworking components the client had never prioritised were growing while carrying no licensing burden, and its capability there was better than management believed.
  4. Asian blender technical service presence would cost roughly a tenth of the licensing programme and address a tonnage base growing at more than 6% annually.
CLIENT PROFILE
A European lubricant additive supplier with annual revenue around EUR 380 million (client-reported, unverified by MMA), producing component chemistries and a limited range of licensed packages for European blenders. Roughly 65% of revenue came from passenger car engine oil applications. The business held no electrified driveline capability and a small industrial component portfolio it had never prioritised.
STRATEGIC CHALLENGE
Volume had declined for three consecutive years (client-reported, unverified by MMA) as European engine oil consumption fell, and management proposed funding a new passenger car specification licensing programme to defend share. Nobody had asked whether defending share in a shrinking application was worth tens of millions in engine testing that would need repeating within a decade.
MMA APPROACH
MMA modelled European engine oil tonnage decline against the licensing investment required to hold share, establishing whether the programme could recover its cost across the specification cycle. Electrified driveline fluid requirements were assessed against the client's existing chemistry capability. Industrial and metalworking application economics were benchmarked, and Asian blender technical service costs were established through the expert interview programme.
KEY FINDINGS
  1. The proposed licensing programme would not have recovered its test cost within the specification cycle at any realistic share, because the underlying application tonnage was falling faster than share gains could offset.
  2. The client's existing antioxidant and corrosion inhibitor chemistry transferred directly into electrified driveline formulation, where no competitor held any established specification advantage at all.
  3. Industrial and metalworking components the client had never prioritised were growing while carrying no licensing burden, and its capability there was better than management believed.
  4. Asian blender technical service presence would cost roughly a tenth of the licensing programme and address a tonnage base growing at more than 6% annually.
RECOMMENDED STRATEGY
Phase 1: Phase one: cancel the passenger car licensing programme and redirect the committed capital toward electrified driveline fluid development and testing capability. Phase 2: Phase two: prioritise the industrial and metalworking component portfolio commercially, accepting a lower margin against tonnage that is genuinely growing. Phase 3: Phase three: establish blender technical service presence in India and Southeast Asia rather than pursuing specification influence the client cannot afford.
OUTCOME
The licensing programme was cancelled and electrified driveline development is funded and running. Industrial component sales now carry their own commercial targets. Technical service presence is established in two Asian markets, and the client reports total volume stabilising for the first time in four years (client-reported, unverified by MMA).

Frequently Asked Questions

Foundational context covering the market sizes, CAGR, scope, country, region and competition that inform every finding below. This section is provided to cover basics and most often pre-purchase conversations, answered from the MMA Primary Research Dataset.

What is the current size of the Lubricant Additives Market?

The market was valued at USD 18.4 billion in 2025, rising to an estimated USD 19.21 billion in 2026. East Asia holds the largest regional share at 30% of value.

How large will the Lubricant Additives Market be by 2036?

MMA forecasts USD 29.55 billion by 2036 under the base case, an expansion multiple of 1.54 times the 2026 value. That represents USD 10.34 billion of incremental value.

What is the CAGR for the Lubricant Additives Market 2026 to 2036?

The base case runs at 4.4% compound annual growth between 2026 and 2036, with a bull case at 5.6% and a bear case at 3.2%. Historical growth from 2020 to 2025 was 3.4%.

Which segment is growing fastest?

Friction modifiers and electrified driveline additives lead at 6.6%, half again the market rate, because electric axle fluids need chemistry engine oil packages cannot provide. Antioxidants follow at 5.8%.

Who are the major companies in the Lubricant Additives Market?

Lubrizol, Infineum, Chevron Oronite, Afton Chemical and BASF hold 84% of package volume between them. Specification licensing cost rather than manufacturing scale sustains that concentration.

Which country is growing fastest?

India leads at 7.2%, driven by commercial vehicle and two-wheeler fleets running short drain intervals in harsh conditions. Volume per vehicle runs higher than developed markets.

Report Segmentation Architecture

The full report scope spans multiple orthogonal segmentation dimensions, with cross-tabulated demand data provided for each dimension pair. Coverage extends further to regional breakdowns, trend trajectories, and the competitive detail needed to support segment-level decision-making.

By Additive Function

  • Detergents
  • Dispersants
  • Anti-Wear and Extreme Pressure Additives
  • Viscosity Index Improvers
  • Friction Modifiers and Electrified Driveline Additives
  • Antioxidants and Corrosion Inhibitors

By End-Use Industry

  • Passenger Car Engine Oils
  • Heavy Duty and Commercial Vehicle Oils
  • Electrified Driveline Fluids
  • Industrial and Hydraulic Fluids
  • Marine Lubricants
  • Metalworking Fluids and Greases

By Supply Arrangement

  • Licensed Package Supply
  • Single Component Supply
  • Custom Formulation Development
  • Toll Blending Arrangement
  • Distributor and Trading Channel

By Region

  • North America
  • Western Europe
  • East Asia
  • South Asia and Pacific
  • Latin America
  • Middle East and Africa
  • Eastern Europe

Scope, Methodology, and Coverage

Every figure in this report is reproducible from documented input assumptions. The scope below maps the historical period, the forecast horizon, the segmentation dimensions, and the countries covered, alongside the underlying primary and qualitative methodology.
Historical Period
2020 to 2025
Forecast Period
2026 to 2036
Base Year
2025 (USD billions; MMA Primary Research Dataset, August 2026)
Market Definition
The market comprises chemical additives supplied for blending into finished lubricants across passenger car, commercial vehicle, electrified driveline, industrial, marine and metalworking applications, covering detergents, dispersants, anti-wear and extreme pressure additives, viscosity index improvers, friction modifiers and electrified driveline additives, and antioxidants and corrosion inhibitors. Value is measured at additive supplier level on tonnage supplied annually through package and component channels. Base oils and synthetic base stocks, finished lubricants and greases, fuel additives, functional fluids without a lubricating role and engine coolant formulations fall outside scope.
Quantitative Units
USD billions (current prices); thousand tonnes of additive supplied annually; USD per tonne by additive function
Segmentation Dimensions
By Additive Function; By End-Use Industry; By Supply Arrangement; By Region
Regions Covered
North America, Western Europe, East Asia, South Asia and Pacific, Latin America, Middle East and Africa, Eastern Europe
Countries Covered
China, Japan, South Korea, Taiwan, India, Indonesia, Thailand, Vietnam, Australia, United States, Canada, Mexico, Germany, France, United Kingdom, Netherlands, Belgium, Italy, Spain, Poland, Czechia, Romania, Hungary, Brazil, Argentina, Colombia, Saudi Arabia, United Arab Emirates, Egypt, South Africa
Key Companies Profiled
Lubrizol Corporation, Infineum International, Chevron Oronite, Afton Chemical, BASF, Evonik Industries, Croda International, Clariant, LANXESS, Dorf Ketal Chemicals, Vanderbilt Chemicals, King Industries, Italmatch Chemicals, Sanyo Chemical Industries, Adeka Corporation, Jinzhou Kangtai Lubricant Additives, Tianhe Chemicals, Wuxi South Petroleum Additive, Solvay, Nouryon
Quantitative Methodology
Primary survey, n=3,800 respondents, Q4 2025, six countries; demand-side model with trade association cross-validation
Qualitative Methodology
47 expert interviews, Q4 2025; applied to validate demand model assumptions, identify emerging dynamics, and assess competitive positioning
Report Format
PDF and XLSX data workbook (Word format preview document)
Publisher
Market Minds Advisory
Report Code
MMA-2026-CHM-591
Published
August 2026
Contact
sales@marketmindsadvisory.com | www.marketmindsadvisory.com

Purchase the full Lubricant Additives Market Report (2026 to 2036).

The full report sizes the global lubricant additive market to 2036 across six functional chemistries and seven regions, measured on tonnage supplied at additive supplier level. It treats specification licensing cost as the governing competitive barrier and quantifies how treat rate increases offset falling lubricant volume in developed markets. Competitive analysis covers 20 participants evaluated on tonnage supplied, with moat and risk assessment for the two leaders. Electrified driveline fluid requirements are analysed separately, since incumbent engine test data confers no advantage there. Four quantified revenue levers close the analysis.
Six-function segment sizing with segment-level growth rates
Seven-region share and growth breakdown to 2036
Twenty-participant competitive map on one tonnage basis
Treat rate increases modelled against falling lubricant volume
Electrified driveline requirements analysed separately from engine chemistry
Four quantified revenue levers with commercial impact ranges

Built For The People Who Decide

From boardroom strategy to bench-side execution, this report is read cover-to-cover by leaders shaping the next decade of their industry, turning demand scenarios, market dynamics and valuation benchmarks into decisions.
CXOs/ Presidents/ VPs/ Managers
M&A and Corporate Development
Strategy Teams and R&D Heads
Procurement and Product Directors
Regulatory and Compliance Leaders
Investor Relations and Equity Analysts