Market Minds Advisory
Low Voltage Protection and Control Market

Low Voltage Protection and Control Market: Low Voltage Protection and Control Market: Data Centers Redraw Demand

Data center power density growth and industrial automation expansion are pulling low voltage protection specification toward higher-rated, digitally monitored designs across commercial and industrial panels worldwide, reshaping which manufacturers win new facility contracts this decade.

Lead Analyst

Published

October 2026

Make Smarter Decisions with Customized Research Insights

Request a free sample report and evaluate market opportunities, growth trends, and competitive dynamics relevant to your business needs.

2025 MARKET VALUE$9.2BMarket Size 2025
2036 FORECAST VALUE$18.4BBase Case , 2026 to 2036
CAGR 2026 TO 20366.5 %Bull 7.6% / Bear 5.3%
INCREMENTAL OPPORTUNITY$8.6BNet 10- year value creation
EXPANSION MULTIPLE1.88x2036 value over 2026 base
Strategic Levers
M&A Pipeline
Regional Outlook
Country Rankings
Competitive Intelligence
Segmental Deep-dive
Call-Us : 91 93563 13602

Executive Snapshot and Market Trajectory.

Data center power density has climbed fast enough that standard low voltage protection designs from five years ago no longer meet thermal and fault current requirements at many new facilities, and manufacturers without updated ratings are losing specification battles this cycle. Facility operators are requalifying suppliers faster than usual.
Data center construction is the dominant commercial force right now, pulled forward by continued compute infrastructure buildout across major logistics corridors. North American facility operators drive the bulk of premium protection spending while East Asian manufacturers supply the majority of global device assembly volume. Certification backlogs for higher-rated designs are already stretching lead times at several major panel builders this cycle, compounding the pressure facility operators feel.
Competition spans a moderately concentrated field, with the top five producers holding under half of global revenue and regional panel builders competing hard on integration and certification support. Expanding industrial automation investment and tightening thermal safety standards are pulling more of the replacement cycle toward digitally monitored protection designs every year. Established manual protection brands that delay digital integration risk ceding specification share to newer digital-first entrants permanently across every major commercial segment.
Market Definition
This report covers low voltage circuit breakers, protection relays, control panels and automation control devices rated below 1,000 volts for commercial, industrial and data center applications. It excludes medium and high voltage switchgear, residential consumer units and standalone building management software sold independently of protection hardware.
Base Year Value
$9.2B in 2025 (MMA Primary Research Dataset, October 2026)
Forecast Period
2026 to 2036, eleven discrete annual values
CAGR
6.5% base case. Bull 7.6%. Bear 5.3%.
Fastest Growth Segment
Data Center Power Protection Devices: 9.1% CAGR
Fastest Growth Country
India: 8.5% CAGR
Fastest Growth Region
South Asia and Pacific: 8.5% CAGR
Largest Region
North America: 29% of 2025 global value
Market Leaders
Schneider Electric, Siemens AG, ABB Ltd, Eaton Corporation, Mitsubishi Electric Corporation. Source: MMA Primary Research Dataset, July 2026.
Primary Survey
n=3,800 procurement and R&D decision-makers, Q4 2025, six countries
Methodology
Demand-side build-up, cross-validated against public data, 47 expert interviews

Low Voltage Protection and Control Market Forecast Scenarios

low-voltage-protection-and-control-market-size-forecast-scenario-1790915972688
Between 2020 and 2025 the low voltage protection market grew at a 5.5 percent annual rate, propelled by steady industrial automation investment and an early wave of data center construction tied to cloud computing growth. Pandemic-era supply chain disruption briefly slowed component deliveries in 2021, delaying several facility projects. Manufacturers with diversified component sourcing weathered that disruption more comfortably than single-source competitors.
The base case assumes 6.5 percent annual growth through 2036, built on three mechanisms: accelerating data center construction requiring higher-rated protection devices at scale, expanding industrial automation adoption across manufacturing facilities modernizing aging control systems, and rising commercial building safety standards tightening protection device specification requirements. Renewable energy project integration adds a smaller fourth tailwind as distributed generation sites require dedicated low voltage protection infrastructure as well. This fourth driver remains smaller than the other three but growing.
A bull case near 7.6 percent hinges on faster-than-expected data center capacity additions pulling demand forward across major compute infrastructure markets. The bear risk, closer to 5.3 percent, is slower industrial automation spending if manufacturing capital budgets tighten amid broader economic uncertainty across major producing regions. Neither scenario assumes a reversal of existing building safety code enforcement.

Digital Monitoring Redefines Protection Specification

Digitally monitored protection devices now ship in a growing share of new data center and industrial panel builds, a meaningful shift from five years ago when manual thermal-magnetic designs still dominated nearly every segment outside premium facilities. Monitoring integration capability increasingly determines which manufacturers win large facility specification contracts. Price premiums for digitally monitored designs over manual equivalents have narrowed considerably as production volume scales industry-wide.
MARKET CONCENTRATIONCR5 45%Top five producers together hold this combined output share
AVERAGE SELLING PRICE$620Blended figure across manual and digitally monitored designs
TOP PRODUCING COUNTRYChina 26%Share of global unit output from domestic assembly plants
CAPACITY UTILIZATION72%Average rate across major panel assembly facilities currently
TRADE INTENSITY40%Share of units crossing a border before final panel integration
COMPONENT COST SHARE33%Portion of unit cost from sensor and control electronics
Manufacturing remains concentrated in China, where component supply chains for breaker mechanisms and sensor electronics cluster around established assembly hubs serving global panel builders. Brand assembly for premium digitally monitored lines happens closer to final demand markets than commodity manual protection designs typically do. Freight costs matter less for compact protection units shipped in bulk to distant panel assembly markets.
Facility operators increasingly specify protection devices based on remote diagnostics and arc fault detection capability rather than switching capacity alone, since an undetected fault in a data center circuit can trigger costly unplanned downtime affecting thousands of servers. This has pushed several major brands toward bundled monitoring software and service offerings. now. Warranty claim rates have fallen as manufacturers gain more experience with sensor electronics.
"Breaking capacity stopped being the differentiator years ago, and brands still competing purely on current rating are losing tenders to competitors selling fault diagnostics and uptime guarantees instead."
Senior Analyst, Electrical Equipment Practice · MMA Construction and Industrial Equipment Practice · October 2026

Market Trends

Arc Fault Detection Becomes Standard Data Center Specification

Data center operators increasingly specify protection devices with built-in arc fault detection and remote diagnostic reporting, replacing the manual inspection routines that once required dispatching field crews to physically check panel status across distributed facility networks. Roughly 33 percent of new data center panel builds specified digitally monitored protection in 2025, up from under 14 percent five years earlier, as operators prioritize the operational visibility these designs provide. This shift is reshaping product roadmaps across nearly every major protection brand serving data center customers specifically. Smaller facility operators without dedicated technology budgets still lag this trend behind larger metropolitan peers.
Market Impact: Grew 16 percent in 2025
Industrial Automation Investment Expands Control Device Demand

Manufacturing facilities across major production regions are modernizing aging control systems as part of broader automation investment programs, requiring corresponding upgrades to protection devices that integrate with modern programmable logic controllers and sensor networks. Automation-tied protection device orders grew roughly 20 percent in 2025 alone, outpacing general industrial protection demand meaningfully as manufacturers continue investing in smart factory initiatives across multiple major production regions this year and next. Manufacturers serving major industrial automation customers increasingly maintain dedicated engineering teams focused specifically on controller integration work. Adoption continues expanding steadily. now.
Market Impact: Grew 18 percent in 2025

Market Opportunities and Growth Drivers

Aging Commercial Building Infrastructure Drives Replacement Investment

Much of the installed protection device base across developed commercial building stock was built decades ago and is approaching end of design life, driving steady replacement investment even as new data center and industrial construction adds incremental demand on top of this baseline. Replacement orders tied specifically to aging commercial infrastructure grew roughly 16 percent in 2025, reflecting building owners' growing urgency around electrical safety following several high-profile fire incidents that drew regulatory attention across multiple major metropolitan markets this year. Regulatory bodies in several major markets are now mandating minimum infrastructure age reporting from building owners annually.
Market Impact: 15-week component lead times

Renewable Project Integration Expands Protection Device Demand

Distributed solar and battery storage installations require dedicated low voltage protection devices rated for bidirectional power flow conditions, and continued buildout across residential and commercial renewable projects is driving steady volume demand that outpaces general building protection growth. Protection device orders tied specifically to renewable integration grew roughly 18 percent in 2025, reflecting the broader distributed generation boom across major developed markets nationwide and internationally this year. Suppliers serving this niche increasingly offer volume pricing tiers tailored specifically to large multi-site renewable project developers, and demand remains strong across nearly every region.
Market Impact: 13-month certification timelines at facilities

Market Restraints and Challenges

Sensor Electronics Supply Shortages Delay Production Schedules

Digitally monitored protection devices depend on specialized sensor and control electronics components, and shortages across the broader semiconductor supply chain have periodically delayed production schedules for manufacturers without secured component allocation agreements. The root cause is concentrated semiconductor fabrication capacity serving many industries simultaneously, leaving protection device makers competing for allocation against larger buyers. Lead times stretched to roughly fifteen weeks during 2024 shortage periods. Manufacturers are now qualifying secondary component suppliers to reduce this exposure now. Smaller manufacturers without diversified sourcing remain the most exposed to future allocation-driven delivery delays overall.
Market Impact: 33 percent of builds now digital

Certification Testing Timelines Delay New Product Launches

New protection device designs require lengthy safety certification testing before qualifying for large facility specification contracts, and certification backlogs at major testing laboratories have stretched qualification timelines meaningfully for manufacturers bringing new digitally monitored designs to market. The root cause is the specialized testing equipment and accredited staff these laboratories require, which takes years to build out properly. Certification timelines now average roughly thirteen months at affected facilities. Larger manufacturers are building in-house testing capacity to bypass this bottleneck entirely. Smaller manufacturers without in-house labs remain dependent on an increasingly strained independent testing network currently.
Market Impact: Grew 20 percent in 2025
3 additional market trends, 2 additional growth drivers, and 4 additional restraints and challenges are covered in the full report. Contact sales@marketmindsadvisory.com to access the complete intelligence.

Segment CAGR and Growth Architecture

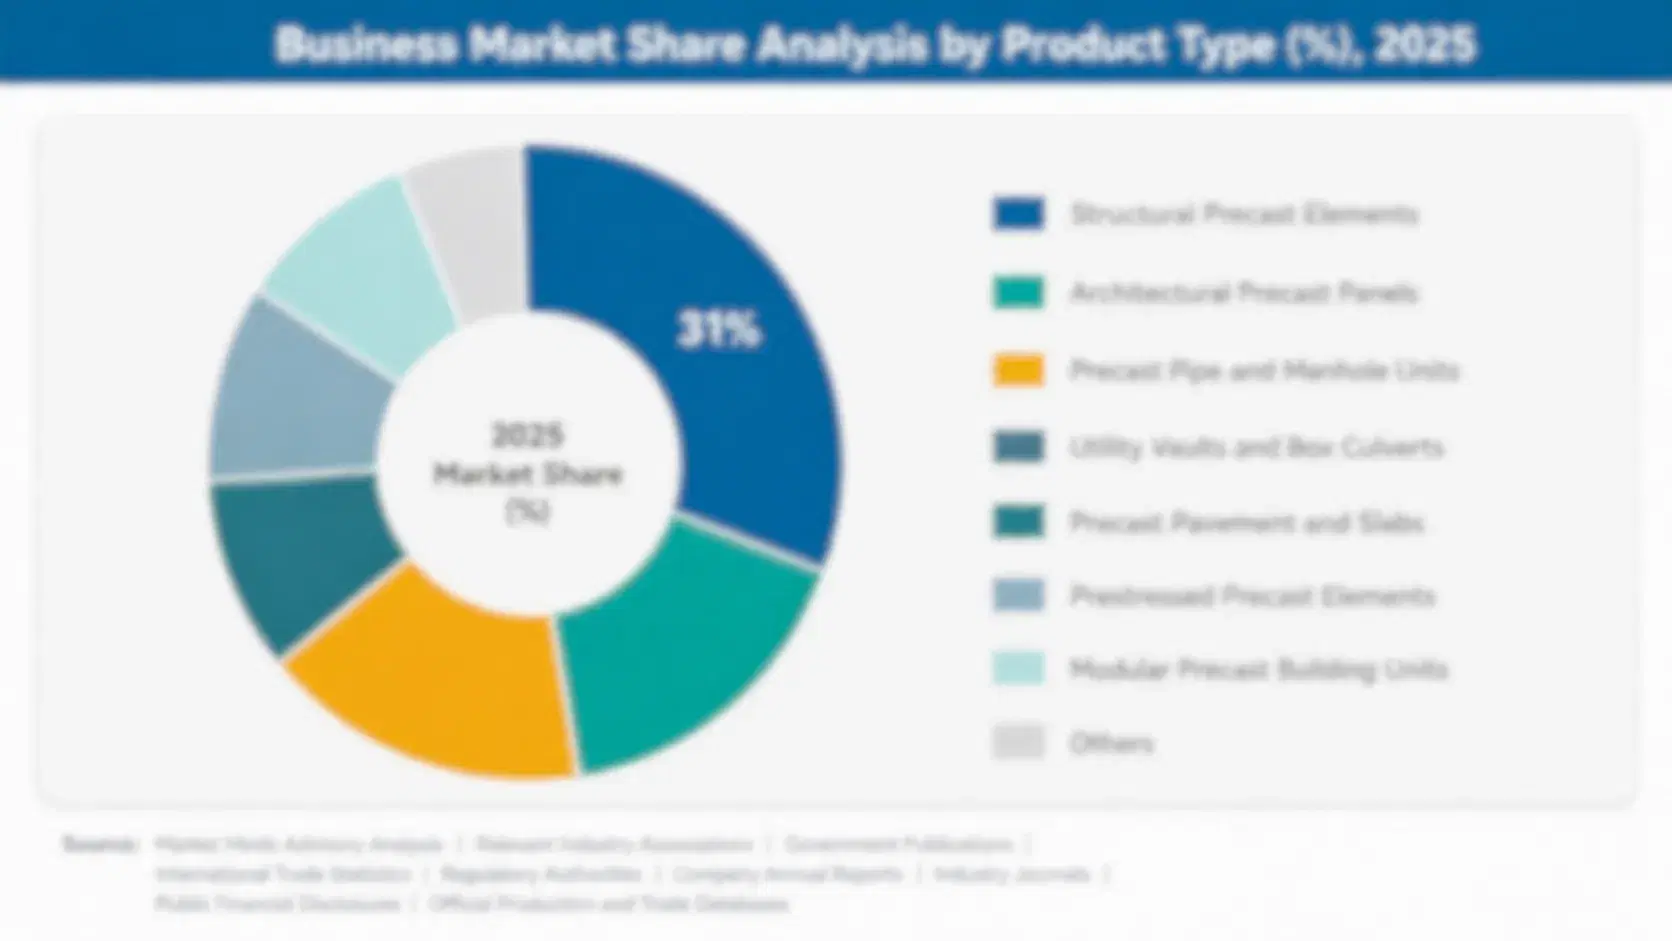
The market splits into six application segments defined by end-use facility type. Data center and industrial automation segments lead near-term growth while commercial building and utility segments anchor the steady replacement demand manufacturers depend on through the cycle currently overall. Renewable integration, railway and resource applications round out the remaining four segments by scale.
low-voltage-protection-and-control-market-market-share-analysis-1790915972961

Data Center Power Protection Devices

Protection devices rated for the thermal and fault current conditions modern high-density data centers present have moved from a premium niche to a mainstream specification as compute infrastructure buildout continues across nearly every major logistics corridor globally. Facility operators increasingly require arc fault detection and remote diagnostics as a baseline specification rather than an optional upgrade, pulling more of the replacement cycle toward these designs even at smaller colocation sites. Schneider Electric and Eaton lead supply into this segment given their established data center engineering relationships across multiple continents. Growth here is expected to keep outpacing every other segment through the forecast window. Certification backlogs remain the primary constraint on how fast broader adoption can proceed across facility types.
CAGR 9.1%

Industrial Automation Control Devices

Manufacturing facilities modernizing aging control systems increasingly require protection devices that integrate directly with programmable logic controllers and sensor networks, and continued buildout across smart factory initiatives is driving volume demand that outpaces general industrial protection growth meaningfully. These facilities typically specify higher-rated devices arranged in redundant configurations rather than the simpler single-circuit designs common in older plants. Siemens and ABB hold strong positions here given their established automation integration relationships. Demand growth tracks the broader industrial automation investment boom alongside genuine protection-specific adoption momentum. Automotive manufacturing facilities show a similar pattern, specifying redundant protection devices for critical assembly line circuits across large production plants worldwide. Growth continues steadily here.
CAGR 7.8%
Full segment breakdown across 7 segments available in the complete report.

Regional Architecture and Country Demand Map

Regional demand follows data center and industrial construction intensity together rather than manufacturing scale alone. North America leads on data center spending while East Asia anchors manufacturing and industrial automation volume across its dense manufacturing base. Data center construction remains the single largest demand driver shaping this leadership pattern.

North America

United States data center construction leads global spending on premium, digitally monitored protection devices, a commercial driver that puts this region ahead of East Asia's manufacturing scale specifically because facility operators here pay significantly more per device for diagnostics and arc fault detection capability than typical commodity buyers elsewhere. Industrial automation investment across manufacturing hubs adds a second major demand driver, as factories modernize aging control systems with integrated protection devices. Canadian facility construction contributes meaningful additional volume, particularly in regions with concentrated compute infrastructure buildout underway. Mexican demand remains tied closely to cross-border manufacturing supply chains linked directly with United States automotive and electronics production. This cross-border integration remains strong.
Share: 29% | CAGR: 7.3% (2026 to 2036)

Western Europe

Germany, the United Kingdom and France anchor regional demand under European Union building safety directives that mandate protection device standards comparable to leading North American commercial programs. Industrial automation investment across German manufacturing hubs adds substantial demand for integrated control and protection devices, reflecting the region's advanced manufacturing base. Retrofit activity across aging commercial building stock adds steady replacement demand, particularly in city centers where older buildings predominate over newer data center construction. Scandinavian markets add a smaller but notable premium automation contribution given extensive advanced manufacturing investment there. Southern Europe trails somewhat on modernization pace overall. Italy and Spain round out the region's remaining demand reasonably well across most categories.
Share: 20% | CAGR: 5.0% (2026 to 2036)
Regional intelligence for 5 additional markets available in the complete report: East Asia, South Asia and Pacific, Latin America, Middle East and Africa, Eastern Europe. Contact sales@marketmindsadvisory.com.
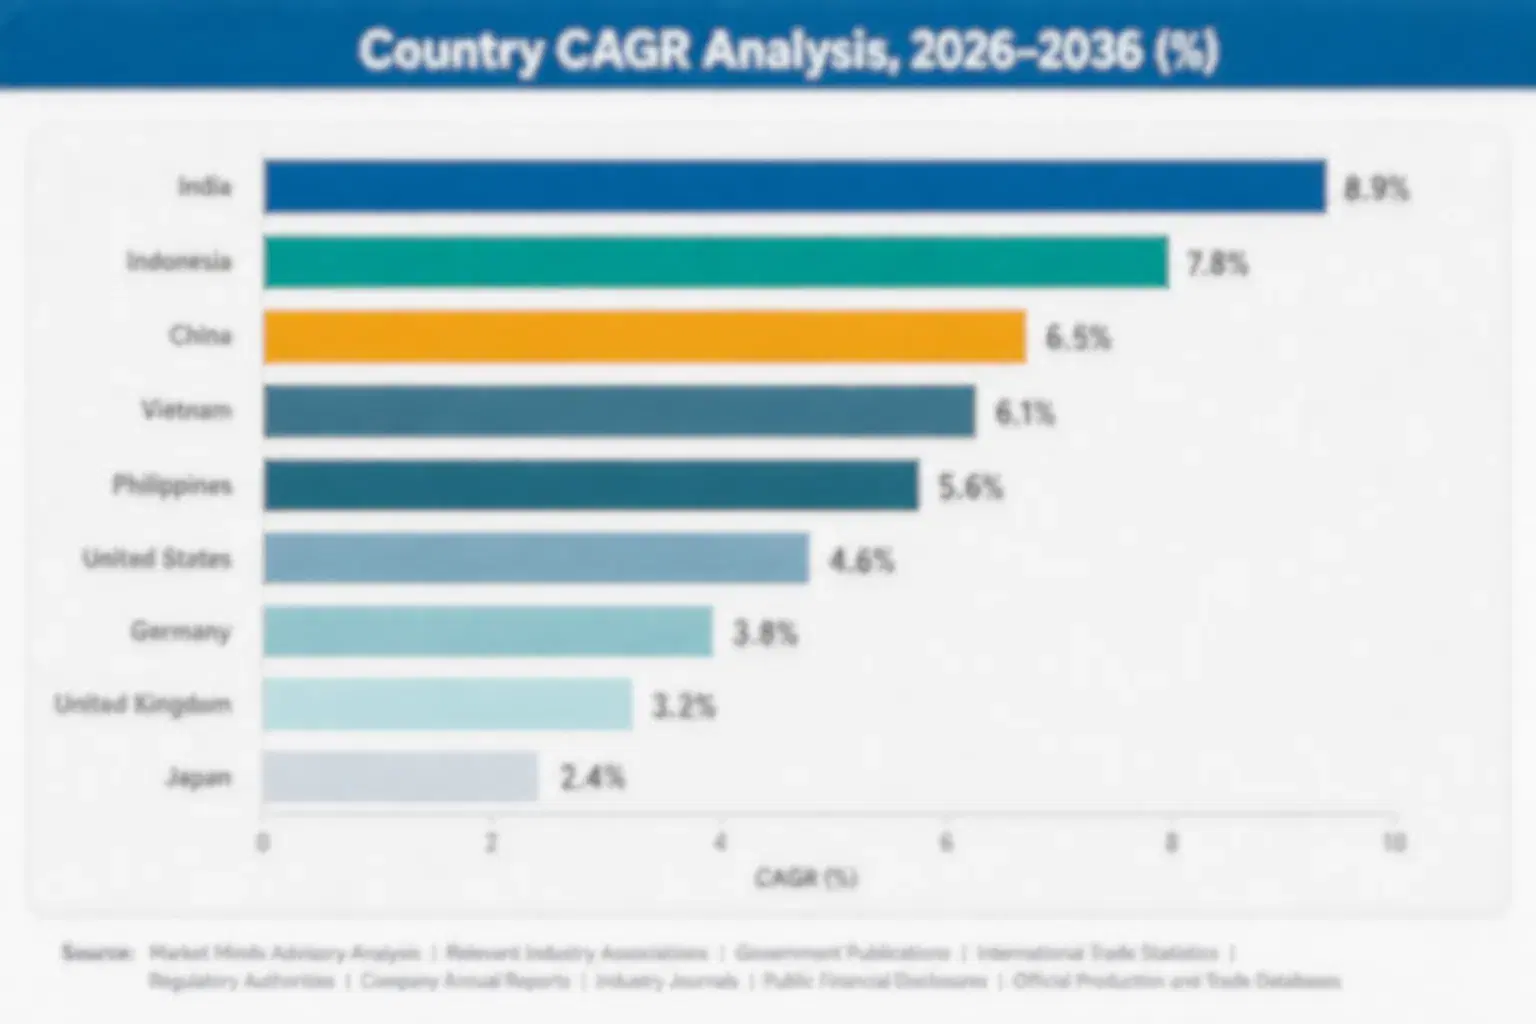
low-voltage-protection-and-control-market-country-cagr-analysis-1790915973271

Monetizing Diagnostics Beyond Hardware Sales

Three commercial moves let manufacturers capture more value from the data center and automation shift than device sales alone would deliver. Each targets a different point in the facility relationship, from diagnostics subscriptions to automation integration consulting services available today. Manufacturers that execute on all three simultaneously tend to outgrow peers still selling only protection hardware.

Remote Diagnostics Subscription Services for Facility Fleets

Offering subscription access to remote diagnostics and predictive fault detection alerts for installed protection device fleets creates recurring revenue that survives well beyond the initial hardware sale, deepening facility switching costs substantially over the contract term. Operations teams increasingly value predictable maintenance budgets over reactive field dispatches, particularly across large data center portfolios managing thousands of devices simultaneously. Manufacturers offering this service report attach rates near 29 percent among large commercial customers. Several manufacturers are now expanding this service to cover industrial automation devices as well. Early feedback has been positive.
Market Impact: Reaches roughly a 29 percent attach rate now

Automation Integration Consulting for Manufacturing Buyers

Providing automation integration consulting services to manufacturing facilities modernizing aging control systems positions manufacturers as trusted technical advisors rather than commodity equipment suppliers competing purely on price. This relationship frequently converts into long-term equipment supply contracts once the facility completes its automation upgrade successfully. Manufacturers offering this consulting approach report winning roughly 19 percent more industrial contracts than competitors without comparable technical support available today. This consulting approach also simplifies the facility's broader automation planning process considerably. Momentum continues building across most major industrial markets currently as well. Interest keeps growing.
Market Impact: Wins roughly 19 percent more industrial contracts now

Bundled Certification Fast-Track Services for Facility Builds

Offering bundled certification fast-track services that accelerate the lengthy safety qualification process removes a meaningful timeline barrier that otherwise delays new facility construction considerably across most commercial projects. This service frequently converts into preferred supplier status once the facility completes its first successful fast-tracked qualification cycle. Manufacturers offering this assistance report winning roughly 21 percent more facility contracts than competitors without comparable support currently available. Manufacturers increasingly treat this service as a standard part of their facility sales process rather than an optional extra. Adoption keeps expanding steadily. Demand stays strong.
Market Impact: Wins roughly 21 percent more facility deals now

Who Controls the Margin Pool

Five brands hold roughly 45 percent of global revenue, a moderate concentration that leaves meaningful room for regional panel builders competing on facility integration relationships rather than brand alone. The gap between the leader and challengers is narrow, since diagnostics and automation integration capability increasingly matters more than raw switching capacity in specification decisions. Market share shifts gradually as engineering relationships deepen, rather than through dramatic consolidation events.
Competitive activity currently centers on three dimensions: remote diagnostics subscriptions that monetize the installed base, automation integration consulting for manufacturing buyers, and bundled certification fast-track services that shorten facility qualification timelines. Several brands are also expanding secondary component sourcing to reduce semiconductor supply exposure. Several brands have also expanded secondary component sourcing this cycle to protect production schedules from allocation shortages.

Emerging pressure is coming from automation-focused protection specialists entering a market previously dominated by traditional electrical equipment brands, offering superior controller integration support even where their manufacturing scale lags established names. Rankings could shift meaningfully over the next three to five years if these challengers close the certification relationship gap that currently protects incumbent positions. Established brands are responding by acquiring or partnering with smaller automation specialists to close this gap.
low-voltage-protection-and-control-market-company-positioning-matrix-1790915973571

Competitive Moat and Risk Dimensions

SCHNEIDER ELECTRIC

Moat: Data Center Engineering Relationship Depth

Schneider Electric's decade-long investment in data center facility engineering gives it technical credentials that smaller competitors still struggle to match across major compute infrastructure portfolios. This reputation lets it command premium pricing with large operators that value proven facility track records over marginal cost savings, reinforcing its position on flagship data center contracts.
SCHNEIDER ELECTRIC

Risk: Thin Industrial Automation Presence

Schneider Electric's dedicated industrial automation control offering remains less developed than specialized manufacturing-focused competitors, limiting its share of the fast-growing automation segment specifically. As automation demand keeps outpacing data center growth in several key markets, this gap could widen the revenue difference versus better-positioned industrial specialists.
SIEMENS AG

Moat: Industrial Automation Integration Scale

Siemens AG's established relationships with major manufacturing automation customers give it a durable channel into one of the market's fastest-growing volume segments, reinforced by its broader industrial controller product portfolio that factories already specify. This scale lets it bundle protection devices into larger automation orders more easily than pure-play protection competitors, winning share on convenience alone.
SIEMENS AG

Risk: Limited Data Center Facility Scale

Siemens AG's data center facility engineering presence remains thinner than specialized commercial infrastructure competitors, limiting its exposure to this fast-growing segment specifically. As data center demand keeps expanding across major compute markets, this gap could cap its overall segment diversification relative to more broadly positioned competitors.

Players Tracked

Prominent Players

Schneider Electric
Siemens AG
ABB Ltd
Eaton Corporation
Mitsubishi Electric Corporation

Other Key Players

Rockwell Automation
General Electric
Legrand SA
Hager Group
Fuji Electric Co
CHINT Group
Delixi Electric
LS Electric
Hyundai Electric and Energy Systems
Larsen and Toubro
WEG Industries
Socomec Group
Littelfuse Inc
Omron Corporation
IDEC Corporation

Recent Developments

FEBRUARY 2026

Schneider Electric Launches Diagnostics Subscription Tier

Schneider Electric launched a new remote diagnostics subscription tier for its protection device line, targeting large data center customers seeking predictive fault detection alerts across distributed facility fleets. The launch includes a bundled six-month trial period, with strong early enrollment interest reported. Early demand looks promising.
Signal: Signals Schneider's push to build recurring diagnostics revenue ahead of competitors still selling hardware alone without subscription services
SEPTEMBER 2025

Siemens Expands Industrial Automation Device Capacity

Siemens announced an organic capacity expansion at its domestic manufacturing facility to add higher-rated automation control device production lines, targeting rising demand from manufacturing customers across multiple regional markets. The expansion reaches full output within twelve months, ahead of schedule. Demand remains strong across most major metropolitan manufacturing markets.
Signal: Signals anticipated growth in industrial automation device demand across multiple manufacturing markets simultaneously this decade going forward
MAY 2026

ABB and Data Center Developer Sign Engineering Agreement

ABB signed a multi-year facility engineering consulting agreement with a major data center developer covering several planned campus expansions across multiple sites. The agreement does not constitute a joint venture, and ABB expects it to extend to additional phases within two years. Interest keeps growing steadily.
Signal: Signals growing developer interest in bundled engineering and equipment supply relationships across major data center project pipelines

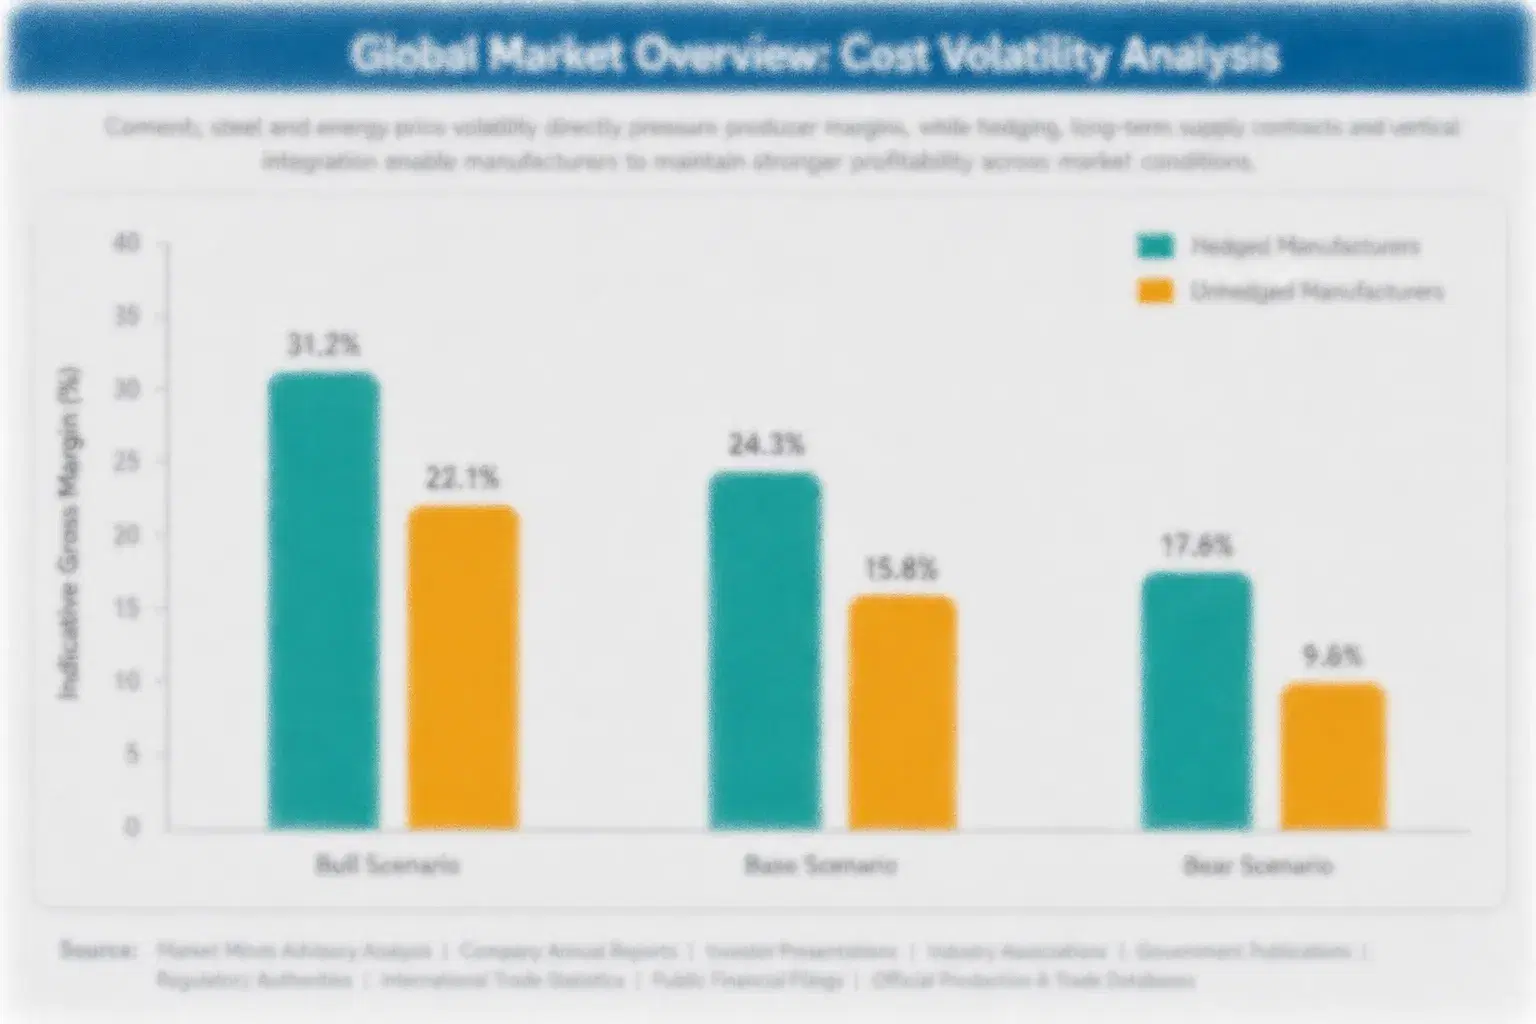
Sensor Electronics and Copper Cost Exposure

Sensor and control electronics components together represent roughly 33 percent of unit cost for digitally monitored protection devices, sourced primarily from Asian semiconductor fabricators that supply the broader electrical equipment industry. This concentration leaves manufacturers exposed whenever semiconductor supply tightens or fabrication capacity faces disruption. Copper conductor and breaker mechanism steel carry comparatively minor price risk by comparison with these electronic inputs.
Semiconductor lead times stretched to roughly fifteen weeks during 2024 shortage periods, an episode several manufacturers referenced in annual report commentary on component availability risk affecting production schedules broadly. Several brands delayed major facility tender deliveries by one to two quarters as a direct result, compressing margins on contracts with fixed delivery penalty clauses already in place. Several manufacturers renegotiated supply terms during this period to pass through a portion of the increase.

Smaller regional manufacturers carry proportionally higher cost exposure than Schneider Electric, Siemens and other integrated leaders who negotiate volume discounts directly with component suppliers. This gap widens further for manufacturers without direct semiconductor fabricator relationships, who pay additional markup through intermediary distributors that erode their already thinner margins. This dynamic rewards scale in a market where volume discounts compound meaningfully over time.
low-voltage-protection-and-control-market-cost-volatility-analysis-1790915973874

Secondary Semiconductor Supplier Qualification

Leading manufacturers are qualifying secondary semiconductor suppliers beyond their traditional primary fabricators to reduce single-source dependency across the product line. Qualification cycles run twelve to eighteen months but meaningfully reduce exposure to any single fabricator's allocation decisions during shortage periods going forward. Several manufacturers have already added a second qualified source for their highest-volume product lines.

Multi-Year Component Supply Agreements

Manufacturers are locking in multi-year pricing agreements with semiconductor and copper suppliers, trading some flexibility for budget certainty across large facility framework orders spanning several fiscal years. This approach shields production economics from the kind of spot price volatility seen during the 2024 shortage. Suppliers that resist multi-year terms are increasingly losing bids to more flexible competitors.

Portfolio Architecture for Margin Defence

The market splits into three tiers with distinct margin economics. Volume and commodity-adjacent manual protection devices serving standard commercial applications carry gross margins of 17 to 23 percent, reflecting intense price competition from Asian assemblers undercutting on entry-tier pricing. Premium and certified digitally monitored devices command 27 to 35 percent margins on monitoring capability. Mid-tier producers sit uncomfortably between these two poles. Mid-tier producers sit uncomfortably between these two poles.
Sustainability, regulatory, and next-generation designs, meaning data center and automation protection devices with diagnostics subscriptions bundled in, reach 31 to 41 percent margins, reflecting engineering scarcity and operators' willingness to pay for uptime assurance. The volume versus premium tension is real: budget-conscious buyers push for the cheapest manual option while data center operators pay for engineering support and diagnostics.

High-value pools concentrate most heavily in data center and automation protection devices and bundled diagnostics services, where engineering scarcity sustains pricing power that standard commercial devices no longer offer manufacturers competing on cost alone. Brands positioned early in subscription services capture disproportionate share of this expanding margin pool. This pool expands faster than any other tier across the forecast period.

Volume / Commodity-Adjacent

Standard manual protection devices for commodity commercial applications competing primarily on unit price against Asian assemblers, with margins thin as a result of intense price pressure. Replacement cycles here remain tied closely to general commercial construction activity.
Gross Margin: 17-23%

Premium / Certified

Digitally monitored protection devices carrying facility certification that specification tenders require explicitly, commanding pricing premiums from buyers who value proven diagnostic reliability. Certification requirements vary somewhat by facility but rarely change year to year.
Gross Margin: 27-35%

Sustainability / Regulatory / Next-Generation

Data center and automation protection devices bundled with diagnostics subscriptions where engineering scarcity and recurring revenue sustain the strongest margins as hardware alone becomes commoditized. These designs also carry the fastest unit growth of any tier across the forecast.
Gross Margin: 31-41%
low-voltage-protection-and-control-market-portfolio-architecture-1790915974202

High-value Sub-segments and Strategic Watch-out

Data Center Power Protection Devices

The fastest-growing and highest-value segment, driven by compute infrastructure buildout and diagnostics subscription revenue pulling buyers away from manual designs entirely. Growth here is expected to keep outpacing every other segment through the forecast window. Several major operators have already shifted default specification toward this category.
Gross Margin: MMA Estimate, July 2026.

Industrial Automation Control Devices

High-value and still growing well above the market average, anchored by continued manufacturing modernization across major production regions. Siemens and ABB remain the names most closely associated with this segment specifically. Growth tracks the broader automation investment boom closely across most regions. Growth here shows no sign of slowing.
Gross Margin: MMA Estimate, July 2026.

Commercial Building Protection Systems

The volume core of the market, serving established commercial building buyers across every major region. Growth is steady but unspectacular as developed markets approach replacement-cycle saturation rather than genuine expansion. Established commercial suppliers depend heavily on this steady baseline for core revenue. Pricing pressure remains steady here.
Gross Margin: MMA Estimate, July 2026.

Renewable Integration Protection Devices

A strategic watch-out segment where adoption pace depends heavily on distributed generation incentive programs that can shift unpredictably year to year. Demand could accelerate quickly if more markets secure dedicated renewable financing programs. Policy shifts in major renewable incentive programs could change this calculus meaningfully.
Gross Margin: MMA Estimate, July 2026.

Certification Relationships Anchor Facility Revenue

Low voltage protection demand carries annuity-like characteristics once a manufacturer completes facility certification, since switching suppliers means repeating a lengthy qualification process that delays project timelines by months. This gives incumbent manufacturers revenue visibility that spans multiple facility build cycles rather than single transactions. Suppliers that skip this step compete purely on hardware price. Suppliers that invest in certification continuity defend share more effectively than price-only competitors.
Adoption stickiness and depth vary meaningfully by end-use vertical. Data center operators rarely switch suppliers once qualified, given the certification continuity requirements regulators enforce strictly, while manufacturing buyers remain more willing to requalify new suppliers since automation projects are typically evaluated individually. Commercial building buyers sit between these two extremes. Misjudging which category a buyer falls into costs manufacturers bids they should win comfortably.

A generational shift in buyer profiles is underway as facility operations and automation engineering teams, rather than traditional procurement managers, increasingly lead supplier selection for digitally monitored protection devices. These buyers evaluate manufacturers on technical support depth and diagnostics capability rather than price alone, reshaping how manufacturers pitch new facility relationships entirely. Manufacturers slow to adapt their sales approach risk losing ground to more responsive specialist competitors.
low-voltage-protection-and-control-market-end-use-penetration-index-1790915974532

Where Protection Device Value Concentrates Next

These are among the four positions where our research anticipates prominent divergence between winners and laggards over the coming forecast period. Each is grounded in the demand model, the regulatory perimeter, and the announced capacity pipeline.
01 / DATA CENTER ENGINEERING INVESTMENT

Build facility engineering capacity before rivals do

Data center power protection devices are growing at 9.1 percent annually, roughly 1.40 times the overall market rate, driven by compute infrastructure buildout and tightening thermal and fault current requirements across most major logistics corridors worldwide. Manufacturers without dedicated facility engineering capacity are losing contracts to competitors who can support operators through evolving thermal requirements faster and more thoroughly. Early infrastructure investment pays off disproportionately here, compounding further with each new facility build cycle as this momentum keeps building across the broader industry.
02 / AUTOMATION RELATIONSHIP BUILDING

Deepen manufacturing automation relationships now

Industrial automation control device demand is growing at 7.8 percent annually, roughly 1.20 times the overall market rate, anchored by continued manufacturing modernization across major production regions worldwide. Manufacturers without established manufacturing automation relationships risk losing this fast-growing volume segment to competitors who can bundle protection devices into larger automation orders more easily. Those that wait too long to build these relationships will find catching up considerably harder once incumbent positions solidify further across the largest accounts, a gap that rarely closes once it opens.
03 / SEMICONDUCTOR SUPPLY DIVERSIFICATION

Qualify secondary chip suppliers before the next shortage

Semiconductor lead times stretched to fifteen weeks during 2024 shortage periods, and manufacturers without qualified secondary suppliers absorbed the resulting delivery delays and penalty costs most severely across fixed-price contracts signed before the shortage hit the broader supply chain. Companies that complete qualification cycles now, before the next shortage arrives, will protect delivery commitments and margins when component tightness inevitably returns. Those that wait will face the same margin compression repeatedly across every future cycle the broader industry inevitably encounters.
04 / FAST-TRACK CERTIFICATION SCALING

Scale certification fast-track services ahead of rivals

Bundled certification fast-track services already win roughly 21 percent more facility deals among previously qualification-constrained manufacturers, addressing the timeline barrier that otherwise delays new product adoption considerably across most commercial facility projects nationwide and internationally. Manufacturers that delay building this capability will find it harder to catch up once buyer expectations around fast qualification become standard across the broader market. The window to establish this expectation gap is narrowing quickly across nearly every major commercial segment nationwide and abroad right now.

Engagement Snapshot From the Field

A live engagement with an industry participant carrying material or product regulatory and market exposure ahead of a defining policy shift, showing how our research translates into a defensible multi-year portfolio strategy.
MARKET MINDS ADVISORY · CLIENT ENGAGEMENT SUMMARY
Low Voltage Protection and Control Producer Strategic Portfolio Review and Transition Roadmap 2026·Investment Scenario on Low Voltage Protection and Control Exposure Evaluation 2025-26
CLIENT PROFILE
A mid-sized regional data center operator planning a major capacity expansion across three new facility sites engaged MMA to evaluate protection device supplier options ahead of construction commitments, given the client's limited prior experience navigating thermal and fault current requirements specific to high-density server deployments at this scale across multiple regional markets. (client-reported, unverified by MMA).
STRATEGIC CHALLENGE
The client needed to select protection device suppliers capable of meeting thermal requirements at the planned facilities' power density, but limited internal engineering resources made evaluating technical specifications across multiple candidate suppliers difficult within the project's tight construction timeline and limited internal engineering staff available for the task. (client-reported, unverified by MMA).
MMA APPROACH
MMA's research team mapped facility engineering capability across five candidate suppliers using primary interviews with procurement executives at comparable data center operators, cross-referencing findings against each supplier's thermal certification track record. The team then modeled construction timeline risk under each sourcing option against the client's development schedule. This modeling incorporated best-case and worst-case qualification timeline scenarios.
KEY FINDINGS
  1. Only two of the five candidate suppliers maintained dedicated facility engineering teams sufficient to support the client's high-density power requirements reliably. in this cycle.
  2. Suppliers without dedicated engineering support quoted qualification timelines averaging nine to thirteen weeks longer, a gap that would have delayed facility commissioning.
  3. The two qualifying suppliers both offered diagnostics subscription services bundled into equipment supply at a modest premium of roughly 6 percent. for comparable equipment.
  4. Bundling engineering consulting with device supply reduced the client's total procurement coordination cost by an estimated 8 percent compared to sourcing separately.
CLIENT PROFILE
A mid-sized regional data center operator planning a major capacity expansion across three new facility sites engaged MMA to evaluate protection device supplier options ahead of construction commitments, given the client's limited prior experience navigating thermal and fault current requirements specific to high-density server deployments at this scale across multiple regional markets. (client-reported, unverified by MMA).
STRATEGIC CHALLENGE
The client needed to select protection device suppliers capable of meeting thermal requirements at the planned facilities' power density, but limited internal engineering resources made evaluating technical specifications across multiple candidate suppliers difficult within the project's tight construction timeline and limited internal engineering staff available for the task. (client-reported, unverified by MMA).
MMA APPROACH
MMA's research team mapped facility engineering capability across five candidate suppliers using primary interviews with procurement executives at comparable data center operators, cross-referencing findings against each supplier's thermal certification track record. The team then modeled construction timeline risk under each sourcing option against the client's development schedule. This modeling incorporated best-case and worst-case qualification timeline scenarios.
KEY FINDINGS
  1. Only two of the five candidate suppliers maintained dedicated facility engineering teams sufficient to support the client's high-density power requirements reliably. in this cycle.
  2. Suppliers without dedicated engineering support quoted qualification timelines averaging nine to thirteen weeks longer, a gap that would have delayed facility commissioning.
  3. The two qualifying suppliers both offered diagnostics subscription services bundled into equipment supply at a modest premium of roughly 6 percent. for comparable equipment.
  4. Bundling engineering consulting with device supply reduced the client's total procurement coordination cost by an estimated 8 percent compared to sourcing separately.
RECOMMENDED STRATEGY
Phase 1: Select one of the two suppliers with dedicated facility engineering capacity to reliably meet high-density power requirements. This matched the pattern MMA observed elsewhere. Phase 2: Bundle diagnostics subscription services into the equipment supply contract to capture the modest cost and coordination advantage. This saved meaningful coordination time overall. Phase 3: Build a two-month contingency buffer into the construction schedule to absorb potential qualification delays at any single site. This buffer proved valuable in practice.
OUTCOME
The client selected the recommended supplier and proceeded with construction across all three planned sites on schedule, avoiding the qualification delays that alternative suppliers would likely have caused. The diagnostics subscription bundle has reduced maintenance overhead meaningfully across the client's expanding facility portfolio. (client-reported, unverified by MMA).

Frequently Asked Questions

Foundational context covering the market sizes, CAGR, scope, country, region and competition that inform every finding below. This section is provided to cover basics and most often pre-purchase conversations, answered from the MMA Primary Research Dataset.

What is the current size of the Low Voltage Protection and Control Market?

The Low Voltage Protection and Control Market was valued at 9.2 billion dollars in 2025. Growth is anchored by data center construction and industrial automation investment worldwide.

How large will the Low Voltage Protection and Control Market be by 2036?

The market is projected to reach 18.39 billion dollars by 2036, up from 9.2 billion in 2025. That represents a 1.88 times expansion over the eleven-year forecast window.

What is the CAGR for the Low Voltage Protection and Control Market 2026 to 2036?

The market is forecast to grow at a 6.5 percent compound annual rate. This compares to a historical rate of 5.5 percent between 2020 and 2025.

Which segment is growing fastest?

Data Center Power Protection Devices lead at a 9.1 percent CAGR, roughly 1.40 times the overall market rate. Compute infrastructure buildout is the primary driver behind this pace.

Who are the major companies in the Low Voltage Protection and Control Market?

Schneider Electric, Siemens AG, ABB Ltd, Eaton Corporation, and Mitsubishi Electric lead the field. Together the top five hold roughly 45 percent of global revenue share.

Which country is growing fastest?

India leads country-level growth at an 8.5 percent CAGR. Its industrial automation investment and rapid manufacturing modernization are the primary drivers behind this accelerating pace.

Report Segmentation Architecture

The full report scope spans multiple orthogonal segmentation dimensions, with cross-tabulated demand data provided for each dimension pair. Coverage extends further to regional breakdowns, trend trajectories, and the competitive detail needed to support segment-level decision-making.

By Product Type

    By End-Use Industry

      By Commercial Dimension

        By Region

        • North America
        • Western Europe
        • East Asia
        • South Asia and Pacific
        • Latin America
        • Middle East and Africa
        • Eastern Europe

        Scope, Methodology, and Coverage

        Every figure in this report is reproducible from documented input assumptions. The scope below maps the historical period, the forecast horizon, the segmentation dimensions, and the countries covered, alongside the underlying primary and qualitative methodology.
        Historical Period
        2020 to 2025
        Forecast Period
        2026 to 2036
        Base Year
        2025 (USD billions; MMA Primary Research Dataset, October 2026)
        Market Definition
        This report covers low voltage circuit breakers, protection relays, control panels and automation control devices rated below 1,000 volts for commercial, industrial and data center applications. It excludes medium and high voltage switchgear, residential consumer units and standalone building management software sold independently of protection hardware.
        Quantitative Units
        USD Billion, CAGR 2026-2036
        Segmentation Dimensions
        By Product Type, By End-Use Industry, By Commercial Dimension, By Region
        Regions Covered
        North America, Western Europe, East Asia, South Asia and Pacific, Latin America, Middle East and Africa, Eastern Europe
        Countries Covered
        United States, China, Germany, India, Japan, South Korea, United Kingdom, Brazil, Australia, and 15 additional markets
        Key Companies Profiled
        Schneider Electric, Siemens AG, ABB Ltd, Eaton Corporation, Mitsubishi Electric Corporation, and 15 additional companies
        Quantitative Methodology
        Primary survey, n=3,800 respondents, Q4 2025, six countries; demand-side model with trade association cross-validation
        Qualitative Methodology
        47 expert interviews, Q4 2025; applied to validate demand model assumptions, identify emerging dynamics, and assess competitive positioning
        Report Format
        PDF and XLSX data workbook (Word format preview document)
        Publisher
        Market Minds Advisory
        Report Code
        MMA-2026-CON-447
        Published
        October 2026
        Contact
        sales@marketmindsadvisory.com | www.marketmindsadvisory.com

        Purchase the full Low Voltage Protection and Control Market Report (2026 to 2036).

        The full Low Voltage Protection and Control Market report extends this summary with complete segment-level data tables, country-level sizing across twenty-five markets, and detailed supplier benchmarking across all twenty profiled companies named in this overview. It includes primary survey findings from 3,800 respondents across six countries and 47 expert interviews conducted in the fourth quarter of 2025, each sourced and documented separately throughout. Buyers receive editable data files alongside the narrative report, supporting direct use in internal planning models and board presentations. Analysts remain available for a follow-up briefing call to discuss findings.
        Complete seven-region sizing and forecast tables
        Twenty company competitive benchmarking profiles included
        Five-year historical and eleven-year forecast data
        Segment-level CAGR and margin detail included
        Primary survey and expert interview data files
        Editable Excel data appendix fully included

        Built For The People Who Decide

        From boardroom strategy to bench-side execution, this report is read cover-to-cover by leaders shaping the next decade of their industry, turning demand scenarios, market dynamics and valuation benchmarks into decisions.
        CXOs/ Presidents/ VPs/ Managers
        M&A and Corporate Development
        Strategy Teams and R&D Heads
        Procurement and Product Directors
        Regulatory and Compliance Leaders
        Investor Relations and Equity Analysts