Market Minds Advisory
Low-Permeation Fuel Lines & Hoses Market

Low-Permeation Fuel Lines & Hoses Market: Low-Permeation Fuel Lines and Hoses Market: Grams Per Square Metre Per Day

The whole product exists to hit a number measured in grams per square metre per day, and the layer that does it is barely a tenth of a millimetre thick.

Lead Analyst

Published

September 2026

Make Smarter Decisions with Customized Research Insights

Request a free sample report and evaluate market opportunities, growth trends, and competitive dynamics relevant to your business needs.

2025 MARKET VALUE$3.4BMarket Size 2025
2036 FORECAST VALUE$8.4BBase Case , 2026 to 2036
CAGR 2026 TO 20368.6 %Bull 9.8% / Bear 7.4%
INCREMENTAL OPPORTUNITY$4.7BNet 10- year value creation
EXPANSION MULTIPLE2.28x2036 value over 2026 base
Strategic Levers
M&A Pipeline
Regional Outlook
Country Rankings
Competitive Intelligence
Segmental Deep-dive
Call-Us : 91 93563 13602

Executive Snapshot and Market Trajectory.

Everything in this category follows one number that almost nobody outside it has heard of. Evaporative emission rules set permeation limits around 15 grams per square metre per day, and hitting that requires a fluoropolymer barrier 0.12 millimetres thick carrying 41% of the entire material cost alone.
Hydrogen and alternative fuel compatible lines grow at 12.9%, half again the market rate of 8.6%, because hydrogen molecules permeate through materials that hold gasoline vapour comfortably, which makes it a considerably harder barrier problem. East Asia holds 33% of demand, above its usual band, on vehicle production volume, the world's small engine and motorcycle manufacturing base, and the fluoropolymer compounding capacity that supplies all of it. Three separate advantages sit in one region.
Concentration is moderate at 39% of supplied metres, and it looks lower than it is, because the customer is a fuel system Tier 1 rather than a vehicle maker and qualification with those firms takes eighteen months. Electrification is reshaping this market rather than ending it: a plug-in hybrid's fuel sits unused for weeks and must not vent, which is a harder sealing problem than any conventional car presents.
Market Definition
The low-permeation fuel lines and hoses market covers flexible and rigid conduit engineered to restrict hydrocarbon vapour permeation in fuel delivery, vapour and return circuits, spanning multilayer fluoropolymer barrier hose, nylon and polyamide tubing, fluoroelastomer lined rubber hose, surface treated sulfonated and fluorinated hose, coextruded EVOH barrier constructions, and hydrogen and alternative fuel compatible lines. Scope covers supply into vehicle, marine, motorcycle and small engine production and into aftermarket replacement. Excluded are fuel tanks and filler necks, fuel pumps and delivery modules, carbon canisters and vapour recovery hardware, quick connectors sold separately, and industrial hose for non-fuel service.
Base Year Value
$3.4B in 2025 (MMA Primary Research Dataset, September 2026)
Forecast Period
2026 to 2036, eleven discrete annual values
CAGR
8.6% base case. Bull 9.8%. Bear 7.4%.
Fastest Growth Segment
Hydrogen and Alternative Fuel Compatible Lines: 12.9% CAGR
Fastest Growth Country
India: 10.6% CAGR
Fastest Growth Region
South Asia and Pacific: 10.6% CAGR
Largest Region
East Asia: 33% of 2025 global value
Market Leaders
Cooper Standard, Sumitomo Riko, TI Fluid Systems, Hutchinson and Toyoda Gosei. Source: MMA Analysis, July 2026.
Primary Survey
n=3,800 procurement and R&D decision-makers, Q4 2025, six countries
Methodology
Demand-side build-up, cross-validated against public data, 47 expert interviews

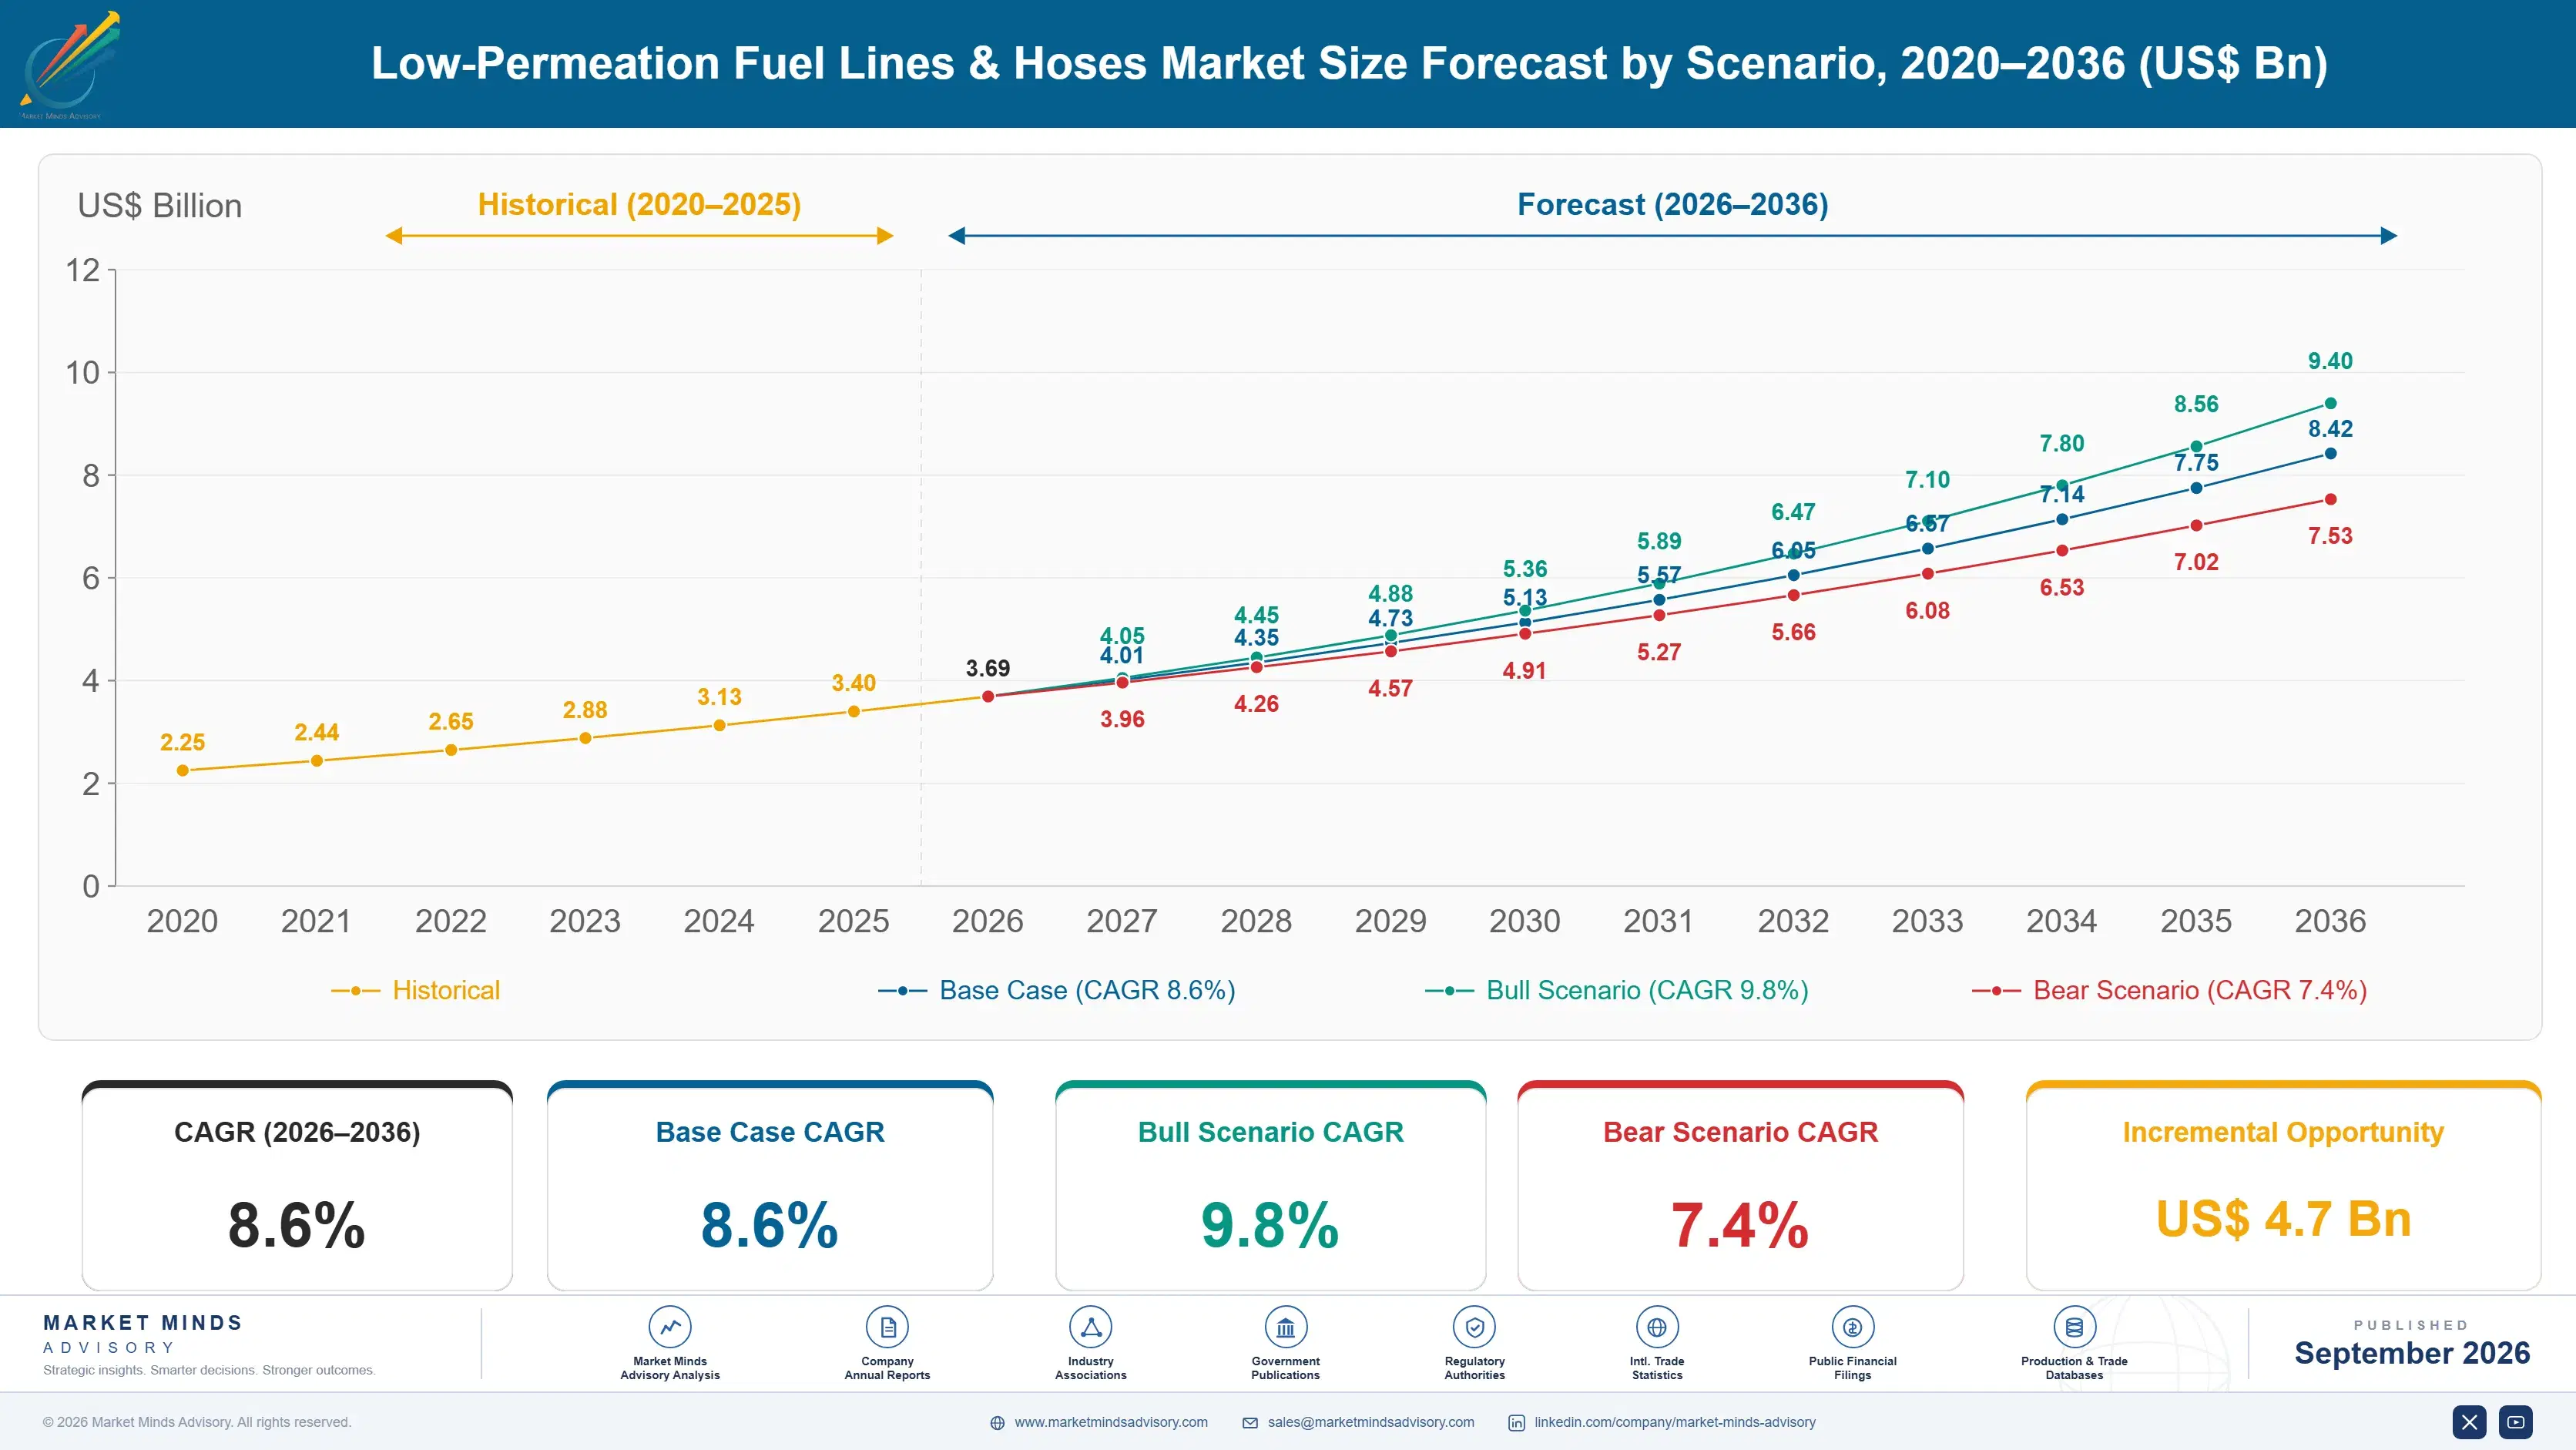
Low-Permeation Fuel Lines & Hoses Market Forecast Scenarios

low-permeation-fuel-lines-hoses-market-size-forecast-scenario-1788234695949
Between 2020 and 2025 the sector compounded at 7.2% while vehicle production fell and then partly recovered, which means content per vehicle rather than volume carried the number. Tightening evaporative limits pushed constructions from surface treated rubber toward multilayer fluoropolymer, and each step up added material cost without adding a metre of hose. The value grew because the specification grew, not because anybody built more cars.
The 8.6% base case rests on three mechanisms. Evaporative limits keep tightening across major markets on published timetables, and each tightening moves constructions up the material ladder at higher cost per metre. Hybrid powertrains carry more complex sealed fuel systems than conventional cars, not fewer. And small engine, marine and motorcycle applications are barely electrifying while their permeation rules keep tightening. None of the three requires vehicle production to grow at all.
The bull case at 9.8% turns on hydrogen powertrains reaching commercial volume in commercial vehicles, where permeation is a considerably harder problem than gasoline and the content per vehicle is far higher. The bear case at 7.4% is battery electric substitution running faster than expected in the passenger segment, which removes fuel systems entirely rather than upgrading them.

A Tenth Of A Millimetre

The economics of this product are decided by its thinnest component. A multilayer fuel line is mostly nylon or rubber for structure and pressure, and the 0.12 millimetre fluoropolymer barrier that actually stops vapour accounts for 41% of the material cost. Every specification tightening pushes that layer thicker or the chemistry more expensive, which is why value grows steadily while metres supplied barely move at all.
TOP FIVE CONCENTRATION39%Share of supplied metres held by the five largest
PERMEATION LIMIT SPECIFIED15 g/m2/dayMaximum vapour loss allowed under current evaporative emission rules
BARRIER LAYER THICKNESS0.12 mmFluoropolymer wall required to meet the permeation specification
FLUOROPOLYMER COST SHARE41%Portion of material cost from the thinnest layer present
QUALIFICATION CYCLE LENGTH18 monthsTime from sample submission to approval for series production
PROGRAMME SUPPLY TERM7 yearsTypical duration a line is supplied to one platform
Manufacturing that construction is considerably harder than it looks. Coextruding four or five dissimilar polymers into a hose that survives thermal cycling, fuel swell and twenty years of vibration requires tooling, adhesion chemistry between layers that do not naturally bond, and validation testing that takes eighteen months before series approval. That is why a product resembling a rubber tube is not made by anybody with an extruder.
Electrification is reshaping demand rather than removing it, which most forecasts get wrong. A battery vehicle has no fuel system, but a plug-in hybrid stores fuel that may sit unused for weeks in a sealed tank that must not vent, which is a harder problem than a conventional car ever presented. Marine, small engine and motorcycle applications are barely electrifying while their own permeation rules keep tightening.
"The whole engineering argument happens over a layer you cannot see, and the purchasing conversation happens over the price of a metre of hose. Suppliers who let a buyer compare metres rather than compare permeation results have already lost the programme."
Director, Vehicle Fluid Systems Practice · MMA Automotive Practice · September 2026

Market Trends

Tightening limits keep moving constructions up

Evaporative emission rules across North America, Europe and Asia have ratcheted permeation limits downward on published timetables toward around 15 grams per square metre per day, and each step obsoletes a construction that was compliant the year before. Surface treated rubber gave way to fluoroelastomer liners, which gave way to coextruded fluoropolymer barriers. Every step raises material cost per metre without adding a metre, which is why category value compounds while volume does not. Suppliers who invested in coextrusion capability early are now supplying constructions that competitors cannot yet manufacture at all.
Market Impact: Covers 5 non-automotive applications
Hybrids created a harder sealing problem than combustion

A plug-in hybrid may run for weeks on battery alone while its fuel sits in a tank warming and cooling through daily cycles, which builds pressure that a conventional vehicle relieves by simply using the fuel. Those systems therefore run sealed tanks at elevated pressure with more demanding permeation and burst requirements throughout the fuel circuit. Content per vehicle is higher than on a conventional car rather than lower, which is the opposite of what most electrification forecasts assume about this category. Suppliers writing off hybrid volume have misread the engineering entirely.
Market Impact: Grows at 12.9% against 8.6%

Market Opportunities and Growth Drivers

Small engines and marine barely electrify at all

Outboard motors, generators, lawn equipment, motorcycles and handheld tools continue to use combustion engines in enormous numbers, and their evaporative rules have tightened as sharply as automotive rules did. Those applications are cost-sensitive, produced in very high volume and concentrated in East Asian manufacturing, which suits suppliers positioned there. Marine permeation requirements are particularly demanding because a fuel line sits in a hot enclosed space above water for years. This demand base is largely invisible to automotive-focused forecasting and it is not going anywhere within the forecast period. Nothing about that base is going away.
Market Impact: Removes 100% of vehicle content

Hydrogen permeation is a far harder problem

Hydrogen is a small molecule that passes through polymer walls holding gasoline vapour comfortably, and it embrittles some metals and degrades certain elastomers on contact, which makes a hydrogen fuel line a materially different engineering problem rather than a variation on an existing one. Commercial vehicle programmes are where the volume will first appear. Hydrogen compatible lines grow at 12.9% against a market rate of 8.6% from a very small base, and the suppliers developing that capability now are qualifying into platforms that will run for a decade once they arrive.
Market Impact: Locks supply for 7 years

Market Restraints and Challenges

Battery vehicles remove the product entirely

A battery electric vehicle has no fuel tank, no fuel line and no evaporative system, so every conventional or hybrid platform it replaces removes content permanently rather than reducing it. The root cause is substitution of the whole powertrain rather than any competitive failure, which means no product improvement defends against it. Commercial impact is a shrinking passenger vehicle base beneath a growing content per remaining vehicle. Participants are responding by weighting toward hybrid platforms, commercial vehicles, marine and small engine applications, and by developing hydrogen capability well ahead of demand.
Market Impact: Targets 15 grams per square metre

Qualification cycles lock programmes for years

Approval for series production takes around 18 months of material testing, thermal cycling, fuel compatibility and validation with a Tier 1 fuel system integrator, after which the line is supplied to that platform for about seven years without rebidding. The root cause is that a fuel leak is a safety recall, so nobody changes a validated component casually. Commercial impact is that losing a programme costs the better part of a decade. Mitigation runs through early engagement at platform concept stage, multi-programme qualification, standardised constructions across applications and aftermarket positions that do not require approval.
Market Impact: Raises content above 1 conventional vehicle
3 additional market trends, 4 additional growth drivers, and 2 additional restraints and challenges are covered in the full report. Contact sales@marketmindsadvisory.com to access the complete intelligence.

Segment CAGR and Growth Architecture

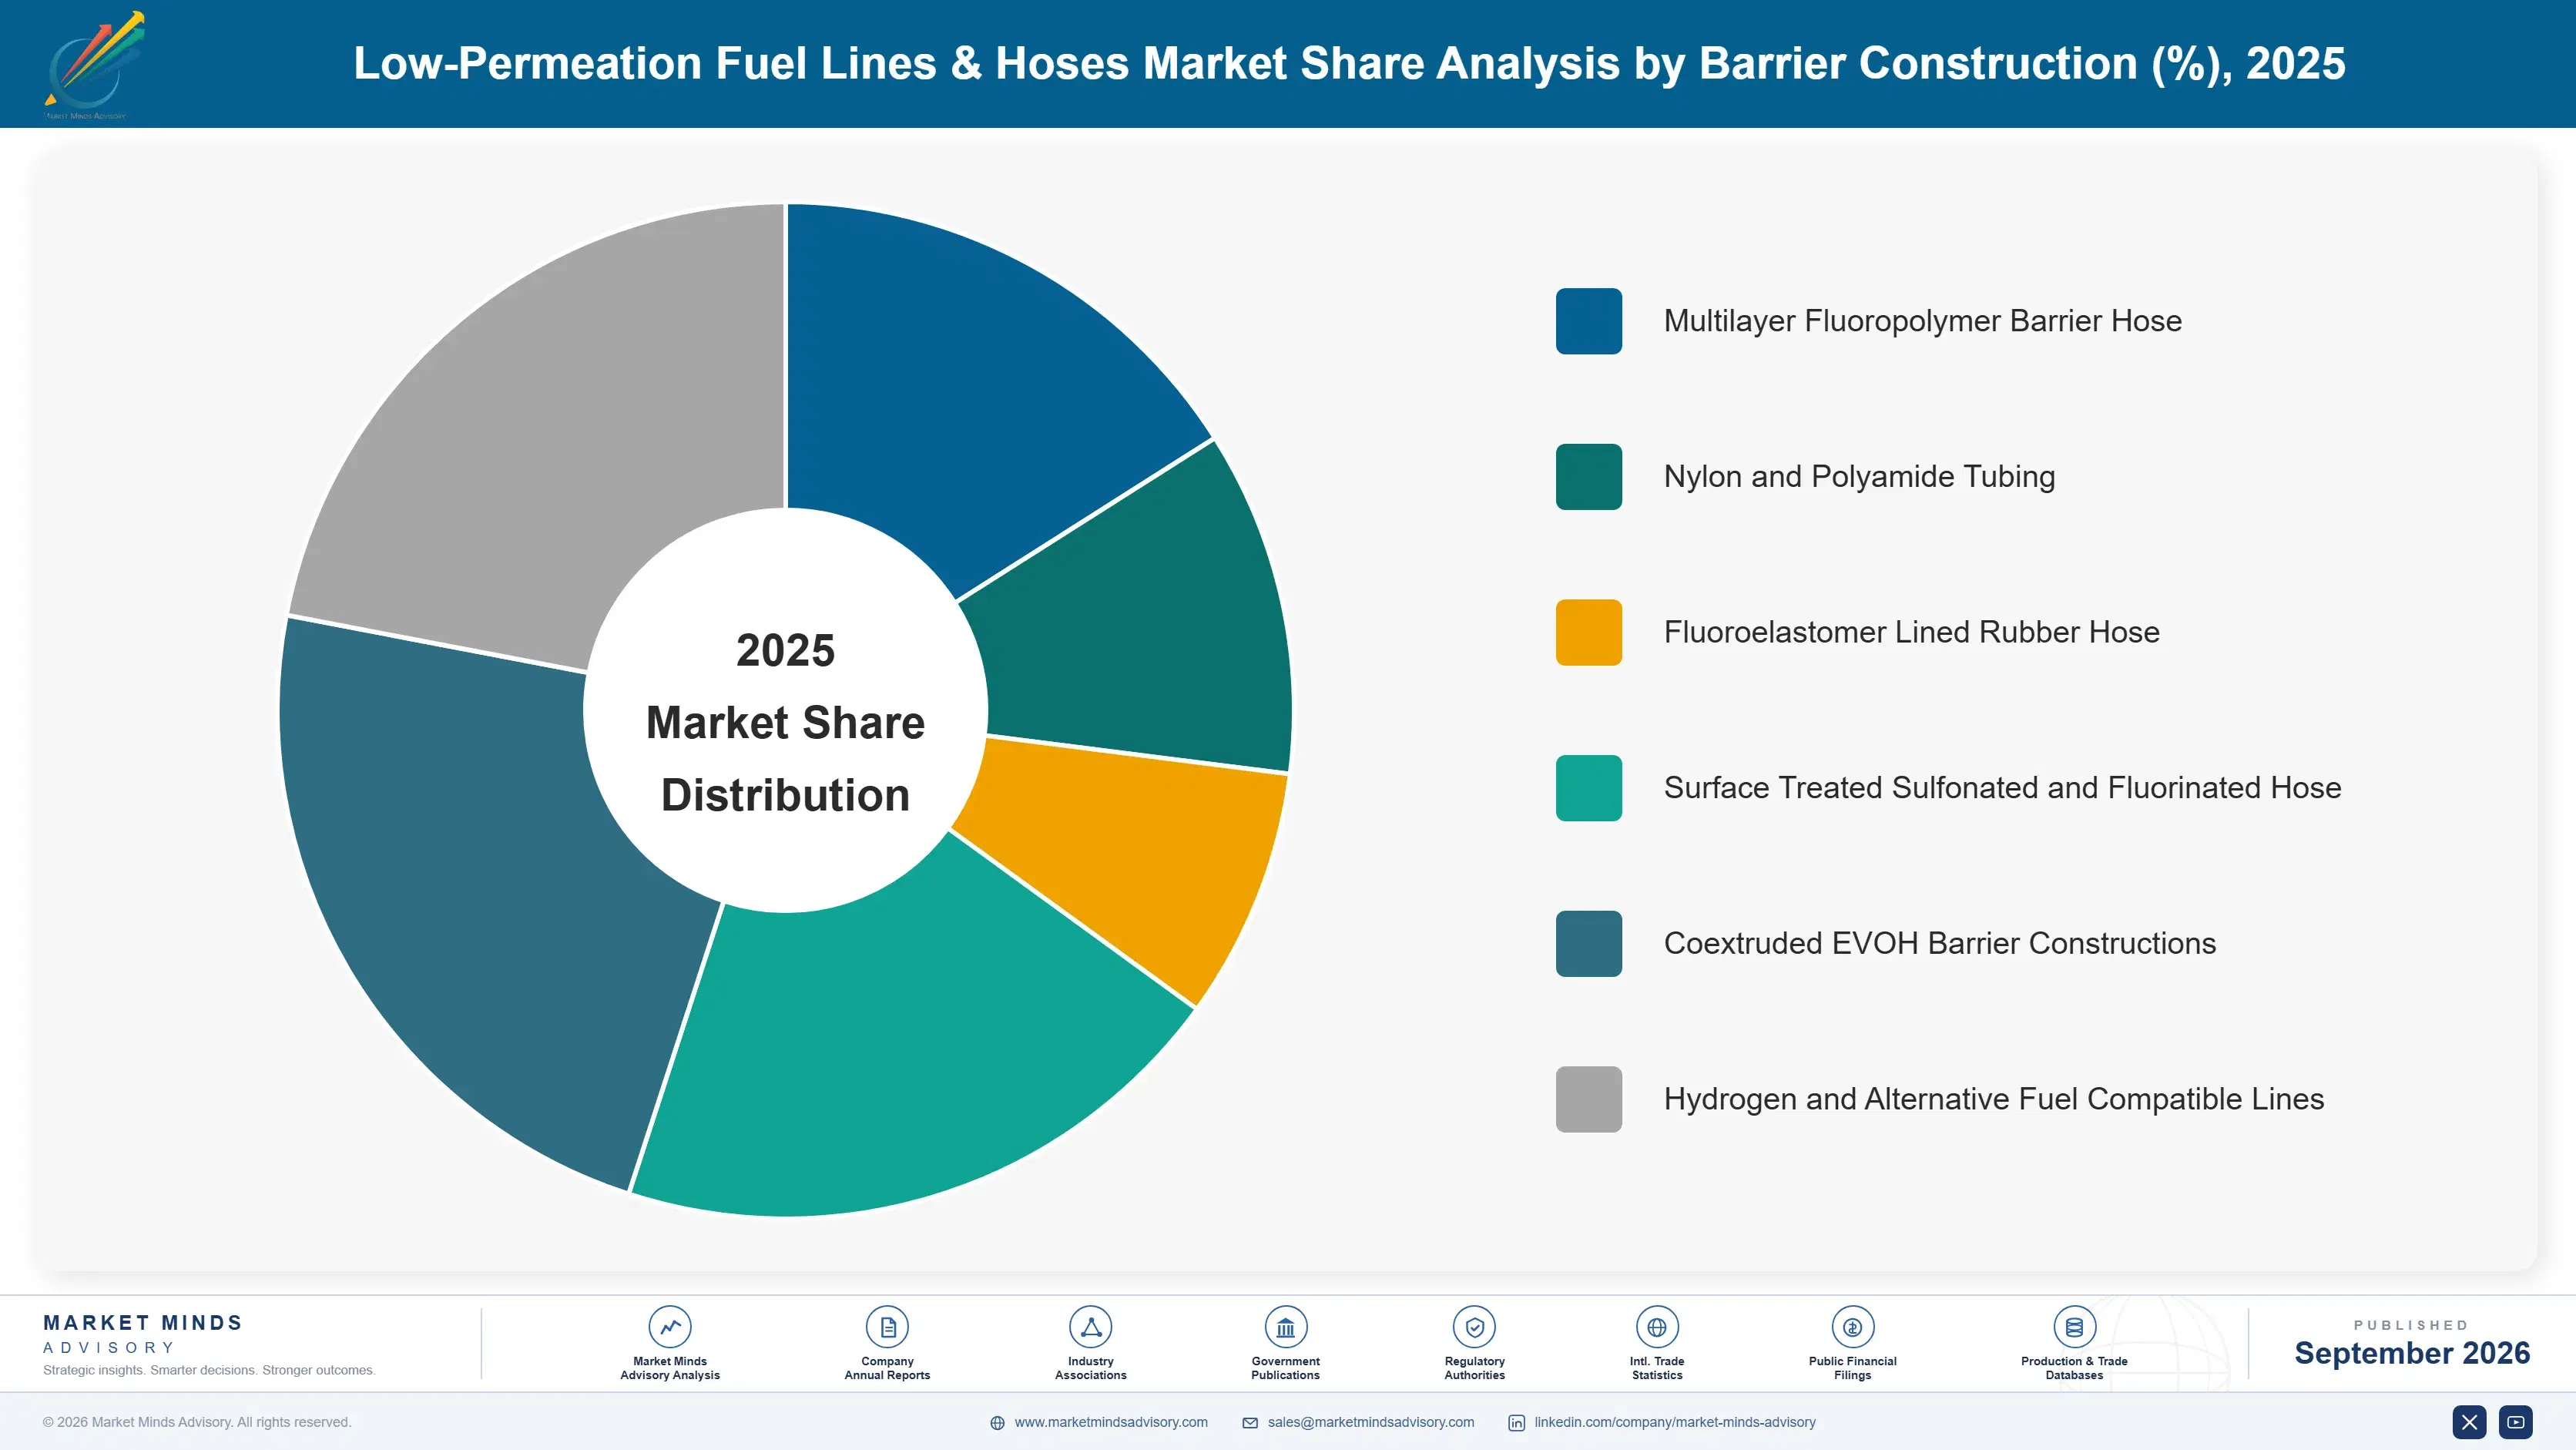
Segmentation follows barrier construction, the dimension on which material cost, achievable permeation rate and manufacturing difficulty all move together. Surface treated and lined rubber constructions carry declining volume at older specifications. Coextruded barriers and hydrogen compatible lines carry the growth, because both meet limits the simpler constructions cannot reach. Regulation obsoletes the older ones on a schedule.
low-permeation-fuel-lines-hoses-market-market-share-analysis-1788234696480

Hydrogen and Alternative Fuel Compatible Lines

Hydrogen and alternative fuel compatible lines grow at 12.9%, half again the market rate of 8.6%, from a base small enough that a handful of commercial vehicle programmes move the number. Hydrogen is a far more difficult containment problem than gasoline, because the molecule passes through polymer walls that hold hydrocarbon vapour comfortably, embrittles certain metals at the fittings and degrades some elastomers on prolonged contact. Constructions therefore use different barrier chemistries and different joint designs rather than thicker versions of existing ones. Suppliers developing this capability now are qualifying into platforms that will run for the better part of a decade, and there are very few of them doing the work at all.
CAGR 12.9%

Coextruded EVOH Barrier Constructions

Coextruded EVOH barrier constructions at 9.0% deliver permeation performance approaching fluoropolymer at materially lower cost, which matters enormously in the high volume cost-sensitive applications where fluoropolymer prices badly. Ethylene vinyl alcohol is an excellent hydrocarbon barrier and a poor moisture barrier, so the construction has to protect it with polyamide layers on both sides, and the adhesion chemistry between those layers is the genuine technical difficulty. Small engine, motorcycle and marine applications adopted these constructions first because the cost gap mattered most there. Automotive use is growing as coextrusion capability spreads and as buyers push back on fluoropolymer content. Cost pressure on fluoropolymer content is doing more to advance this construction than any technical argument has managed.
CAGR 9.0%
Full segment breakdown across 6 segments available in the complete report.

Regional Architecture and Country Demand Map

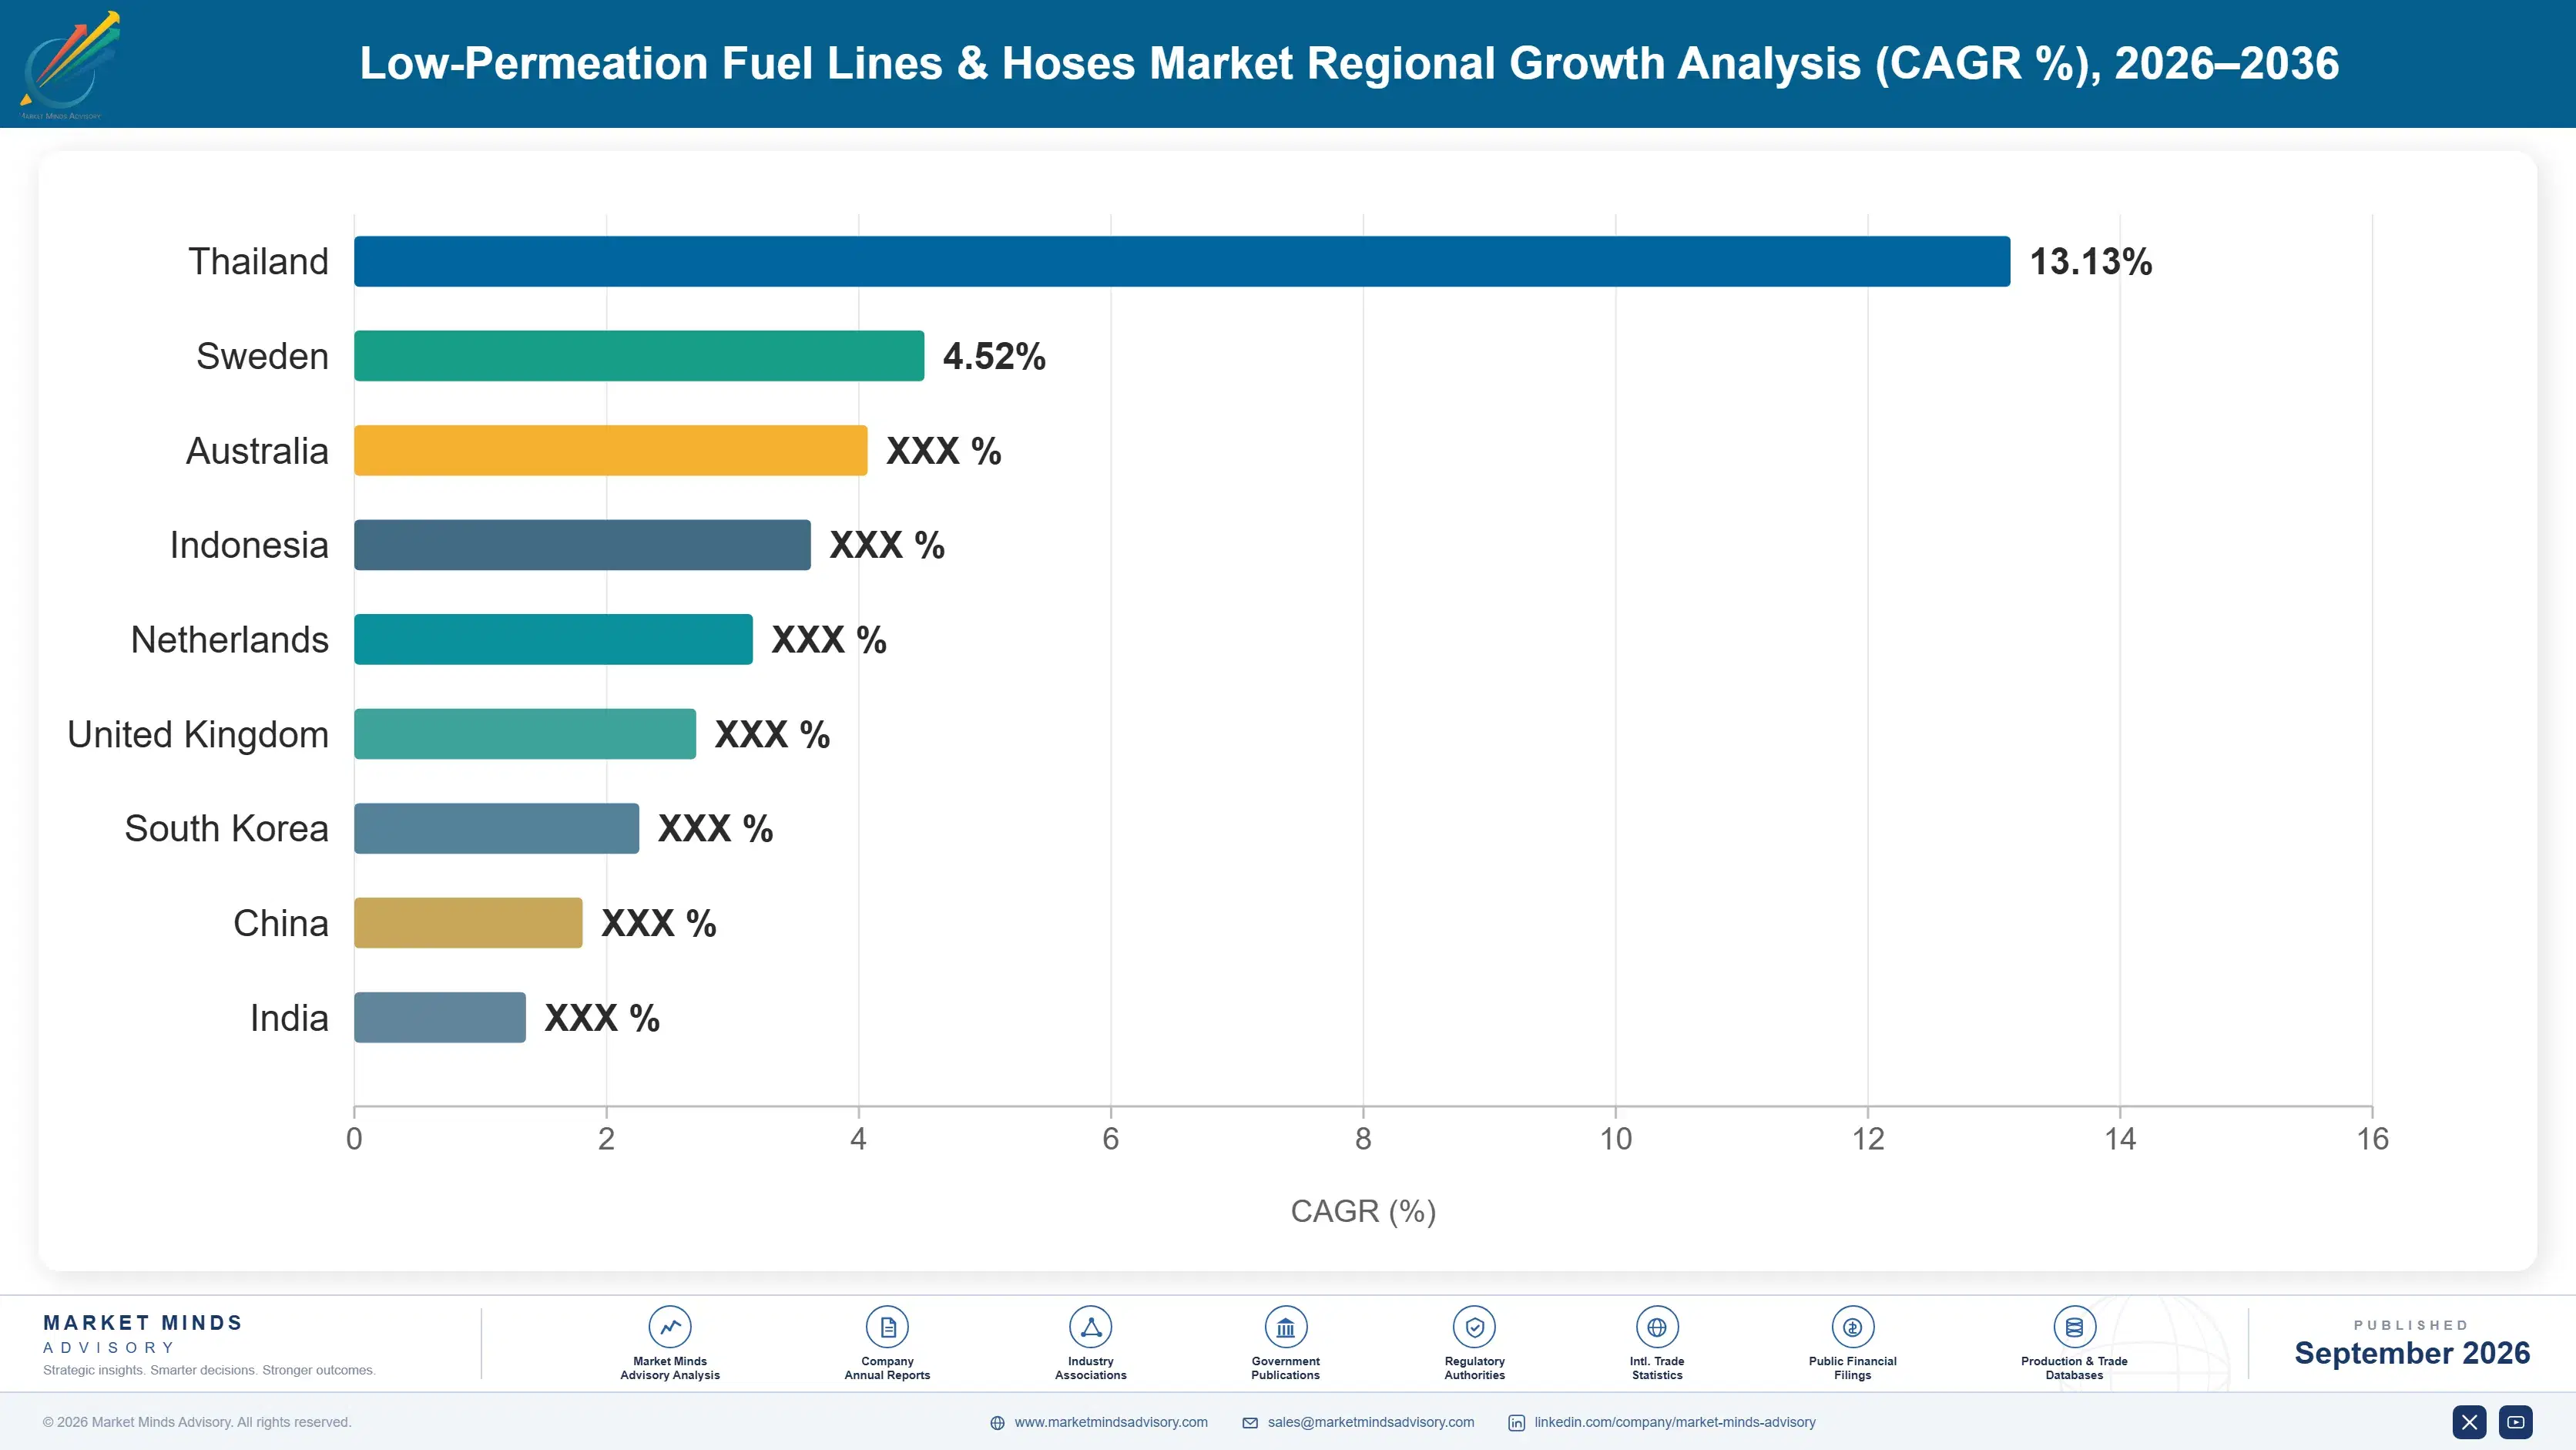
East Asia takes 33%, above its usual band, on vehicle output, the world's small engine and motorcycle manufacturing, and the fluoropolymer compounding base. India grows fastest anywhere. Manufacturing location rather than vehicle sales decides where this content is actually consumed, which most forecasting misses entirely.

East Asia

Three separate advantages sit in this region and each would be significant on its own. Chinese, Japanese and Korean vehicle production is the largest anywhere, and Chinese manufacture of motorcycles, generators and small engines dominates those categories worldwide at volumes that dwarf automotive in metres of hose consumed. Separately, the fluoropolymer and specialty polyamide compounding capacity that every supplier depends on is concentrated in Japan and increasingly in China. Japanese Tier 1 fuel system integrators specify constructions that global platforms then adopt. A supplier without a manufacturing position here competes on freight and duty against firms that have neither. Freight and duty against a domestic competitor is not a contest anybody wins from outside.
Share: 33% | CAGR: 9.4% (2026 to 2036)

North America

Regulation rather than production volume explains this position, and the rules originated here. California and federal evaporative emission standards set the permeation limits that other jurisdictions subsequently adopted, and marine and small engine rules were written here first as well. Pickup trucks and large vehicles carry longer fuel lines and larger tanks than the global average, which raises content per vehicle meaningfully. Hybrid adoption has run ahead of full battery substitution in the light truck segment, which suits this category. Marine demand around the Great Lakes and both coasts is genuine and consumes constructions to the strictest permeation specifications written anywhere. The rules written here still travel further than the volume does.
Share: 25% | CAGR: 8.0% (2026 to 2036)
Regional intelligence for 5 additional markets available in the complete report: Western Europe, South Asia and Pacific, Latin America, Middle East and Africa, Eastern Europe. Contact sales@marketmindsadvisory.com.
low-permeation-fuel-lines-hoses-market-country-cagr-analysis-1788234697000

Four Moves On The Barrier

None of these four is about making hose more cheaply, because the cost sits in a layer measured in hundredths of a millimetre and in tooling nobody amortises quickly. Each works on where the specification is going, which applications are not electrifying, and how a buyer is allowed to compare. Two of them are portfolio decisions rather than engineering ones.

Qualify hydrogen constructions before the volume arrives

Hydrogen compatible lines grow at 12.9% against a market rate of 8.6% from a base small enough that a few commercial vehicle programmes move it, and qualification with a Tier 1 takes 18 months before any platform reaches production. A supplier starting that work when the volume appears is two years behind whoever started earlier, and platforms run for around seven years once awarded. The development cost is material science and testing rather than capital equipment. Very few suppliers are doing this work while the demand still looks speculative. The demand still looks speculative to most boards.
Market Impact: Enters a segment now growing at 12.9% annually

Weight the portfolio toward what is not electrifying

Outboard motors, generators, motorcycles, handheld tools and lawn equipment continue in combustion at enormous volume while their permeation rules tighten as sharply as automotive rules did, and none of it appears in automotive electrification forecasting. Those applications are concentrated in East Asian and Indian manufacturing where 45% of category demand now sits. Serving them requires cost-appropriate constructions rather than automotive-grade ones, which is a product decision rather than a capability gap. Suppliers organised entirely around passenger vehicle programmes are missing the part of the market that is not shrinking. That part of the market is not shrinking at all.
Market Impact: Serves the 45% of demand not electrifying at all

Make the buyer compare permeation, not metres

A purchasing organisation given two hose quotations compares price per metre, and the entire engineering advantage sits in a 0.12 millimetre layer carrying 41% of the material cost that no purchase order line ever shows. Supplying comparative permeation test data, warranty exposure modelling and the cost of a failed evaporative test at type approval changes what is being compared. It requires the technical team in the commercial meeting, which most suppliers avoid arranging. Suppliers who reframed the comparison this way defended pricing that others gave away on a spreadsheet. Most avoid arranging that meeting entirely.
Market Impact: Defends 41% of the total material cost base

Standardise the constructions across every application

Qualification runs 18 months per programme and most suppliers repeat much of that work for automotive, marine, motorcycle and small engine customers using constructions that differ more than the applications require. A deliberately standardised family covering several applications amortises validation testing across far more volume and shortens time to qualification for each new programme. It costs some optimisation on individual applications and returns considerably more in engineering capacity. Very few suppliers manage their construction range as a portfolio rather than as an accumulation of programme-specific answers. Nobody manages this range as a portfolio.
Market Impact: Amortises 18 months across 4 separate applications each

Who Controls the Margin Pool

CR5 stands at 39% of metres supplied into vehicle and engine production, which is the only comparable basis since fuel line revenue sits inside far larger fluid system and rubber product reporting. Concentration understates the real position, because the customer is a fuel system Tier 1 rather than a vehicle maker and qualification with those firms is what decides access to any platform.
Competition runs on coextrusion capability, Tier 1 qualification and regional manufacturing footprint. Coextrusion decides who can make the constructions current limits demand at all. Qualification decides who reaches a platform, and it takes eighteen months each time. Footprint decides who serves just-in-time delivery without freight and duty. Compound formulation matters less than the ability to extrude four dissimilar polymers together reliably.

Rankings will move on hydrogen and on which suppliers weighted away from passenger vehicles in time. The applications that are not electrifying are concentrated in East Asian and Indian manufacturing, and suppliers organised around European and North American passenger platforms are exposed to substitution they cannot answer. The pressure comes from powertrain change rather than from competitors, which no product improvement addresses.
low-permeation-fuel-lines-hoses-market-company-positioning-matrix-1788234697522

Competitive Moat and Risk Dimensions

COOPER STANDARD

Moat: Fluid handling engineering across platforms

Long qualification history with fuel system integrators across North American, European and Asian platforms gives the group approved status where a new entrant faces eighteen months of validation before a first order. Multi-platform positions compound, because a construction proven on one programme qualifies faster on the next. That approval base is built from time rather than capital.
COOPER STANDARD

Risk: Passenger vehicle exposure concentrated

Revenue weighted toward passenger vehicle platforms in North America and Europe sits directly in the path of battery substitution, which removes the product entirely rather than reducing its content. No engineering response defends against a powertrain that has no fuel system. Rebalancing toward marine, small engine and commercial vehicle applications means competing where Asian manufacturers already hold cost positions.
SUMITOMO RIKO

Moat: Material science and regional proximity

Deep polymer and elastomer capability alongside proximity to the Japanese fluoropolymer producers that supply barrier resin gives the group both technical depth and supply security that competitors elsewhere buy at arm's length. Japanese Tier 1 relationships specify constructions that global platforms subsequently adopt. Both advantages come from being located where the material and the specification originate.
SUMITOMO RIKO

Risk: Cost position against Chinese manufacturers

Chinese hose manufacturers are qualifying into multilayer constructions at cost positions Japanese manufacturing cannot match, particularly in the high volume small engine and motorcycle applications where price decides. Technical superiority defends the automotive premium end and not the volume end. The competition is arriving from within the same region rather than from outside it.

Players Tracked

Prominent Players

Cooper Standard
Sumitomo Riko
TI Fluid Systems
Hutchinson
Toyoda Gosei

Other Key Players

Continental
Gates Industrial
NORMA Group
Nichirin
Togawa Rubber
Yokohama Rubber
Parker Hannifin
Eaton
Freudenberg
Kongsberg Automotive
Martinrea International
Sanoh Industrial
Uchiyama Manufacturing
Hanil Tube
Fuel Total Systems

Recent Developments

FEBRUARY 2025

Indian evaporative requirements reached two-wheeler production

Indian emission standards extended evaporative permeation requirements across two-wheeler production, obliging manufacturers of motorcycles and scooters produced in very large numbers to move from single layer constructions to multilayer barrier hose. Domestic hose suppliers then began qualifying coextruded constructions, with international technical partnerships supporting much of that transition.
Signal: A single regulatory extension quietly converted an enormous existing volume into a specification upgrade almost overnight.
JULY 2025

Commercial vehicle hydrogen programmes opened line qualification

Several commercial vehicle manufacturers opened supplier qualification for hydrogen fuel line systems ahead of production programmes, requiring barrier and joint designs that differ fundamentally from gasoline constructions rather than extending them. Few suppliers had completed the material development needed to submit anything credible for evaluation.
Signal: Qualification opened here well before most of the industry had even started the material work it required.
OCTOBER 2025

Fluoropolymer supply tightened across barrier resin grades

Fluoropolymer barrier resin availability tightened as producers reallocated capacity toward semiconductor and battery applications offering better margins, raising prices for the grades used in fuel line barrier layers. Suppliers holding long-term resin agreements were entirely unaffected, and those buying at contract renewal very much were not.
Signal: A layer worth 41% of material cost is set by a resin market this industry does not influence.

Barrier Resin, Nylon And Tooling

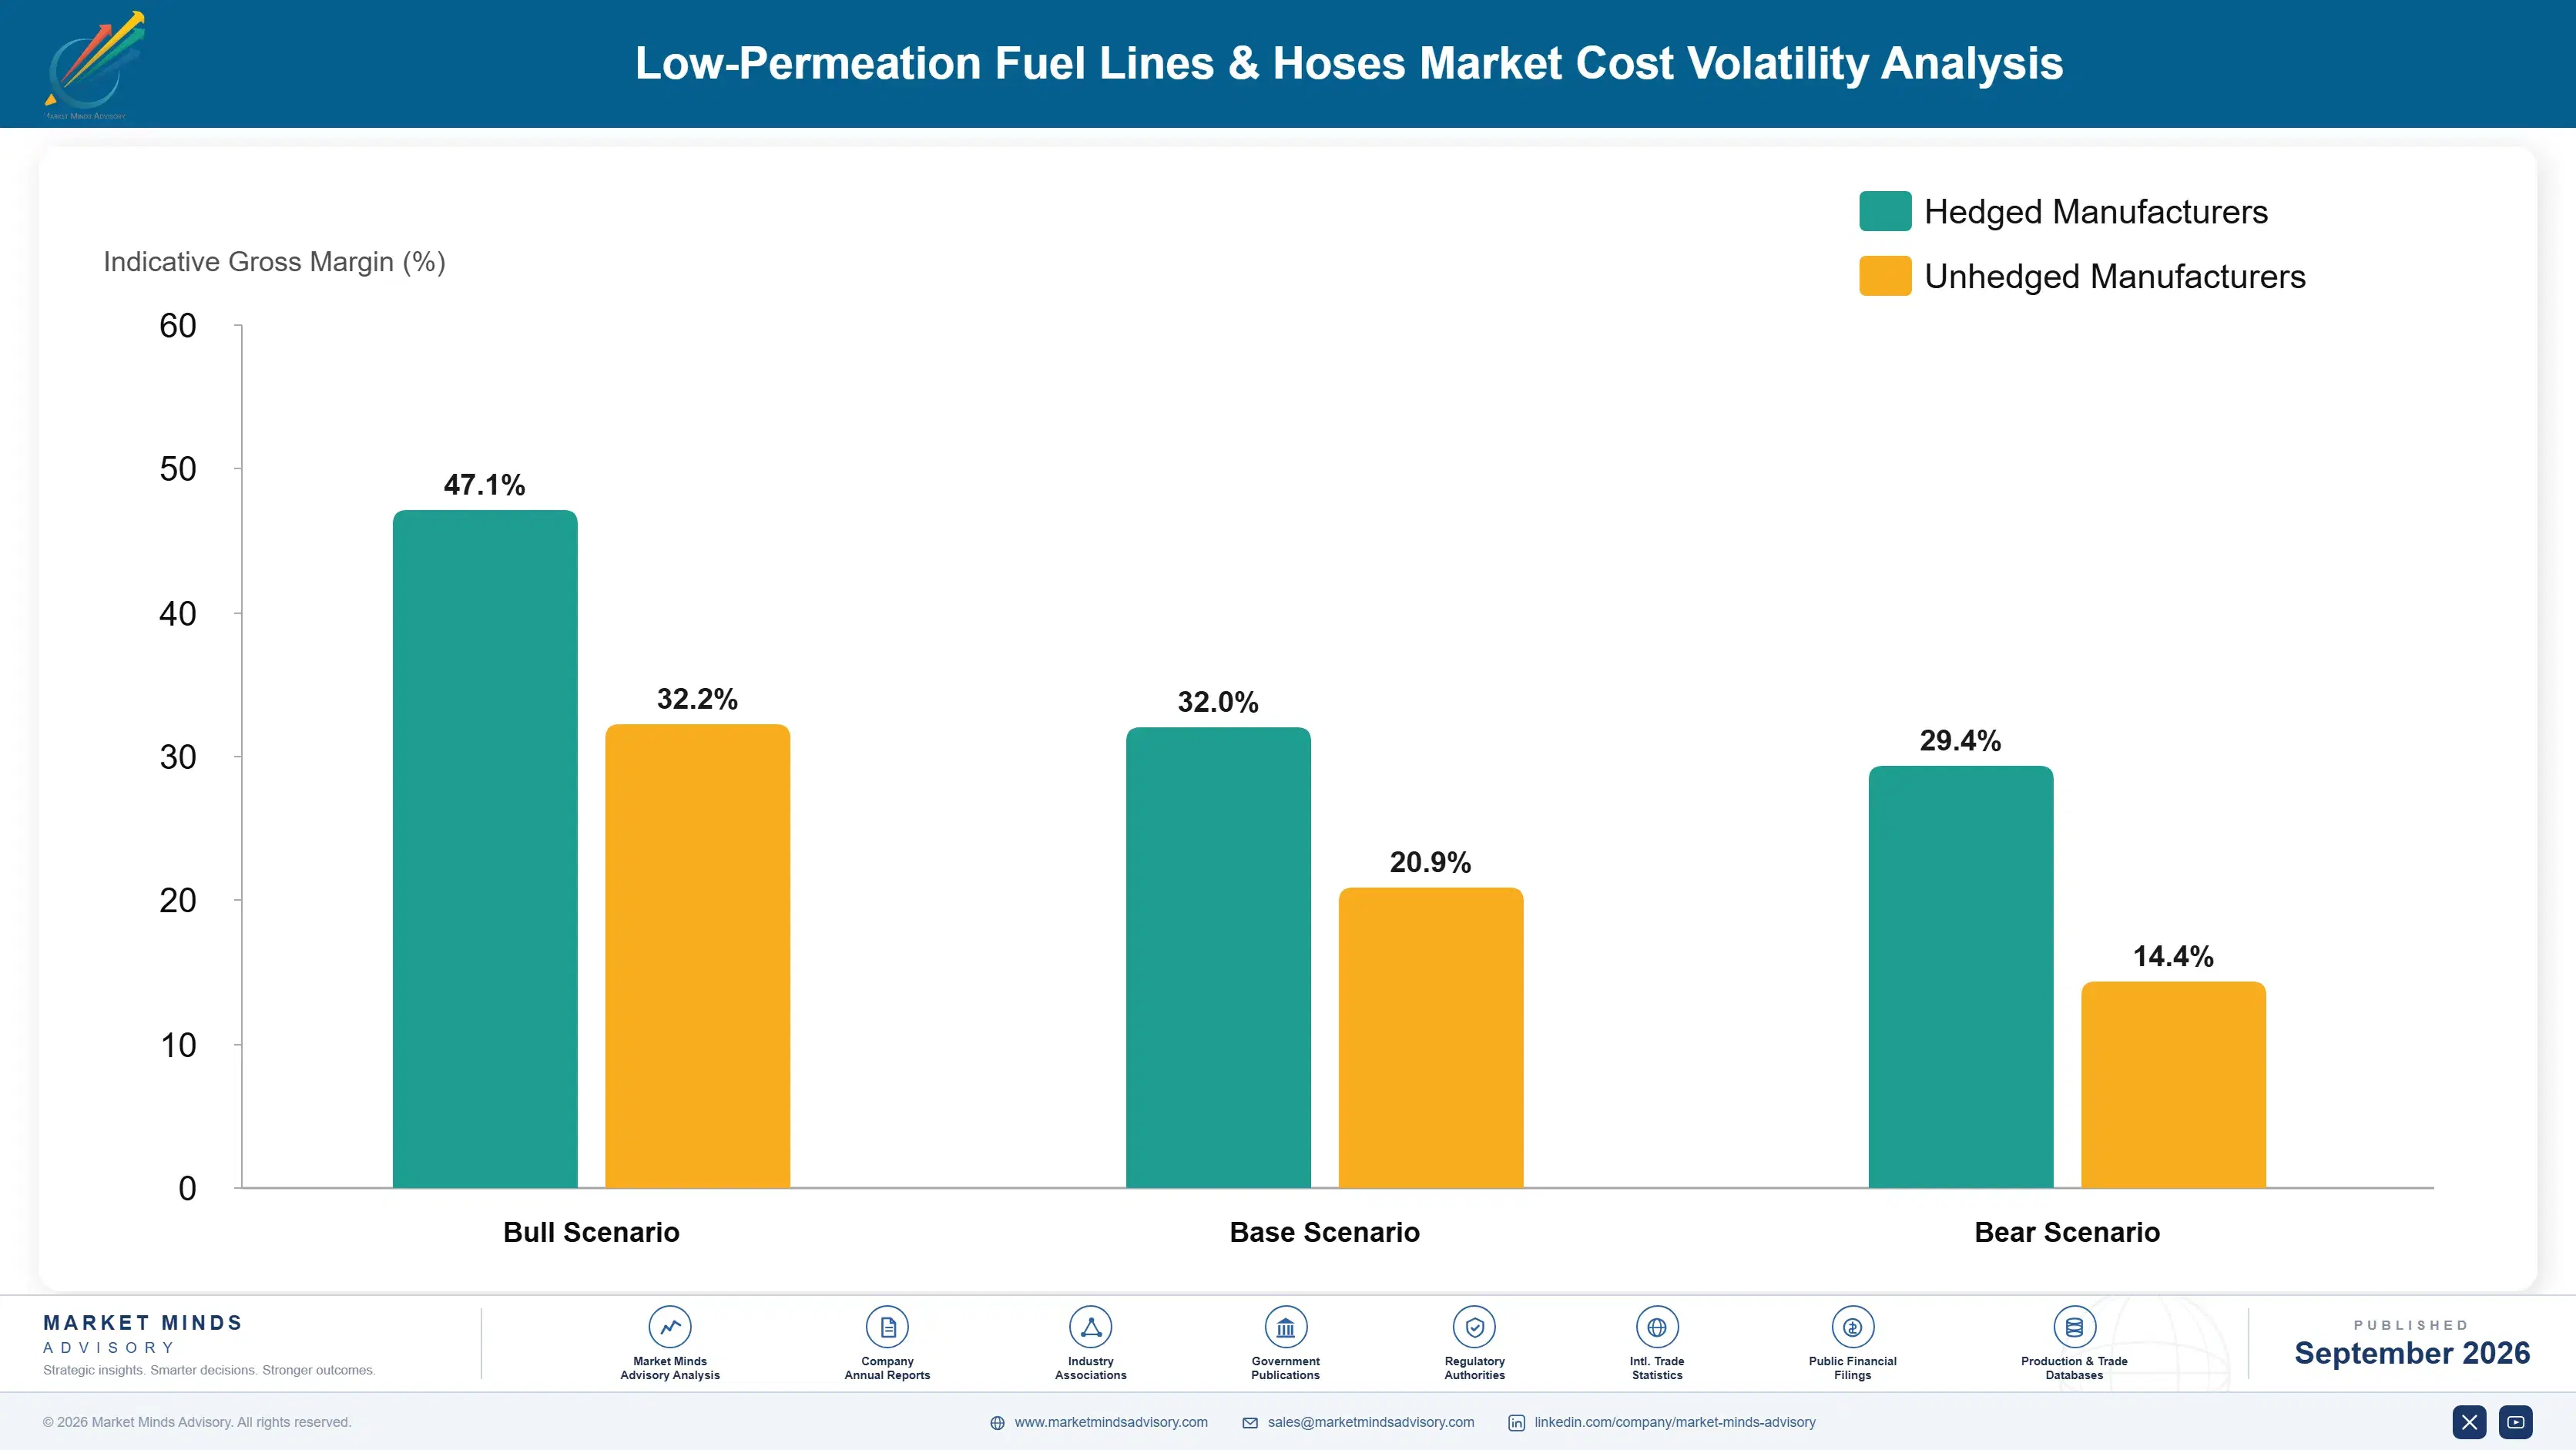
Fluoropolymer barrier resin accounts for roughly 41% of material cost despite being the thinnest layer present, polyamide and structural polymers around 27%, and elastomer compounds a further 14%. Coextrusion tooling and its amortisation carry most of what remains on a delivered basis. The barrier resin comes from a few producers also serving semiconductor and battery markets that pay considerably more per kilogram.
Fluoropolymer availability tightened through 2024 and 2025 as producers reallocated capacity toward higher margin applications, and price movement followed availability rather than any raw material cost. US Census Bureau trade data recorded the shift in import patterns across that period. Suppliers holding multi-year resin agreements maintained both supply and pricing. Those buying at contract renewal faced increases they could not pass through against automotive programmes with fixed prices running years.

The disadvantage falls on resin contracting rather than on manufacturing efficiency, which is where most improvement effort goes. A supplier without a long-term barrier resin agreement is a marginal customer to a producer whose other markets pay more, and marginal customers are served last when capacity tightens. No manufacturing improvement compensates for not having the material. That relationship decides more about competitive position than extrusion productivity ever will.
low-permeation-fuel-lines-hoses-market-cost-volatility-analysis-1788234697718

Contract barrier resin on multi-year terms

Fluoropolymer is 41% of material cost and comes from producers serving semiconductor and battery markets that pay more per kilogram, which makes a fuel line supplier a marginal customer whenever capacity tightens. Multi-year agreements cost a volume commitment and secure both supply and price. Suppliers holding them came through the last tightening without repricing anything or missing a delivery.

Qualify EVOH constructions alongside fluoropolymer

Coextruded EVOH reaches permeation performance approaching fluoropolymer at materially lower material cost, provided the polyamide layers protecting it are engineered properly. Holding both qualified gives a genuine choice when barrier resin tightens or prices move, rather than one exposed position. Qualification costs testing time rather than capital and takes 18 months, so it starts well before it is needed.

Amortise tooling across a standardised construction family

Coextrusion tooling is expensive and most suppliers commission it programme by programme, which spreads the cost across far too little volume. A deliberately standardised construction family covering automotive, marine and small engine applications runs on shared tooling and shared validation. It costs some optimisation per application and returns considerably more in both tooling and engineering capacity.

Portfolio Architecture for Margin Defence

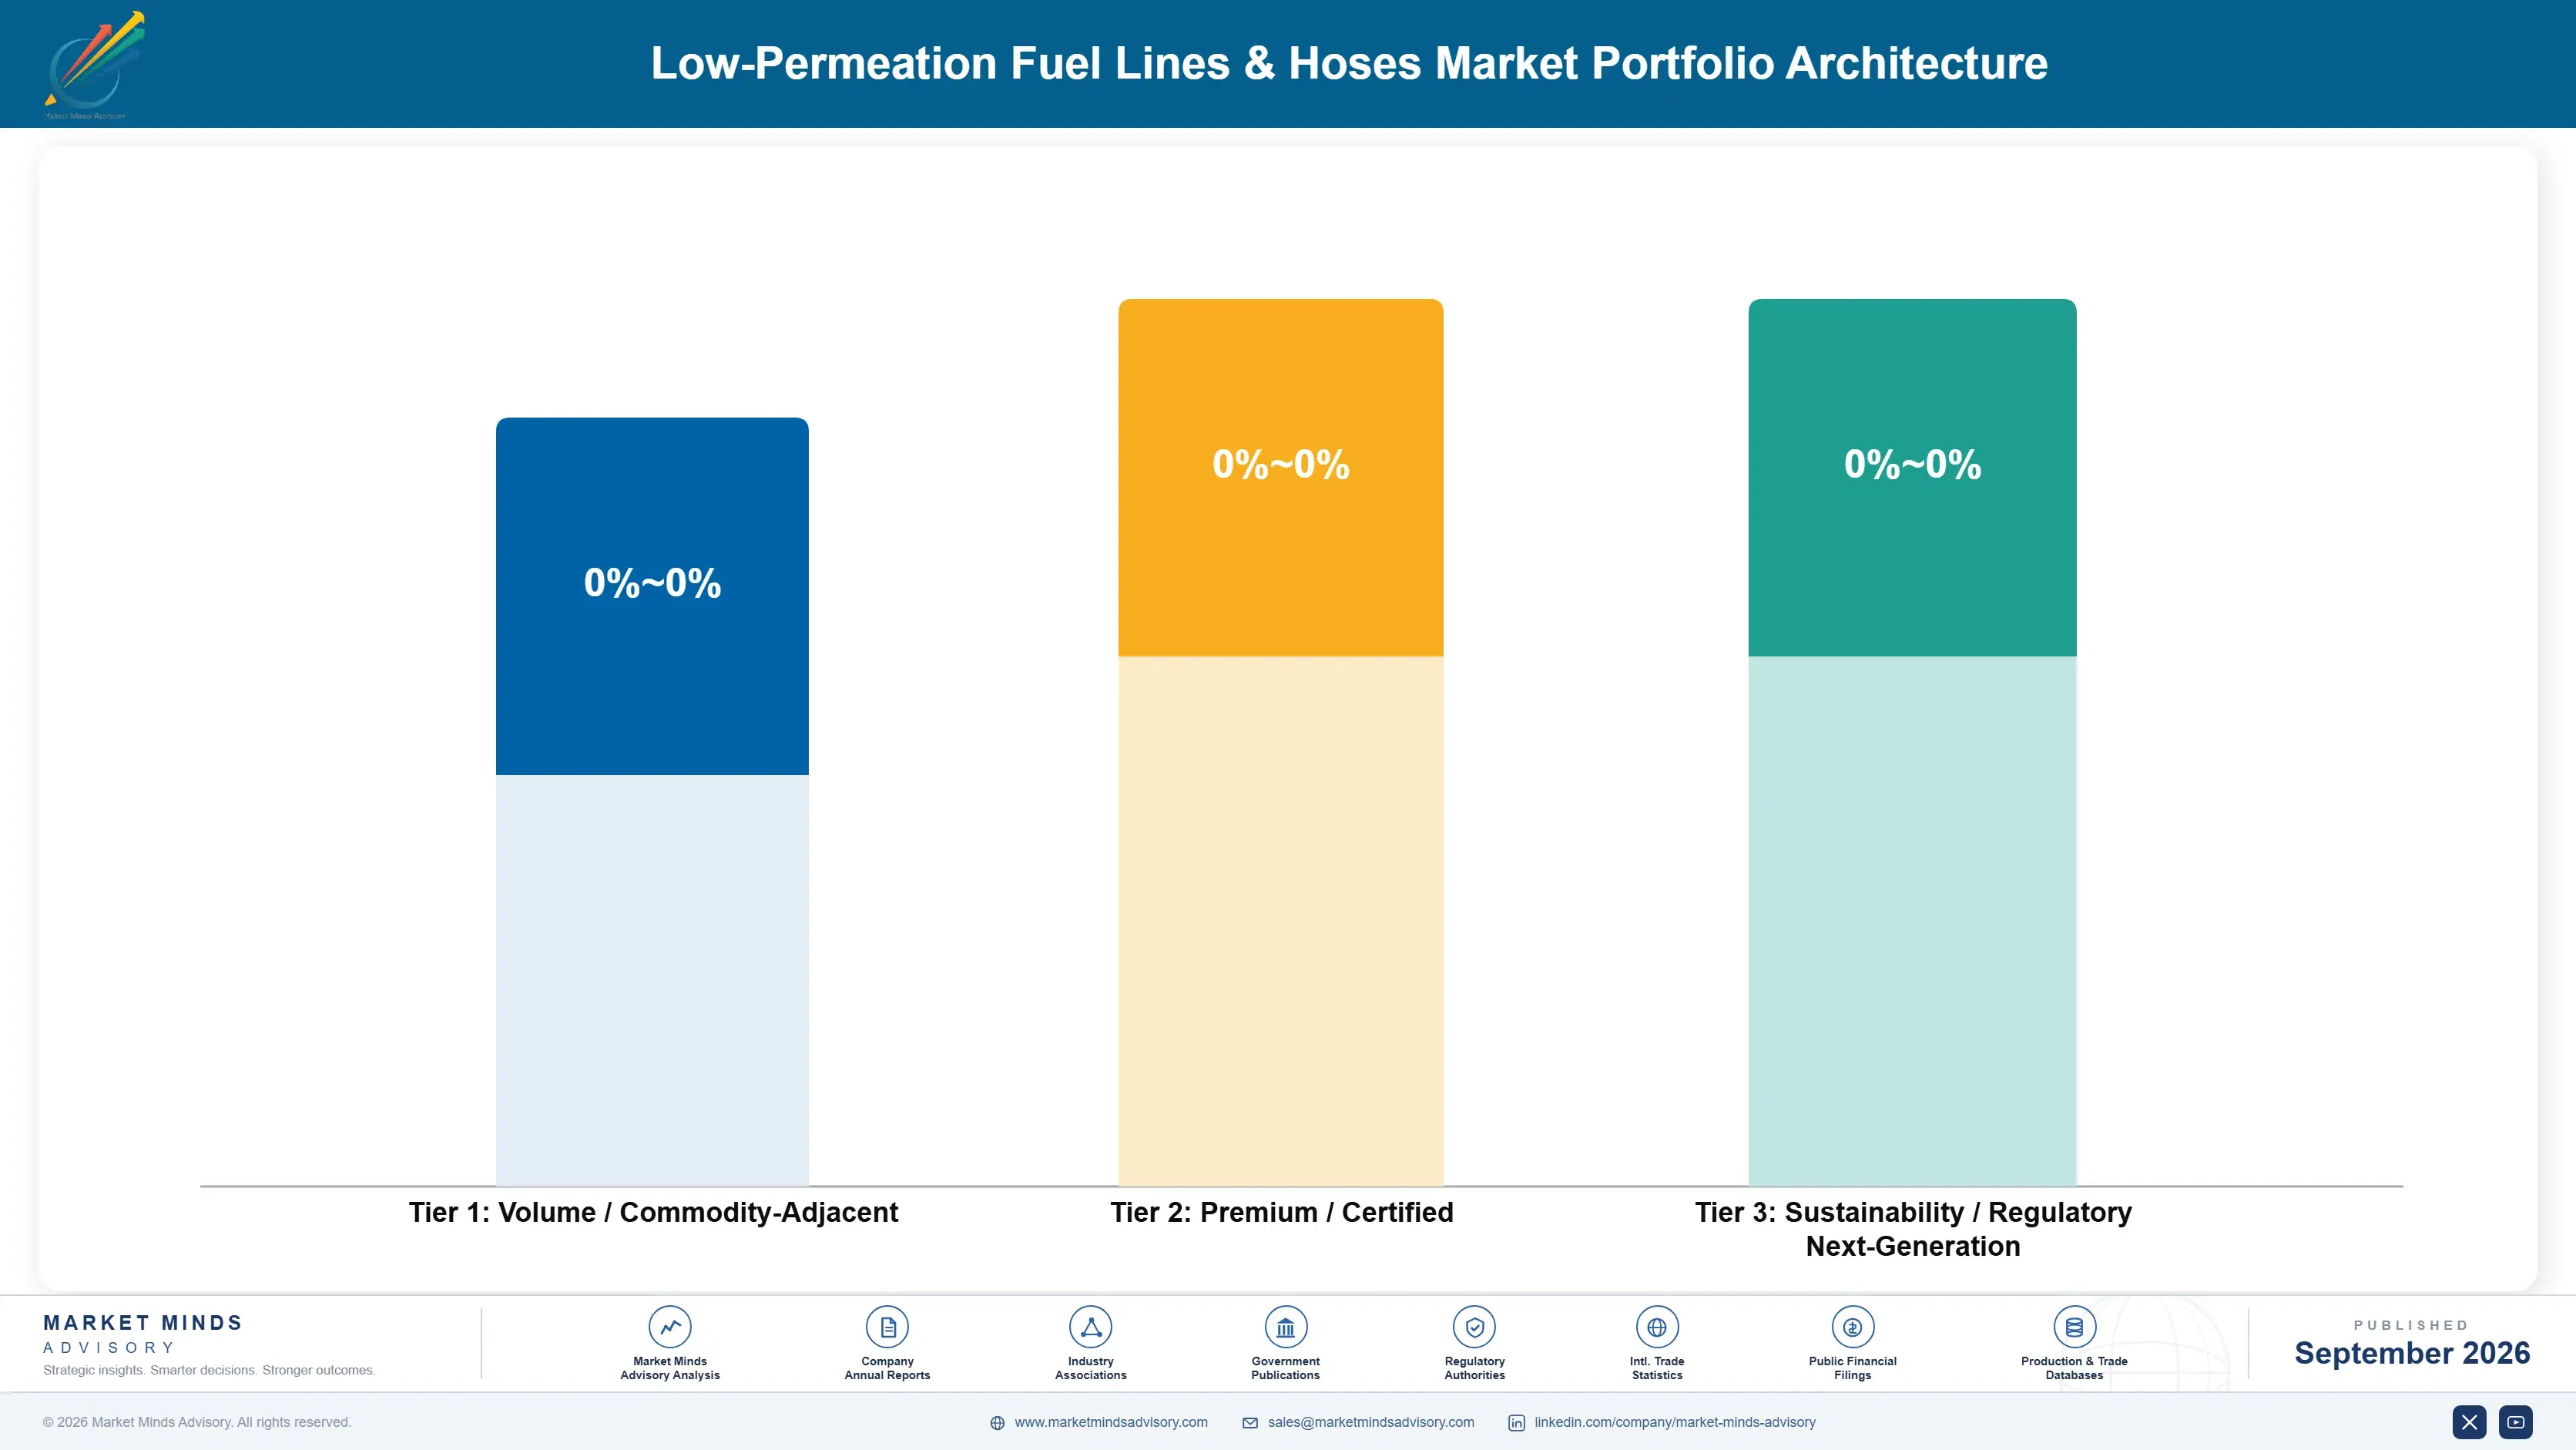
Margin here follows barrier construction rather than hose length, which is the opposite of how a purchasing organisation prices it. A surface treated rubber line meeting an older specification competes on price per metre against anybody with an extruder. A coextruded fluoropolymer construction meeting current limits can be made by very few suppliers and prices accordingly, on the same length of hose.
Volume and premium pull against each other through qualification capacity rather than the factory. Simpler constructions for aftermarket and older applications keep extrusion lines loaded and engineering teams employed between programme awards, and that continuity is what makes the eighteen month qualification cycles on premium programmes affordable to run. Dropping the volume work saves margin and removes the capacity to pursue the work that earns.

High-value pools sit in hydrogen constructions, in hybrid sealed system content and in validation data itself, which nobody treats as an asset. A supplier holding permeation and durability results across many fuel chemistries, temperatures and blend ratios can answer a new programme in weeks rather than beginning an eighteen month cycle, and that speed decides who gets designed in before a tender exists at all.

Volume / Commodity-Adjacent

Surface treated and single layer constructions meeting older permeation specifications, sold into aftermarket and less regulated applications on price. Anybody with an extruder competes here. The 8 point spread reflects extrusion line utilisation rather than any product difference.
Gross Margin: 14 to 22%

Premium / Certified

Multilayer fluoropolymer and coextruded EVOH constructions qualified to current evaporative limits with a Tier 1 fuel system integrator. Qualification and coextrusion capability support the price. The 8 point spread reflects how many platforms the construction is already approved on.
Gross Margin: 28 to 36%

Sustainability / Regulatory / Next-Generation

Hydrogen compatible lines, hybrid sealed system constructions and validation data services supplied alongside development programmes. Margins are high because qualified alternatives barely exist. The 18 point spread separates series component supply from development and validation work entirely.
Gross Margin: 36 to 54%
low-permeation-fuel-lines-hoses-market-portfolio-architecture-1788234698222

High-value Sub-segments and Strategic Watch-out

Hydrogen and Alternative Fuel Lines

High value and high growth at 12.9%. Hydrogen permeates materials that hold gasoline comfortably and embrittles metals at the fittings, which makes it a different problem rather than a harder version. The 8 point spread reflects whether joint and fitting design is supplied alongside the line itself.
Gross Margin: 42 to 50%

Coextruded EVOH Barrier Constructions

High value with strong growth at 9.0%. It approaches fluoropolymer permeation performance at materially lower cost, provided the protecting polyamide layers on either side are engineered properly around it. The 8 point spread reflects whether the supplier owns its own coextrusion tooling or contracts that extrusion out.
Gross Margin: 30 to 38%

Nylon and Polyamide Tubing

The volume core. It earns modestly and it keeps extrusion lines loaded and engineering teams employed between the long qualification cycles that premium programmes require. The 8 point spread reflects extrusion line utilisation, which decides these economics far more than any material selection ever does.
Gross Margin: 16 to 24%

Surface Treated Sulfonated and Fluorinated Hose

The strategic watch-out. Tightening permeation limits are steadily obsoleting these constructions market by market, on published timetables that everybody in the industry can already read. The 22 point spread separates the aftermarket and unregulated applications from the series volume now being lost to coextruded alternatives.
Gross Margin: 10 to 32%

Seven Years Once Approved

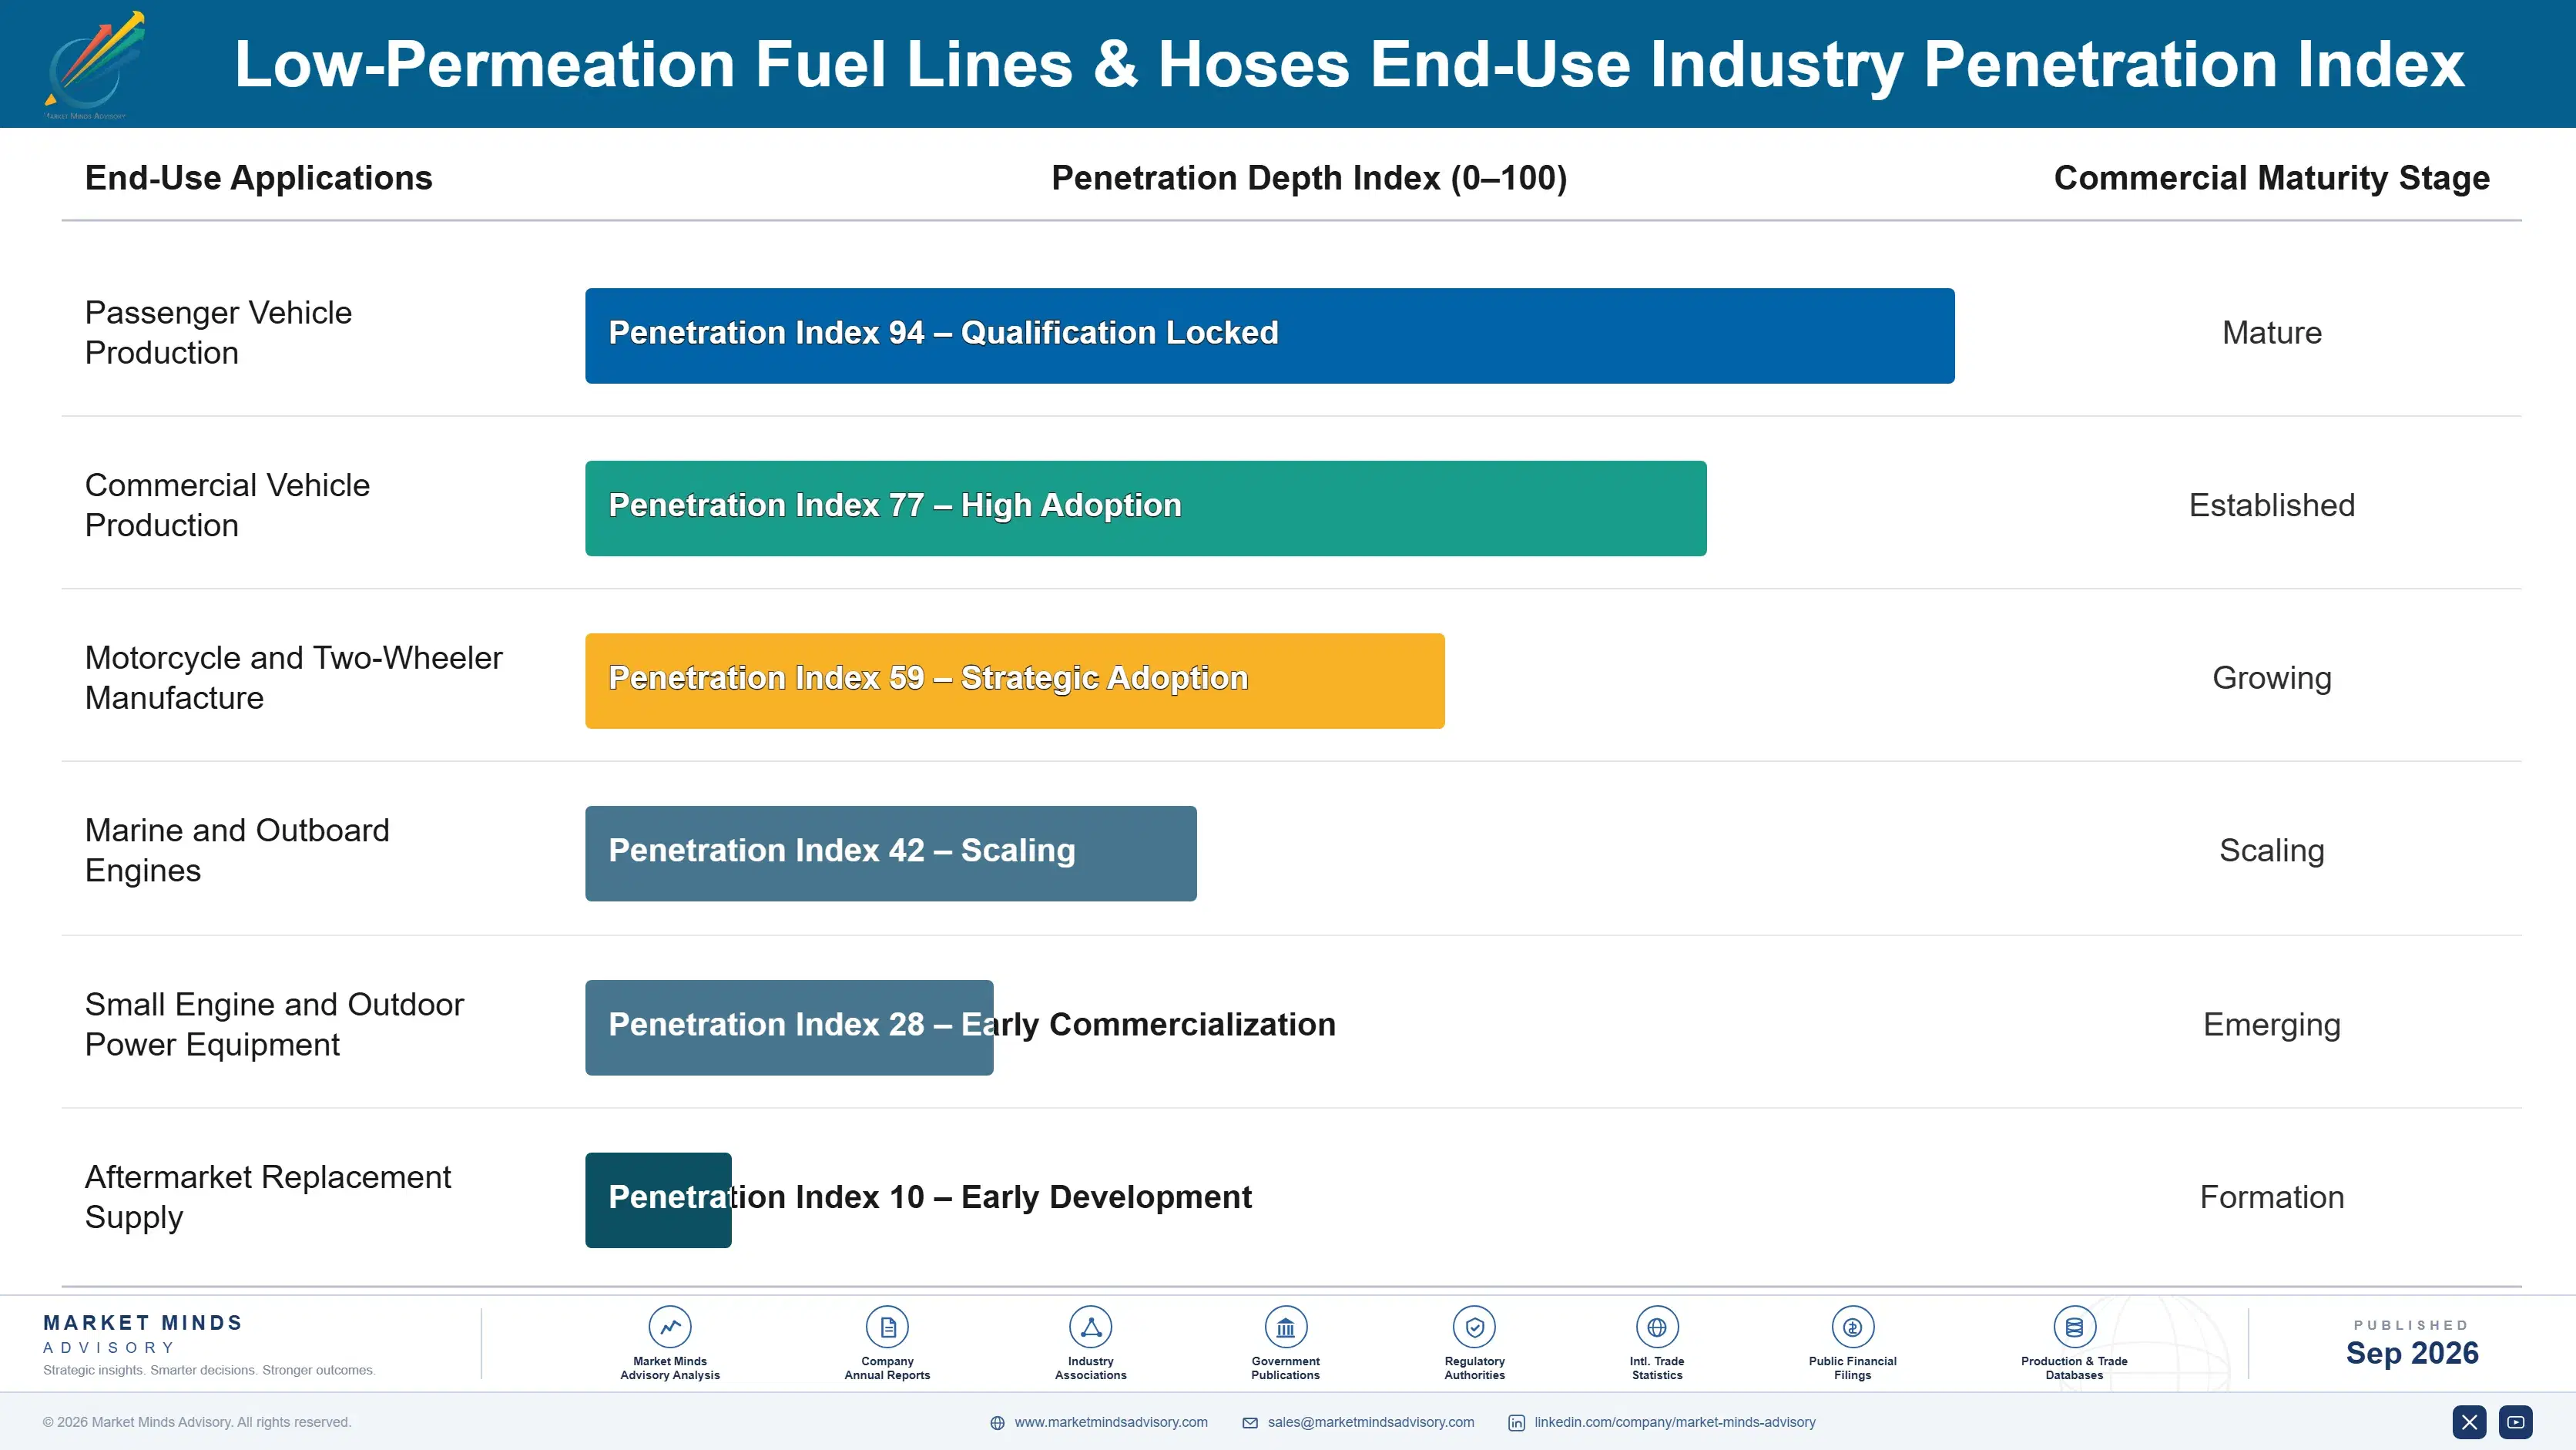
The annuity here is a platform and it is unusually secure once won. A construction approved for series production supplies that platform for around seven years without rebidding, because a fuel leak is a safety recall and nobody revalidates a component to save a few cents per metre. Volume follows the platform's build schedule with no selling required, and the revenue ends when the platform does.
Stickiness varies enormously by application rather than by customer. An automotive programme is locked by validation and by recall liability, which makes it effectively permanent for its life. A small engine or aftermarket application is retendered readily because the approval burden is far lighter and several suppliers can meet the specification. Suppliers frequently price both positions similarly, which considerably understates the automotive one.

Buyer profiles have shifted from fuel system engineers toward purchasing organisations with cost-down targets, and the technical argument no longer reaches the room. An engineer compared permeation results and thermal cycling data. A buyer compares price per metre across quotations that all claim compliance. Getting the permeation comparison back into that conversation is now the single most valuable commercial skill in this category.
low-permeation-fuel-lines-hoses-market-end-use-penetration-index-1788234698711

What Decides The Programme

These are among the four positions where our research anticipates prominent divergence between winners and laggards over the coming forecast period. Each is grounded in the demand model, the regulatory perimeter, and the announced capacity pipeline.
01 / HYDROGEN QUALIFICATION TIMING

Start the material work before anybody orders

Hydrogen compatible lines grow at 12.9% against a market rate of 8.6% from a base small enough that a few commercial vehicle programmes move the whole number, and qualification with a Tier 1 integrator takes around 18 months before any platform reaches production at all. A supplier beginning that work when volume appears is fully two years behind whoever started earlier, on platforms that then run for seven years once awarded. The cost is material science and testing rather than capital equipment, and very few are spending it yet.
02 / NON ELECTRIFYING WEIGHTING

Go where the combustion engines are staying

Outboard motors, generators, motorcycles, handheld tools and lawn equipment all continue in combustion at enormous volume while their own permeation rules tighten as sharply as automotive rules ever did, and none of that appears in automotive electrification forecasting anywhere. Those applications concentrate in East Asian and Indian manufacturing, where roughly 45% of category demand now sits. Serving them needs cost-appropriate constructions rather than automotive-grade ones, which is a product decision rather than any genuine capability gap for most suppliers here.
03 / PERMEATION BASED SELLING

Stop letting buyers compare price per metre

A purchasing organisation given two quotations compares price per metre, while the entire engineering advantage sits in a 0.12 millimetre barrier layer carrying 41% of the material cost that no purchase order line has ever shown to anybody. Supplying comparative permeation data, warranty exposure modelling and the cost of failing an evaporative test at type approval changes what is actually being compared. It requires the technical team in the commercial meeting, which a great many suppliers quietly avoid arranging at all.
04 / CONSTRUCTION RANGE STANDARDISATION

Run one family, not a pile of answers

Qualification runs around 18 months per programme and most suppliers repeat much of that validation work across automotive, marine, motorcycle and small engine customers using constructions that differ far more than the applications actually require them to. A deliberately standardised construction family amortises both validation and tooling across considerably more volume, and shortens qualification on every subsequent programme after it. It costs a little optimisation per application and returns considerably more in scarce engineering capacity than it ever gives away anywhere.

Engagement Snapshot From the Field

A live engagement with an industry participant carrying material or product regulatory and market exposure ahead of a defining policy shift, showing how our research translates into a defensible multi-year portfolio strategy.
MARKET MINDS ADVISORY · CLIENT ENGAGEMENT SUMMARY
Low-Permeation Fuel Lines & Hoses Producer Strategic Portfolio Review and Transition Roadmap 2026·Investment Scenario on Low-Permeation Fuel Lines & Hoses Exposure Evaluation 2025-26
CLIENT PROFILE
A European fluid systems supplier producing fuel lines and hoses for passenger vehicle platforms across Western and Eastern European assembly plants, with annual fuel line revenue in the low hundreds of millions of euros and a programme book concentrated almost entirely in conventional and mild hybrid passenger cars (client-reported, unverified by MMA). Battery platform awards were displacing renewals.
STRATEGIC CHALLENGE
Every platform renewal the client lost was lost to a battery vehicle rather than to a competitor, which no engineering or pricing response could address. Management needed to know how quickly the existing programme book would run down and where equivalent volume could realistically be found before the decline became visible in reported results.
MMA APPROACH
MMA modelled the client's programme book platform by platform against announced powertrain plans, producing a run-down curve rather than a market forecast. Forty-seven expert interviews with Tier 1 integrators, marine and small engine manufacturers, commercial vehicle engineers and resin suppliers established which applications were not electrifying and what qualification into them would actually require.
KEY FINDINGS
  1. Some 71% of the programme book sat on platforms scheduled for battery replacement within 8 years, with no renewal opportunity of any kind behind them.
  2. Marine, small engine and motorcycle applications required constructions the client could already make, at cost points roughly 30% below its automotive product.
  3. Commercial vehicle hydrogen programmes had opened qualification and the client had completed none of the material development required to submit anything at all.
  4. The client operated 14 distinct constructions across 9 programmes, repeating validation work that a standardised family would have amortised across all of them.
CLIENT PROFILE
A European fluid systems supplier producing fuel lines and hoses for passenger vehicle platforms across Western and Eastern European assembly plants, with annual fuel line revenue in the low hundreds of millions of euros and a programme book concentrated almost entirely in conventional and mild hybrid passenger cars (client-reported, unverified by MMA). Battery platform awards were displacing renewals.
STRATEGIC CHALLENGE
Every platform renewal the client lost was lost to a battery vehicle rather than to a competitor, which no engineering or pricing response could address. Management needed to know how quickly the existing programme book would run down and where equivalent volume could realistically be found before the decline became visible in reported results.
MMA APPROACH
MMA modelled the client's programme book platform by platform against announced powertrain plans, producing a run-down curve rather than a market forecast. Forty-seven expert interviews with Tier 1 integrators, marine and small engine manufacturers, commercial vehicle engineers and resin suppliers established which applications were not electrifying and what qualification into them would actually require.
KEY FINDINGS
  1. Some 71% of the programme book sat on platforms scheduled for battery replacement within 8 years, with no renewal opportunity of any kind behind them.
  2. Marine, small engine and motorcycle applications required constructions the client could already make, at cost points roughly 30% below its automotive product.
  3. Commercial vehicle hydrogen programmes had opened qualification and the client had completed none of the material development required to submit anything at all.
  4. The client operated 14 distinct constructions across 9 programmes, repeating validation work that a standardised family would have amortised across all of them.
RECOMMENDED STRATEGY
Phase 1: Phase one: begin hydrogen material development and Tier 1 engagement immediately, since qualification runs 18 months before any platform volume appears. Phase 2: Phase two: enter marine and small engine applications with cost-appropriate constructions, accepting lower margins for volume that is not disappearing. Phase 3: Phase three: consolidate the 14 constructions into a standardised family, freeing the engineering capacity that hydrogen qualification work will require.
OUTCOME
Within six quarters the client held two marine programme awards and had submitted hydrogen samples to two commercial vehicle integrators (client-reported, unverified by MMA). The passenger vehicle run-down continued exactly as modelled. Construction consolidation has reached seven of the fourteen. Two more marine programmes are in evaluation and the hydrogen submissions remain under review.

Frequently Asked Questions

Foundational context covering the market sizes, CAGR, scope, country, region and competition that inform every finding below. This section is provided to cover basics and most often pre-purchase conversations, answered from the MMA Primary Research Dataset.

What is the current size of the Low-Permeation Fuel Lines & Hoses Market?

The global low-permeation fuel lines and hoses market was valued at USD 3.4 billion in 2025, covering barrier conduit for fuel delivery and vapour circuits. The 2026 figure reaches USD 3.69 billion.

How large will the Low-Permeation Fuel Lines & Hoses Market be by 2036?

MMA forecasts USD 8.42 billion by 2036, an increase of USD 4.73 billion over the 2026 base. That represents an expansion multiple of 2.28 times across the forecast period.

What is the CAGR for the Low-Permeation Fuel Lines & Hoses Market 2026 to 2036?

The base case compound annual growth rate is 8.6%, with a bull case at 9.8% and a bear case at 7.4%. Historical growth between 2020 and 2025 ran at 7.2%.

Which segment is growing fastest?

Hydrogen and alternative fuel compatible lines grow at 12.9%, half again the market rate of 8.6%, because hydrogen permeates materials that hold gasoline comfortably. Coextruded EVOH follows at 9.0%.

Who are the major companies in the Low-Permeation Fuel Lines & Hoses Market?

Cooper Standard, Sumitomo Riko, TI Fluid Systems, Hutchinson and Toyoda Gosei lead on metres supplied into production, with combined CR5 of 39%. The customer is a fuel system Tier 1 rather than a vehicle maker.

Which country is growing fastest?

India grows fastest at 10.6%, where evaporative requirements now reach two-wheeler production built in enormous numbers each year. South Asia and Pacific leads regionally at 10.6%.

Report Segmentation Architecture

The full report scope spans multiple orthogonal segmentation dimensions, with cross-tabulated demand data provided for each dimension pair. Coverage extends further to regional breakdowns, trend trajectories, and the competitive detail needed to support segment-level decision-making.

By Barrier Construction

  • Multilayer Fluoropolymer Barrier Hose
  • Nylon and Polyamide Tubing
  • Fluoroelastomer Lined Rubber Hose
  • Surface Treated Sulfonated and Fluorinated Hose
  • Coextruded EVOH Barrier Constructions
  • Hydrogen and Alternative Fuel Compatible Lines

By End-Use Industry

  • Passenger Vehicle Production
  • Commercial Vehicle Production
  • Motorcycle and Two-Wheeler Manufacture
  • Marine and Outboard Engines
  • Small Engine and Outdoor Power Equipment
  • Aftermarket Replacement Supply

By Commercial Dimension

  • Tier 1 Fuel System Integrators
  • Direct Original Equipment Supply
  • Engine Manufacturer Contracts
  • Regional Distribution Networks
  • Aftermarket and Service Channels
  • Development and Validation Programmes

By Region

  • North America
  • Western Europe
  • East Asia
  • South Asia and Pacific
  • Latin America
  • Middle East and Africa
  • Eastern Europe

Scope, Methodology, and Coverage

Every figure in this report is reproducible from documented input assumptions. The scope below maps the historical period, the forecast horizon, the segmentation dimensions, and the countries covered, alongside the underlying primary and qualitative methodology.
Historical Period
2020 to 2025
Forecast Period
2026 to 2036
Base Year
2025 (USD billions; MMA Primary Research Dataset, September 2026)
Market Definition
The low-permeation fuel lines and hoses market covers flexible and rigid conduit engineered to restrict hydrocarbon vapour permeation in fuel delivery, vapour and return circuits, spanning multilayer fluoropolymer barrier hose, nylon and polyamide tubing, fluoroelastomer lined rubber hose, surface treated sulfonated and fluorinated hose, coextruded EVOH barrier constructions, and hydrogen and alternative fuel compatible lines. Scope covers supply into vehicle, marine, motorcycle and small engine production and into aftermarket replacement. Excluded are fuel tanks and filler necks, fuel pumps and delivery modules, carbon canisters and vapour recovery hardware, quick connectors sold separately, and industrial hose for non-fuel service.
Quantitative Units
USD billion, 2025 base year, 2026 to 2036 forecast period
Segmentation Dimensions
Barrier construction, end-use application, commercial channel, region
Regions Covered
North America, Western Europe, East Asia, South Asia and Pacific, Latin America, Middle East and Africa, Eastern Europe
Countries Covered
United States, Canada, Germany, France, United Kingdom, Italy, Spain, Czechia, China, Japan, South Korea, India, Australia, Brazil, Mexico, Morocco, South Africa, Poland
Key Companies Profiled
20 companies across fluid system suppliers, rubber product manufacturers and regional producers
Quantitative Methodology
Primary survey, n=3,800 respondents, Q4 2025, six countries; demand-side model with trade association cross-validation
Qualitative Methodology
47 expert interviews, Q4 2025; applied to validate demand model assumptions, identify emerging dynamics, and assess competitive positioning
Report Format
PDF and XLSX data workbook (Word format preview document)
Publisher
Market Minds Advisory
Report Code
MMA-2026-AUT-101
Published
September 2026
Contact
sales@marketmindsadvisory.com | www.marketmindsadvisory.com

Purchase the full Low-Permeation Fuel Lines & Hoses Market Report (2026 to 2036).

The full MMA report on the low-permeation fuel lines and hoses market runs to detailed construction and regional models across the 2026 to 2036 forecast period, with material cost benchmarks separated by barrier chemistry and layer configuration. It profiles 20 companies on a consistent supplied metres basis, covering fluid system suppliers, rubber product manufacturers and regional producers. Programme books are modelled against announced powertrain plans to size run-down exposure by supplier and by region. Regional chapters cover the seven MMA regions with country-level detail on the eighteen markets surveyed. Primary research draws on a quantitative survey of 3,800 respondents across six countries and 47 expert interviews conducted in Q4 2025.
Material cost benchmarks by barrier chemistry and layer configuration
Programme run-down exposure modelled against announced powertrain plans
Evaporative permeation limits tracked across eighteen surveyed jurisdictions
Twenty company profiles on consistent supplied metres basis
Non-electrifying application demand sized separately by end use
Seven regional chapters with eighteen country detail tables

Built For The People Who Decide

From boardroom strategy to bench-side execution, this report is read cover-to-cover by leaders shaping the next decade of their industry, turning demand scenarios, market dynamics and valuation benchmarks into decisions.
CXOs/ Presidents/ VPs/ Managers
M&A and Corporate Development
Strategy Teams and R&D Heads
Procurement and Product Directors
Regulatory and Compliance Leaders
Investor Relations and Equity Analysts