

Market Minds Advisory
Low-Glycemic Clinical Beverage Market

Low-Glycemic Clinical Beverage Market: Low-Glycemic Clinical Beverage Market. Glucose Monitoring, Clinical Evidence, and Reimbursement Reshape Medical Beverage Value.

Low-glycemic clinical beverages turn glucose control into a drinkable product, but trial evidence, medical food rules, reimbursement gaps, and patient taste fatigue decide which brands convert monitoring data and diabetes prevalence into repeat, paid-for volume.

Lead Analyst

Published

September 2026

Make Smarter Decisions with Customized Research Insights

Request a free sample report and evaluate market opportunities, growth trends, and competitive dynamics relevant to your business needs.

2025 MARKET VALUE$4.4BMarket Size 2025
2036 FORECAST VALUE$10.1BBase Case , 2026 to 2036
CAGR 2026 TO 20367.8 %Bull 9.1% / Bear 6.5%
INCREMENTAL OPPORTUNITY$5.3BNet 10- year value creation
EXPANSION MULTIPLE2.12x2036 value over 2026 base
Strategic Levers
M&A Pipeline
Regional Outlook
Country Rankings
Competitive Intelligence
Segmental Deep-dive
Call-Us : 91 93563 13602

Executive Snapshot and Market Trajectory.

A drink can lower a glucose curve or push it up, and for the 590 million adults living with diabetes the difference is clinical, not cosmetic. Clinical low-glycemic beverages sell measured carbohydrate, protein, and fibre instead of taste alone. The hard part is proving the curve to a payer.
Personalised and glucose-monitor-guided beverages grow fastest, since wearers of continuous glucose monitors want drinks matched to their own glucose response and dietitians want data to prove it. North America holds the largest share, because reimbursement, clinical nutrition programmes, and continuous glucose monitor adoption concentrate spend there, with East Asia and Western Europe following. India leads country growth. Evidence sets eligibility. Reimbursement sets scale. Taste sets adherence.
Competition is highly concentrated, with two global nutrition majors, a French-owned dairy nutrition group, a German-based clinical nutrition supplier, and a Japanese dairy group competing alongside regional formulators and start-ups on clinical evidence, glycemic response, and payer access. Protein and packaging costs, medical food regulation, and reimbursement rules shape margins, while dietitians and hospitals steer choice. Big groups own clinical evidence. Start-ups own personalisation. Payers own the volume. Small formulators win niches.
Market Definition
Low-glycemic clinical beverages comprise ready-to-drink and powder-to-drink nutrition beverages formulated to moderate post-meal glucose response, used under clinical or dietitian guidance for diabetes, prediabetes, and related metabolic conditions, including diabetes-specific oral nutrition supplements, slow-release carbohydrate drinks, pre-meal glycemic shots, personalised drinks, and clinical mixes. The scope excludes general wellness and sports drinks, enteral tube feeds, insulin and drugs, and infant formula.
Base Year Value
$4.4B in 2025 (MMA Primary Research Dataset, September 2026)
Forecast Period
2026 to 2036, eleven discrete annual values
CAGR
7.8% base case. Bull 9.1%. Bear 6.5%.
Fastest Growth Segment
Personalised and CGM-Guided Beverages: 13.0% CAGR
Fastest Growth Country
India: 11.2% CAGR
Fastest Growth Region
South Asia and Pacific: 9.8% CAGR
Largest Region
North America: 30% of 2025 global value
Market Leaders
Abbott Laboratories, Nestlé Health Science, Danone Nutricia, Fresenius Kabi, Meiji Holdings. Source: MMA Analysis, company annual reports.
Primary Survey
n=3,800 procurement and R&D decision-makers, Q4 2025, six countries
Methodology
Demand-side build-up, cross-validated against public data, 47 expert interviews

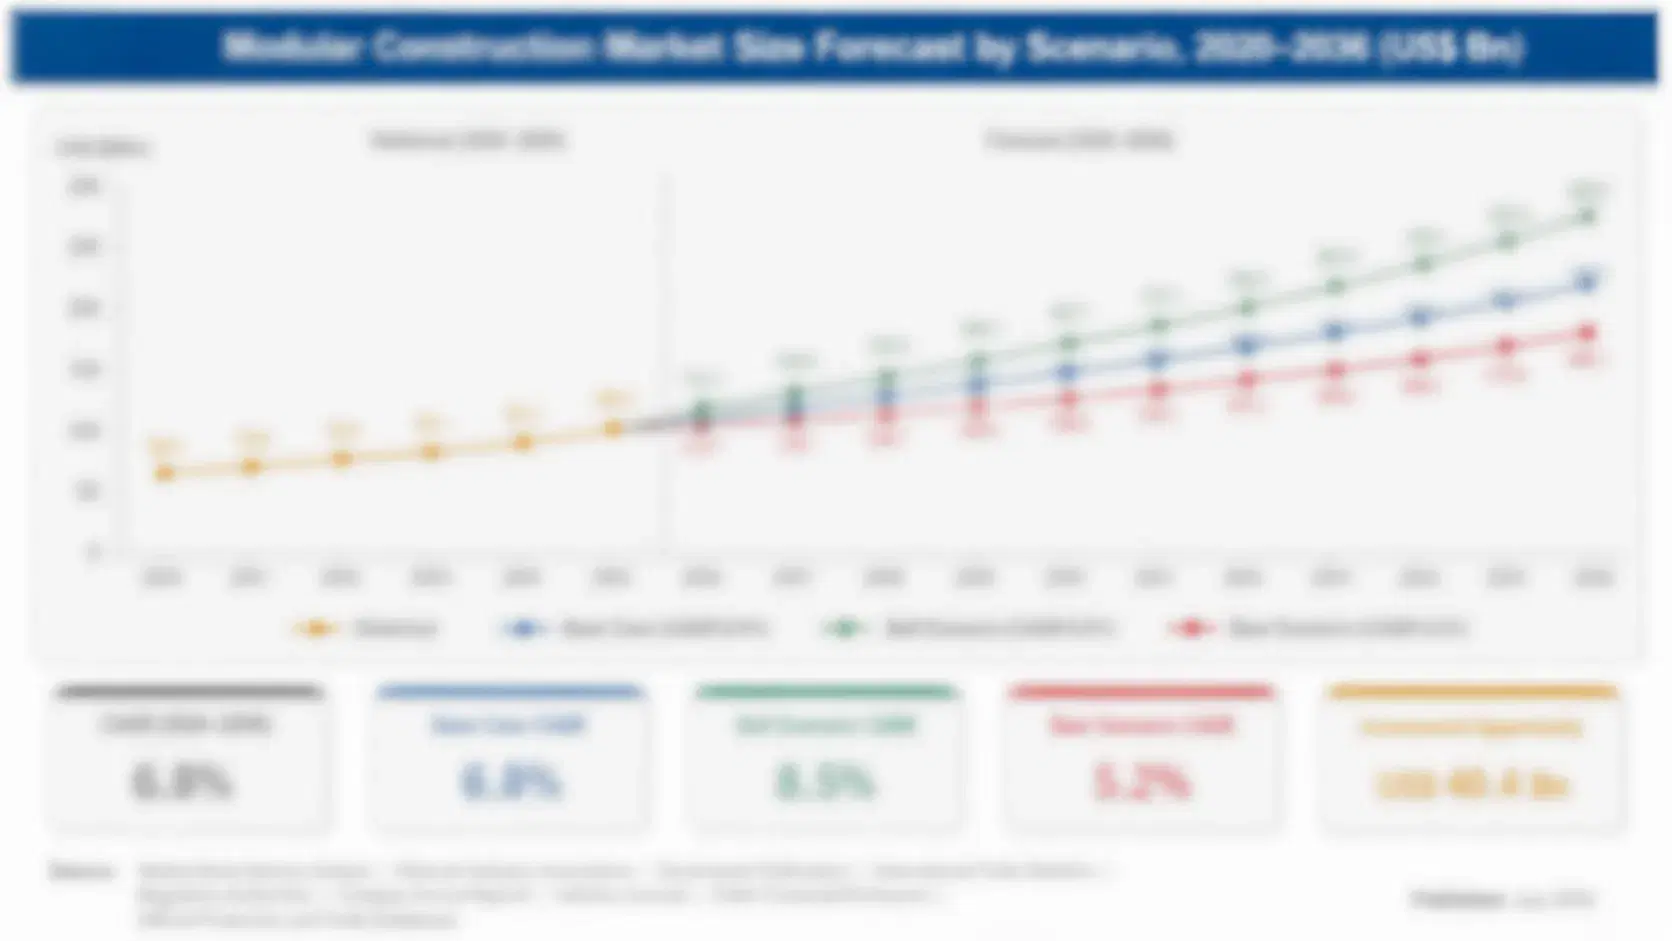
Low-Glycemic Clinical Beverage Market Forecast Scenarios

low-glycemic-clinical-beverage-market-size-forecast-scenario-1789807502315
From 2020 to 2025, low-glycemic clinical beverages grew as diabetes prevalence rose, hospitals and dietitians recommended diabetes-specific supplements, and continuous glucose monitors reached more users. Protein, packaging, and freight costs rose from 2021, and brands raised prices in steps. Growth ran a little below the forecast pace as reimbursement gaps and taste fatigue limited adherence, and price rises supplied part of the value gain.
The base case rests on three commercial mechanisms. First, continuous glucose monitor adoption creates demand for drinks matched to individual glucose response. Second, ageing populations and hospital nutrition programmes lift diabetes-specific supplement use in Asia and Europe. Third, low-glycemic ingredients such as isomaltulose and resistant dextrin move into mainstream clinical formulas. Each mechanism compounds slowly, and none needs a breakout year. Suppliers plan evidence, registrations, and payer engagement around all three. Buyers reward consistency over novelty.
The bull case needs wider reimbursement and published trials that support glycemic claims, which would lift volumes and let brands raise prices. The bear case is tighter regulation of glycemic claims combined with wider use of appetite-suppressing drugs, which would squeeze volumes, delay launches, and push buyers toward general protein drinks. Formulary decisions decide renewal.

Clinical Evidence, Reimbursement, and Taste Adherence Decide Clinical Beverage Winners

Low-glycemic clinical beverages span several production models. Manufacturers blend milk or soy protein with slow-release carbohydrates such as isomaltulose, fibre, healthy fats, vitamins, and minerals, treat the mix at ultra-high temperature or spray-dry it, and fill aseptic bottles, cartons, or sachets. Formulas follow medical food and special medical purpose rules, and each product needs evidence of glucose response to support claims. Clinical evidence decides brand rankings.
MARKET CONCENTRATION71% CR5Leading five groups hold a dominant combined share
GLOBAL ADULTS WITH DIABETES590 millionEstimated adult population living with diabetes across the world
REIMBURSED VOLUME SHARE24%Portion of volume paid for by insurers or health systems
TYPICAL PROTEIN CONTENT14 gCommon protein content in a diabetes-specific serving bottle
PACKAGING COST SHARE24%Portion of goods cost taken by aseptic bottles and cartons
REGULATORY LEAD TIME24 monthsTypical time to register a special medical purpose formula
Clinical evidence, reimbursement, and taste adherence decide value. Buyers judge these drinks by glucose response, protein content, taste, and price, so a brand needs published trials, registrations, and payer access. Large groups own clinical teams and hospital relationships, while start-ups own personalisation. Brands with evidence, coverage, and palatable formulas win because patients stop drinking products they dislike and payers stop paying for products they cannot justify.
Buyers judge clinical beverages on glucose response, protein and fibre content, taste, and price per serving. Dietitians and hospitals want evidence and simplicity, while patients want flavour variety and convenient formats, and payers want cost-effectiveness. Price sensitivity is high among out-of-pocket buyers and lower where insurers pay, which pushes brands toward multipacks, subscriptions, prescription pathways, and clear glycemic data on the pack.
"A low-glycemic drink is a medical claim wearing a beverage's clothes, and the claim has to survive both the trial and the palate. Brands that treat taste as a clinical outcome will keep patients on therapy. Reimbursement, not consumer interest, decides how big this category can become."
Senior Analyst, Clinical Nutrition and Healthcare Practice · MMA Diabetes-Specific and Low-Glycemic Clinical Nutrition Beverages Practice · September 2026

Market Trends

Continuous Glucose Monitors Create Demand for Personalised Beverages

Continuous glucose monitors are now used by millions of people with diabetes and by health-conscious buyers without it, and users see how foods and drinks move their glucose. Brands respond with beverages tuned to individual response, data partnerships with monitor makers, and apps that guide choices. Personalised programmes price 30% to 80% above standard diabetes-specific drinks and earn gross margins of 44% to 58%. The trend needs trials that show glucose response and data privacy compliance, and it rewards brands with monitor partnerships and subscription models. Margins follow input discipline. Hospital teams review suppliers every year.
Market Impact: diabetes prevalence grows 3% yearly

Low-Glycemic Ingredients Move Into Mainstream Clinical Formulas

Formulators are replacing fast-digesting carbohydrates with isomaltulose, resistant dextrin, allulose, and viscous fibres that slow glucose absorption, and the European Union authorises a claim that isomaltulose leads to a lower blood glucose rise. Slow-release drinks cut peak glucose by 20% to 40% in trials against standard sugar-based formulas. The trend lifts ingredient cost by 10% to 20% but supports premium pricing and clinical credibility, and it rewards suppliers with secure ingredient supply, trial data, and taste work that masks fibre. Trial data protects future sales. Cost control separates leaders from followers. Clear labelling builds patient trust.
Market Impact: clinical pathways cover 24% of volume

Market Opportunities and Growth Drivers

Rising Diabetes Prevalence and Ageing Populations Expand the Patient Base

About 590 million adults live with diabetes worldwide, and the number is projected to exceed 800 million by 2050, with the fastest increases in India, China, Southeast Asia, and the Middle East. Ageing populations add malnutrition and sarcopenia risk, so dietitians recommend diabetes-specific supplements alongside meals. Hospitals and nursing homes use these drinks for inpatients and residents, and pharmacies stock them for outpatients. The driver adds volume growth of 6% to 9% a year and supports investment in evidence, registrations, and local production. Small formulators feel every registration delay. Clinical reach compounds over time.
Market Impact: registrations take 24 months per market

Hospital and Clinical Nutrition Programmes Widen Prescription Pathways

Hospitals, diabetes clinics, and health systems increasingly include diabetes-specific nutrition in care pathways, and clinical guidelines in the United States, Europe, and Japan recognise the role of low-glycemic supplements for selected patients. Reimbursement for defined groups covers about 24% of volume and gives brands predictable demand. Dietitians and pharmacists guide choice, and brands with clinical teams win formulary listings. The driver builds steady volume, raises adherence through professional support, and rewards suppliers that publish evidence and health economics data. Buyers reward consistency over novelty. Formulary decisions decide renewal. Clinical evidence decides brand rankings.
Market Impact: only 24% of volume reimbursed

Market Restraints and Challenges

Regulatory Evidence Burden Slows Launches and Restricts Glycemic Claims

Medical food and special medical purpose rules in the United States, the European Union, and China require documented evidence and registrations that take about 24 months, and glycemic claims fail without controlled trials on glucose response. The root cause is regulators' demand for clinical proof before a product can claim benefit. Brands fund randomised crossover trials costing $200,000 or more and register formulas market by market. Small formulators struggle to fund studies, and delays slow adoption of new ingredients and formats. Margins follow input discipline. Hospital teams review suppliers every year. Trial data protects future sales.
Market Impact: personalised drinks price 30-80% higher

Patient Taste Fatigue and Reimbursement Gaps Limit Adherence and Volume

Many patients stop drinking clinical beverages within eight weeks when taste and sweetness fatigue set in, and only about 24% of volume is reimbursed, so out-of-pocket buyers churn quickly. The root cause is limited flavour variety in formulas built for glucose control and uneven payer coverage. Brands respond with flavour rotation, subscription models, and health economics evidence for payers, though reformulation costs time and coverage decisions move slowly, and wider use of appetite-suppressing drugs may reduce supplement use. Cost control separates leaders from followers. Clear labelling builds patient trust. Small formulators feel every registration delay.
Market Impact: slow-release carbs cut glucose peaks 20-40%
3 additional market trends, 2 additional growth drivers, and 4 additional restraints and challenges are covered in the full report. Contact sales@marketmindsadvisory.com to access the complete intelligence.

Segment CAGR and Growth Architecture

Low-glycemic clinical beverages are segmented by product type, which shows where evidence, personalisation, and pricing power sit. Five segments cover personalised and monitor-guided beverages, pre-meal glycemic shots and drinks, slow-release carbohydrate meal replacement drinks, diabetes-specific oral nutrition supplements, and powder-to-drink clinical mixes. Two segments grow fastest on monitoring and prevention demand. Clinical reach compounds over time.
low-glycemic-clinical-beverage-market-market-share-analysis-1789807502622

Personalised and CGM-Guided Beverages

Personalised and CGM-Guided Beverages is the fastest-growing segment at 13.0% a year, about 1.67 times the overall market rate. Brands tune formulas to individual glucose response using continuous glucose monitor data, apps, and dietitian guidance, and price programmes 30% to 80% above standard diabetes-specific drinks. Evidence and data privacy are the main constraints, since claims need trials and health data rules apply. Large groups with monitor partnerships and clinical teams win, while start-ups compete on personalisation and subscription models that build repeat purchase and adherence. Buyers reward consistency over novelty. Formulary decisions decide renewal. Clinical evidence decides brand rankings. Margins follow input discipline. Hospital teams review suppliers every year. Trial data protects future sales.
CAGR 13.0%

Pre-Meal Glycemic Shots and Drinks

Pre-Meal Glycemic Shots and Drinks grow at 10.4% a year, because small doses of fibre, protein, vinegar, or amino acids taken before meals can blunt glucose peaks, and buyers with prediabetes and type two diabetes seek an easy habit that fits meals. Shots of 60 to 100 millilitres sell through pharmacies, health stores, and subscriptions at prices of $2 to $4 each. Evidence and claim rules are the main constraints, since effects vary and regulators police statements. Producers respond with trials, modest wording, and subscription models. Cost control separates leaders from followers. Clear labelling builds patient trust. Small formulators feel every registration delay. Clinical reach compounds over time. Buyers reward consistency over novelty.
CAGR 10.4%
Full segment breakdown across 5 segments available in the complete report.

Regional Architecture and Country Demand Map

Clinical beverage value follows diabetes prevalence, reimbursement, and hospital nutrition spend. North America leads through clinical nutrition spend and monitor adoption, East Asia follows through very large diabetes populations, Western Europe holds a mature share, and South Asia and Pacific grows fastest. Formulary decisions decide renewal.

North America

North America holds 30% share, with the United States and Canada leading through the world's largest clinical nutrition spend, high diabetes prevalence, wide continuous glucose monitor adoption, and hospital and pharmacy pathways. Abbott Laboratories, Nestlé Health Science, Kate Farms, Herbalife Nutrition, and Hormel Health Labs lead, and buyers reach products through pharmacies, hospitals, insurers, and online channels. Growth runs slightly below the global rate as the base matures, though personalised programmes add value. Medical food rules, payer scrutiny, and price competition from generic supplements restrain margins. Clinical evidence decides brand rankings. Margins follow input discipline. Hospital teams review suppliers every year. Trial data protects future sales. Cost control separates leaders from followers.
Share: 30% | CAGR: 7.5% (2026 to 2036)

East Asia

East Asia holds 26% share, with China, Japan, South Korea, and Taiwan leading through very large diabetes populations, ageing demographics, and strong dairy and clinical nutrition groups. Meiji Holdings, Otsuka Holdings, Ajinomoto, Morinaga Milk Industry, and Nestlé Health Science lead, and hospitals and pharmacies carry most volume. Growth runs above the global rate as China's special medical purpose formula system and Japanese function claims support evidence-backed products. Registration timelines, local approval rules, and price competition restrain margins. Clear labelling builds patient trust. Small formulators feel every registration delay. Clinical reach compounds over time. Buyers reward consistency over novelty. Formulary decisions decide renewal. Clinical evidence decides brand rankings. Margins follow input discipline. Hospital teams review suppliers every year.
Share: 26% | CAGR: 8.8% (2026 to 2036)
Regional intelligence for 5 additional markets available in the complete report: Western Europe, South Asia and Pacific, Latin America, Middle East and Africa, Eastern Europe. Contact sales@marketmindsadvisory.com.
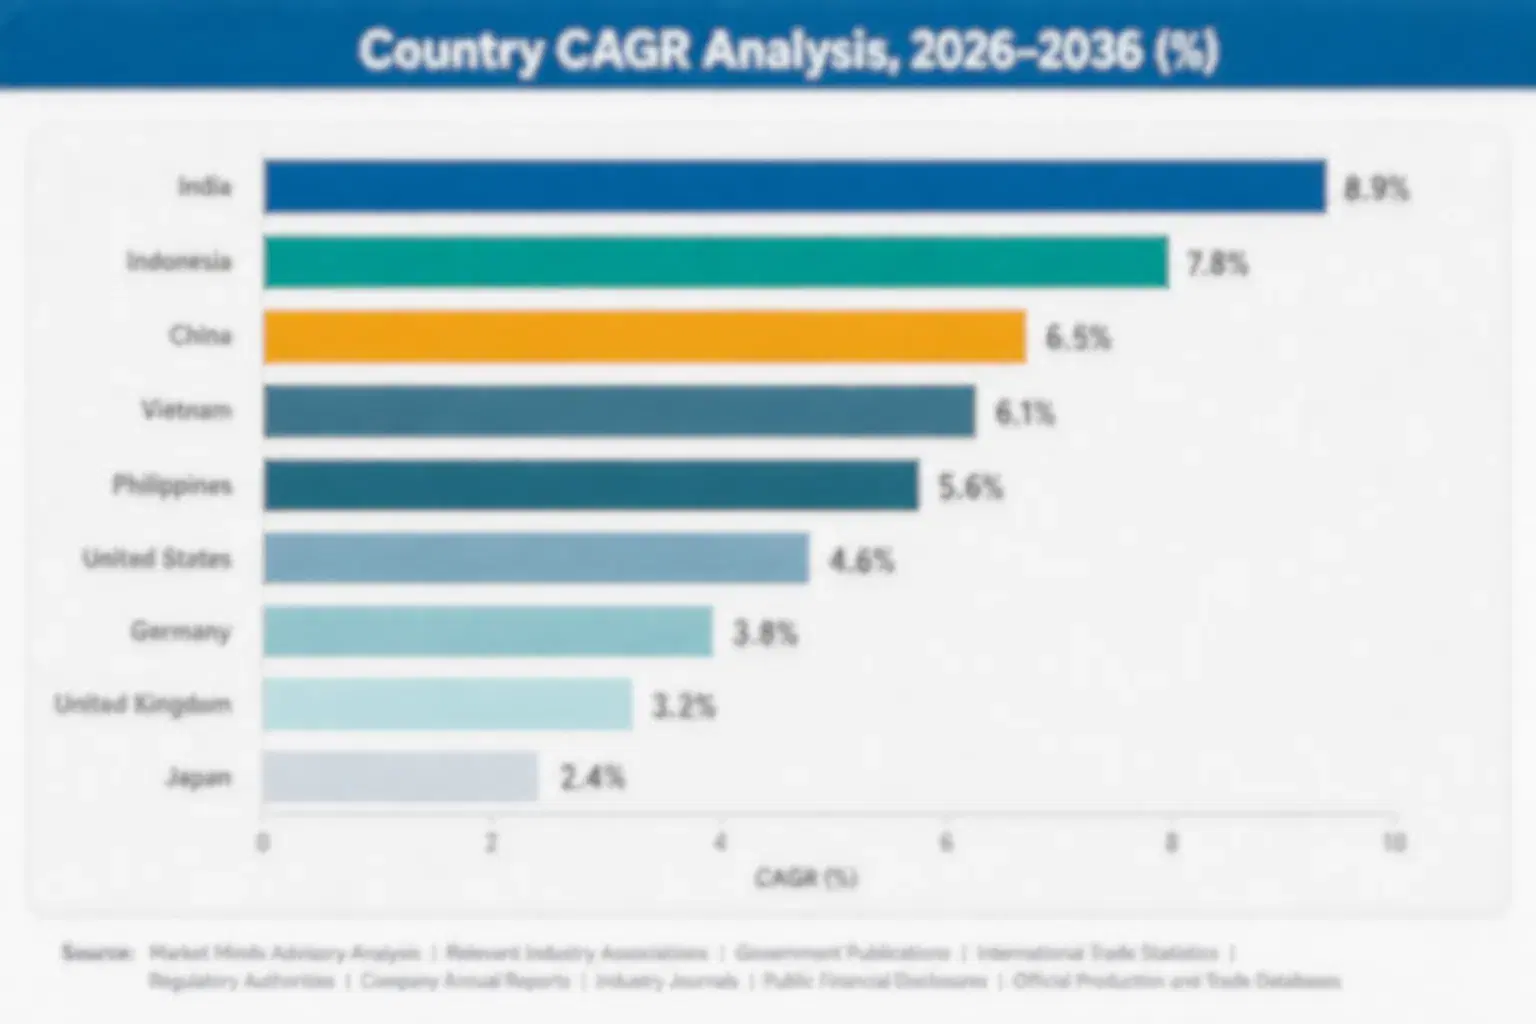
low-glycemic-clinical-beverage-market-country-cagr-analysis-1789807502883

Four Margin Routes for Clinical Beverage Brands

Margin in low-glycemic clinical beverages comes from personalised programmes, clinical evidence, payer access, and adherence rather than volume alone. The routes below apply to global nutrition groups, dairy companies, and start-ups, and each can start inside one planning cycle, with clear measures in gross margin points, reimbursed volume share, and patient retention at 12 weeks.

Building Personalised Programmes Linked to Glucose Monitor Data

Personalised programmes price 30% to 80% above standard diabetes-specific drinks, and brands that link formulas to continuous glucose monitor data through partnerships and apps report gross margin gains of 6 to 10 points on those lines. Subscription models lift retention above 60% at 12 weeks. Monitor users add volume. Pilot programmes with one monitor maker and two clinics typically confirm demand within two quarters, before wider partnerships and regional launches follow. Trial data protects future sales. Cost control separates leaders from followers. Clear labelling builds patient trust. Small formulators feel every registration delay.
Market Impact: personalised programmes lift gross margin by 6-10 points

Funding Crossover Trials and Registering Formulas Early in Each Market

Registrations take about 24 months per market, and glycemic claims fail without controlled trials, so brands that fund randomised crossover trials costing $200,000 or more and register formulas early protect claims worth 30% of volume. Published data wins formulary and hospital listings. Small formulators can license evidence packages from ingredient suppliers. Brands should map registrations by market, keep claim language within approved wording, and review regulatory calendars each quarter. Clinical reach compounds over time. Buyers reward consistency over novelty. Formulary decisions decide renewal. Clinical evidence decides brand rankings. Margins follow input discipline.
Market Impact: trial evidence protects claims worth 30% of volume

Building Payer Access and Prescription Pathways With Hospitals and Clinics

Only about 24% of volume is reimbursed, and brands that build health economics evidence, pursue coverage for defined patient groups, and partner with hospitals and diabetes clinics lift reimbursed share toward 35% within three years. Prescription pathways raise adherence above 55% at 12 weeks. Payer negotiations take 12 to 24 months. Small brands can start with one hospital group and one country, and should track formulary listings and reorder rates each quarter. Hospital teams review suppliers every year. Trial data protects future sales. Cost control separates leaders from followers. Clear labelling builds patient trust.
Market Impact: payer access lifts reimbursed share from 24% toward 35%

Improving Taste and Adherence With Flavour Rotation and Stable Supply

Patients often stop within eight weeks when taste fatigue sets in, and protein and slow-release carbohydrates take about 38% of cost of goods, so brands that rotate flavours, use isomaltulose and fibre blends that hold taste, and sign multi-year protein and carbohydrate contracts lift adherence by 15 to 25 points and cut cost volatility by roughly half. Contract fillers avoid capital costs of $1 million or more. Brands should track churn each month. Small formulators feel every registration delay. Clinical reach compounds over time. Buyers reward consistency over novelty. Formulary decisions decide renewal.
Market Impact: taste work and contracts lift adherence by 15-25 points

Who Controls the Margin Pool

The low-glycemic clinical beverage market is highly concentrated, with a CR5 of 71%, and regional formulators, start-ups, and private label suppliers sit outside the leading five. This assessment measures participants on estimated clinical beverage sales value, held constant across all players. Abbott Laboratories leads through Glucerna and monitor-linked programmes, while Nestlé Health Science, Danone Nutricia, Fresenius Kabi, and Meiji Holdings follow, with a clear gap between the leader and the
Competition runs on four dimensions today: clinical evidence and registrations, payer and hospital access, taste and adherence, and personalisation through monitor data. Large groups win on trials, medical teams, and formulary relationships, while start-ups win on data and subscription models. Imitators copy formats quickly but cannot copy evidence, so premiums outside proven claims erode within a contract cycle, and price competition appears in hospital tenders. Clinical evidence decides brand rankings.

Emerging pressure comes from general protein drinks marketed for blood sugar, monitor makers launching nutrition programmes, and appetite-suppressing drug users shifting to high-protein products. Rankings shift where a brand publishes trial data, wins a payer contract, or partners with a monitor maker. Regional formulators in India and China can move up quickly, since local registrations and price matter
low-glycemic-clinical-beverage-market-company-positioning-matrix-1789807503165

Competitive Moat and Risk Dimensions

ABBOTT LABORATORIES

Moat: Glucose Monitoring and Nutrition Synergy

Abbott Laboratories sells Glucerna diabetes nutrition alongside FreeStyle Libre continuous glucose monitors, which gives it data, clinician relationships, and cross-selling routes that rivals lack. Its clinical trials, hospital and pharmacy distribution, and global registrations support glycemic claims, and its scale in nutrition manufacturing lowers cost per serving.
ABBOTT LABORATORIES

Risk: Reimbursement Pressure and Cost Exposure

Abbott depends on payers and hospitals that push for lower prices and tenders, and protein and packaging cost spikes squeeze margins. Its nutrition business faces recall and regulatory scrutiny risk, and start-ups with personalised programmes attract monitor users, while wider use of appetite-suppressing drugs could reduce supplement volumes.
NESTLÉ HEALTH SCIENCE

Moat: Clinical Nutrition Portfolio and Reach

Nestlé Health Science sells Boost Glucose Control and other medical nutrition products through hospitals, pharmacies, and retail in more than 100 countries, backed by clinical research and dietitian relationships. Its portfolio spans tube feeding to oral supplements, its scale in protein sourcing lowers cost, and its brand equity supports pricing power in pharmacy channels.
NESTLÉ HEALTH SCIENCE

Risk: Portfolio Breadth and Payer Scrutiny

Nestlé Health Science spreads investment across many nutrition categories, so diabetes-specific innovation competes for capital. Payers and hospitals push for lower prices, and protein and packaging inflation squeeze margins, while monitor-linked rivals with data partnerships move faster in personalised programmes. Margins follow input discipline. Hospital teams review suppliers every year.

Players Tracked

Prominent Players

Abbott Laboratories
Nestlé Health Science
Danone Nutricia
Fresenius Kabi
Meiji Holdings

Other Key Players

Ajinomoto
Otsuka Holdings
Kate Farms
Herbalife Nutrition
Reckitt Benckiser
Baxter International
B. Braun
Hormel Health Labs
Zydus Wellness
Nutrifood
Morinaga Milk Industry
Glanbia Nutritionals
Kerry Group
Beneo
Suntory Wellness

Recent Developments

JANUARY 2026

Abbott Laboratories Launches Glucose Monitor-Linked Nutrition Guidance for Glucerna Users

Abbott Laboratories launched nutrition guidance linked to continuous glucose monitor data for Glucerna users, aimed at helping patients choose drinks that fit their glucose response. It is a product and programme launch, and it tests whether monitor data can lift adherence and price. Sales volumes were not disclosed.
Signal: Confirms that leading brands are linking clinical drinks to monitor data to lift adherence and support premium pricing.
FEBRUARY 2026

Nestlé Health Science Signs Co-Development Agreement for Isomaltulose Clinical Formulas

Nestlé Health Science signed a co-development agreement with an isomaltulose supplier to build slow-release carbohydrate formulas for diabetes-specific drinks. It is a co-development agreement, not an acquisition, and it tests whether ingredient partnerships can secure supply and taste. Terms were not disclosed. Trial data protects future sales.
Signal: Suggests clinical nutrition groups are securing slow-release ingredient supply through co-development to protect claims and margins.
MARCH 2026

Danone Nutricia Expands Clinical Nutrition Production Capacity in Asia

Danone Nutricia announced organic expansion of clinical nutrition production capacity in Asia to serve diabetes-specific and special medical purpose demand. It is a capacity expansion, not an acquisition, and it tests whether local production can lower cost and speed registrations. Investment figures were not disclosed. Formulary decisions decide renewal.
Signal: Indicates global groups are localising clinical nutrition production in Asia to serve fast-growing diabetes populations and registrations.

What Drives Clinical Beverage Production Costs

Packaging including aseptic bottles and cartons accounts for roughly 24% of cost of goods, milk and soy protein about 20%, slow-release carbohydrates and fibres such as isomaltulose about 18%, quality assurance and regulatory compliance about 12%, logistics about 10%, vitamins and minerals about 8%, and manufacturing labour and energy about 8%. Protein comes from dairy processors in Europe, New Zealand, and the United States.
The clearest recent shock came from protein and packaging. The United States Department of Agriculture Foreign Agricultural Service reported sharp rises in global milk protein prices during 2021 and 2022, and Abbott Laboratories and Nestlé reported in annual documents that ingredient, packaging, and logistics inflation weighed on nutrition margins. Brands raised prices by 4% to 8%, shrank packs, and delayed launches, which squeezed gross margin by several points until contracts reset.

The competitive disadvantage falls on small formulators, which buy protein, isomaltulose, and packaging in small lots at spot prices and cannot fund registrations across markets. Large groups own plants, sign long contracts, and spread regulatory cost across many products. Exposure also varies by geography, since European producers face tender pricing while Asian producers face local approval costs and price sensitivity.
low-glycemic-clinical-beverage-market-cost-volatility-analysis-1789807503501

Signing Multi-Year Protein and Slow-Release Carbohydrate Contracts

Brands sign multi-year protein and isomaltulose contracts, consolidate orders across products, and dual-source key inputs. Forward contracts cut cost swings by roughly half, though they need volume commitments and working capital that only larger brands usually provide. Terms often run two years, delivery reliability matters, and buyers should approve early. Margins follow input discipline. Trial data protects future sales.

Licensing Evidence Packages From Ingredient Suppliers

Small formulators license clinical evidence and regulatory dossiers from ingredient suppliers rather than funding trials alone, cutting evidence cost by 30% to 50%. Licensing supports claims in the European Union and elsewhere. The main risk is dependence on one supplier, so brands negotiate access rights and keep alternative ingredients ready for new formulas. Cost control separates leaders from followers.

Using Contract Manufacturers to Avoid Capital Costs

Small brands use contract manufacturers and co-packers rather than building aseptic plants, avoiding capital costs of $5 million or more. Contract services add cost per bottle but lower risk and handle seasonal peaks. The main challenge is quality control and medical food compliance, so brands audit facilities, agree specifications, and book capacity months ahead. Clear labelling builds patient trust.

Portfolio Architecture for Margin Defence

Margins run from thin returns on generic diabetes-specific supplements sold in tenders to strong returns on personalised, pre-meal, and slow-release drinks sold with evidence through pharmacies, clinics, and subscriptions. Three tiers separate volume products, certified premium lines, and next-generation formats, and each tier draws on different buyer groups, evidence packages, and payer terms. Small formulators feel every registration delay. Clinical reach compounds over time.
The tension between volume and premium is sharp. Volume lines protect plant utilisation and hospital relationships but face constant price pressure from tenders and generic supplements, while premium lines earn higher margins on smaller volumes and depend on evidence, registrations, and payer access. Brands that run only volume struggle to fund trials, while brands that run only premium lack the scale to hold hospital listings and absorb input cost shocks.

High-value pools concentrate in personalised and monitor-guided drinks sold through clinics, pharmacies, and subscriptions. They gather where buyers pay for evidence, personalisation, and adherence support rather than volume. Monitor users, prediabetes patients, and hospital programmes add further value, since these buyers ask for reliable supply and clear data, and they reorder without shopping on price. Buyers reward consistency over novelty.

Volume / Commodity-Adjacent Tier

Generic diabetes-specific oral nutrition supplements sold to hospitals and pharmacies under tenders, with thin margins, protein and packaging cost exposure, and constant price competition, where buyers switch on price, delivery terms, and tender results.
Gross Margin: 26%-38%

Premium / Certified Tier

Slow-release carbohydrate drinks with published glucose response trials, registrations, and formulary listings, sold through hospitals, clinics, and pharmacies that require reliable supply, clear labelling, and stable pricing across contract periods. Formulary decisions decide renewal.
Gross Margin: 40%-54%

Sustainability / Regulatory / Next-Generation Tier

Personalised, monitor-guided, and pre-meal glycemic drinks with data partnerships, subscription models, and evidence-backed claims, sold through clinics, apps, and pharmacies to buyers who pay premiums for tailored glucose control and adherence support. Clinical evidence decides brand rankings.
Gross Margin: 44%-60%
low-glycemic-clinical-beverage-market-portfolio-architecture-1789807503696

High-value Sub-segments and Strategic Watch-out

Personalised and CGM-Guided Beverages

Personalised and monitor-guided beverages combine the fastest growth with strong pricing, since users pay 30% to 80% premiums for drinks matched to their glucose response. Trials and data partnerships limit competition, and brands with monitor ties win subscribers. Volume compounds as monitor adoption widens. Margins follow input discipline.
Gross Margin: 44%-60%

Pre-Meal Glycemic Shots and Drinks

Pre-meal glycemic shots and drinks deliver solid growth and healthy pricing, since buyers with prediabetes pay $2 to $4 for an easy habit before meals. Evidence forms the entry barrier, and brands with subscriptions win repeat purchase. Volume builds steadily through pharmacies, health stores, and online channels.
Gross Margin: 38%-54%

Slow-Release Carbohydrate Meal Replacement Drinks

Slow-release carbohydrate meal replacement drinks form the volume core, sold through pharmacies and hospitals at moderate margins. Growth is steady, at about 8.6% a year, as isomaltulose claims and clinical guidance widen use. Ingredient cost, tenders, and taste decide profit, and brands use the segment to anchor hospital relationships.
Gross Margin: 32%-46%

Powder-to-Drink Clinical Mixes

Powder-to-drink clinical mixes are the strategic watch-out, since convenience, taste, and adherence trail ready-to-drink formats, growth stays near 5.4% a year, and margins are tight. Brands should test single-serve sachets and flavour variety before scaling, because retailer delisting and tender pressure can erode margin quickly. Formulary decisions decide renewal.
Gross Margin: 24%-36%

Why Patients Keep Using Clinical Beverages

Clinical beverage demand behaves like an annuity attached to care plans. Once a dietitian or physician recommends a product and a payer or patient accepts it, the patient repeats the purchase weekly, and switching means new advice and possible glucose surprises. Hospitals and pharmacies use last year's usage to fix orders, so successful brands earn steadier volume than launches driven by novelty alone. Clinical evidence decides brand rankings.
Adoption stickiness differs by end-use vertical. Hospital and nursing home patients are the deepest, since nutrition is prescribed and supplied by the facility, and they change only when clinicians or tenders change. Outpatients on reimbursed plans are almost as loyal. Out-of-pocket retail and online buyers are shallower and switch on price and taste, while wellness buyers follow trends. Margins follow input discipline.

Buyer profiles are shifting between generations. Older patients choose clinical beverages on clinician advice and trust established brands, while younger patients with monitors care about data, personalisation, and lifestyle fit. Prediabetes buyers add a third group that wants prevention and convenience. Brands that publish glucose response data and offer app-based guidance win younger patients and keep them as conditions progress.
low-glycemic-clinical-beverage-market-end-use-penetration-index-1789807503883

MMA Verdict on Clinical Beverage Strategy

These are among the four positions where our research anticipates prominent divergence between winners and laggards over the coming forecast period. Each is grounded in the demand model, the regulatory perimeter, and the announced capacity pipeline.
01 / PERSONALISED GLYCEMIC POSITIONING

Link Formulas to Glucose Monitor Data Before Generic Supplements Lose Pricing Power

Personalised and monitor-guided beverages grow at 13.0% a year, about 1.67 times the overall market rate, and brands that link formulas to continuous glucose monitor data earn gross margins of 44% to 58% against 30% to 40% for standard diabetes-specific drinks. Winners will invest in clinical trials that show glucose response, data partnerships with monitor makers, and subscription models that convert insight into repeat purchase. Brands that sell generic formulas will face price pressure from payers, and rivals with proven personalised programmes will take the highest-value patients.
02 / CLINICAL EVIDENCE DISCIPLINE

Fund Trials and Register Early Before Regulators Restrict Unsupported Glycemic Claims

Medical food and special medical purpose rules in the United States, the European Union, and China require documented evidence and registrations that take about 24 months, and glycemic claims fail without controlled trials on glucose response. Brands should fund randomised crossover trials, register formulas early in each market, and keep claim language within approved wording. Those that market glycemic benefits without evidence will face regulator action and payer rejection, and rivals with published data will win formulary and hospital contracts as scrutiny rises.
03 / PAYER ACCESS STRATEGY

Build Reimbursement Pathways Before Out-of-Pocket Churn Caps Clinical Beverage Volume

Only about 24% of volume is reimbursed by insurers or health systems, and coverage varies widely by country, so brands without payer strategy depend on out-of-pocket buyers who churn within three months. Brands should build health economics evidence, pursue coverage for defined patient groups, and partner with hospitals and diabetes clinics for prescription pathways. Those that rely on retail purchase alone will cap volume, and rivals with reimbursement and clinical channels will lock in the steadier, higher-adherence patients over the next decade.
04 / ADHERENCE AND INPUT DISCIPLINE

Fix Taste Fatigue and Lock Protein Supply Before Churn Erodes Margin

Patients stop drinking clinical beverages within eight weeks when taste and sweetness fatigue set in, and protein and slow-release carbohydrates take about 38% of cost of goods, so adherence and cost both erode margin. Brands should build flavour rotation, use isomaltulose and fibre blends that hold taste, and sign multi-year protein and carbohydrate contracts. Those that ignore adherence will see churn above 50%, and rivals with better taste and stable input supply will hold the patients who stay on therapy for years.

Engagement Snapshot From the Field

A live engagement with an industry participant carrying material or product regulatory and market exposure ahead of a defining policy shift, showing how our research translates into a defensible multi-year portfolio strategy.
MARKET MINDS ADVISORY · CLIENT ENGAGEMENT SUMMARY
Low-Glycemic Clinical Beverage Producer Strategic Portfolio Review and Transition Roadmap 2026·Investment Scenario on Low-Glycemic Clinical Beverage Exposure Evaluation 2025-26
CLIENT PROFILE
The client is a mid-sized Southeast Asian clinical nutrition company with annual sales near $190 million (client-reported, unverified by MMA), a portfolio of adult oral nutrition supplements and a basic diabetes-specific drink sold through hospitals, pharmacies, and distributors in five countries. It had no personalised range, limited trial evidence, and low reimbursement coverage. Hospital teams review suppliers every year.
STRATEGIC CHALLENGE
Diabetes-specific sales were flat, a multinational rival had launched a monitor-linked programme, and patients were quitting within two months. Management needed to decide whether to fund trials, build a personalised programme, or pursue hospital tenders, with limited capital and only one plant able to run slow-release formulas. Trial data protects future sales.
MMA APPROACH
MMA analysed sales and channel data across 22 products, interviewed 12 dietitians, eight hospital procurement heads, and six ingredient suppliers, and ran a patient survey on taste, adherence, and price across three countries. It modelled margin by product and channel, tested regulatory and input scenarios, and ranked options by payback period and execution risk.
KEY FINDINGS
  1. A slow-release formula with a published crossover trial could support premium pricing 25% above the current drink and win two hospital tenders (client-reported, unverified by MMA).
  2. A subscription programme with flavour rotation could lift 12-week retention from 38% to about 58% and reduce churn. Cost control separates leaders from followers.
  3. Multi-year protein and isomaltulose contracts covering 65% of volume could cut cost volatility by about half. Clear labelling builds patient trust. Small formulators feel every registration delay.
  4. A monitor partnership with a regional device maker could add 8% of sales through personalised guidance within two years. Clinical reach compounds over time.
CLIENT PROFILE
The client is a mid-sized Southeast Asian clinical nutrition company with annual sales near $190 million (client-reported, unverified by MMA), a portfolio of adult oral nutrition supplements and a basic diabetes-specific drink sold through hospitals, pharmacies, and distributors in five countries. It had no personalised range, limited trial evidence, and low reimbursement coverage. Hospital teams review suppliers every year.
STRATEGIC CHALLENGE
Diabetes-specific sales were flat, a multinational rival had launched a monitor-linked programme, and patients were quitting within two months. Management needed to decide whether to fund trials, build a personalised programme, or pursue hospital tenders, with limited capital and only one plant able to run slow-release formulas. Trial data protects future sales.
MMA APPROACH
MMA analysed sales and channel data across 22 products, interviewed 12 dietitians, eight hospital procurement heads, and six ingredient suppliers, and ran a patient survey on taste, adherence, and price across three countries. It modelled margin by product and channel, tested regulatory and input scenarios, and ranked options by payback period and execution risk.
KEY FINDINGS
  1. A slow-release formula with a published crossover trial could support premium pricing 25% above the current drink and win two hospital tenders (client-reported, unverified by MMA).
  2. A subscription programme with flavour rotation could lift 12-week retention from 38% to about 58% and reduce churn. Cost control separates leaders from followers.
  3. Multi-year protein and isomaltulose contracts covering 65% of volume could cut cost volatility by about half. Clear labelling builds patient trust. Small formulators feel every registration delay.
  4. A monitor partnership with a regional device maker could add 8% of sales through personalised guidance within two years. Clinical reach compounds over time.
RECOMMENDED STRATEGY
Phase 1: Phase 1 (Months 1-6): Sign protein and isomaltulose contracts, commission the crossover trial, and design the flavour rotation. Buyers reward consistency over novelty. Phase 2: Phase 2 (Months 7-18): Launch the slow-release formula and subscription programme, and bid for two hospital tenders with trial data. Formulary decisions decide renewal. Phase 3: Phase 3 (Months 19-30): Add the monitor partnership, extend registrations to two further countries, and review retention quarterly. Clinical evidence decides brand rankings.
OUTCOME
Within 30 months, slow-release and personalised products reached 22% of sales, 12-week retention rose to 57%, and gross margin on the range rose to 46% (client-reported, unverified by MMA). The client won three hospital tenders, launched the monitor partnership, and clinicians named its formula a preferred option for adherent patients.

Frequently Asked Questions

Foundational context covering the market sizes, CAGR, scope, country, region and competition that inform every finding below. This section is provided to cover basics and most often pre-purchase conversations, answered from the MMA Primary Research Dataset.

What is the current size of the Low-Glycemic Clinical Beverage Market?

The global low-glycemic clinical beverage market was valued at $4.4 billion in 2025. Growth is supported by diabetes prevalence, glucose monitoring, and hospital nutrition programmes despite evidence burdens and reimbursement gaps.

How large will the Low-Glycemic Clinical Beverage Market be by 2036?

The market is projected to reach $10.1 billion by 2036, up from $4.7 billion in 2026. The increase of $5.3 billion reflects personalised drinks, slow-release formulas, and emerging market diabetes growth.

What is the CAGR for the Low-Glycemic Clinical Beverage Market 2026 to 2036?

The market is forecast to grow at a 7.8% CAGR from 2026 to 2036. The bull case reaches 9.1% and the bear case 6.5%, depending on reimbursement and claim rules.

Which segment is growing fastest?

Personalised and CGM-Guided Beverages is the fastest-growing segment at 13.0% CAGR, roughly 1.67 times the overall market rate. Pre-Meal Glycemic Shots and Drinks follows as the second-fastest segment at 10.4% CAGR each year.

Who are the major companies in the Low-Glycemic Clinical Beverage Market?

Major companies include Abbott Laboratories, Nestlé Health Science, Danone Nutricia, Fresenius Kabi, and Meiji Holdings. Ajinomoto, Otsuka Holdings, Kate Farms, Herbalife Nutrition, and Zydus Wellness also hold meaningful positions.

Which country is growing fastest?

India is the fastest-growing country at an 11.2% CAGR, driven by rapidly rising diabetes prevalence, expanding pharmacy networks, and private hospital demand. China and Indonesia follow through large patient populations and special medical purpose formula registrations.

Report Segmentation Architecture

The full report scope spans multiple orthogonal segmentation dimensions, with cross-tabulated demand data provided for each dimension pair. Coverage extends further to regional breakdowns, trend trajectories, and the competitive detail needed to support segment-level decision-making.

By Primary Market Dimension

  • Personalised and CGM-Guided Beverages
  • Pre-Meal Glycemic Shots and Drinks
  • Slow-Release Carbohydrate Meal Replacement Drinks
  • Diabetes-Specific Oral Nutrition Supplements
  • Powder-to-Drink Clinical Mixes

By End-Use Industry

  • Type Two Diabetes Management
  • Type One Diabetes Support
  • Prediabetes and Prevention
  • Hospital and Nursing Home Nutrition
  • Older Adult Malnutrition Care

By Commercial Dimension

  • Hospitals and Clinics
  • Pharmacies and Drugstores
  • Reimbursed Prescription Channels
  • Online and Subscription
  • Retail and Health Stores

By Region

  • North America
  • East Asia
  • Western Europe
  • South Asia and Pacific
  • Latin America
  • Middle East and Africa
  • Eastern Europe

Scope, Methodology, and Coverage

Every figure in this report is reproducible from documented input assumptions. The scope below maps the historical period, the forecast horizon, the segmentation dimensions, and the countries covered, alongside the underlying primary and qualitative methodology.
Historical Period
2020 to 2025
Forecast Period
2026 to 2036
Base Year
2025 (USD billions; MMA Primary Research Dataset, September 2026)
Market Definition
Low-glycemic clinical beverages comprise ready-to-drink and powder-to-drink nutrition beverages formulated to moderate post-meal glucose response, used under clinical or dietitian guidance for diabetes, prediabetes, and related metabolic conditions, including diabetes-specific oral nutrition supplements, slow-release carbohydrate drinks, pre-meal glycemic shots, personalised drinks, and clinical mixes, sold through hospitals, pharmacies, reimbursed channels, and online. The scope excludes general wellness and sports drinks, enteral tube feeds, insulin and drugs, and infant formula.
Quantitative Units
USD billions (sales value); million litres for volume references
Segmentation Dimensions
By Product Type; By Patient Group; By Commercial Dimension; By Region
Regions Covered
North America, East Asia, Western Europe, South Asia and Pacific, Latin America, Middle East and Africa, Eastern Europe
Countries Covered
United States, Canada, Germany, France, United Kingdom, Italy, Spain, Poland, China, Japan, South Korea, India, Australia, Indonesia, Brazil, Mexico, Saudi Arabia, South Africa, and additional markets relevant to this sector
Key Companies Profiled
Abbott Laboratories, Nestlé Health Science, Danone Nutricia, Fresenius Kabi, Meiji Holdings, Ajinomoto, Otsuka Holdings, Kate Farms, Herbalife Nutrition, Reckitt Benckiser, Baxter International, B. Braun, Hormel Health Labs, Zydus Wellness, Nutrifood, Morinaga Milk Industry, Glanbia Nutritionals, Kerry Group, Beneo, Suntory Wellness
Quantitative Methodology
Primary survey, n=3,800 respondents, Q4 2025, six countries; demand-side model with trade association cross-validation
Qualitative Methodology
47 expert interviews, Q4 2025; applied to validate demand model assumptions, identify emerging dynamics, and assess competitive positioning
Report Format
PDF and XLSX data workbook (Word format preview document)
Publisher
Market Minds Advisory
Report Code
MMA-2026-HLT-441
Published
September 2026
Contact
sales@marketmindsadvisory.com | www.marketmindsadvisory.com

Purchase the full Low-Glycemic Clinical Beverage Market Report (2026 to 2036).

The full report delivers a detailed assessment of global low-glycemic clinical beverages through 2036, covering segment, regional, and country forecasts, competitive benchmarking of leading suppliers, and input cost analysis. It combines MMA primary research, including a six-country survey of 3,800 respondents and 47 expert interviews, with public regulatory and company data. Analysts also model reimbursement scenarios, protein cost paths, and monitor-linked adoption. Clients receive segment margin ranges, channel maps, and a case study on product strategy. Hospital and payer contact frameworks are also included for negotiation planning.
Ten-year segment and regional demand forecasts
Protein, isomaltulose, and packaging price tracking
Competitive benchmarking of top twenty clinical nutrition suppliers
Medical food and claim rule tracker updates
Regional demand mechanism comparative analysis included
Quarterly primary survey data update access

Built For The People Who Decide

From boardroom strategy to bench-side execution, this report is read cover-to-cover by leaders shaping the next decade of their industry, turning demand scenarios, market dynamics and valuation benchmarks into decisions.
CXOs/ Presidents/ VPs/ Managers
M&A and Corporate Development
Strategy Teams and R&D Heads
Procurement and Product Directors
Regulatory and Compliance Leaders
Investor Relations and Equity Analysts