Market Minds Advisory
Low-Calorie Snack Foods Market

Low-Calorie Snack Foods Market: Low-Calorie Snack Foods Market: Protein Positioning, Process Rather Than Substitution, And Portion Formats That Do The Work

Selling less of something has never worked well in snacking, which is why the products that succeeded stopped counting calories down and started counting protein up on the front of the pack.

Lead Analyst

Lisa Gevelber

Published

September 2026

Make Smarter Decisions with Customized Research Insights

Request a free sample report and evaluate market opportunities, growth trends, and competitive dynamics relevant to your business needs.

2025 MARKET VALUE$18.0BMarket Size 2025
2036 FORECAST VALUE$46.4BBase Case , 2026 to 2036
CAGR 2026 TO 20369.0 %Bull 10.2% / Bear 7.8%
INCREMENTAL OPPORTUNITY$26.8BNet 10- year value creation
EXPANSION MULTIPLE2.37x2036 value over 2026 base
Strategic Levers
M&A Pipeline
Regional Outlook
Country Rankings
Competitive Intelligence
Segmental Deep-dive
Call-Us : 91 93563 13602

Executive Snapshot and Market Trajectory.

Selling less of something has never worked well in snacking, because people buy snacks as a small reward rather than as nutrition. The products that finally succeeded stopped counting calories down and started counting protein up, which reaches an entirely different buyer. Nobody was waiting for that.
High-protein savoury snacks carry the growth on exactly that reframing, since a protein number is an addition and reaches somebody who was not trying to eat less. Air-popped and baked formats grow nearly as fast by reaching low calorie density through process rather than ingredient substitution. North America holds the largest share on better-for-you snacking retail that developed here earlier and further than anywhere else. That shift did the work.
Concentration reads at 31% for the top five, low because the category was built by specialist brands while large snack companies treated calorie reduction as a line extension. Portion-controlled formats do more of the nutritional work than formulation does, which is an uncomfortable truth for anybody who spent development budget reformulating a recipe instead. That is uncomfortable for anybody who spent a development budget reformulating a recipe instead. Bag size was always the cheaper answer.
Market Definition
This market covers packaged snack products positioned and formulated for reduced calorie content, spanning high-protein savoury snacks, air-popped and baked formats, portion-controlled packs, fibre-enriched snacks, and reduced-fat and reduced-sugar reformulations. Conventional snacks without calorie positioning, meal replacement products, confectionery not sold as a snack format, fresh produce, and dietary supplements are excluded from the sizing.
Base Year Value
$18.0B in 2025 (MMA Primary Research Dataset, August 2026)
Forecast Period
2026 to 2036, eleven discrete annual values
CAGR
9.0% base case. Bull 10.2%. Bear 7.8%.
Fastest Growth Segment
High-Protein Savoury Snacks: 13.5% CAGR
Fastest Growth Country
India: 12.8% CAGR
Fastest Growth Region
South Asia and Pacific: 11.3% CAGR
Largest Region
North America: 32% of 2025 global value
Market Leaders
PepsiCo, Mondelez International, General Mills, Kellanova and Simply Good Foods lead on low-calorie snack revenue. Source: MMA Primary Research Dataset, July 2026.
Primary Survey
n=3,800 procurement and R&D decision-makers, Q4 2025, six countries
Methodology
Demand-side build-up, cross-validated against public data, 47 expert interviews

Low-Calorie Snack Foods Market Forecast Scenarios

low-calorie-snack-foods-market-trends-size-forecast-scenario-1787457983205
Growth ran at 7.9% annually between 2020 and 2025, and the category changed character completely partway through. Early volume came from reduced-fat and reduced-sugar reformulations of conventional snacks, which sold poorly because they tasted like compromised versions of products people already liked. Protein positioning replaced that framing, and the growth which followed came from a different buyer entirely.
The base case at 9.0% rests on three mechanisms. Protein positioning continues converting the category from a subtraction proposition into an addition one, reaching consumers who were never counting calories. Process-based formats keep taking share because removing oil by not frying requires no unfamiliar ingredient on a declaration. And Indian and Southeast Asian packaged snacking expands quickly as organised retail displaces traditional preparation across urban markets. None of the three requires a technical breakthrough.
The bull case at 10.2% turns on weight management pharmacotherapy driving structured smaller-portion eating, which would suit portion-controlled formats considerably better than conventional snacking. The bear case at 7.8% reflects those same medicines suppressing snacking demand altogether, since a consumer eating meaningfully less does not necessarily substitute toward a lower-calorie snack at all. Both hinge on how those medicines actually change eating.

Addition Sells Where Subtraction Never Did

The commercial history of this category is a long argument about framing. Reduced-fat and reduced-sugar reformulations of conventional snacks sold badly for twenty years, because they asked a consumer to accept a worse version of something they already enjoyed in exchange for a benefit they could not taste. Protein positioning changed that completely by selling an addition instead.
TOP FIVE CONCENTRATION31%Low, with specialist brands holding positions large companies missed
PRICE PREMIUM47%Advantage over comparable conventional snack products at retail
PROTEIN POSITIONED SHARE39%Portion of value in products leading on protein content
PORTION PACK SHARE34%Portion of volume sold in individually portioned pack formats
REPEAT PURCHASE RATE52%Consumers repurchasing within three months of first trial
INGREDIENT COST SHARE41% of COGSIngredient contribution to finished product manufactured cost overall
A protein number on the front of a pack is a nutrition declaration statable plainly, it reaches a buyer who is adding something to their diet rather than removing it, and roughly 39% of category value now carries that positioning. Premiums near 47% hold at retail on that basis, which reduced-fat framing never sustained across any comparable period. The framing did the work rather than the recipe.
Portion control does more of the nutritional work than formulation does, which is an uncomfortable finding for anybody who spent development money reformulating instead. Roughly 34% of volume now sells in individually portioned formats, where the calorie count is managed by how much is in the bag rather than by what went into the recipe, and eating quality can therefore be prioritised properly.
"The industry spent two decades making worse versions of good snacks and wondering why nobody repeated. Then somebody printed a protein number on the front and put less in the bag, and both of those worked immediately."
Director, Packaged Food and Snacking Practice · MMA Packaged Food Practice · August 2026

Market Trends

Protein Positioning Replaces Calorie Reduction As The Argument

Reduced-fat and reduced-sugar reformulations asked consumers to accept worse versions of snacks they already enjoyed in exchange for a benefit they could not taste, which failed for twenty years with remarkable consistency. A protein number is a nutrition declaration statable plainly and reaches a buyer adding something rather than removing it. Roughly 39% of category value now carries protein positioning and premiums near 47% hold on that basis, which calorie framing never once sustained. Reformulation was never the problem; the argument being made about it was. Calorie framing never once sustained a premium anywhere.
Market Impact: Segment grows at 11.5% annually

Portion Formats Do More Nutritional Work Than Formulation

Managing calorie count by how much is in the bag rather than by what went into the recipe frees formulation to prioritise eating quality, which is the single thing this category historically got wrong. Roughly 34% of volume now sells in individually portioned packs. The finding is uncomfortable for anybody who spent development budget reformulating instead, and it explains why several specialist brands with unremarkable recipes outperformed technically superior products from larger companies. Development cost is packaging and line configuration rather than any food science at all. Eating quality was always the missing ingredient here.
Market Impact: India grows at 12.8% annually

Market Opportunities and Growth Drivers

Process-Based Calorie Reduction Avoids Declaration Problems Entirely

Air-popping, extruding and baking reach low calorie density by not adding oil, which is straightforward arithmetic requiring no reformulation cleverness and no unfamiliar ingredient appearing on a declaration. That matters because consumers who read ingredient lists react badly to long ones, and reduced-fat formulations frequently needed several ingredients to replace what fat was doing. The route is technically simpler and commercially more durable. Seasoning systems then carry the flavour work that frying would otherwise have done. Doing that well is genuinely difficult and separates the good products from the rest.
Market Impact: Cuts snacking occasions 22% among users

Indian Packaged Snacking Displaces Traditional Preparation Quickly

Indian urban snacking has historically run through local unbranded producers and home preparation, and organised retail is displacing that steadily with packaged product carrying nutrition labelling for the first time. Indian demand grows near 12.8% annually as a result. Better-for-you positioning converts unusually well among younger urban consumers who read panels in ways earlier generations did not. Domestic manufacturers formulate for regional taste preferences rather than importing Western products unchanged. Savoury preferences matter considerably here and Western formulations frequently travel badly. Packaged snacking penetration is still rising quickly from a genuinely low base.
Market Impact: Caps inclusion near 20% protein

Market Restraints and Challenges

Weight Management Medicines Cut Snacking Demand Rather Than Redirect It

Consumers taking appetite-suppressing medicines eat meaningfully less and do not reliably substitute toward a lower-calorie snack, which is a genuinely different outcome from the trade-across this category had assumed would happen. The root cause is that suppressed appetite removes the occasion rather than changing what fills it. Commercially this threatens volume in exactly the demographic that buys most heavily. Participants are responding with protein and satiety positioning, smaller portion formats, and nutrient density rather than calorie messaging. The heaviest-buying demographic is exactly the one taking them. Nutrient density messaging is the emerging response.
Market Impact: Protein positioning covers 39% of value

Texture Difficulty Limits How Far Protein Content Can Rise

Protein isolates toughen and dry a snack matrix considerably, and the difficulty compounds as inclusion rises, which caps how far a manufacturer can push the number on the front of the pack. The root cause is physical rather than formulation error, since protein behaves differently from starch under extrusion and baking. Commercially this limits differentiation once competitors reach similar levels. Participants are responding with protein blending, texturisation processes, and hydration systems that soften the matrix. Blending protein sources helps and adds formulation work for each ratio. Differentiation narrows once competitors reach similar levels.
Market Impact: Portion packs hold 34% of volume
3 additional market trends, 4 additional growth drivers, and 2 additional restraints and challenges are covered in the full report. Contact sales@marketmindsadvisory.com to access the complete intelligence.

Segment CAGR and Growth Architecture

Five product categories divide this market on how calorie reduction is actually achieved rather than on the snack type or flavour. That reflects where the commercial difference genuinely sits, since reaching a calorie target through process, through portion size or through ingredient substitution produces entirely different products, cost structures and consumer responses. Route decides the whole product.
low-calorie-snack-foods-market-trends-market-share-analysis-1787457983739

High-Protein Savoury Snacks

Growing at 13.5% and the fastest part of this market. High-protein savoury snacks succeed where low-calorie positioning has usually failed, because they sell an addition rather than a subtraction and a protein number on the front of a pack reaches a buyer who was never interested in eating less. Whey, milk and increasingly plant protein isolates carry the formulation. Extrusion and baking rather than frying keeps calories down while protein delivers satiety that the category has always struggled to provide. The technical difficulty is texture, since protein toughens and dries a snack matrix considerably, which is why so many early products in this segment were unpleasant. Texture work is what separates the good products here.
CAGR 13.5%

Air-Popped And Baked Formats

Growing at 11.5% on air-popped, extruded and baked snacks that reach low calorie density through process rather than through ingredient substitution, which is a genuinely different technical route and a more durable one. Removing oil by not frying is straightforward arithmetic that requires no reformulation cleverness and no unfamiliar ingredient on a declaration. Popped chips, puffed grains and baked crisps carry most of the volume. What limits the segment is that process alone cannot deliver the flavour delivery frying provides, so seasoning systems and surface application matter disproportionately and the best products in this segment are engineered around exactly that. Seasoning and surface application carry disproportionate weight. The best products are engineered around exactly that.
CAGR 11.5%
Full segment breakdown across 5 segments available in the complete report.

Regional Architecture and Country Demand Map

North America holds 32% of global value on better-for-you snacking retail that developed here earlier and further than anywhere else. East Asia follows at 23% on packaged snacking scale, while South Asia and Pacific grows fastest as organised retail displaces traditional preparation. Clean-label pressure shapes Western Europe.

North America

Note: North America sits at the top of the standard share band because better-for-you snacking retail developed here earlier and further than anywhere else, and consumers read nutrition panels as ordinary practice. Protein positioning works particularly well against a population already buying bars, shakes and fortified products without prompting. Specialist brands built genuine positions while large snack companies treated calorie reduction as a line extension, which is why concentration remains low. Portion pack formats are well established across convenience and grocery. Weight management medicines are affecting snacking occasions here before anywhere else, and manufacturers are watching that closely rather than waiting. Protein framing reaches buyers who were never counting calories at all.
Share: 32% | CAGR: 9.4% (2026 to 2036)

East Asia

Packaged snacking is enormous across this region and Japanese convenience store distribution in particular sells portioned formats at a scale nothing in the West approaches, which suits this category naturally. Japanese consumers also accept formulated products without the clean-label resistance common in Western Europe. Chinese packaged snacking has grown quickly and better-for-you positioning is developing among younger urban consumers, though protein framing is less established than in North America. Korean demand is smaller and heavily convenience-weighted. Regional taste preferences favour savoury and seaweed-based formats that Western manufacturers have generally not addressed well. Portioned formats suit convenience distribution naturally. Regional taste preferences favour savoury and seaweed formats Western manufacturers address poorly.
Share: 23% | CAGR: 10.1% (2026 to 2036)
Regional intelligence for 5 additional markets available in the complete report: Western Europe, South Asia and Pacific, Latin America, Middle East and Africa, Eastern Europe. Contact sales@marketmindsadvisory.com.
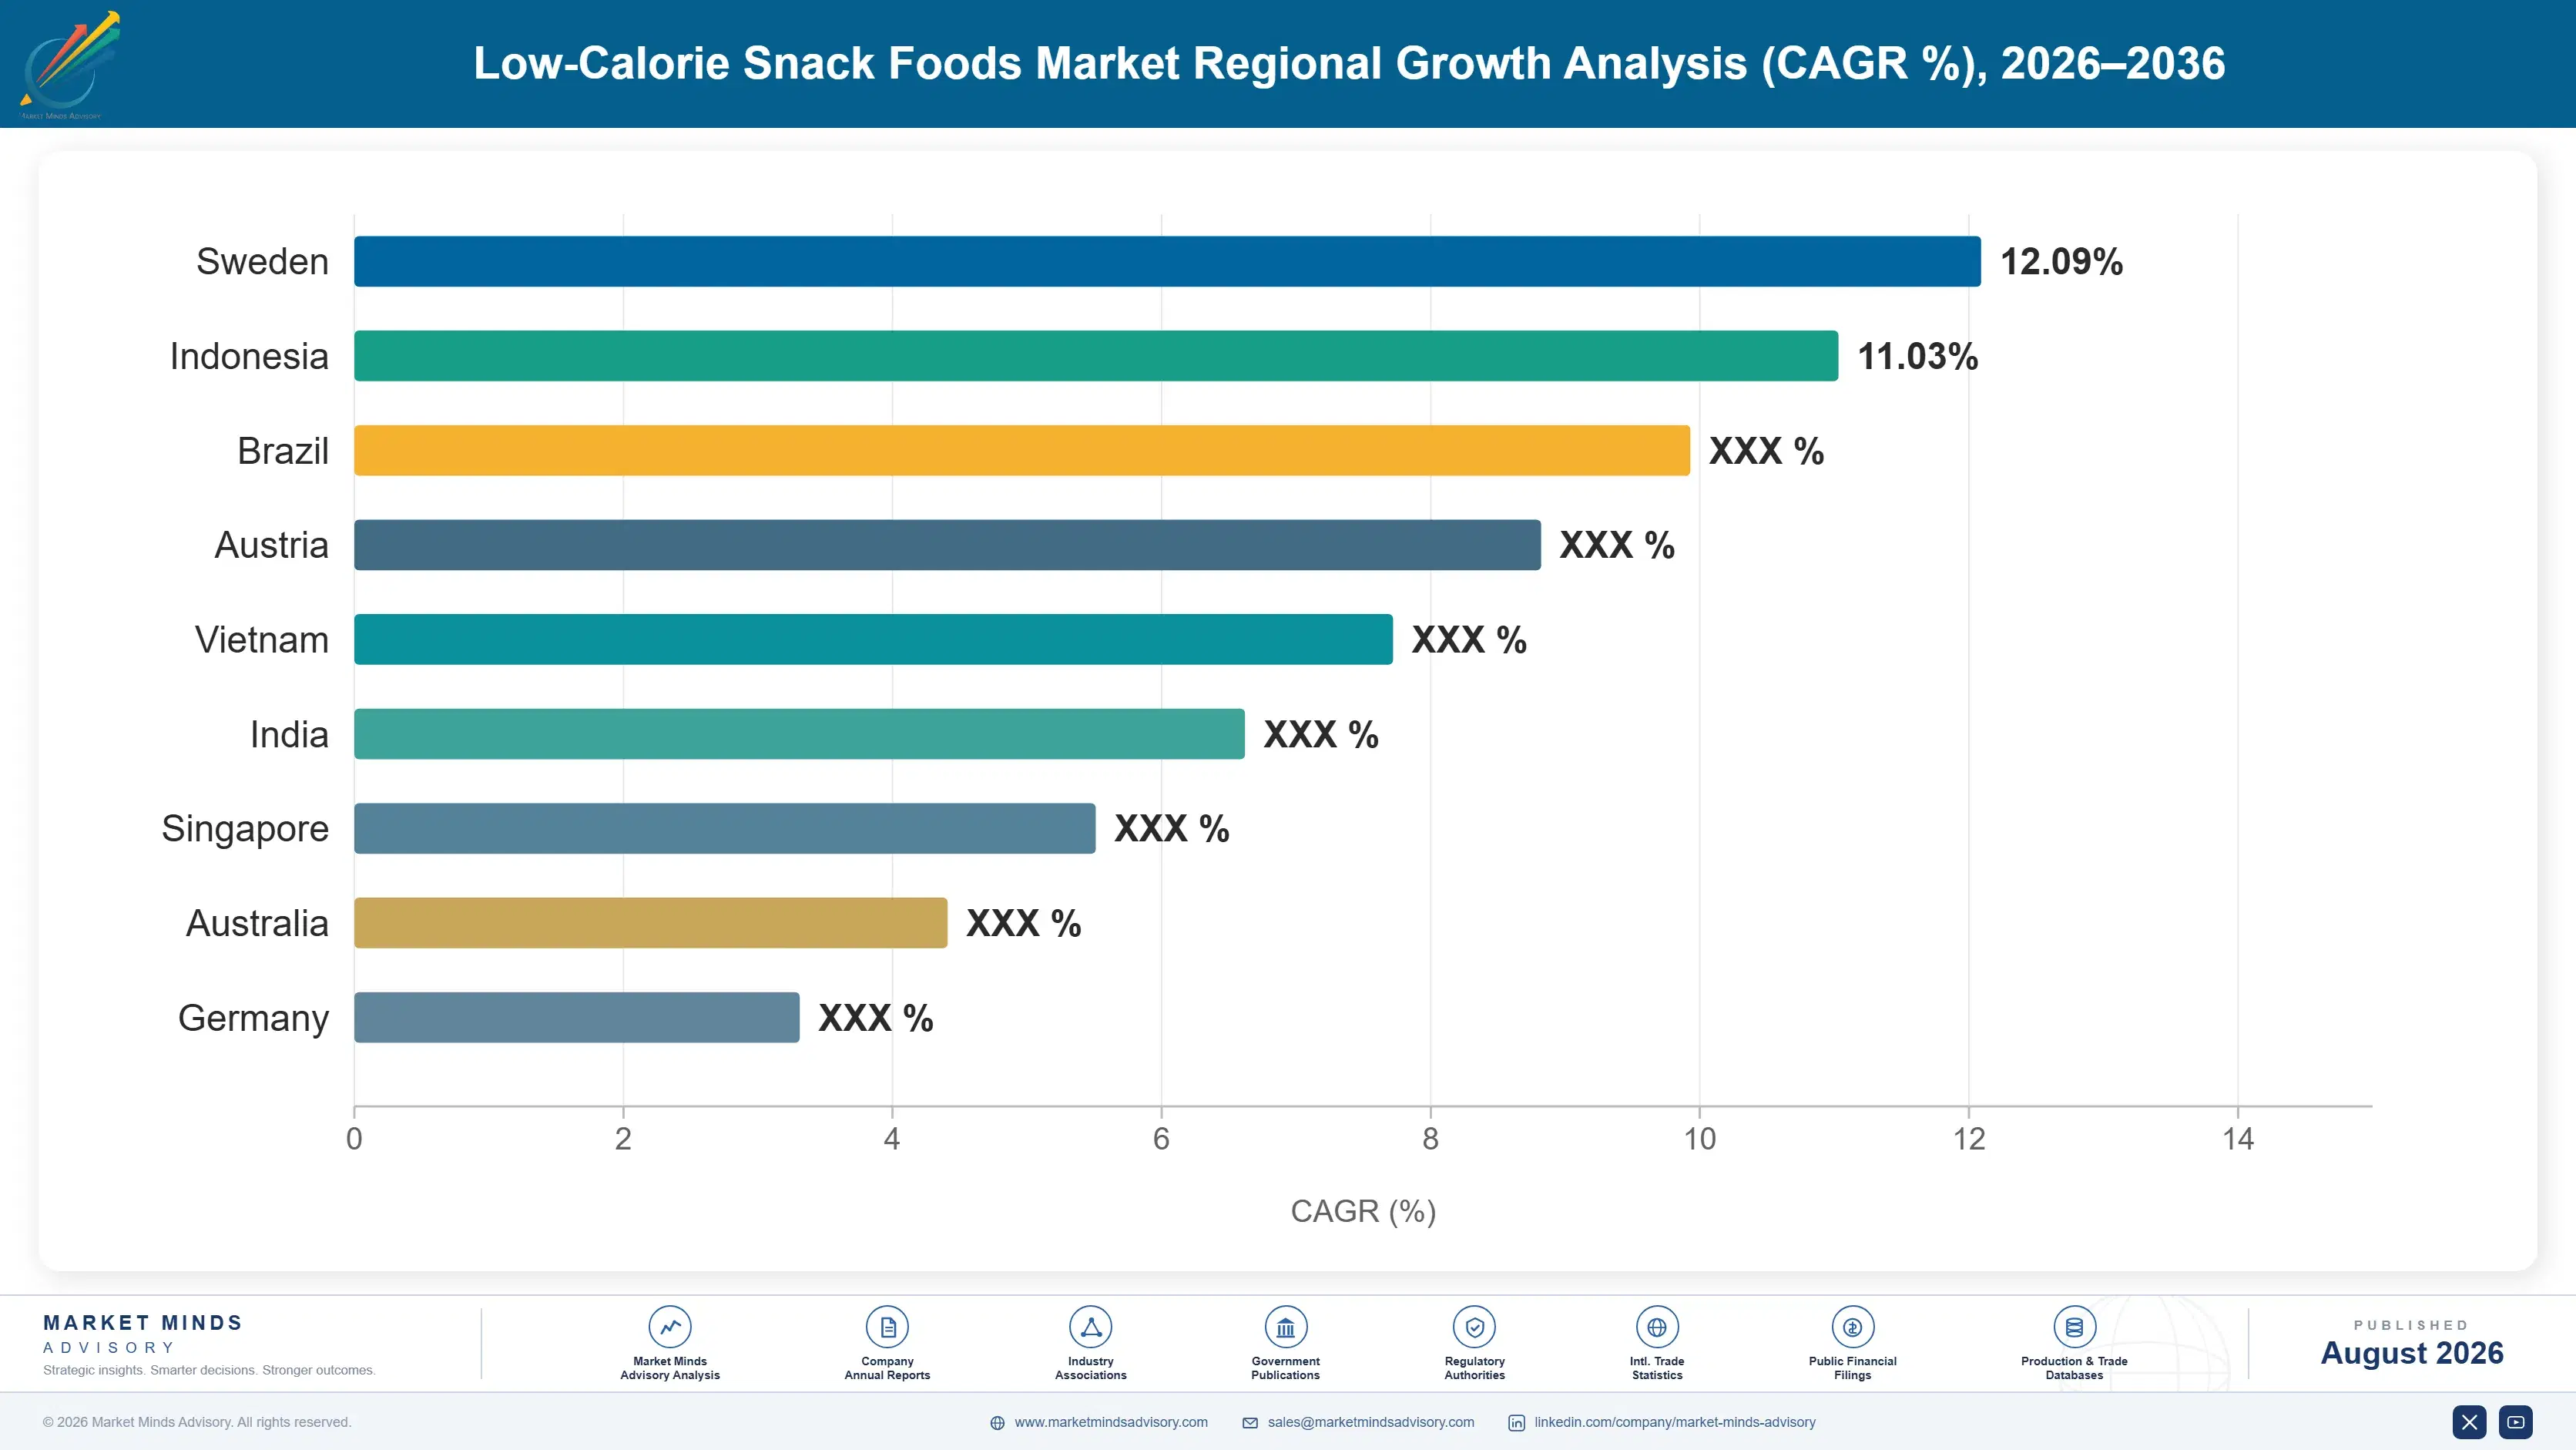
low-calorie-snack-foods-market-trends-country-cagr-analysis-1787457984252

Where Low-Calorie Snacking Margin Sits

Four positions separate brands growing in this category from those still selling a reduced-fat version of something people liked better before: leading on protein rather than reduction, using portion size instead of reformulation, reaching calorie targets through process, and preparing for appetite medicines rather than assuming they help. Only the last is outside anybody's control.

Lead On Protein Content Rather Than Calorie Reduction

A protein number is a nutrition declaration statable plainly on pack and it reaches a buyer adding something to their diet rather than removing it, which is a completely different consumer from the one calorie framing addressed. Roughly 39% of category value now carries protein positioning and premiums near 47% hold on that basis. Brands making the switch realise 30% to 40% higher realised pricing, and the reformulation required is texture work rather than anything fundamental. The buyer is simply not the same person any more. Texture work is the only real requirement.
Market Impact: Realises up to 40% higher realised shelf pricing

Use Portion Size Rather Than Reformulating The Recipe

Managing calorie count by how much sits in the bag rather than by what went into the recipe frees formulation to prioritise eating quality, which is the single thing this category historically got wrong for two decades. Portion packs already carry 34% of volume. Development cost is packaging and line configuration rather than food science, and several specialist brands with unremarkable recipes have outperformed technically superior products from far larger companies this way. Retreating to larger bags to save packaging cost undoes the whole benefit. The format itself is doing the nutritional work here.
Market Impact: Reaches the 34% of volume in portioned packs

Reach Calorie Targets Through Process Not Substitution

Air-popping, extruding and baking cut calorie density by not adding oil, which requires no reformulation cleverness and puts nothing unfamiliar on a declaration that a consumer will read and dislike. Reduced-fat formulations frequently needed several replacement ingredients to do what fat was doing. The process route grows at 11.5% annually and travels far better into clean-label markets, where the declaration itself has become a purchase consideration rather than an afterthought. Consumers who read ingredient lists react badly to long ones. Fat replacement needed several ingredients to do one job. Declarations stay short throughout.
Market Impact: Process segment grows at 11.5% annually across markets

Prepare For Appetite Medicines Rather Than Assuming Help

Consumers on appetite-suppressing medicines eat meaningfully less and do not reliably substitute toward a lower-calorie snack, which cuts snacking occasions by around 22% among users rather than redirecting them. That is a different outcome from the trade-across this category assumed. Brands repositioning toward protein, satiety and nutrient density reach that consumer where calorie messaging does not, and the ones still counting calories down are addressing a problem their buyer no longer has. Counting calories down addresses a problem that buyer no longer has. Satiety and nutrient density reach them; calorie counts do not.
Market Impact: Occasions fall by 22% among the medicine users

Who Controls the Margin Pool

Concentration reads at 31% for the top five measured on low-calorie snack revenue, the basis used throughout this section, and it is low because specialist brands built the category while large companies treated calorie reduction as a line extension. PepsiCo and Mondelez hold scale and distribution. General Mills and Kellanova bring better-for-you brand portfolios, and Simply Good Foods holds a genuinely protein-led position.
Competition runs on three fronts. Protein formulation capability is the first and it separates brands selling an addition from those still selling a subtraction. Portion format and packaging capability is the second, and it does more nutritional work than formulation does. Process capability is the third, since air-popping and baking reach calorie targets without touching a declaration. None of the three is a promotional argument.

Pressure arrives from two directions. Appetite-suppressing medicines are cutting snacking occasions rather than redirecting them, which threatens volume in the heaviest-buying demographic. Separately, retailer private label has developed better-for-you ranges quickly. Rankings will shift toward brands holding protein formulation and portion capability together rather than those defending reformulated conventional products. Reformulated conventional product is the weakest position available.
low-calorie-snack-foods-market-trends-company-positioning-matrix-1787457984771

Competitive Moat and Risk Dimensions

PEPSICO

Moat: Distribution reach and scale

Direct store delivery and shelf relationships across grocery, convenience and foodservice put products in front of consumers at a frequency and breadth that specialist brands cannot construct at any spend. Manufacturing scale also absorbs the protein isolate and packaging cost that better-for-you formats carry above conventional snack lines without needing premium pricing to justify it.
PEPSICO

Risk: Conventional portfolio cannibalisation

Better-for-you volume displaces conventional snacks the group also sells at higher volume and frequently better margin, which limits how hard the category can be pushed internally. Appetite-suppressing medicines also threaten the heaviest-buying consumers across the whole portfolio rather than only in the reduced-calorie part of it.
SIMPLY GOOD FOODS

Moat: Protein-led brand credibility

Brand positions built explicitly around protein and satiety rather than around calorie reduction give the business credibility with buyers who were never counting calories, which is exactly where category growth now comes from. Formulation experience in texturising high-protein matrices also addresses the technical difficulty that has limited how far competitors can push inclusion levels.
SIMPLY GOOD FOODS

Risk: Narrow category and channel base

Concentration in protein-led better-for-you products leaves the business exposed to any shift in consumer positioning preference and to appetite medicines reducing snacking occasions generally. Scale against large snack groups also limits distribution reach and the ability to absorb ingredient cost movement without adjusting shelf pricing.

Players Tracked

Prominent Players

PepsiCo
Mondelez International
General Mills
Kellanova
Simply Good Foods

Other Key Players

Nestlé
Campbell Soup Company
Utz Brands
Hain Celestial
Nutrisystem
Quest Nutrition
Halo Top
Skinny Pop
Popcorners
Biena Snacks
Britannia Industries
ITC Limited
Calbee
Want Want China
Orion Corporation

Recent Developments

MARCH 2025

Protein snack range repositioned away from calorie messaging entirely

A snack manufacturer repositioned an established reduced-calorie range around protein content and satiety rather than calorie reduction, changing front-of-pack messaging without altering the underlying formulation and reaching a consumer group the previous framing had never addressed. Realised pricing rose without any recipe change at all.
Signal: Repositioning reaches buyers that reformulation never did, and it costs almost nothing at all to attempt
JULY 2025

Portion pack capacity expanded across better-for-you snack lines

A packaged food company expanded individually portioned packaging capacity across its better-for-you snack lines, managing calorie count through pack size rather than recipe and freeing formulation teams to prioritise eating quality instead. Repeat purchase rose measurably across the converted lines. Formulation teams were redirected toward taste.
Signal: Portion control does more nutritional work than formulation does, which several product developers found genuinely uncomfortable
NOVEMBER 2025

Snacking occasion data shows medicine users reducing rather than substituting

Consumption research covering appetite-suppressing medicine users showed snacking occasions falling substantially rather than shifting toward lower-calorie alternatives, contradicting the trade-across assumption that manufacturers across the category had been planning around. Manufacturers across the category had been planning around the opposite outcome entirely. Positioning is being revised accordingly.
Signal: Suppressed appetite removes the snacking occasion entirely rather than changing whatever it is that fills it

What Drives Better-For-You Snack Cost

Ingredients account for roughly 41% of manufactured cost, with whey, milk and plant protein isolates the largest line in protein-positioned products and considerably more expensive than the starches they partly displace. Packaging adds around 19%, which is high because portioned formats multiply pack count per kilogram sold. Manufacturing energy and labour reach roughly 17%, distribution close to 14%, and quality and documentation near 9%.
Whey and milk protein isolate pricing rose sharply through 2022 and 2023 on dairy herd contraction and competing sports nutrition demand, with United States Department of Agriculture dairy data showing the underlying movement, and better-for-you snack manufacturers absorbed much of it where retail pricing offered no headroom. Baking and extrusion energy costs rose in parallel across European operations. Retail pricing offered very little headroom. Absorption was the only option.

The disadvantage mechanism is packaging cost multiplied by portion count, and it falls specifically on the format that does most of the nutritional work. A portioned range sells the same tonnage across several times as many packs, which raises material and filling cost per kilogram considerably. Exposure varies by format, since process-based products in standard bags avoid that entirely while protein products carry ingredient cost instead.
low-calorie-snack-foods-market-trends-cost-volatility-analysis-1787457984965

Contract protein isolate supply on annual committed volume

Whey and milk isolates are the largest ingredient line in protein-positioned products and price on dairy markets that sports nutrition demand moves far more than snacking does. Annual committed volume secures predictable cost and allocation through the tightness that periodically follows herd contraction. The commitment carries volume risk if demand softens, which is the honest price of predictability.

Optimise portion pack material rather than abandoning the format

Portioned formats multiply pack count per kilogram and packaging runs near 19% of manufactured cost as a result, which tempts manufacturers back toward larger bags that undo the nutritional benefit entirely. Thinner films, right-sized packs and multipack outer configuration recover much of that cost. The format is doing the work here, so retreating from it to save packaging is counterproductive.

Blend protein sources to manage cost and texture together

Dairy and plant isolates price on entirely different agricultural dynamics and behave differently under extrusion, and blending manages cost exposure and matrix texture at the same time rather than trading one against the other. Formulation work is required for each blend ratio and process. The result is less exposure to any single protein market and frequently a better eating experience.

Portfolio Architecture for Margin Defence

Portfolio economics here divide on positioning and format rather than on recipe. Reduced-fat and reduced-sugar reformulations of conventional snacks are the weakest position in the category, because they ask a consumer to accept a worse version of something they liked in exchange for a benefit they cannot taste at all. Repeat purchase was always the problem there.
The middle tier is process-based product reaching calorie targets by not adding oil. Air-popping and baking put nothing unfamiliar on a declaration, which matters increasingly as consumers read ingredient lists, and margins reach the high twenties. Seasoning systems carry the flavour work frying would otherwise have done, and doing that well is genuinely difficult. Declaration length is itself a purchase consideration now.

Above both sits protein-positioned product in portioned formats. Protein sells an addition rather than a subtraction and reaches a buyer who was never counting calories, portion size manages the nutritional work so formulation can prioritise taste, and margins reach the low forties. The combination requires texture capability and packaging investment together, which is why so few brands hold both. Very few brands hold both capabilities together.

Volume / Commodity-Adjacent

Reduced-fat and reduced-sugar reformulations of conventional snacks. The range reflects promotional depth and ingredient cost rather than commercial skill, and repeat purchase has always been the problem here. Private label matches it exactly.
Gross Margin: 17 to 25%

Premium / Certified

Process-based products reaching calorie targets through air-popping, extrusion or baking. The range reflects seasoning system quality, which carries the flavour work that frying would otherwise have delivered. Declarations stay short throughout.
Gross Margin: 26 to 34%

Sustainability / Regulatory / Next-Generation

Protein-positioned products in individually portioned pack formats. The wide range reflects protein inclusion cost against realised pricing and how well texture has been managed at higher inclusion levels. Both capabilities are needed together.
Gross Margin: 38 to 47%
low-calorie-snack-foods-market-trends-portfolio-architecture-1787457985467

High-value Sub-segments and Strategic Watch-out

Protein-Positioned Portioned Products

High value and high growth together, selling an addition to a buyer who was never counting calories. The wide range reflects protein inclusion cost against realised pricing and how well texture has been managed at higher levels. Packaging investment accompanies the formulation work. Both are needed together.
Gross Margin: 38 to 47%

High-Protein Savoury Snack Ranges

High value on the fastest growth in the category, reaching consumers that calorie framing never addressed at all. The range reflects isolate cost against shelf pricing, which dairy markets move more than snacking demand ever does. Texture caps how far inclusion can rise. Dairy markets move that cost.
Gross Margin: 34 to 43%

Air-Popped And Baked Formats

The volume core and the route that travels best into clean-label markets, since process adds nothing to a declaration. The range reflects seasoning system quality, which has to carry flavour work that frying would otherwise deliver. Nothing unfamiliar appears on the declaration. Seasoning quality decides it.
Gross Margin: 26 to 34%

Reduced-Fat Conventional Reformulations

The strategic watch-out. Volumes remain from historical listings but repeat purchase was always poor, the framing asks for tolerance nobody gives twice, and private label matches it exactly. The range reflects promotion rather than merit. Nobody accepts that trade-off twice over. Listings are historical only.
Gross Margin: 17 to 25%

How Snacking Demand Actually Repeats

Snacking repeats on habit and impulse rather than on any considered decision, which makes eating quality decisive in a way it is not in more functional food categories. A buyer who enjoyed a pack picks it up again without thinking about the nutrition at all. One who did not stops entirely, and repeat purchase near 52% is high for better-for-you products precisely because the successful ones stopped compromising taste.
Stickiness varies sharply by positioning. Protein-led products bought as part of a fitness or satiety routine hold best, since the purchase is habitual and functional rather than indulgent. Portioned formats hold well because the pack size itself is what the consumer wanted. Process-based products hold on taste alone. Reduced-fat reformulations hold worst of all, and most never generate a second purchase at all.

The buyer profile has changed decisively. Early demand came from consumers actively restricting intake, mostly women, buying compromise products because the alternative was going without. Today's growth buyer is often male, frequently younger, adding protein rather than removing calories, and would never have picked up something labelled as reduced-fat anything at any point.
low-calorie-snack-foods-market-trends-end-use-penetration-index-1787457985954

Where To Compete And Why

These are among the four positions where our research anticipates prominent divergence between winners and laggards over the coming forecast period. Each is grounded in the demand model, the regulatory perimeter, and the announced capacity pipeline.
01 / PROTEIN POSITIONING ADOPTION

Nobody buys a subtraction twice

Reduced-fat and reduced-sugar reformulations asked consumers to accept worse versions of snacks they already enjoyed in exchange for a benefit they could not taste, and that failed consistently for twenty years. A protein number is instead a nutrition declaration statable plainly that reaches a buyer adding something to their diet. Brands making the switch realise 30% to 40% higher realised pricing, and the reformulation required is texture work rather than anything genuinely fundamental about how the product is actually made.
02 / PORTION FORMAT WEIGHTING

The bag does the nutritional work

Managing calorie count by how much sits in the bag rather than by what went into the recipe frees formulation to prioritise eating quality, which is the single thing that this whole category got wrong for two decades running. Portion packs already carry 34% of category volume and the development cost is packaging and line configuration rather than food science. Several specialist brands with entirely unremarkable recipes have outperformed technically superior products from considerably larger companies by doing exactly this.
03 / PROCESS ROUTE SELECTION

Not frying beats replacing fat

Air-popping, extruding and baking cut calorie density by not adding oil, which requires no reformulation cleverness at all and puts nothing unfamiliar on a declaration that a consumer will read and dislike on sight. Reduced-fat formulations frequently needed several replacement ingredients to do the single job that fat had been doing. The process route grows at 11.5% annually and travels considerably better into clean-label markets where the ingredient declaration is itself now a genuine purchase consideration rather than an afterthought.
04 / APPETITE MEDICINE PREPARATION

They eat less, not differently

Consumers on appetite-suppressing medicines eat meaningfully less and do not reliably substitute toward a lower-calorie snack, cutting snacking occasions by around 22% among those users rather than redirecting them anywhere useful at all. That is a completely different outcome from the trade-across this category had assumed would happen. Brands repositioning toward protein, satiety and nutrient density reach that consumer where calorie messaging simply does not any more, and brands still counting downward now address a problem their buyer no longer has.

Engagement Snapshot From the Field

A live engagement with an industry participant carrying material or product regulatory and market exposure ahead of a defining policy shift, showing how our research translates into a defensible multi-year portfolio strategy.
MARKET MINDS ADVISORY · CLIENT ENGAGEMENT SUMMARY
Low-Calorie Snack Foods Producer Strategic Portfolio Review and Transition Roadmap 2026·Investment Scenario on Low-Calorie Snack Foods Exposure Evaluation 2025-26
CLIENT PROFILE
A North American better-for-you snack manufacturer with annual revenue near $184 million (client-reported, unverified by MMA), selling reduced-fat and reduced-sugar ranges across grocery and convenience in three countries. Roughly 76% of revenue came from reformulated conventional snack products, with no protein-positioned range and portion packs across only two of its eleven separate product lines overall.
STRATEGIC CHALLENGE
Repeat purchase had sat below a third of trial for three years while protein-positioned competitors grew quickly, and private label had matched the client's reduced-fat positioning at lower shelf pricing. Management needed to decide between defending existing listings promotionally, repositioning around protein, or expanding portion pack formats across the range.
MMA APPROACH
MMA modelled contribution and repeat purchase by product and format across four years of the client's own data, benchmarked protein-positioned competitors on realised pricing and reorder behaviour, and assessed packaging investment against the format shift. Twenty-two expert interviews with retail category buyers, consumers who had abandoned the category and formulation technologists tested each route.
KEY FINDINGS
  1. Consumers who abandoned the client's products cited taste rather than any nutritional shortcoming, and almost none had noticed the reduced-fat claim the entire range was built around.
  2. Protein-positioned competitors realised roughly 36% higher shelf pricing on products with comparable calorie content, and their repeat purchase ran at nearly twice the client's rate.
  3. The client's two portion-packed lines showed repeat purchase 19 points above its standard bags, which nobody in the business had analysed or connected to the pack format itself.
  4. Retail buyers stated that reduced-fat positioning no longer earned shelf space on its own, and two had already replaced client lines with protein-led competitors during range reviews.
CLIENT PROFILE
A North American better-for-you snack manufacturer with annual revenue near $184 million (client-reported, unverified by MMA), selling reduced-fat and reduced-sugar ranges across grocery and convenience in three countries. Roughly 76% of revenue came from reformulated conventional snack products, with no protein-positioned range and portion packs across only two of its eleven separate product lines overall.
STRATEGIC CHALLENGE
Repeat purchase had sat below a third of trial for three years while protein-positioned competitors grew quickly, and private label had matched the client's reduced-fat positioning at lower shelf pricing. Management needed to decide between defending existing listings promotionally, repositioning around protein, or expanding portion pack formats across the range.
MMA APPROACH
MMA modelled contribution and repeat purchase by product and format across four years of the client's own data, benchmarked protein-positioned competitors on realised pricing and reorder behaviour, and assessed packaging investment against the format shift. Twenty-two expert interviews with retail category buyers, consumers who had abandoned the category and formulation technologists tested each route.
KEY FINDINGS
  1. Consumers who abandoned the client's products cited taste rather than any nutritional shortcoming, and almost none had noticed the reduced-fat claim the entire range was built around.
  2. Protein-positioned competitors realised roughly 36% higher shelf pricing on products with comparable calorie content, and their repeat purchase ran at nearly twice the client's rate.
  3. The client's two portion-packed lines showed repeat purchase 19 points above its standard bags, which nobody in the business had analysed or connected to the pack format itself.
  4. Retail buyers stated that reduced-fat positioning no longer earned shelf space on its own, and two had already replaced client lines with protein-led competitors during range reviews.
RECOMMENDED STRATEGY
Phase 1: Phase one: reposition the core range around protein content, since the commercial effect is large and the work is texture formulation rather than any fundamental reformulation. Phase 2: Phase two: extend portion pack formats across the range, which lifts repeat purchase measurably and frees formulation to prioritise taste over calorie arithmetic. Phase 3: Phase three: retire reduced-fat lines that private label already matches exactly, releasing shelf negotiation capital for the repositioned products instead.
OUTCOME
The client repositioned nine lines around protein within eleven months and lifted realised pricing by roughly 28% on those products (client-reported, unverified by MMA). Repeat purchase rose from 31% to 49%, portion formats reached seven of eleven lines, and blended gross margin improved by about eight points while four reduced-fat lines were retired.

Frequently Asked Questions

Foundational context covering the market sizes, CAGR, scope, country, region and competition that inform every finding below. This section is provided to cover basics and most often pre-purchase conversations, answered from the MMA Primary Research Dataset.

What is the current size of the Low-Calorie Snack Foods Market?

The global low-calorie snack foods market was valued at $18.00 billion in 2025, reaching an estimated $19.62 billion in 2026. That covers packaged snacks positioned and formulated for reduced calorie content.

How large will the Low-Calorie Snack Foods Market be by 2036?

MMA forecasts the market reaching $46.44 billion by 2036, an increase of $26.82 billion over the 2026 base. That represents an expansion multiple of 2.37 times across the forecast period.

What is the CAGR for the Low-Calorie Snack Foods Market 2026 to 2036?

The base case compound annual growth rate is 9.0%, with a bull case of 10.2% and a bear case of 7.8%. Historical growth between 2020 and 2025 ran at 7.9% annually.

Which segment is growing fastest?

High-protein savoury snacks grow at 13.5%, a full 1.50 times the market rate, because they sell an addition rather than a subtraction. Air-popped and baked formats follow at 11.5% annually.

Who are the major companies in the Low-Calorie Snack Foods Market?

PepsiCo, Mondelez International, General Mills, Kellanova and Simply Good Foods lead on low-calorie snack revenue. Together they account for roughly 31%, low because specialists built the category.

Which country is growing fastest?

India grows fastest at 12.8% annually as organised retail displaces traditional preparation and younger urban consumers read nutrition panels. China follows on packaged snacking growth.

Report Segmentation Architecture

The full report scope spans multiple orthogonal segmentation dimensions, with cross-tabulated demand data provided for each dimension pair. Coverage extends further to regional breakdowns, trend trajectories, and the competitive detail needed to support segment-level decision-making.

By Calorie Reduction Route

  • High-Protein Savoury Snacks
  • Air-Popped And Baked Formats
  • Portion-Controlled Pack Formats
  • Fibre-Enriched Snack Products
  • Reduced-Fat And Reduced-Sugar Reformulations

By End-Use Industry

  • Grocery And Supermarket Retail
  • Convenience And Impulse Retail
  • Sports, Fitness And Gym Channels
  • Workplace And Institutional Catering
  • Online And Subscription Retail
  • Foodservice And Hospitality Supply

By Commercial Dimension

  • Branded Retail Distribution
  • Retailer Private Label Supply
  • Direct-to-Consumer Online Sales
  • Contract Manufacturing Supply
  • Specialty And Health Food Retail

By Region

  • North America
  • Western Europe
  • East Asia
  • South Asia and Pacific
  • Latin America
  • Middle East and Africa
  • Eastern Europe

Scope, Methodology, and Coverage

Every figure in this report is reproducible from documented input assumptions. The scope below maps the historical period, the forecast horizon, the segmentation dimensions, and the countries covered, alongside the underlying primary and qualitative methodology.
Historical Period
2020 to 2025
Forecast Period
2026 to 2036
Base Year
2025 (USD billions; MMA Primary Research Dataset, August 2026)
Market Definition
This report covers packaged snack products positioned and formulated for reduced calorie content, spanning high-protein savoury snacks, air-popped and baked formats, portion-controlled pack formats, fibre-enriched snack products, and reduced-fat and reduced-sugar reformulations, across grocery, convenience, fitness, online, contract manufacturing and foodservice channels. Conventional snacks carrying no calorie positioning, meal replacement and weight management products, confectionery not sold in snack formats, fresh produce and nuts sold unprocessed, and dietary supplements are excluded from the sizing.
Quantitative Units
USD billions at manufacturer realised value; volume in thousand tonnes; realised pricing in USD per kilogram.
Segmentation Dimensions
By calorie reduction route; by end-use industry; by commercial dimension; by region.
Regions Covered
North America, Western Europe, East Asia, South Asia and Pacific, Latin America, Middle East and Africa, Eastern Europe
Countries Covered
United States, Canada, Mexico, Brazil, Argentina, United Kingdom, Germany, France, Netherlands, Italy, Spain, Poland, Turkey, Saudi Arabia, China, Japan, South Korea, India, Australia, South Africa.
Key Companies Profiled
PepsiCo, Mondelez International, General Mills, Kellanova, Simply Good Foods, Nestlé, Campbell Soup Company, Utz Brands, Hain Celestial, Quest Nutrition, Britannia Industries, ITC Limited, Calbee, Orion Corporation and others.
Quantitative Methodology
Primary survey, n=3,800 respondents, Q4 2025, six countries; demand-side model with trade association cross-validation
Qualitative Methodology
47 expert interviews, Q4 2025; applied to validate demand model assumptions, identify emerging dynamics, and assess competitive positioning
Report Format
PDF and XLSX data workbook (Word format preview document)
Publisher
Market Minds Advisory
Report Code
MMA-2026-AGR-222
Published
August 2026
Contact
sales@marketmindsadvisory.com | www.marketmindsadvisory.com

Purchase the full Low-Calorie Snack Foods Market Report (2026 to 2036).

The full report sizes the low-calorie snack foods market across five calorie reduction routes, six channels and seven regions, with tonnage and realised pricing detail behind every value estimate. It profiles twenty companies on protein formulation capability, portion format reach and process capability. Regional chapters cover nutrition claim thresholds, clean-label sentiment and retail structure by market. Cost analysis quantifies protein isolate, packaging and energy exposure by format. Consumption analysis assesses how appetite-suppressing medicines are affecting snacking occasions across the heaviest-buying consumer groups in each market.
Tonnage and realised pricing by calorie reduction route
Repeat purchase behaviour benchmarked by positioning and format
Appetite medicine effects on snacking occasions quantified
Nutrition claim thresholds compared across major jurisdictions
Competitive position assessments across twenty companies
Portion format economics against reformulation cost compared directly

Built For The People Who Decide

From boardroom strategy to bench-side execution, this report is read cover-to-cover by leaders shaping the next decade of their industry, turning demand scenarios, market dynamics and valuation benchmarks into decisions.
CXOs/ Presidents/ VPs/ Managers
M&A and Corporate Development
Strategy Teams and R&D Heads
Procurement and Product Directors
Regulatory and Compliance Leaders
Investor Relations and Equity Analysts