Market Minds Advisory
Low Calorie Bread Market

Low Calorie Bread Market: Low Calorie Bread Market. Thin Slices, Protein and Fibre Enrichment, and Weight-Management Demand Reshape Light Bread.

Low calorie bread is shifting from thin slices to protein enriched loaves as weight-management drugs and calorie labeling reshape shopping, while texture limits, fibre costs, and ultra-processed food debates test who holds shelf space.

Lead Analyst

Published

September 2026

Make Smarter Decisions with Customized Research Insights

Request a free sample report and evaluate market opportunities, growth trends, and competitive dynamics relevant to your business needs.

2025 MARKET VALUE$6.8BMarket Size 2025
2036 FORECAST VALUE$13.2BBase Case , 2026 to 2036
CAGR 2026 TO 20366.2 %Bull 7.5% / Bear 4.9%
INCREMENTAL OPPORTUNITY$6.0BNet 10- year value creation
EXPANSION MULTIPLE1.82x2036 value over 2026 base
Strategic Levers
M&A Pipeline
Regional Outlook
Country Rankings
Competitive Intelligence
Segmental Deep-dive
Call-Us : 91 93563 13602

Executive Snapshot and Market Trajectory.

A slice of ordinary bread carries about 80 to 100 calories, and a low calorie loaf tries to cut that nearly in half without shrinking the sandwich. Bakers do it with thinner slices, air, fibre, and protein, and shoppers judge the result in one bite.
High-protein low-carbohydrate breads grow fastest, driven by weight-management shoppers, fitness buyers, and households using appetite-suppressing medicines that need protein and fibre, while thin-sliced and portion breads anchor volume in supermarkets. North America holds the largest share because calorie awareness, large retail bread aisles, and diet culture sit together there, with Western Europe following through thin-sliced loaves in Britain and protein breads in Germany. India leads country growth. Calorie labels help sales.
Competition is fragmented among large bread groups, premium brands, and private label suppliers, with a few groups holding scale. Advantage comes from recipe skill, fibre and protein sourcing, and retailer relationships rather than price alone. Regulation shapes returns, since reduced energy claims require a stated calorie cut, calorie labeling spreads, and ultra-processed food debates affect ingredient choices. Buyers reward soft texture, real flavour, and slices that still make a proper sandwich. Small lots dominate trade.
Market Definition
Low calorie bread comprises packaged and bakery bread, rolls, and wraps formulated to deliver fewer calories per serving than conventional equivalents, through thin slices, added fibre and protein, aeration, or reduced-carbohydrate recipes, including high-protein, high-fibre, and resistant starch breads, sold through retail, in-store, and foodservice channels. The scope excludes conventional bread, diabetic-specific bakery, sweet bakery, crackers, and bread ingredients sold separately.
Base Year Value
$6.8B in 2025 (MMA Primary Research Dataset, September 2026)
Forecast Period
2026 to 2036, eleven discrete annual values
CAGR
6.2% base case. Bull 7.5%. Bear 4.9%.
Fastest Growth Segment
High-Protein Low-Carbohydrate Breads: 10.0% CAGR
Fastest Growth Country
India: 9.2% CAGR
Fastest Growth Region
South Asia and Pacific: 8.2% CAGR
Largest Region
North America: 30% of 2025 global value
Market Leaders
Grupo Bimbo, Flowers Foods, Warburtons, Hovis, Lantmannen Unibake. Source: MMA Analysis, company annual reports.
Primary Survey
n=3,800 procurement and R&D decision-makers, Q4 2025, six countries
Methodology
Demand-side build-up, cross-validated against public data, 47 expert interviews

Low Calorie Bread Market Forecast Scenarios

low-calorie-bread-market-size-forecast-scenario-1789778742345
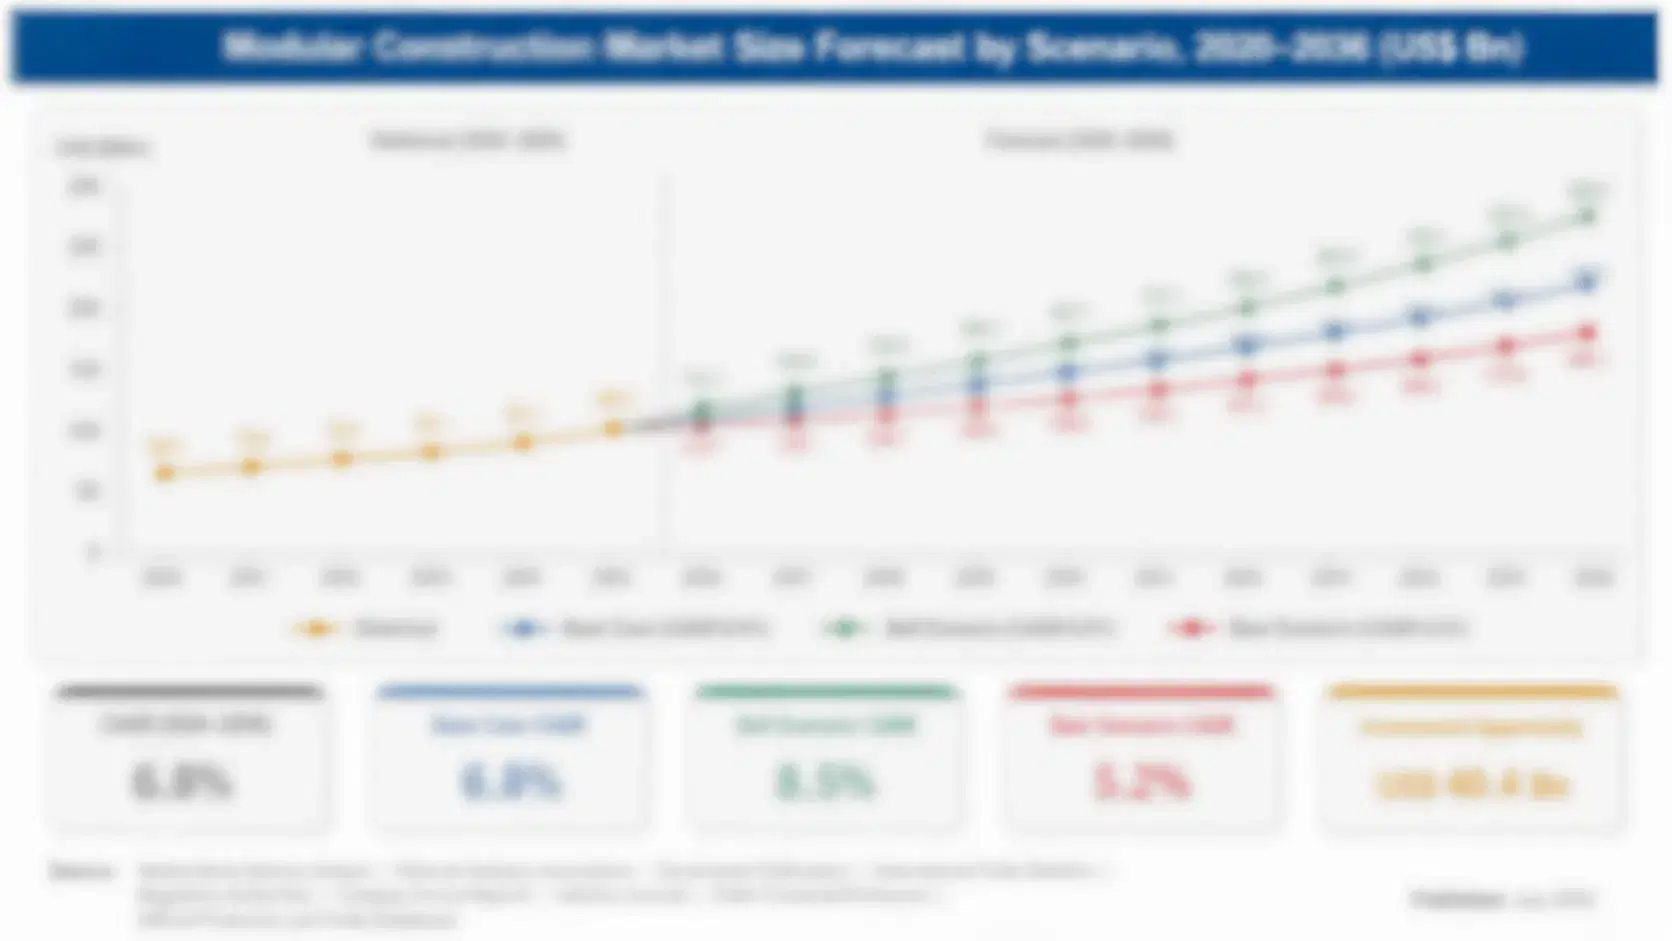
From 2020 to 2025, low calorie bread grew as weight-management interest rose, calorie labeling spread in restaurants and retail, and bakers launched protein and fibre breads beyond plain thin slices. Growth averaged 5.4% a year, with protein and high-fibre loaves outpacing standard light bread, though wheat, protein, and energy inflation in 2022 and 2023 squeezed margins and led to price increases that tested shopper willingness to pay.
The base case assumes 6.2% annual growth through 2036, built on three named mechanisms: continued shopper focus on calories, protein, and fibre, reinforced by wider use of appetite-suppressing medicines that raise demand for nutrient-dense foods, expansion of calorie and nutrition labeling that makes bread comparisons easy at shelf, and better ingredient technology, including resistant starch, enzymes, and plant protein, that improves texture at low calorie counts. Each mechanism reinforces the others.
The bull case, at 7.5%, needs stable protein and fibre costs and faster adoption of enriched loaves in emerging markets. The bear case, at 4.9%, reflects taste complaints, ultra-processed food backlash, and price gaps to standard bread. Either path leaves the demand base intact, though mix and pricing would shift noticeably across regions. Investors should weight the base case.

Texture at Low Calories and Fibre Sourcing Decide Light Bread Winners

Low calorie bread lowers energy per serving through several routes. Thin slices and small rolls cut weight directly, aeration adds volume without calories, and added fibre such as oat fibre, inulin, and resistant starch replaces digestible starch. High-protein breads use wheat protein, pea protein, or dairy protein to raise protein and cut net carbohydrate. Holding softness, moisture, and shelf life while cutting starch is the technical problem.
MARKET CONCENTRATION34% CR5Leading five bakers hold a moderate combined share
AVERAGE LOAF PRICE$4.60 per loafLow calorie loaves sell at a premium to standard
CALORIES PER SLICE45Typical energy content of a light bread slice
ADDED INGREDIENT COGS SHARE18%Added fibre and protein are a major ingredient cost
THIN-SLICED SHARE OF SALES41%Portion of category value from thin and portion slices
RETURN AND WASTE RATE9%Share of light loaves returned or discarded unsold
Buyers choose low calorie bread for several reasons. Weight-management households count calories, fitness shoppers seek protein, older adults want lighter meals, and parents use thin slices for smaller sandwiches. Supermarkets stock them in sliced bread aisles and health sections, cafes and sandwich chains use thin-sliced and low-carbohydrate wraps, and online grocers deliver subscriptions. Claims must match rules for reduced energy, and complaints about dry texture hurt trust.
The industry is fragmented at the baker stage. Grupo Bimbo, Flowers Foods, Warburtons, Hovis, and Lantmannen Unibake hold plants and retailer relationships, while premium brands such as Carbonaut and Sola and thousands of bakeries serve niche buyers. Ingredient inflation, calorie labeling, and ultra-processed food debates shape investment, and private label light ranges widen competition across categories.
"Low calorie bread is judged in the first sandwich. If the slice is thin but tears, or protein-rich but rubbery, the shopper goes back to normal bread, so the winners are bakers who trade calories for fibre and protein without giving up softness."
Practice Lead, Better-For-You Bread Practice · MMA Better-For-You Bread Practice · September 2026

Market Trends

Appetite-Suppressing Medicines Raise Demand for High-Protein, High-Fibre Bread

Millions of adults now use prescription appetite-suppressing medicines for weight loss and diabetes, and clinicians advise them to eat smaller portions rich in protein and fibre to protect muscle and manage nausea. Bakers respond with high-protein loaves of 8 to 12 grams per slice, thin-sliced breads, and small rolls, and retailers place them in health sections. High-protein breads sell at 40% to 90% above standard bread, and grocers report faster growth than the category. Dry or rubbery texture limits repeat purchase, so suppliers offer enzymes and blends to improve softness and crumb.
Market Impact: obesity affects 40% of US adults
Calorie Labeling and Nutrition Scoring Make Bread Comparisons Visible

Calorie labeling on menus in England, the United States, and other markets, and nutrition scoring schemes such as Nutri-Score in Europe, push retailers and brands to show calories per slice on bread packs and menus. Thin-sliced breads at 40 to 55 calories a slice display well against 90-calorie standard slices, and sandwich chains highlight calorie counts on menus. Bakers reformulate to hit calorie thresholds, and suppliers offer fibre and enzyme systems to keep texture. European Union rules require reduced energy claims to show at least a 30% calorie cut, which forces careful recipe design, and retailers audit claims regularly.
Market Impact: light loaves reach 40-60 calories

Market Opportunities and Growth Drivers

Weight-Management Focus and Calorie Awareness Sustain Demand for Lighter Bread

Overweight and obesity affect more than 40% of adults in the United States and about 60% in the European Union, according to national health surveys and Eurostat, and many households manage weight by counting calories or cutting carbohydrates. Bread is a daily staple, so a lower calorie loaf offers an easy swap that reduces intake by 30 to 50 calories per slice without changing habits. Retailers promote light bread in diet and health campaigns each January. Premium prices of 20% to 60% above standard bread are accepted when taste holds, which supports margins for bakers that get texture right.
Market Impact: repeat rates trail standard by 15-25%

Fibre and Protein Technology Improves Texture at Lower Calories

Advances in resistant starch, oat fibre, wheat protein, and enzyme systems let bakers replace part of the flour with ingredients that add volume, water binding, and structure with fewer digestible calories, and produce loaves of 40 to 60 calories a slice with acceptable softness. Ingredient suppliers such as Ingredion, Roquette, and Cargill offer tailored fibre and protein blends and application support. Enzymes and hydrocolloids help hold moisture and slow staling, and premix suppliers offer ready blends for bakeries. Better texture cuts trial-only purchases and lifts repeat rates, which supports steady shelf space.
Market Impact: fibre adds 15-40% to cost

Market Restraints and Challenges

Texture and Taste Compromises Limit Repeat Purchase Among Mainstream Shoppers

Cutting starch and calories changes crumb, moisture, and shelf life, and high fibre or protein loaves can taste dry, dense, or slightly bitter, so repeat rates trail standard bread. The root cause is that digestible starch provides softness and moisture that fibre and protein cannot fully replace at low dosage. Trial is healthy but repeat rates run 15% to 25% below standard loaves, according to MMA primary research. Mitigation includes enzymes, hydrocolloids, resistant starch, and flavour masking, though each step adds 5% to 12% to cost, and long sensory trials delay launches, so poor texture still wastes marketing spend.
Market Impact: protein loaves reach 8-12 grams

Fibre Costs and Ultra-Processed Food Debates Raise Reputation Risk

Added fibres and protein isolates cost several times more than flour, and ingredient lists lengthen, which conflicts with clean-label preferences and feeds ultra-processed food debates, according to nutrition and retail commentary. The root cause is that calorie reduction needs functional ingredients. Some retailers and shoppers avoid long lists even when calories are lower. Mitigation includes shorter ingredient lists using oat fibre and wheat protein, transparent sourcing, and clear on-pack claims, though cost premiums of 15% to 40% remain, and shoppers who trade down in downturns return to standard bread quickly.
Market Impact: reduced energy needs a 30% cut
3 additional market trends, 4 additional growth drivers, and 2 additional restraints and challenges are covered in the full report. Contact sales@marketmindsadvisory.com to access the complete intelligence.

Segment CAGR and Growth Architecture

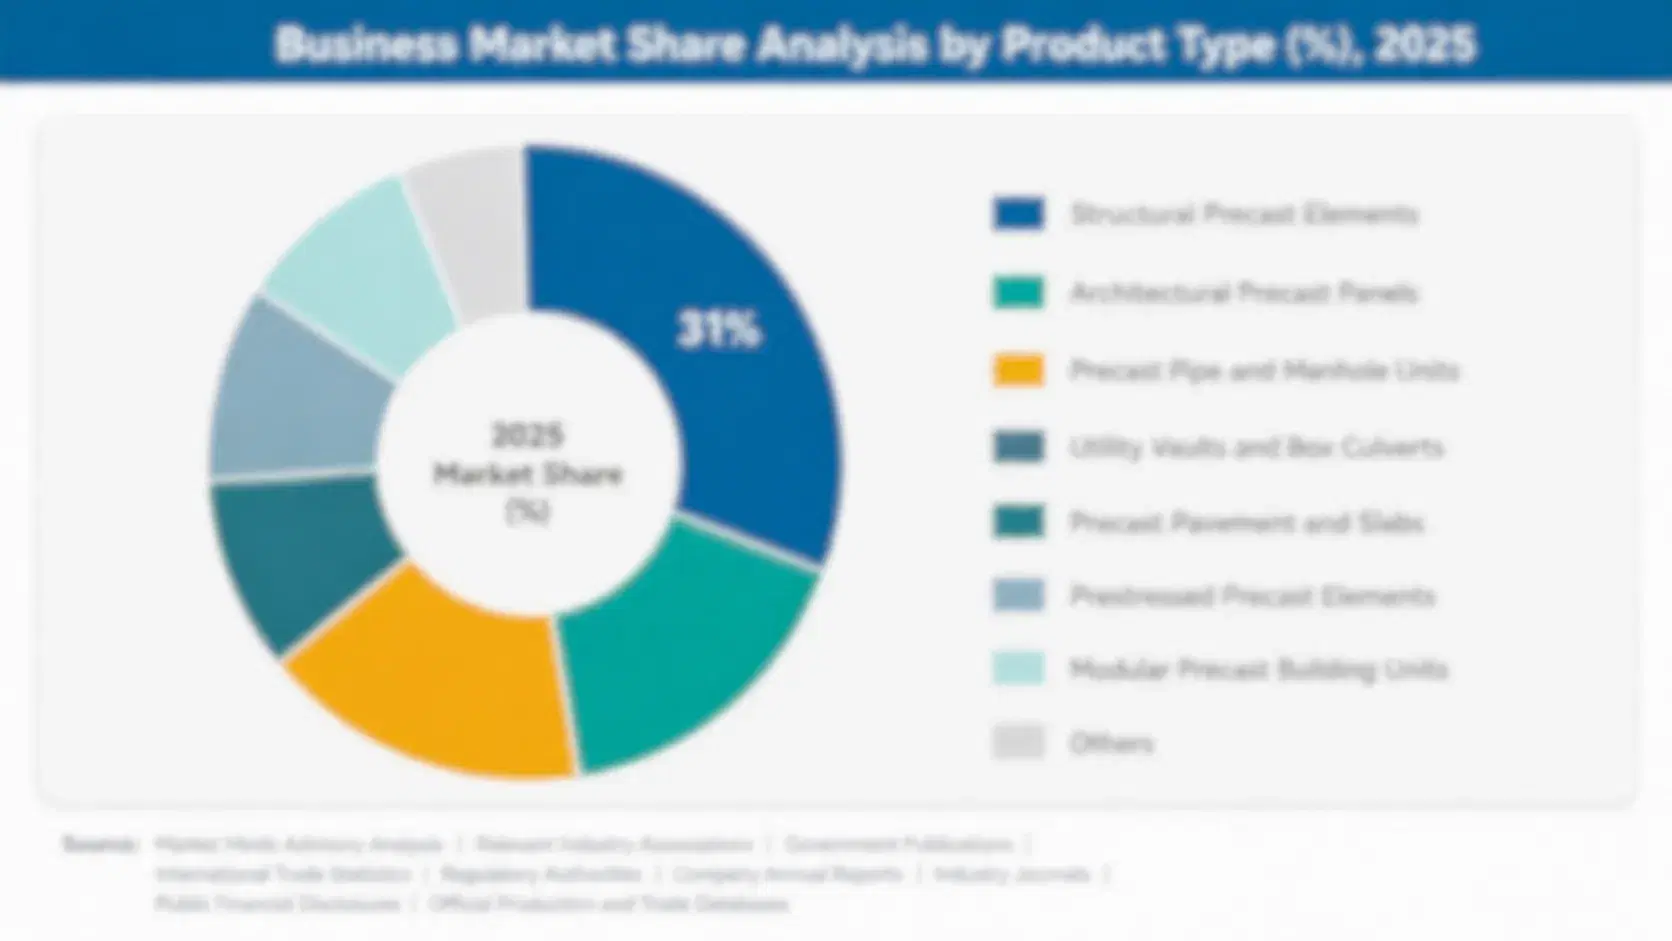
Low calorie bread is segmented by formulation route, because calorie mechanism, ingredient cost, claim status, price, and buyer group differ more sharply between thin-sliced and portion breads, high-fibre breads, high-protein low-carbohydrate breads, resistant starch breads, and light wraps than they do by pack format. High-protein low-carbohydrate breads attract the most investment as bakers convert weight-management demand into premium ranges.
low-calorie-bread-market-market-share-analysis-1789778742626

High-Protein Low-Carbohydrate Breads

High-protein low-carbohydrate breads are the fastest-growing segment, made with wheat protein, pea protein, or dairy protein and added fibre to reach 8 to 12 grams of protein and 40 to 70 calories per slice while cutting net carbohydrate by 30% to 60%. Weight-management households, fitness shoppers, and appetite-suppressing medicine users buy them for satiety and protein. Prices run 40% to 90% above standard bread, and protein costs and texture are the challenges. Bakers with enzyme systems, protein sourcing, and strong taste scores win listings, and retailers give them health section placement and promotion across seasons. Pilot loaves typically run through two seasons before retailers commit to full health sections and long-term listings.
CAGR 10.0%

Resistant Starch and Fibre-Enriched Breads

Resistant starch and fibre-enriched breads are the second-fastest segment, using high-amylose starches, oat fibre, and inulin to replace digestible starch and lower net calories while keeping normal slice size and softness. Health-focused households, older adults, and gut-health shoppers buy them for fibre claims of 6 to 10 grams per 100 grams. Prices run 20% to 50% above standard bread, and fibre dose limits taste and gas concerns. Bakers with fibre expertise, retailer nutrition data, and consistent quality win contracts, and premix suppliers provide ready fibre systems that shorten development for smaller bakeries each year. Bakeries also publish fibre and net carbohydrate data per slice, so shoppers can compare loaves before choosing a product.
CAGR 8.1%
Full segment breakdown across 6 segments available in the complete report.

Regional Architecture and Country Demand Map

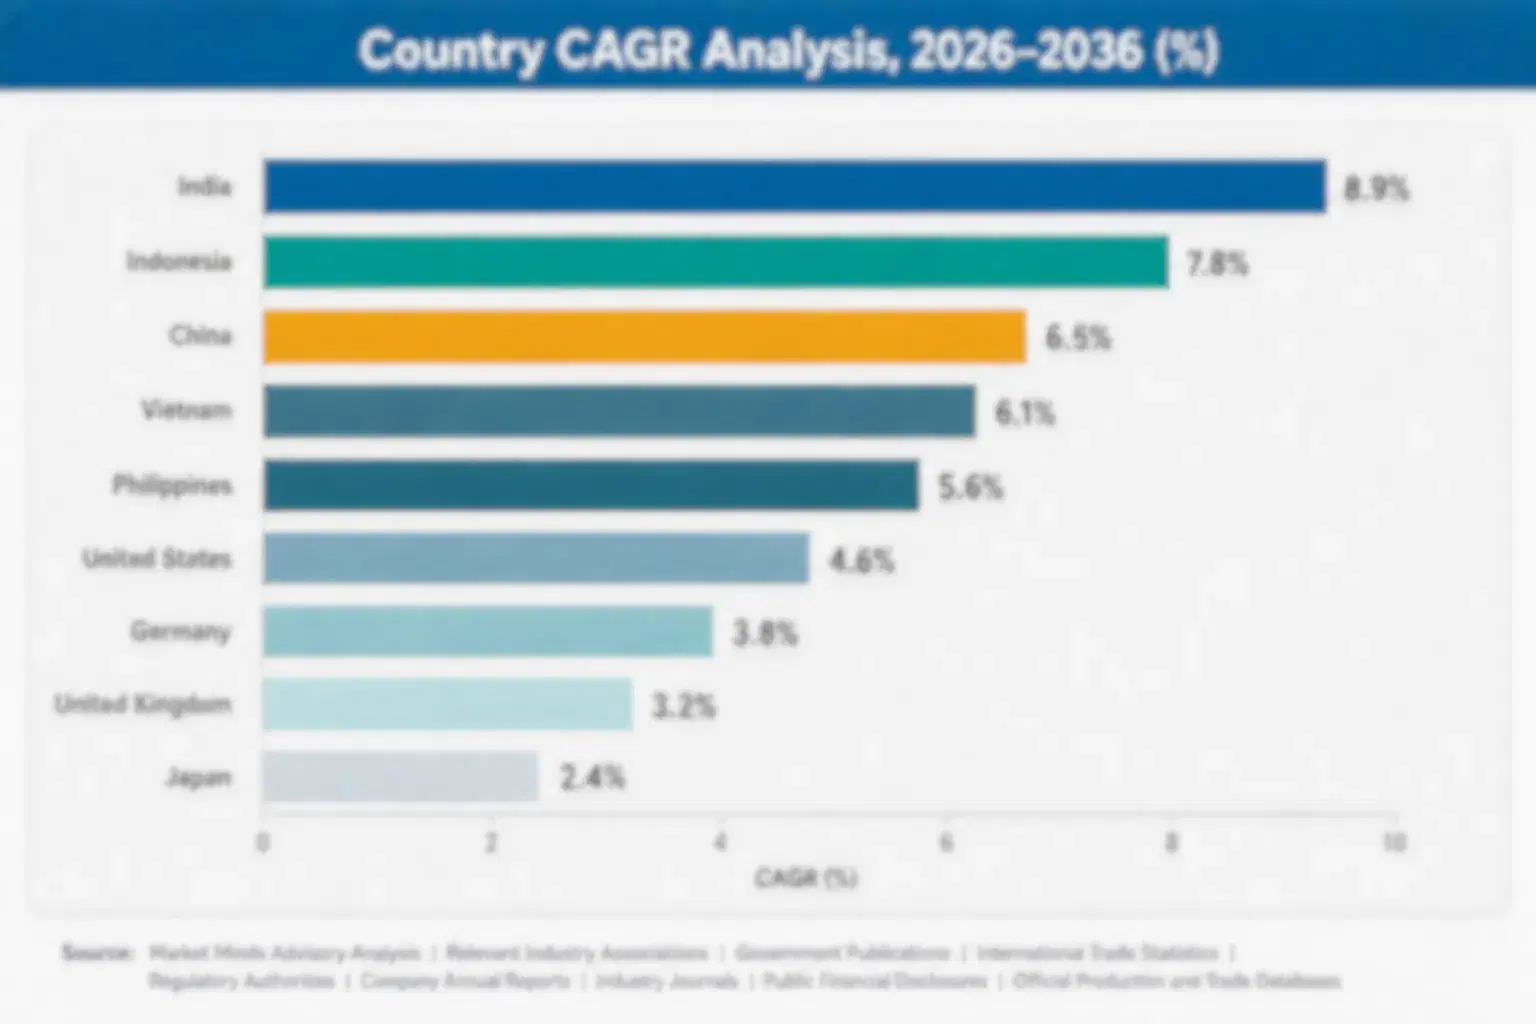
Low calorie bread value follows weight-management culture, calorie labeling, and retail bread aisle size. North America leads through United States and Canadian bakers, Western Europe follows through British thin-sliced loaves and German protein breads, and India is the fastest-growing country as health-focused packaged bread expands in cities.

North America

North America holds 30% share, with the United States accounting for most sales through Walmart, Kroger, Costco, and Amazon, where Sara Lee, Oroweat, Nature's Own, and Dave's Killer Bread lines compete with private label and low-carbohydrate start-ups. Calorie awareness, diet campaigns each January, and appetite-suppressing medicine use support demand. FDA labeling rules, texture complaints, and price gaps restrain returns, though protein and fibre breads keep growth close to the global rate. Canadian and Mexican bakers add regional volume, and online low-carbohydrate brands ship subscriptions each month to weight-management households. Pacific Northwest and Texas bakeries also expand protein loaves, and club stores and online grocers sell multipacks of thin-sliced bread to weight-management households.
Share: 30% | CAGR: 6.0% (2026 to 2036)

Western Europe

Western Europe holds 27% share, above its usual band, because the United Kingdom created the thin-sliced bread category with brands such as Hovis Best of Both and Warburtons Thin, Germany and Nordic markets sell protein and fibre breads widely, and calorie labeling and Nutri-Score are established, so per-capita light bread use is higher than elsewhere. Warburtons, Hovis, Harry-Brot, Mestemacher, and Lantmannen Unibake lead. Mature volumes, energy costs, and price pressure hold growth below the global rate, though protein breads add value. Dutch and Belgian bakeries follow British trends. Irish and Dutch supermarkets also expand protein bread ranges, while Spanish and Italian bakeries add lighter sandwich loaves and Belgian chains list calorie-labeled bread each year.
Share: 27% | CAGR: 4.9% (2026 to 2036)
Regional intelligence for 5 additional markets available in the complete report: East Asia, South Asia and Pacific, Latin America, Middle East and Africa, Eastern Europe. Contact sales@marketmindsadvisory.com.
low-calorie-bread-market-country-cagr-analysis-1789778742897

Four Margin Routes for Low Calorie Bread Bakers

Margin in low calorie bread comes from building premium tiers with high-protein and fibre-enriched loaves, solving texture with enzyme and hydrocolloid systems, and serving retailers with private label light ranges that hold quality. Bakers that master softness, secure fibre and protein supply, and prove nutrition earn more per loaf than sellers competing on price and calorie claims alone.

Launching High-Protein Loaves Aimed at Weight-Management and Medicine Users

High-protein breads sell at 40% to 90% above standard bread, so bakers that launch loaves with 8 to 12 grams of protein per slice capture much higher margin per loaf and reach households that use appetite-suppressing medicines. Development costs $500,000 to $1.5 million per range, and a protein line costs $3 million to $10 million and is recovered within four seasons. Retailers give health section placement, and shoppers pay for protein and satiety. Bakers that publish nutrition data and use clear on-pack calories build trust, which lifts repeat purchase and reduces promotion needs across the range.
Market Impact: high-protein loaves earn 40% to 90% price premiums

Fixing Texture With Enzymes, Hydrocolloids, and Fibre Systems From Suppliers

Poor texture drives 15% to 25% lower repeat rates, so bakers that adopt enzyme, hydrocolloid, and resistant starch systems lift repeat rates by 8 to 15 points and cut waste from failed batches. Application support from ingredient suppliers costs 1% to 2% of ingredient spend, and trials take six to 12 months. Better crumb and moisture retention add two days of shelf life and reduce returns from 9% to 6%. Bakers with strong supplier partnerships develop new loaves faster, and premix suppliers provide ready blends for smaller bakeries that lack laboratories.
Market Impact: texture fixes lift repeat rates by 8 to 15 points

Supplying Retailers With Private Label Light and Protein Bread Ranges

Retailers want private label light and protein breads at prices below brands, so bakers that offer tested formulations and reliable supply win contracts of one to three years covering 10 to 40 million loaves. Private label earns gross margins 5 to 8 points below brands but fills plants and lowers unit cost, and protein formulations command 15% to 30% above standard private label. Bakers that provide nutrition dossiers, calorie audits, and consistent quality become preferred suppliers, and multi-plant networks give resilience during flour or energy spikes that smaller rivals cannot match.
Market Impact: private label protein earns 15% to 30% premiums

Securing Wheat Protein, Pea Protein, and Fibre Supply Contracts

Added fibre and protein are 18% of cost of goods and prices swing with crop and energy costs, so bakers that sign multi-year contracts with ingredient suppliers secure quality and price. Contracts cost 2% to 5% above spot in normal years but avoid shortages that cost 3 to 5 margin points. Dual sourcing across wheat protein and pea protein reduces risk, and traceability supports clean sourcing claims. Ingredient suppliers value stable offtake and share application support, and joint development shortens the path from trial to shelf for new light and protein loaves each year.
Market Impact: ingredient contracts protect 3 to 5 margin points

Who Controls the Margin Pool

The low calorie bread industry is fragmented at the baker stage, with the top five bakers holding about 34% of global revenue, the basis used throughout this section. Grupo Bimbo, Flowers Foods, Warburtons, Hovis, and Lantmannen Unibake lead through plant networks, brands, and retailer relationships, while thousands of bakeries, premium brands, and private label suppliers serve local customers and retailer programs.
Competition centers on three dimensions: recipe and texture performance measured by softness, moisture, and taste scores in retailer and consumer tests, nutrition credentials measured by calories, protein, and fibre per slice with verified labeling, and retailer relationships across supermarkets, in-store bakeries, and sandwich chains. Leaders sign multi-year private label programs and fund technology, while challengers compete on niche protein and low-carbohydrate claims.

Emerging pressure comes from low-carbohydrate start-ups selling online, from retailer in-store bakeries building their own light ranges, and from ingredient suppliers offering complete premix systems that lower barriers to entry. Rankings shift where bakers secure retailer contracts, solve texture, or lose to cheaper private label. Acquisitions of premium brands and regional bakeries will reorder positions faster than organic growth, particularly as retailers look for suppliers that reduce dependence on a single protein source.
low-calorie-bread-market-company-positioning-matrix-1789778743235

Competitive Moat and Risk Dimensions

WARBURTONS

Moat: British Thin-Sliced Leadership

Warburtons is a large family-owned British baker with a strong position in sliced bread and its Thin range, which helped create the thin-sliced category. Its regional bakeries, retailer relationships, and consumer brand recognition let it launch protein and high-fibre lines quickly, and its focus on sliced loaves gives it deep knowledge of texture and moisture at low weight.
WARBURTONS

Risk: Single Market Concentration

Warburtons depends heavily on the British market, where flour and energy costs, retailer private label, and health policy shifts affect margins. Larger international groups and low-carbohydrate start-ups can move faster on protein innovation, and any texture complaint can damage trust in its light ranges. Price pressure adds risk.
GRUPO BIMBO

Moat: Global Bakery Network and Scale

Grupo Bimbo is the world's largest baking company, with more than 200 plants across the Americas, Europe, Asia, and Africa and brands such as Sara Lee, Oroweat, and Thomas. Its distribution network, purchasing scale, and research capability let it launch light, high-fibre, and protein bread lines quickly across regions.
GRUPO BIMBO

Risk: Scale Complexity and Cost Pressure

Grupo Bimbo operates in many markets with different consumer preferences and cost bases, so light bread strategy is uneven across regions. Wheat, protein, energy, and packaging costs squeeze margins, and premium start-ups and private label can win share in specific categories. Price pressure adds further risk.

Players Tracked

Prominent Players

Grupo Bimbo
Flowers Foods
Warburtons
Hovis
Lantmannen Unibake

Other Key Players

Pepperidge Farm
Aryzta
Harry-Brot
Mestemacher
Wasa
Vandemoortele
Britannia Industries
Yamazaki Baking
Pasco Shikishima
Tiger Brands
Sola Nutrition
Carbonaut
Julian Bakery
Barilla Group
Brioche Pasquier

Recent Developments

MARCH 2026

Warburtons Expands High-Protein and Thin-Sliced Bread Capacity in England

Warburtons completed an organic expansion of high-protein and thin-sliced bread capacity at an English bakery, adding slicing lines and improved packaging for lighter loaves. The project is internal capital spending. It raises output of light ranges, supports retailer listings, and shortens delivery times to supermarket customers in growing regions.
Signal: Shows established bakers now investing in dedicated light and protein bread capacity to serve growing weight-management demand.
OCTOBER 2025

Flowers Foods Signs Multi-Year Wheat Protein Supply Agreements for High-Protein Loaves

Flowers Foods signed multi-year wheat protein supply agreements with ingredient producers for its high-protein loaves, covering volumes, specifications, and price formulas linked to wheat and energy indices. The deals are commercial contracts. They give its bakeries steadier supply, share commodity risk with suppliers, and support launches of protein breads.
Signal: Confirms bakers are now locking in protein supply through multi-year agreements to protect high-protein bread margins.
MAY 2025

Hovis Launches Calorie-Labeled Light Bread Range With Fibre and Protein Enrichment

Hovis launched a calorie-labeled light bread range with fibre and protein enrichment, showing calories per slice on pack and using enzymes to hold softness. The launch is a product introduction, not an acquisition. It supports weight-management shoppers, tests demand for enriched loaves, and gives retailers clear nutrition information.
Signal: Shows bread brands now launching calorie-labeled enriched ranges to serve growing nutrition-focused shopper demand across regions.

What Drives Low Calorie Bread Costs

Flour accounts for roughly 30% of cost of goods and added fibre and protein for another 18%, with wheat from North America, Europe, and Australia, wheat protein from Europe and the United States, and fibres from oat and chicory processors. Labour, packaging, oven energy, and freight add most of the remainder, so wheat price, protein cost, and waste rate together determine margin for bakers supplying retail and foodservice.
Wheat and energy prices spiked in 2022, according to the Grupo Bimbo Annual Report 2022 and the Flowers Foods 10-K 2022, as European gas prices surged, Ukrainian grain exports were disrupted, and packaging and freight costs rose. Bakers with fixed-price contracts absorbed losses, others added surcharges, and some retailers accepted price increases with a lag. Margins narrowed as shoppers traded down and customers negotiated harder on renewals for later quarters.

Exposure varies by player type and geography. Large groups with ingredient contracts, multiple plants, and index-linked pricing absorb shocks better than small bakeries buying spot flour and protein. European bakers face energy cost, North American bakers face wheat and delivery cost, and premium protein and fibre loaves pass costs through more easily than thin-sliced standard light bread sold on price.
low-calorie-bread-market-cost-volatility-analysis-1789778743557

Contracting Flour, Protein, and Fibre Across Several Suppliers

Bakers sign annual and multi-year agreements with millers and ingredient producers, mixing fixed and index-linked prices to spread risk across suppliers. Diversifying sources reduces exposure to a single shortage or price spike, and quality clauses secure protein content and fibre specifications. Forward buying lets bakeries plan production and avoid emergency purchases during price spikes in wheat and protein markets.

Installing Heat Recovery and Efficient Oven Technology

Bakers install heat recovery, efficient ovens, and process controls to reduce energy use, the largest controllable cost after flour and labour. Modern systems cut oven energy by 15% to 25%, though they need capital and technical training. Lower energy intensity also supports carbon claims that retailers ask for in tenders. Savings compound yearly. Payback is quick.

Passing Costs Through Index-Linked Pricing With Major Retailers

Large retailers and bakers agree to formulas linking price to published wheat and energy indices plus a fixed baking margin, so cost swings are shared rather than absorbed by bakeries. Quarterly resets keep buyers informed and reduce disputes. Premium protein lines use annual pricing, since customers value stable supply over the year. Terms remain annual.

Portfolio Architecture for Margin Defence

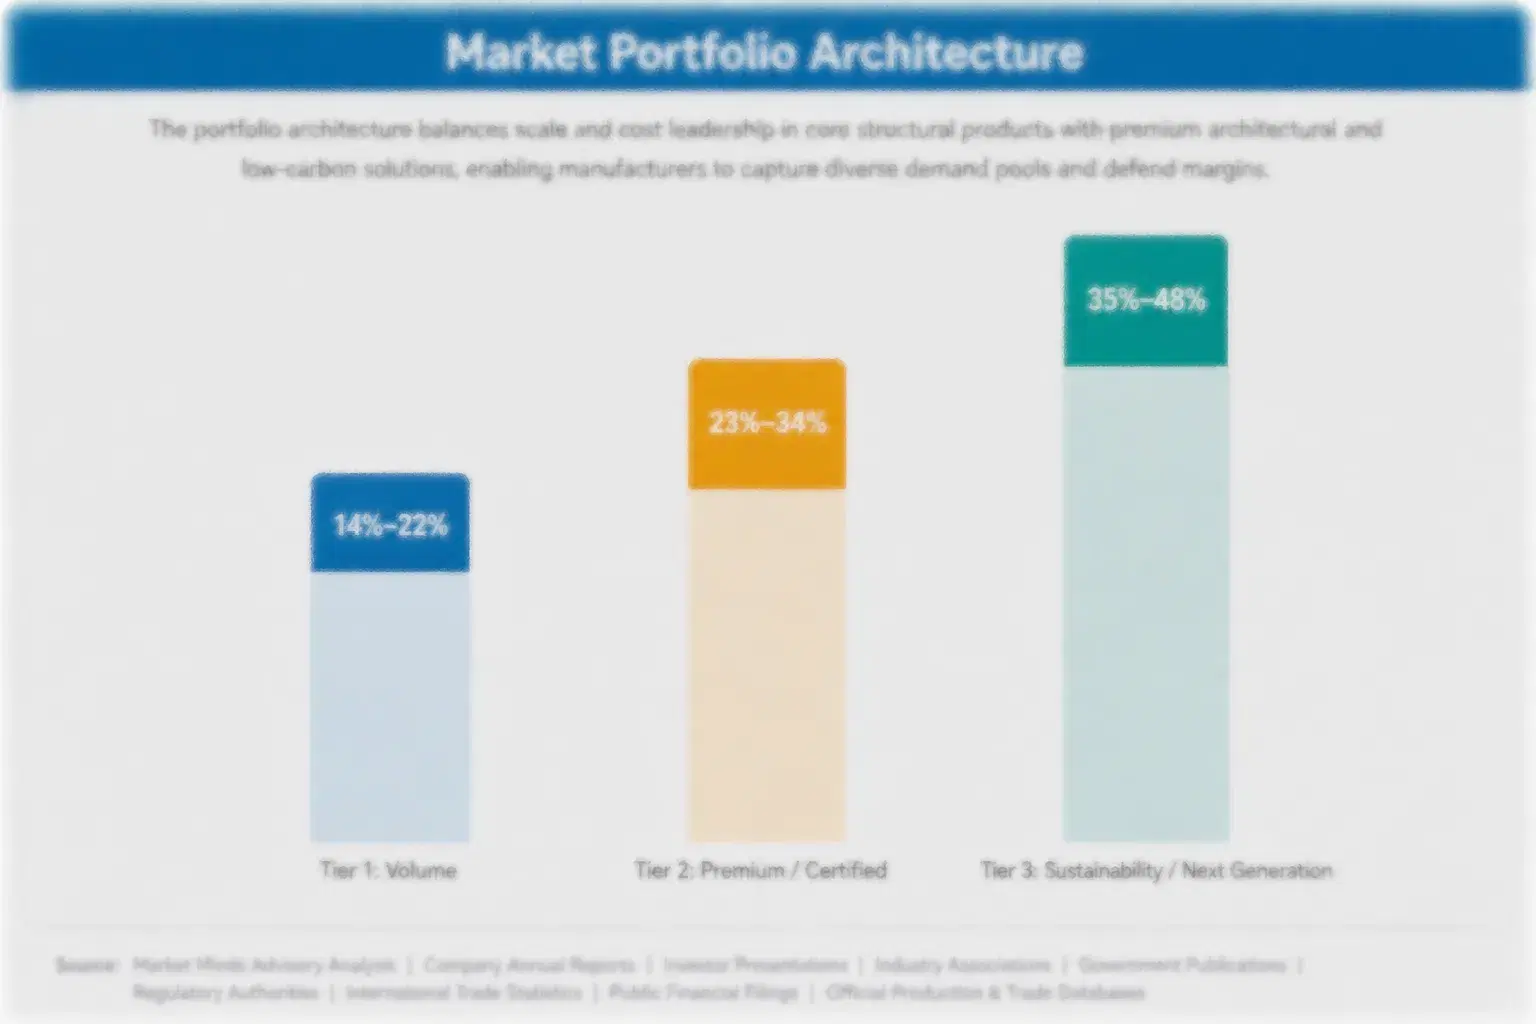
Margins run from moderate returns on thin-sliced bread sold on promotion to strong profits on high-protein, fibre-enriched, and low-carbohydrate loaves sold with nutrition data and brand support, with gross margin roughly doubling between the volume tier and the top tier. Enzyme technology, ingredient sourcing, and brand equity add pricing power over the same flour, and shoppers pay more for a loaf that keeps texture while cutting calories.
Volume and premium pull in different directions. Thin-sliced bread sells in large lots to price-driven supermarkets and private label buyers at moderate margins and faces waste pressure. High-protein, fibre, and low-carbohydrate breads sell in smaller lots at much higher margins but need protein sourcing, enzyme systems, and delivery discipline, so bakers must choose how much capital to commit to premium positioning and how quickly to move.

High-value pools concentrate in high-protein low-carbohydrate breads for weight-management shoppers, resistant starch breads for health-focused households, and private label protein ranges for retailers. These segments benefit from repeat purchase, brand loyalty, and limited competition from small bakers. Bakers combining recipes, ingredient partnerships, and retailer relationships hold advantages that are difficult to replicate quickly, given the time needed to build brands and supply chains with retail customers.

Volume / Commodity-Adjacent Tier

Thin-sliced and portion breads sold through supermarkets and private label, with moderate margins, waste and flour cost exposure, and constant promotion, where shoppers switch on price and brand differences in calorie counts are small.
Gross Margin: 26%-36%

Premium / Certified Tier

High-fibre and whole-grain light breads with verified calorie labeling, food safety audits, and clean labels, sold under retailer programs to shoppers and buyers that require documented nutrition, consistent softness, traceable grain, and reliable delivery across the week.
Gross Margin: 34%-46%

Sustainability / Regulatory / Next-Generation Tier

High-protein low-carbohydrate and resistant starch breads with enzyme systems, nutrition data, and retailer partnerships, positioned for weight-management shoppers, health sections, and online grocers across major markets, supported by brand marketing and long-term supply agreements.
Gross Margin: 42%-58%
low-calorie-bread-market-portfolio-architecture-1789778743876

High-value Sub-segments and Strategic Watch-out

High-Protein Low-Carbohydrate Breads

High-protein breads combine the fastest growth with strong pricing, as weight-management shoppers and medicine users pay premiums for protein and satiety. Ingredient sourcing and enzyme know-how limit competition, and bakers with strong taste scores and retailer nutrition data win multi-year listings. Repeat purchase follows. Pricing stays fragile.
Gross Margin: 42%-58%

Resistant Starch and Fibre-Enriched Breads

Fibre-enriched breads offer high value with solid growth, since health-focused households pay steady premiums for fibre and gut-health claims. Fibre dose limits and taste concerns constrain scale, though enzyme systems and nutrition data help bakers defend margin. Volume compounds yearly across accounts. Timing matters here for planning.
Gross Margin: 36%-50%

Thin-Sliced and Portion Breads

Thin-sliced and portion breads form the volume core, sold through supermarkets to households who want lighter sandwiches at moderate cost. Margins are moderate and exposed to flour and waste swings, but steady demand supports scale, and bakers with regional plants and retailer contracts hold cost advantages in the segment.
Gross Margin: 24%-36%

Low-Calorie Wraps and Flatbreads

Low-calorie wraps and flatbreads are a strategic watch-out, valued for portion control but limited by shorter shelf life, texture challenges, and competition from lettuce wraps and other formats. Changing sandwich habits could expand or restrict volume, so bakers should track sandwich chain demand and margins carefully.
Gross Margin: 28%-46%

Why Shoppers Keep Buying Light Loaves

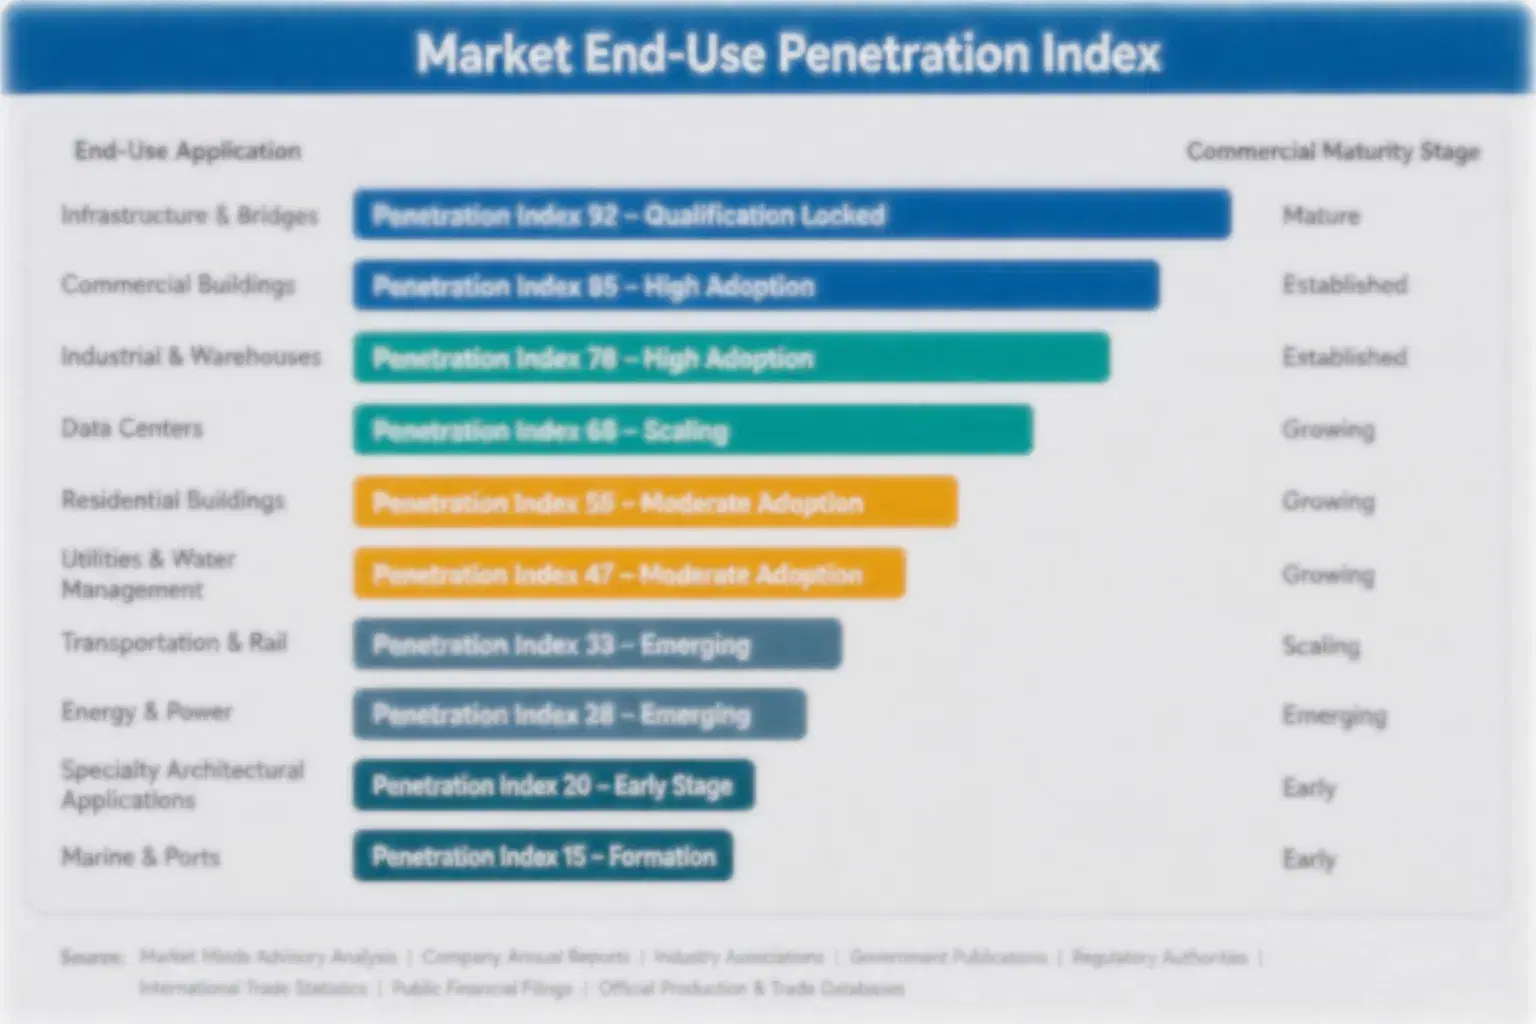
Low calorie bread demand behaves like an annuity once a household finds a loaf it trusts. Shoppers buy weekly, check calories once, and rarely experiment, because a dry or torn slice costs more than the calories saved. Brands that win a household often keep it for years, and retailer private label programs and subscription deliveries lock in weekly volume with modest price changes rather than open promotions. Loyalty compounds.
Stickiness varies by vertical. Weight-management households and medicine users are the deepest, since nutrition data and satiety reinforce brand choice. Fitness shoppers are next, driven by protein claims, while general shoppers buying thin-sliced bread are shallower and switch when promotions appear. Sandwich chains and cafes sign supply agreements for thin-sliced and low-carbohydrate products and rarely change suppliers mid-contract.

Buyer profiles are shifting. Older buyers relied on brands and traditional light loaves, while younger shoppers use calorie scanners, social media, and online grocers to compare protein and fibre themselves. They share reviews, switch quickly if a loaf tastes dry, and value transparent sourcing, so bakers that publish nutrition data and deliver softness reliably keep loyalty across age groups.
low-calorie-bread-market-end-use-penetration-index-1789778744194

MMA Verdict on Low Calorie Bread

These are among the four positions where our research anticipates prominent divergence between winners and laggards over the coming forecast period. Each is grounded in the demand model, the regulatory perimeter, and the announced capacity pipeline.
01 / HIGH-PROTEIN RANGE STRATEGY

Build High-Protein Loaves Before Retailers Lock Weight-Management Health Sections

High-protein breads grow at 10.0% a year, about 1.61 times the market rate, and sell at 40% to 90% above standard bread. A protein line costs $3 million to $10 million and pays back within four seasons. MMA recommends launching two high-protein loaves with published nutrition data within 24 months, because retailers that list one protein supplier rarely add another, and early entrants gain shelf placement and data that late entrants struggle to match, while satiety claims support repeat purchase.
02 / TEXTURE TECHNOLOGY STRATEGY

Fix Texture With Enzyme and Fibre Systems Before Repeat Rates Erode Margin

Poor texture drives repeat rates 15% to 25% below standard bread, and enzyme and fibre systems lift them by 8 to 15 points. Trials take six to 12 months. MMA advises signing supplier development partnerships for the three largest light loaves within 18 months and adding premix options for smaller lines, because better crumb adds two days of shelf life and cuts returns from 9% to 6%, and bakers that solve texture win permanent shelf space from rivals that lose shoppers after one trial.
03 / PRIVATE LABEL STRATEGY

Win Multi-Year Private Label Light Bread Contracts Before Retailers Consolidate Suppliers

Private label protein earns 15% to 30% premiums over standard private label, and contracts cover 10 to 40 million loaves over one to three years. Margins run 5 to 8 points below brands. MMA recommends bidding for two retailer programs with calorie audits and nutrition dossiers within two years, since private label fills plants and cuts unit cost, and suppliers with multi-plant networks and reliable quality become preferred, while volume from these programs supports investment in premium brands across the same plants.
04 / INGREDIENT SECURITY STRATEGY

Contract Wheat Protein, Pea Protein, and Fibre Before Supply Tightens Further

Added fibre and protein are 18% of cost of goods, and contracts protect 3 to 5 margin points. Protein supply is tight as demand rises. MMA advises signing multi-year agreements covering 60% of protein and fibre needs with two suppliers each and adding dual sourcing across wheat and pea protein within two years, because bakers that secure specialty ingredients early avoid shortages as protein ranges grow, and ingredient suppliers value stable offtake and offer joint development that shortens time to shelf.

Engagement Snapshot From the Field

A live engagement with an industry participant carrying material or product regulatory and market exposure ahead of a defining policy shift, showing how our research translates into a defensible multi-year portfolio strategy.
MARKET MINDS ADVISORY · CLIENT ENGAGEMENT SUMMARY
Low Calorie Bread Producer Strategic Portfolio Review and Transition Roadmap 2026·Investment Scenario on Low Calorie Bread Exposure Evaluation 2025-26
CLIENT PROFILE
The client is a mid-sized European regional bakery with three plants and roughly $380 million in annual revenue (client-reported, unverified by MMA), selling sliced bread, buns, and private label loaves through supermarkets. Gross margin sat near 25% (client-reported, unverified by MMA), and private label bread had taken share from its brands for three consecutive years.
STRATEGIC CHALLENGE
Standard bread volumes were falling, two retailers asked for protein and light bread ranges the client did not have, texture complaints on earlier light products ran at 12%, and larger competitors were launching calorie-labeled brands. Leadership needed a plan that justified protein and enzyme investment, protected shelf space, and lifted margin safely. The board wanted a decision within nine months, before the next review.
MMA APPROACH
MMA benchmarked nine bakers and brands on ranges, texture, and retailer programs, interviewed retail category buyers, dietitians, and shoppers about light bread purchase drivers, and modeled the economics of a protein line, enzyme partnerships, private label light contracts, and ingredient contracts under bull, base, and bear scenarios. Analysts also reviewed the client's plant records.
KEY FINDINGS
  1. A high-protein line costing about $5 million (client-reported, unverified by MMA) would reach 9% of revenue within three years at gross margins near 40%.
  2. Enzyme and fibre partnerships would cut texture complaints from 12% to 5% and lift repeat rates by ten points, according to trial data.
  3. Private label light contracts with two retailers would cover 14% of volume and fill plant capacity, based on retailer discussions and pricing tests.
  4. Protein and fibre contracts covering 60% of needs would cut spot exposure, though they needed quality agreements and dual sourcing in the first year.
CLIENT PROFILE
The client is a mid-sized European regional bakery with three plants and roughly $380 million in annual revenue (client-reported, unverified by MMA), selling sliced bread, buns, and private label loaves through supermarkets. Gross margin sat near 25% (client-reported, unverified by MMA), and private label bread had taken share from its brands for three consecutive years.
STRATEGIC CHALLENGE
Standard bread volumes were falling, two retailers asked for protein and light bread ranges the client did not have, texture complaints on earlier light products ran at 12%, and larger competitors were launching calorie-labeled brands. Leadership needed a plan that justified protein and enzyme investment, protected shelf space, and lifted margin safely. The board wanted a decision within nine months, before the next review.
MMA APPROACH
MMA benchmarked nine bakers and brands on ranges, texture, and retailer programs, interviewed retail category buyers, dietitians, and shoppers about light bread purchase drivers, and modeled the economics of a protein line, enzyme partnerships, private label light contracts, and ingredient contracts under bull, base, and bear scenarios. Analysts also reviewed the client's plant records.
KEY FINDINGS
  1. A high-protein line costing about $5 million (client-reported, unverified by MMA) would reach 9% of revenue within three years at gross margins near 40%.
  2. Enzyme and fibre partnerships would cut texture complaints from 12% to 5% and lift repeat rates by ten points, according to trial data.
  3. Private label light contracts with two retailers would cover 14% of volume and fill plant capacity, based on retailer discussions and pricing tests.
  4. Protein and fibre contracts covering 60% of needs would cut spot exposure, though they needed quality agreements and dual sourcing in the first year.
RECOMMENDED STRATEGY
Phase 1: Phase 1 (Months 1-6): Sign enzyme and fibre partnerships, trial protein recipes, and begin protein line design work at once this year. Phase 2: Phase 2 (Months 7-18): Build the protein line, sign private label light contracts with two retailers, and launch calorie-labeled brands this year. Phase 3: Phase 3 (Months 19-30): Scale premium volume, add resistant starch lines, and review pricing formulas each quarter with all major retailers.
OUTCOME
Within 30 months, protein, fibre, and private label light lines reached about 27% of revenue, and gross margin rose from 25% to about 32% (client-reported, unverified by MMA). Texture complaints fell sharply after enzyme partnerships, two retailers signed three-year programs, and the board approved a second protein line for the following year.

Frequently Asked Questions

Foundational context covering the market sizes, CAGR, scope, country, region and competition that inform every finding below. This section is provided to cover basics and most often pre-purchase conversations, answered from the MMA Primary Research Dataset.

What is the current size of the Low Calorie Bread Market?

The global low calorie bread market was valued at $6.8 billion in 2025. This covers thin-sliced, high-fibre, high-protein, and low-carbohydrate breads sold through retail, in-store, and foodservice channels.

How large will the Low Calorie Bread Market be by 2036?

MMA projects the market will reach approximately $13.2 billion by 2036. This represents cumulative growth of roughly $6.0 billion over the full ten-year forecast window.

What is the CAGR for the Low Calorie Bread Market 2026 to 2036?

The market is forecast to grow at a 6.2% compound annual rate between 2026 and 2036. The bull case reaches 7.5% while the bear case falls to 4.9%.

Which segment is growing fastest?

High-Protein Low-Carbohydrate Breads is the fastest-growing segment at 10.0% CAGR, roughly 1.61 times the overall market rate. Resistant Starch and Fibre-Enriched Breads follows as the second-fastest segment at 8.1% CAGR each year.

Who are the major companies in the Low Calorie Bread Market?

Leading companies include Grupo Bimbo, Flowers Foods, Warburtons, Hovis, and Lantmannen Unibake. These five bakers together hold an estimated 34% of total global market revenue, based on MMA analysis of company disclosures.

Which country is growing fastest?

India is the fastest-growing major market, expanding at approximately 9.2% CAGR each year. Rising health awareness and premium packaged bread demand in cities are driving this above-market growth across the country.

Report Segmentation Architecture

The full report scope spans multiple orthogonal segmentation dimensions, with cross-tabulated demand data provided for each dimension pair. Coverage extends further to regional breakdowns, trend trajectories, and the competitive detail needed to support segment-level decision-making.

By Primary Market Dimension

  • High-Protein Low-Carbohydrate Breads
  • Resistant Starch and Fibre-Enriched Breads
  • Thin-Sliced and Portion Breads
  • Low-Calorie Wraps and Flatbreads
  • Aerated Light Breads
  • High-Fibre Whole-Grain Light Breads

By End-Use Industry

  • Household Retail Consumption
  • Sandwich Chains and Cafes
  • Supermarket In-Store Bakeries
  • Institutional Catering
  • Online Grocery Delivery

By Commercial Dimension

  • Branded Retail Sales
  • Private Label Programs
  • Foodservice Supply Contracts
  • Direct-to-Consumer Subscriptions

By Region

  • North America
  • Western Europe
  • East Asia
  • South Asia and Pacific
  • Latin America
  • Middle East and Africa
  • Eastern Europe

Scope, Methodology, and Coverage

Every figure in this report is reproducible from documented input assumptions. The scope below maps the historical period, the forecast horizon, the segmentation dimensions, and the countries covered, alongside the underlying primary and qualitative methodology.
Historical Period
2020 to 2025
Forecast Period
2026 to 2036
Base Year
2025 (USD billions; MMA Primary Research Dataset, September 2026)
Market Definition
Low calorie bread comprises packaged and bakery bread, rolls, and wraps formulated to deliver fewer calories per serving than conventional equivalents, through thin slices, added fibre and protein, aeration, or reduced-carbohydrate recipes, including high-protein, high-fibre, and resistant starch breads, sold through retail, in-store, and foodservice channels. The scope excludes conventional bread, diabetic-specific bakery, sweet bakery, crackers, and bread ingredients sold separately.
Quantitative Units
USD billions (current prices); million loaves for volume references
Segmentation Dimensions
By Formulation Route; By End-Use Industry; By Commercial Dimension; By Region
Regions Covered
North America, Western Europe, East Asia, South Asia and Pacific, Latin America, Middle East and Africa, Eastern Europe
Countries Covered
USA, Canada, Mexico, Brazil, Argentina, Chile, UK, Germany, France, Sweden, Netherlands, Poland, Czechia, Turkey, UAE, Saudi Arabia, Israel, South Africa, China, Japan, South Korea, India, Australia, and additional markets relevant to this sector
Key Companies Profiled
Grupo Bimbo, Flowers Foods, Warburtons, Hovis, Lantmannen Unibake, Pepperidge Farm, Aryzta, Harry-Brot, Mestemacher, Wasa, Vandemoortele, Britannia Industries, Yamazaki Baking, Pasco Shikishima, Tiger Brands, Sola Nutrition, Carbonaut, Julian Bakery, Barilla Group, Brioche Pasquier
Quantitative Methodology
Primary survey, n=3,800 respondents, Q4 2025, six countries; demand-side model with trade association cross-validation
Qualitative Methodology
47 expert interviews, Q4 2025; applied to validate demand model assumptions, identify emerging dynamics, and assess competitive positioning
Report Format
PDF and XLSX data workbook (Word format preview document)
Publisher
Market Minds Advisory
Report Code
MMA-2026-AGR-338
Published
September 2026
Contact
sales@marketmindsadvisory.com | www.marketmindsadvisory.com

Purchase the full Low Calorie Bread Market Report (2026 to 2036).

The full report delivers a detailed assessment of global low calorie bread demand, formulation mix, and competitive positioning through 2036. It includes segment forecasts by formulation route, country-level data for all seven world regions, and profiles of the twenty companies most relevant to light bread. Analysts also receive input cost modeling and portfolio margin benchmarking built from MMA's primary research dataset. A scenario planning module lets subscribers stress-test bull and bear assumptions against ingredient prices and labeling policy outcomes. Quarterly updates keep the whole dataset current throughout the subscription year for every subscriber.
Ten-year segment and regional demand forecasts
Flour, protein, and fibre price tracking
Competitive benchmarking of top twenty bakers
Calorie claim and labeling rule modeling
Regional demand mechanism comparative analysis included
Quarterly primary survey data update access

Built For The People Who Decide

From boardroom strategy to bench-side execution, this report is read cover-to-cover by leaders shaping the next decade of their industry, turning demand scenarios, market dynamics and valuation benchmarks into decisions.
CXOs/ Presidents/ VPs/ Managers
M&A and Corporate Development
Strategy Teams and R&D Heads
Procurement and Product Directors
Regulatory and Compliance Leaders
Investor Relations and Equity Analysts