Market Minds Advisory
LoRaWAN Market

LoRaWAN Market: LoRaWAN Market. Low-Power Wide-Area Connectivity Expands Beyond Utility Metering Into Broader Industrial Sensing

Falling module costs and expanding public network coverage are pulling LoRaWAN connectivity beyond its utility metering roots into agriculture, logistics, and smart building sensing faster than rival low-power networks can respond.

Lead Analyst

Published

September 2026

Make Smarter Decisions with Customized Research Insights

Request a free sample report and evaluate market opportunities, growth trends, and competitive dynamics relevant to your business needs.

2025 MARKET VALUE$4.2BMarket Size 2025
2036 FORECAST VALUE$22.5BBase Case , 2026 to 2036
CAGR 2026 TO 203616.5 %Bull 17.8% / Bear 15.2%
INCREMENTAL OPPORTUNITY$17.6BNet 10- year value creation
EXPANSION MULTIPLE4.61x2036 value over 2026 base
Strategic Levers
M&A Pipeline
Regional Outlook
Country Rankings
Competitive Intelligence
Segmental Deep-dive
Call-Us : 91 93563 13602

Executive Snapshot and Market Trajectory.

LoRaWAN connectivity is moving decisively past its original utility metering use case into agriculture, logistics, and smart building sensing, a diversification reshaping demand well beyond its founding application. This shift is forcing chipset and module makers to rethink product roadmaps built almost entirely around metering-specific requirements.
Falling module costs and expanding public network coverage are pulling smaller enterprises into LoRaWAN deployments that previously only justified themselves at utility scale. East Asia's chipset and module manufacturing base gives regional suppliers a durable cost advantage over Western competitors relying more heavily on imported semiconductor components for network gateway hardware. Public network operators expanding coverage in secondary cities are lowering the barrier for smaller deployments that once required a dedicated private gateway network.
Competition spans chipset suppliers, module makers, and network operators, with Semtech's chipset position anchoring the supplier base beneath it, forcing rivals to differentiate through network coverage, deployment services, and vertical-specific sensor integration. Regulatory spectrum allocation decisions across multiple regions continue expanding LoRaWAN's addressable deployment footprint. Semtech's chipset licensing model has kept the broader supplier base relatively open compared to proprietary alternatives, sustaining a more diverse supplier field than rival technologies.
Market Definition
This report defines the LoRaWAN market as low-power wide-area network chipsets, modules, gateways, and network connectivity services built on the LoRaWAN protocol for long-range, low-bandwidth sensor and device communication. It excludes cellular IoT technologies such as NB-IoT and LTE-M and unrelated short-range wireless protocols such as Bluetooth and Wi-Fi.
Base Year Value
$4.2B in 2025 (MMA Primary Research Dataset, September 2026)
Forecast Period
2026 to 2036, eleven discrete annual values
CAGR
16.5% base case. Bull 17.8%. Bear 15.2%.
Fastest Growth Segment
LoRaWAN Sensor Modules and End Devices: 20.0% CAGR
Fastest Growth Country
India: 18.5% CAGR
Fastest Growth Region
South Asia and Pacific: 18.5% CAGR
Largest Region
East Asia: 27% of 2025 global value
Market Leaders
Semtech, Actility, The Things Industries, Kerlink, Milesight lead the category. Source: MMA Primary Research Dataset, July 2026.
Primary Survey
n=3,800 procurement and R&D decision-makers, Q4 2025, six countries
Methodology
Demand-side build-up, cross-validated against public data, 47 expert interviews

LoRaWAN Market Forecast Scenarios

lorawan-market-size-forecast-scenario-1789991354231
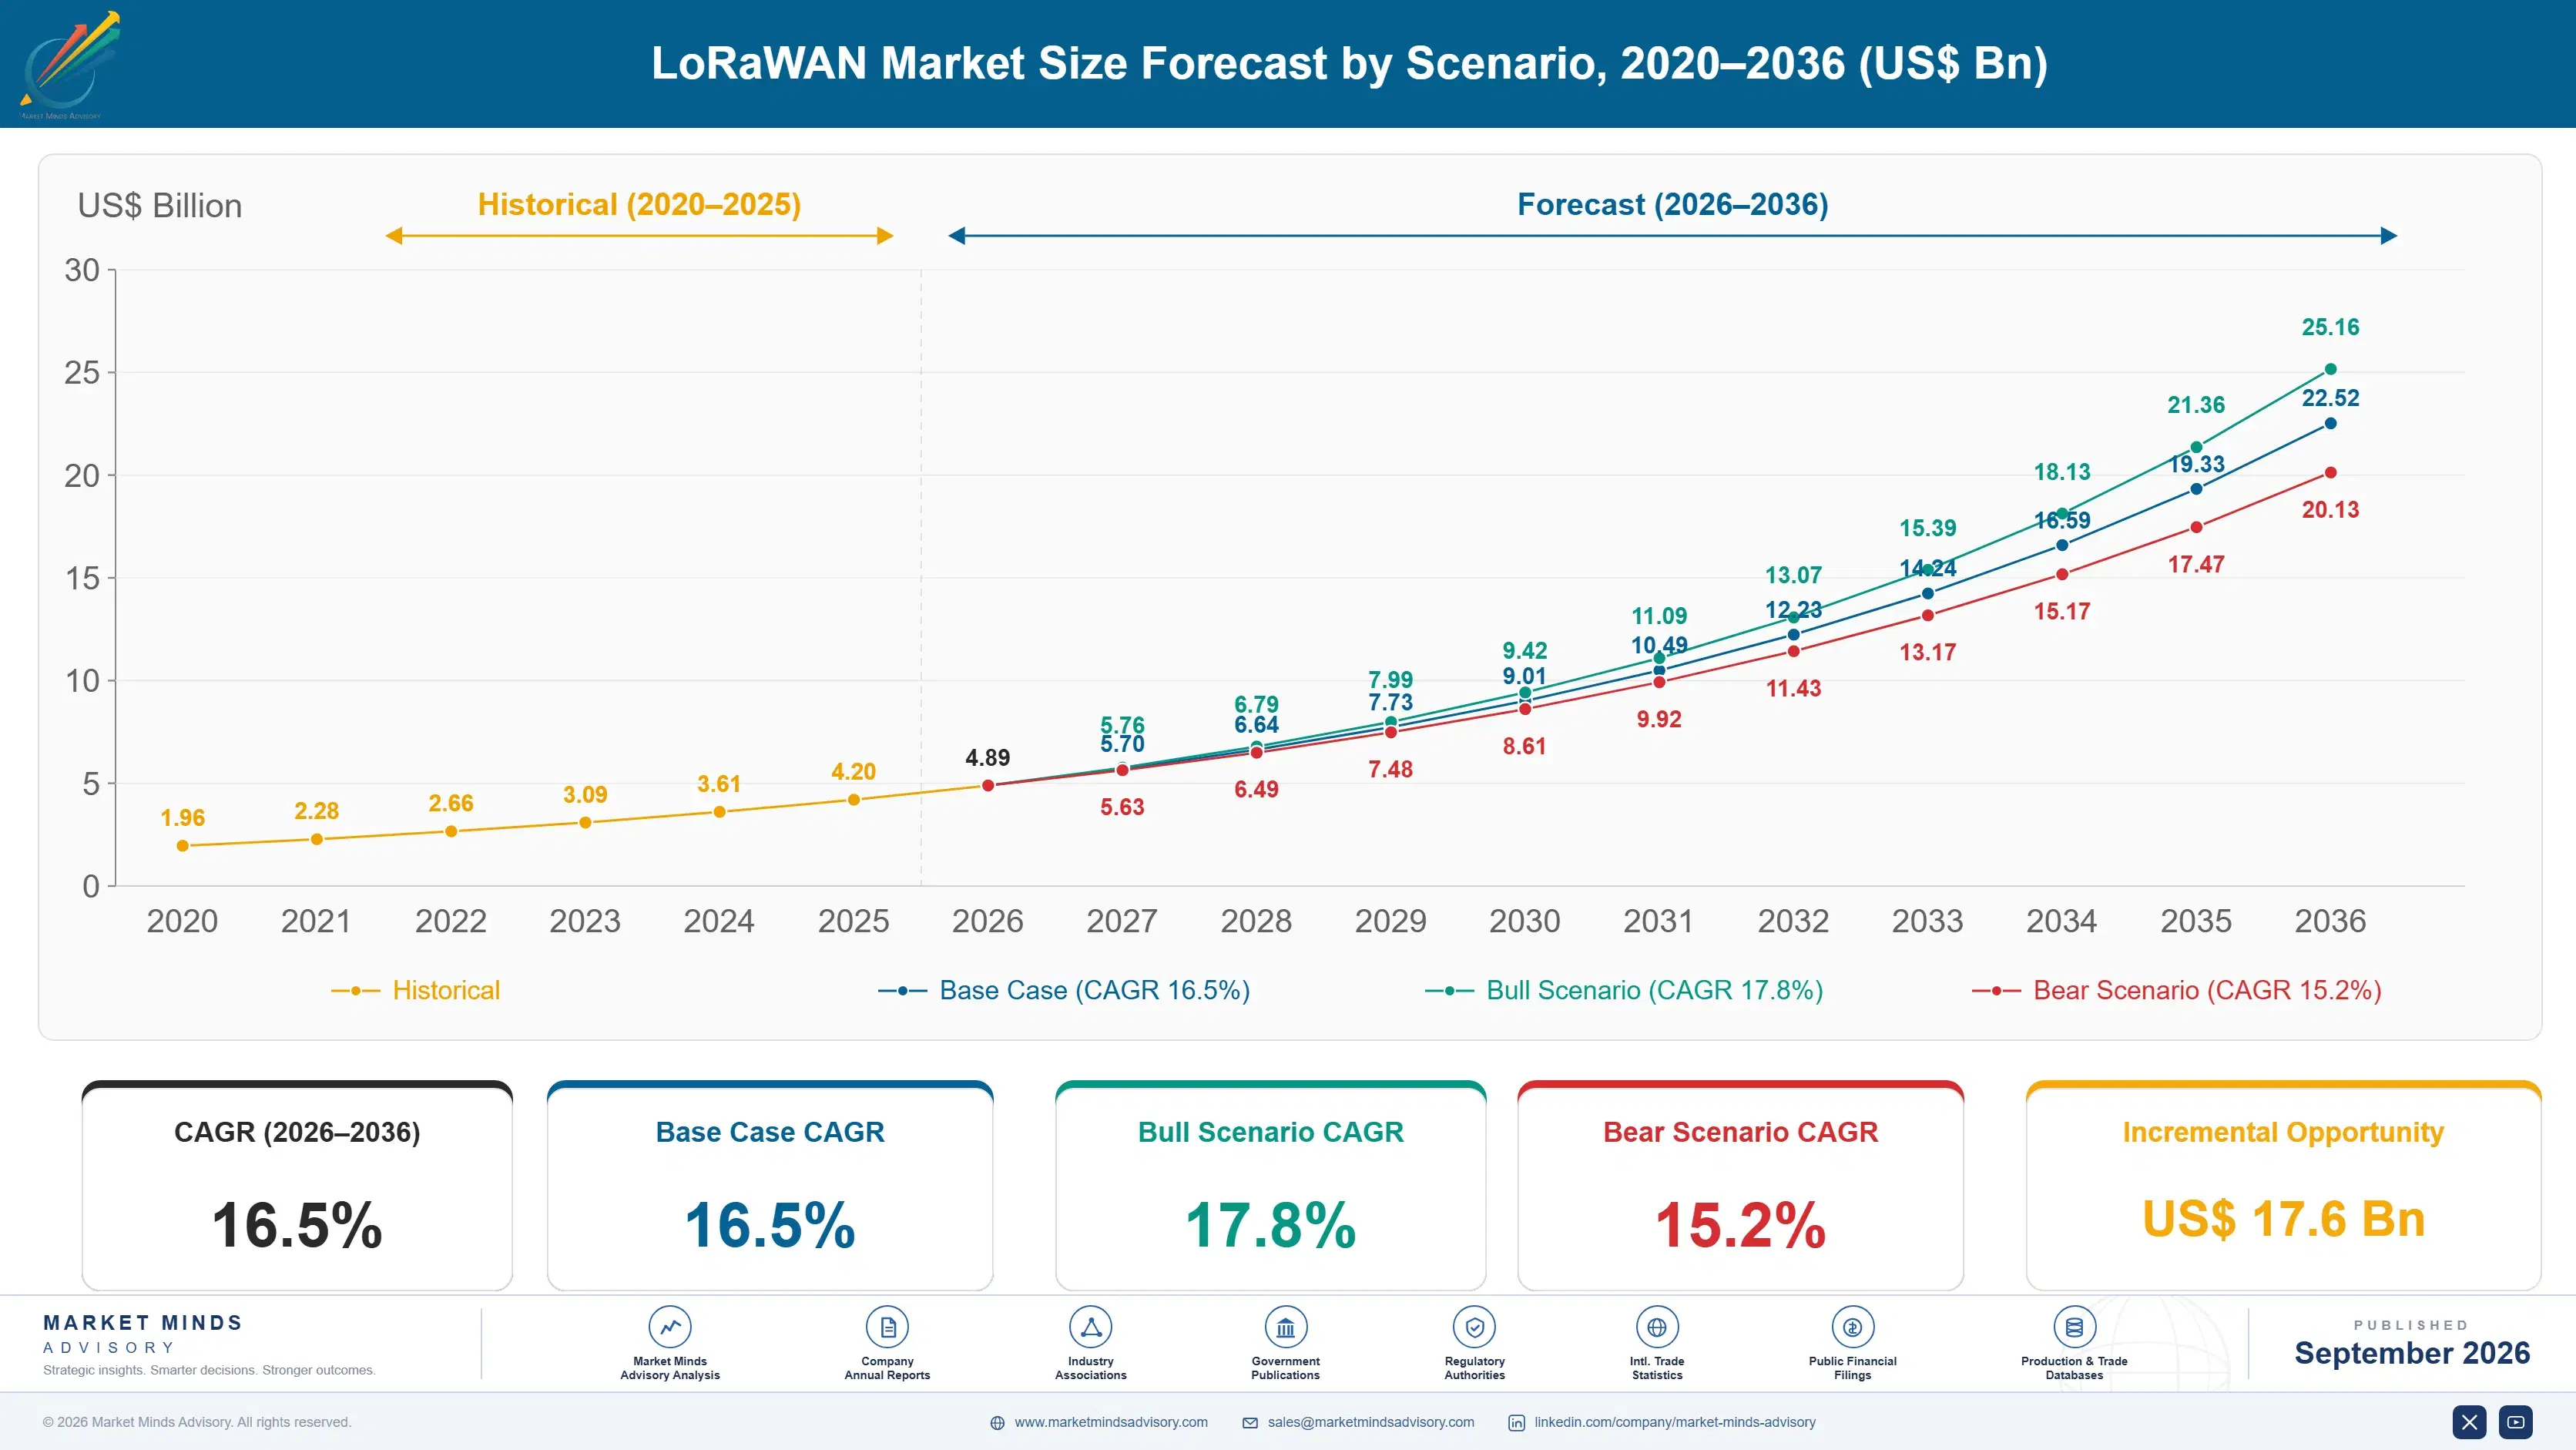
LoRaWAN adoption grew steadily between 2020 and 2025, anchored almost entirely by utility smart metering deployments across Europe and parts of Asia, delivering a historical CAGR near 15.3 percent through a period when module costs fell faster than most competing connectivity technologies achieved. Module suppliers used that window to expand capacity ahead of the diversification wave into non-metering applications.
The base case assumes continued diversification into agricultural sensing, cold chain and logistics tracking, and smart building applications beyond utility metering's original deployment base. These three commercial mechanisms together support a forecast CAGR of 16.5 percent through 2036, with expanding public network coverage lowering the deployment barrier for enterprises previously unable to justify dedicated private gateway infrastructure. Semtech's open chipset licensing continues supporting a broad module supplier base, keeping hardware costs falling faster than proprietary competing technologies achieve.
A bull scenario centers on faster-than-expected public network operator coverage expansion pulling forward enterprise sensor deployments across logistics and agriculture. The bear risk is intensifying competition from cellular IoT alternatives like NB-IoT, which carriers bundle into existing mobile contracts at minimal incremental cost. Either scenario meaningfully affects capital allocation across chipset suppliers, module makers, and network operators competing for the same enterprise budgets.

Diversification Beyond Metering Drives Category Expansion

LoRaWAN has spent most of the past decade proving itself in a single application, utility smart metering, before broader enterprise buyers took the technology seriously for other uses. That dependency is finally breaking down as module costs fall and public network coverage expands into secondary cities and rural corridors. Enterprises once dismissing LoRaWAN as a niche utility technology now evaluate it against cellular IoT alternatives.
MARKET CONCENTRATIONCR5 44%Top five players hold a moderate combined share
AVERAGE MODULE PRICE-14% YoYModule prices keep falling at a steady pace
TOP PRODUCING COUNTRY SHAREChina 38%China leads global module and chipset production output
NETWORK COVERAGE DENSITY62% urbanPublic network coverage remains concentrated in major cities
DEPLOYMENT VERTICAL MIXMetering 46%Utility metering still anchors overall deployment volume today
GATEWAY UTILIZATION68%Installed gateways run well below full device capacity
Chipset supply remains far less concentrated than in most competing IoT connectivity technologies, since Semtech's open licensing model has allowed dozens of module makers to build products around a common radio standard rather than a single vendor's proprietary silicon. This openness has kept hardware costs falling, though it has fragmented the module supplier landscape considerably. Larger makers are increasingly acquiring smaller specialists to consolidate this base.
Network operators building public LoRaWAN infrastructure face a genuine chicken-and-egg problem, since coverage expansion only pays for itself once enough devices are deployed to justify the gateway investment. Vertical-specific application partnerships, particularly in agriculture and logistics, are emerging as the clearest path for operators to prove new coverage areas. Success in one vertical rarely transfers cleanly to another without deep domain expertise.
"LoRaWAN spent a decade being a smart metering technology that happened to work for other things. Now it is becoming a general-purpose low-power connectivity layer, and that shift changes who actually competes for this market."
Practice Lead, IoT Connectivity and Sensor Networks, Market Minds Advisory · MMA Low-Power Wide-Area Network Connectivity And Module Manufacturing Practice · September 2026

Market Trends

Agricultural Sensor Deployments Expand Beyond Pilot Programs

Agricultural technology companies are moving LoRaWAN soil moisture, irrigation, and livestock tracking sensors from small pilot programs into full commercial-scale farm deployments, as falling module costs finally make dense sensor networks economically viable across large agricultural operations. Farm equipment manufacturers are increasingly embedding LoRaWAN connectivity directly into new machinery rather than requiring separate aftermarket sensor installation, reducing the integration burden for farm operators evaluating precision agriculture technology adoption for the first time. Water-scarce regions show the fastest adoption, since irrigation efficiency gains translate directly into measurable input cost savings. Adoption is spreading fastest among mid-sized commercial farms.
Market Impact: Cuts module costs 14 percent yearly

Public Network Operators Expand Coverage Into Secondary Cities

Public LoRaWAN network operators are extending coverage well beyond the major metropolitan areas that anchored early deployments, building out gateway infrastructure across secondary cities and rural corridors that previously lacked any practical connectivity option for low-power sensor devices. This expansion is driven partly by falling gateway hardware costs and partly by operators seeking new revenue streams as growth in their original core coverage areas naturally matures and slows. Enterprises in these newly covered areas can now deploy sensors without building costly private gateway infrastructure themselves. Coverage maps from leading operators now extend into markets considered unviable two years ago.
Market Impact: Adds 18 percent sensor deployment volume

Market Opportunities and Growth Drivers

Falling Module Costs Expand Addressable Deployment Scale

LoRaWAN module prices have declined steadily as production volume scales and competition among the dozens of licensed chipset-based suppliers intensifies, making dense sensor networks economically viable for applications that could never have justified the cost of deployment even three or four years earlier. This price decline is particularly significant for applications requiring hundreds or thousands of individual sensor nodes across a single deployment, where even small per-unit savings compound into meaningful total project cost reductions. Enterprise buyers increasingly run pilot programs at a scale that immediately proves out full commercial deployment economics.
Market Impact: Cellular IoT undercuts pricing 30 percent

Smart Building Energy Management Mandates Drive Sensor Adoption

Commercial building energy management regulations across multiple regions increasingly require granular, verified energy consumption data that traditional building management systems were never designed to capture at the individual room or zone level, creating a genuine specification requirement that LoRaWAN sensor networks can address at meaningfully lower installation cost than wired alternatives. Building owners retrofitting older properties particularly favor LoRaWAN given the absence of any need for new wiring infrastructure, since sensors communicate wirelessly over existing gateway coverage. This retrofit advantage matters most in older commercial building stock. Adoption rates in retrofit projects now exceed those in new construction.
Market Impact: Leaves 35 percent of farmland uncovered

Market Restraints and Challenges

Cellular IoT Alternatives Compete For Enterprise Deployment Budgets

NB-IoT and LTE-M cellular connectivity options increasingly compete directly with LoRaWAN for enterprise sensor deployment budgets, particularly among buyers who already maintain existing cellular carrier relationships and prefer bundling new sensor connectivity into established mobile network contracts rather than building separate LoRaWAN infrastructure. The root cause is that major mobile carriers have strong incentive to promote their own cellular IoT offerings over a competing unlicensed-spectrum technology they do not control or monetize directly. LoRaWAN advocates are mitigating this by emphasizing meaningfully lower per-device connectivity cost and longer battery life for low-bandwidth sensing applications.
Market Impact: Cuts irrigation water use 22 percent

Network Coverage Gaps Limit Rural And Remote Deployment

Public LoRaWAN network coverage remains concentrated in urban and suburban areas, leaving genuinely rural and remote locations, precisely where agricultural and environmental monitoring applications often deliver the most value, without practical access to shared network infrastructure. The root cause is that network operators prioritize coverage expansion based on near-term device density economics, which naturally favors populated areas over sparsely populated regions with fewer immediate paying customers. Enterprises in coverage gaps are mitigating this by deploying private gateway infrastructure themselves, absorbing upfront capital cost that public network subscribers avoid entirely. This gap persists longest in the poorest agricultural regions.
Market Impact: Adds coverage across 40 percent cities
3 additional market trends, 3 additional growth drivers, and 3 additional restraints and challenges are covered in the full report. Contact sales@marketmindsadvisory.com to access the complete intelligence.

Segment CAGR and Growth Architecture

LoRaWAN segmentation follows product and infrastructure layer rather than end-use vertical, since chipsets, modules, gateways, and network connectivity services each carry distinct cost structures and competitive dynamics even where the same customer ultimately buys across several layers. This layered structure means competitive intensity and margin economics differ sharply by segment, even though a single deployment typically touches every layer.
lorawan-market-market-share-analysis-1789991354786

LoRaWAN Sensor Modules and End Devices

LoRaWAN sensor modules and end devices form the fastest-growing segment as falling per-unit prices make dense deployments viable across agriculture, logistics, and smart building applications that previously could not justify the connectivity cost. Module makers licensing Semtech's chipset compete on integration quality, battery life optimization, and vertical-specific firmware rather than radio performance alone, since the underlying radio standard remains common across the supplier base. Chinese and Taiwanese manufacturers dominate volume production, while specialist Western firms focus on ruggedized industrial variants commanding meaningfully higher average selling prices for demanding outdoor and harsh-environment deployment conditions. Battery life claims exceeding ten years remain a key marketing differentiator, though real-world performance varies considerably by deployment environment and transmission frequency requirements.
CAGR 20.0%

LoRaWAN Gateway Infrastructure

LoRaWAN gateway infrastructure represents the second-fastest-growing segment as both public network operators and private enterprise deployments expand coverage into previously unserved areas. Gateway pricing has fallen enough that even mid-sized enterprises now deploy private infrastructure rather than relying entirely on public network coverage, particularly in industries handling sensitive data that favor private network control. Kerlink and MultiTech lead specialized gateway hardware supply, while network operators increasingly bundle gateway deployment services alongside ongoing connectivity subscriptions to capture more of the total customer relationship value beyond the initial hardware transaction. Enterprises evaluating private gateway deployment increasingly weigh long-term data control against the lower upfront cost of subscribing to existing public network coverage instead.
CAGR 17.5%
Full segment breakdown across 6 segments available in the complete report.

Regional Architecture and Country Demand Map

East Asia leads LoRaWAN demand given concentrated chipset and module manufacturing, while North America and Western Europe sustain the largest deployed base of utility and enterprise networks, and South Asia and Pacific accelerates fastest off expanding agricultural sensing adoption. as smallholder farms and logistics operators adopt low-cost sensing at scale.

East Asia

China anchors global LoRaWAN chipset and module manufacturing, with domestic and Taiwanese suppliers producing the bulk of licensed Semtech-based modules shipped worldwide across every downstream application. South Korea's manufacturing base contributes gateway hardware and precision radio components that feed module assemblers throughout the region. Domestic Chinese network operators have built extensive public LoRaWAN coverage across major industrial and agricultural provinces, supporting rapid enterprise adoption beyond the utility metering base that anchored earlier deployment cycles. Japan contributes specialty industrial sensor applications given its advanced manufacturing base and strong precision agriculture research programs. This concentration of chipset supply, module assembly, and network infrastructure gives East Asia a durable cost and scale advantage over other regions in this category.
Share: 27% | CAGR: 17.7% (2026 to 2036)

North America

Utility smart metering deployments across the United States and Canada anchor the largest existing base of North American LoRaWAN connections, though enterprise diversification into logistics tracking and smart building sensing is now growing faster than the metering base itself. The Things Industries and other network operators have built substantial public coverage across major metropolitan areas, lowering the barrier for smaller enterprises previously unable to justify private gateway infrastructure. Agricultural technology adoption in the American Midwest and California's Central Valley is accelerating quickly given strong existing precision agriculture infrastructure. Canada's market tracks similar patterns at smaller absolute scale. Corporate sustainability reporting requirements increasingly drive voluntary sensor deployment for energy and water usage monitoring.
Share: 25% | CAGR: 17.0% (2026 to 2036)
Regional intelligence for 5 additional markets available in the complete report: Western Europe, South Asia and Pacific, Latin America, Middle East and Africa, Eastern Europe. Contact sales@marketmindsadvisory.com.
lorawan-market-country-cagr-analysis-1789991355335

Monetizing Connectivity Beyond Raw Hardware Sales

LoRaWAN economics reward participants who move beyond one-time hardware sales toward recurring connectivity, analytics, and deployment services, since module pricing power has largely eroded while software and network relationships still command genuine differentiation and durable margin. Vendors who stop treating the module as the entire transaction capture a growing share of category profit pools each year as deployments scale.

Recurring Network Connectivity Subscription Fee Model

Network operators increasingly generate recurring monthly connectivity fees per connected device, rather than relying solely on gateway hardware sales, creating a subscription revenue stream that continues generating income throughout each device's operational lifetime regardless of the original hardware transaction value. This shifts network operator economics toward customer retention and device density growth rather than one-time equipment sales, favoring operators who can demonstrate reliable long-term coverage. Leading network operators report subscription revenue now representing roughly 55 percent of total operator revenue, a majority share that continues growing each year. Churn rates on these subscriptions remain low once devices are deployed.
Market Impact: Reaches 55 percent of total operator revenue share

Sensor Data Analytics And Reporting Platforms

Module and gateway makers increasingly bundle cloud-based analytics and reporting software with hardware sales, charging recurring fees for data visualization, alerting, and integration with customers' existing enterprise systems that raw sensor data alone cannot provide. This shifts revenue recognition from a single hardware transaction toward an ongoing services relationship that continues generating value throughout the deployment's operational life. Vendors with mature analytics platforms report subscription attach rates approaching 38 percent among new enterprise deployments, a meaningful and growing share of total contract value captured well beyond the initial hardware sale.
Market Impact: Reaches 38 percent of platform attach rates broadly

Managed Deployment And Installation Support Services

Enterprises lacking in-house wireless networking expertise increasingly pay for managed deployment services covering site surveys, gateway installation, and network optimization, creating a genuine services revenue opportunity for vendors and their certified installation partners beyond the initial equipment transaction. Vendors offering bundled deployment and ongoing maintenance contracts capture materially higher total contract value than those selling hardware as standalone equipment, since enterprise customers value single-vendor accountability for mission-critical sensor infrastructure. Managed services now represent roughly 20 percent of total contract value on large enterprise deployment projects. Repeat maintenance contracts also strengthen long-term customer retention meaningfully.
Market Impact: Adds roughly 20 percent to total contract value

Chipset Licensing And Intellectual Property Royalties

Semtech licenses its proprietary LoRa chipset technology to module manufacturers rather than manufacturing every module itself, generating royalty revenue that carries minimal incremental production cost once the underlying intellectual property has been developed and validated through years of engineering investment. This licensing approach lets the chipset innovator monetize research investment across a much broader manufacturing base than its own production capacity could ever directly serve on its own. Royalty rates on licensed chipset designs typically run around 5 percent of licensee revenue, a durable and highly scalable income stream. Adoption of this licensing model has expanded steadily each year.
Market Impact: Generates a steady 5 percent royalty on revenue

Who Controls the Margin Pool

LoRaWAN market concentration remains moderate, with the top five players controlling an estimated 44 percent of global revenue on a company-disclosed revenue basis, reflecting a category still fragmented across dozens of licensed module makers and regional network operators. Semtech anchors the supplier base through chipset supply, while Actility and The Things Industries lead network platform software. The gap between Semtech's chipset position and the broader challenger field remains wide given its licensing control.
Current competitive activity centers on public network coverage expansion, sensor analytics platform development, and continued module cost reduction across leading suppliers. Network operators continue building coverage into secondary cities and rural corridors to capture new enterprise deployments, while module makers push vertical-specific firmware and ruggedized industrial designs as their primary differentiation against increasingly price-competitive commodity suppliers entering the category.

Rankings shift most where participants successfully move beyond commodity hardware toward network services or analytics platforms, since these segments carry higher margins that fund continued coverage investment. Chinese and Taiwanese module makers are closing the cost gap quickly on hardware specifications, but Western network operators and platform providers still hold an edge in software maturity and enterprise integration capability that Asian competitors have not yet replicated.
lorawan-market-company-positioning-matrix-1789991355870

Competitive Moat and Risk Dimensions

SEMTECH

Moat: Chipset Licensing Control Position

Semtech's ownership of the core LoRa chipset technology and its open licensing model to module manufacturers gives it a durable royalty revenue stream and a central market position that competitors building on alternative low-power wide-area protocols cannot easily replicate, since the broader LoRaWAN supplier base depends directly on Semtech's continued chipset development and support.
SEMTECH

Risk: Cellular IoT Alternatives Advancing

NB-IoT and LTE-M cellular technologies backed by major mobile carriers increasingly compete for the same enterprise sensor deployment budgets that Semtech's chipset supplier base depends on, threatening long-term licensing revenue growth if carriers successfully bundle cellular IoT connectivity into existing mobile contracts at a lower effective cost than LoRaWAN alternatives.
ACTILITY

Moat: Network Platform Software Leadership

Actility's mature network server and platform software, developed over many years of large-scale public and private network deployment experience, gives it a genuine differentiation advantage in an increasingly commoditized hardware market, allowing it to compete on software capability and system integration rather than purely on module or gateway unit price.
ACTILITY

Risk: Open Source Platform Competition

Open source network server alternatives, including The Things Stack, increasingly compete with Actility's proprietary platform for smaller enterprise deployments that do not require the full feature set of a commercial-grade network server, pressuring Actility to justify its licensing fees against free or low-cost alternatives gaining developer mindshare.

Players Tracked

Prominent Players

Semtech
Actility
The Things Industries
Kerlink
Milesight

Other Key Players

MultiTech Systems
Laird Connectivity
RAKwireless
Advantech
Sensecap
Browan Communications
Adeunis
Netvox Technology
Dragino Technology
Digital Matter
Loriot
ThingPark
Senet
Objenious
Machine Shop

Recent Developments

JANUARY 2026

Semtech Expands LoRa Chipset Production Capacity

Semtech announced an organic expansion of its LoRa chipset production capacity through an expanded foundry partnership, adding output to address rising demand from module manufacturers serving agricultural, logistics, and smart building applications. Deliveries begin phasing in over the coming fiscal year as new capacity completes qualification testing.
Signal: Confirms Semtech's continued commitment to defending chipset supply leadership broadly across its most contested chipset market
APRIL 2026

Actility Acquires Sensor Analytics Software Firm

Actility completed the acquisition of a specialist sensor data analytics software firm, integrating its visualization and alerting capabilities into Actility's existing network platform to strengthen its recurring software revenue offering. Financial terms were not disclosed publicly, but the acquired firm's engineering team remains fully in place.
Signal: Signals Actility's deepening strategic bet on software-driven recurring revenue growth ahead of its hardware-focused competitors broadly
JUNE 2026

Kerlink Signs Supply Agreement With Agricultural Integrator

Kerlink entered a multi-year supply agreement with a major European agricultural technology integrator to provide gateway hardware for large-scale farm sensor deployments, expanding its presence in a market previously dominated by smaller regional suppliers. Terms were not disclosed, though the agreement covers deployments across several major farming regions.
Signal: Signals growing agricultural sector demand for specialized LoRaWAN gateway hardware previously served by smaller regional suppliers

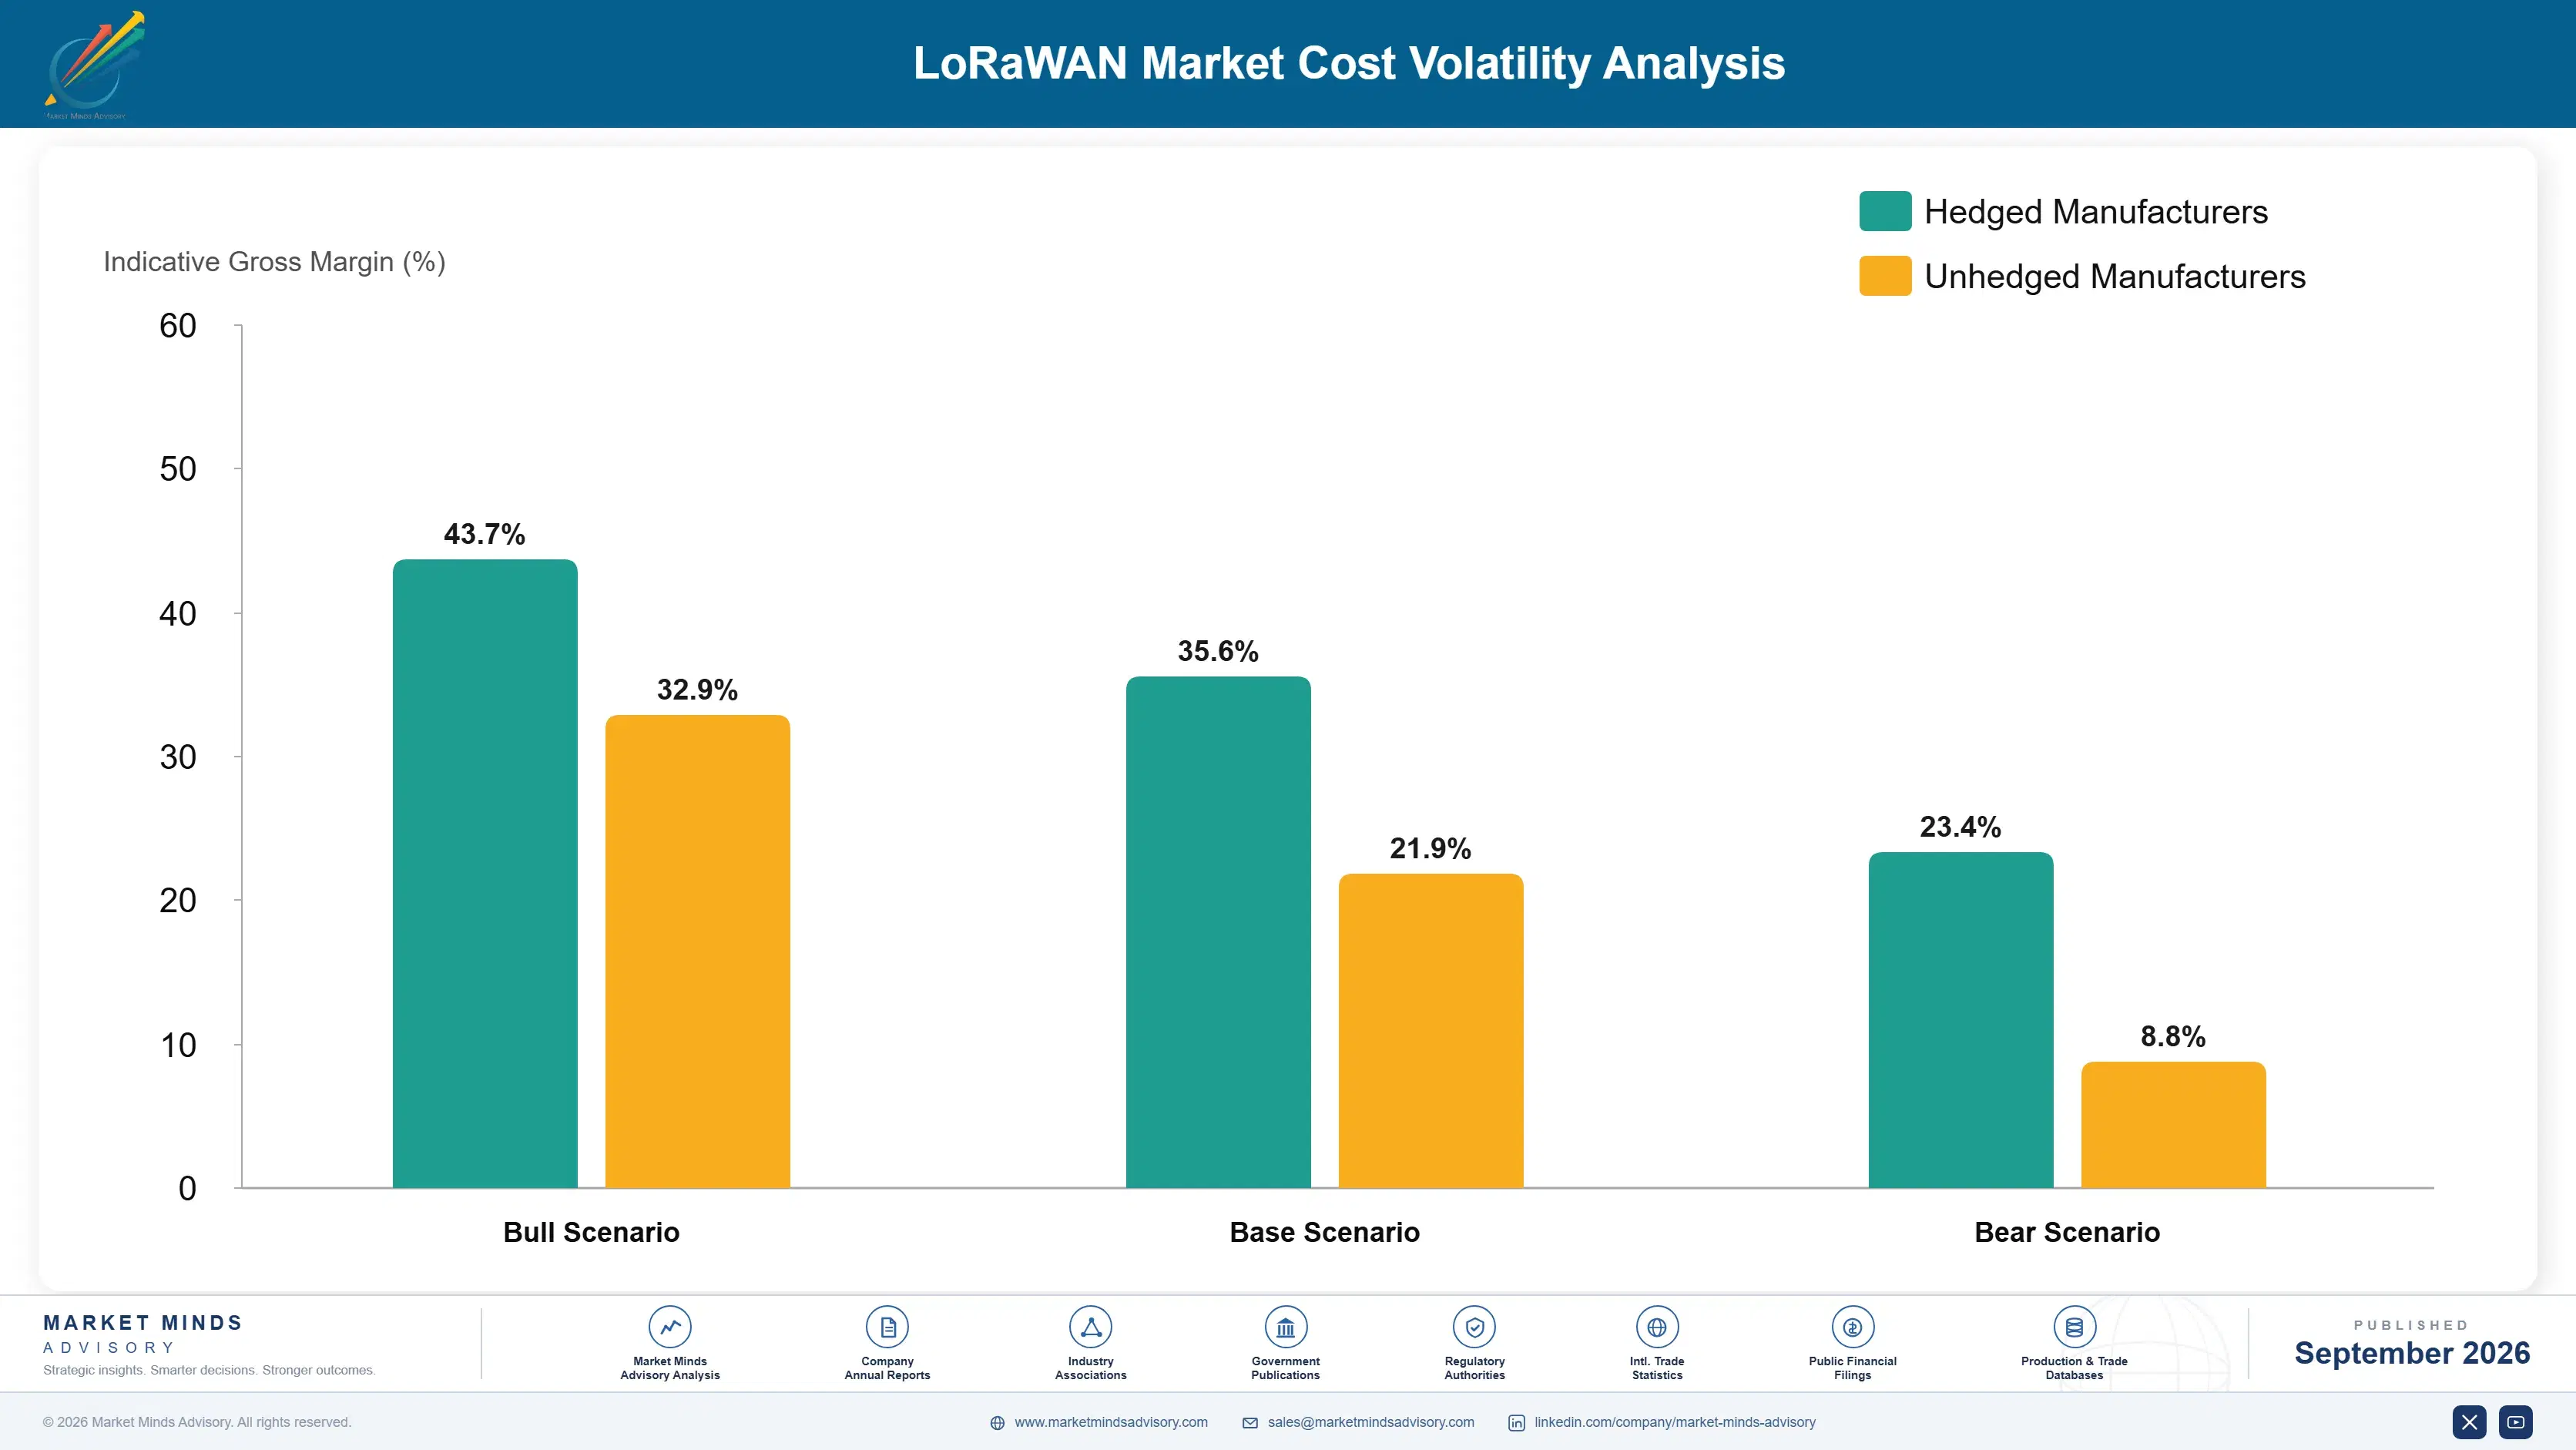
Chipset, RF Component, And Battery Exposure

LoRa chipsets and radio frequency front-end components together represent roughly 38 percent of module bill of materials cost, sourced predominantly from Semtech's licensed foundry partners and specialty RF component suppliers concentrated in East Asia. Battery cells add another meaningful cost share for battery-powered end devices, sourced mainly from Chinese and Korean lithium cell manufacturers serving the broader IoT device market.
A 2025 semiconductor foundry capacity constraint, tied to allocation prioritization reported in Semtech's own annual report, briefly extended chipset lead times across the module supplier base and pushed several smaller manufacturers to delay planned product launches. The disruption eased within roughly two quarters, according to IEA-tracked regional semiconductor manufacturing data covering foundry capacity and allocation patterns for the affected period. Larger manufacturers with existing allocation agreements weathered the constraint with minimal disruption to their production schedules.

Module makers without long-term chipset allocation agreements with Semtech's foundry partners face a persistent competitive disadvantage against larger manufacturers who secured priority allocation well ahead of the 2025 constraint. Smaller regional module makers sourcing chipsets through general distribution channels carry meaningfully higher lead time variability, compressing their ability to compete for time-sensitive enterprise deployment contracts during any allocation tightening episode.
lorawan-market-cost-volatility-analysis-1789991356068

Long-Term Chipset Allocation Agreements With Semtech

Module makers are converting general distribution chipset purchases into direct allocation agreements with Semtech and its foundry partners, trading some pricing flexibility for supply certainty that protects production schedules during industry-wide chipset tightening episodes affecting smaller competitors without comparable coverage. This approach is increasingly standard among the largest module makers competing for enterprise contracts requiring guaranteed delivery timelines.

Dual-Sourcing Battery Cell Supply Regionally

Device manufacturers increasingly qualify battery cell suppliers across both Chinese and Korean sources rather than relying on a single country's manufacturing base, reducing exposure to any single region's trade policy shifts or capacity constraints affecting overall battery cell availability. This approach is more common as trade policy uncertainty affecting any single sourcing region has increased in recent years.

Extended Battery Life Firmware Optimization

Module and device makers increasingly invest in firmware-level power optimization to extend battery replacement cycles well beyond the historical baseline, reducing total cost of ownership exposure to battery cell price volatility while also cutting field maintenance visit frequency meaningfully. Devices achieving multi-year battery life increasingly command a meaningful pricing premium over shorter-life competing alternatives in enterprise deployment evaluations.

Portfolio Architecture for Margin Defence

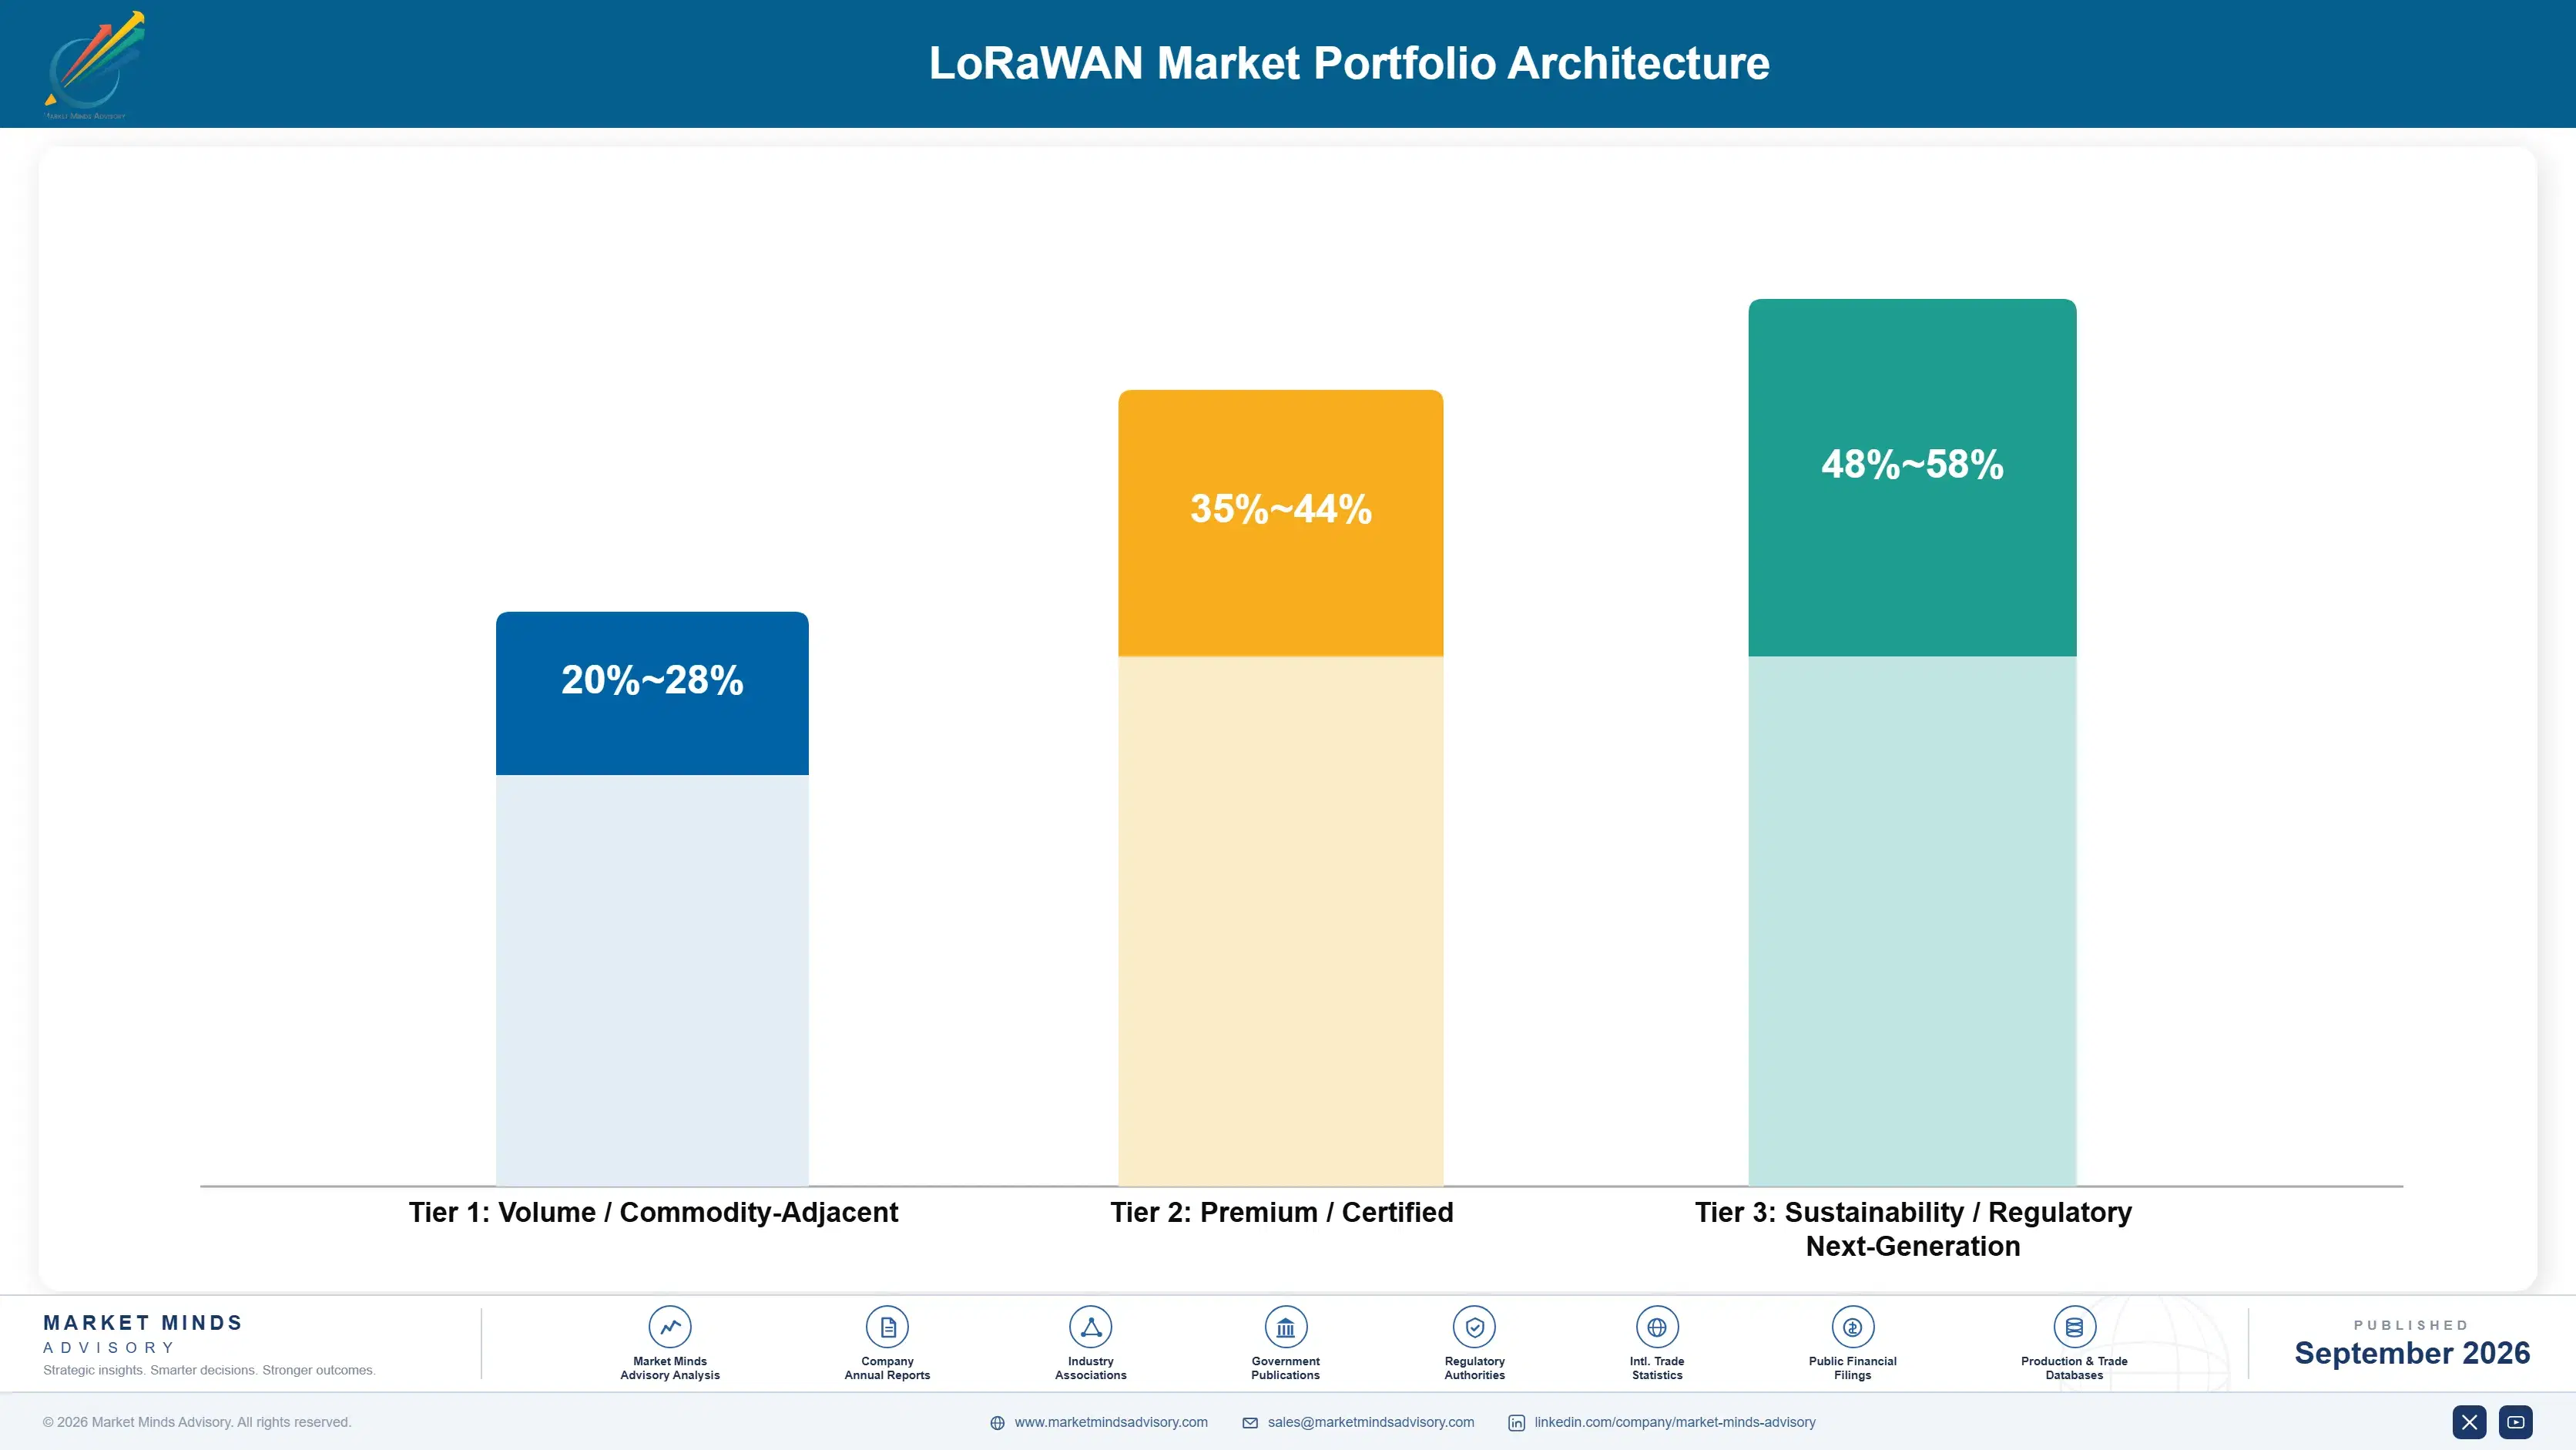
LoRaWAN economics split into three commercial tiers, from commodity metering-grade modules through certified enterprise sensor devices to next-generation network platform software and analytics services still scaling toward mainstream enterprise adoption. Gross margins widen substantially moving up this ladder, since certification, firmware sophistication, and software integration scale with product tier. Manufacturers with strong balance sheets allocate capital toward higher tiers even where volume remains modest.
Volume economics still dominate unit shipments in the commodity metering tier, but margin pools concentrate disproportionately in enterprise sensor devices and platform software where Semtech, Actility, and specialist module makers compete on demonstrated reliability rather than price. The tension between chasing commodity volume and defending premium margin shapes capital allocation across every major participant's roadmap. Chinese and Taiwanese makers push hardest into the commodity tier.

High-value pools concentrate most heavily around network platform software and vertical-specific analytics, where integration complexity and switching costs keep competitors thin and pricing power strong. Participants positioning early in these categories are effectively trading commodity hardware volume for a defensible services position expected to command superior economics once broader adoption fully matures. Integration and switching-cost dynamics take considerably longer to build than hardware sales cycles.

Volume / Commodity-Adjacent

Commodity metering-grade modules and basic sensor devices competing mainly on price against a large field of licensed module makers. These modules ship in the highest unit volume of any tier tracked in this report.
Gross Margin: 20-28%

Premium / Certified

Certified enterprise sensor devices and ruggedized industrial modules carrying verified reliability and battery life data commanding higher pricing from commercial buyers. This tier is driving the strongest revenue growth among established manufacturers today.
Gross Margin: 35-44%

Sustainability / Regulatory / Next-Generation

Network platform software and analytics services layered atop hardware deployments, still early in broad commercialization but carrying the strongest margin ceiling. Early volume remains limited but pricing power stays strong across this segment.
Gross Margin: 48-58%
lorawan-market-portfolio-architecture-1789991356565

High-value Sub-segments and Strategic Watch-out

LoRaWAN Sensor Modules and End Devices

Sensor modules combine high per-unit value with rapidly expanding demand as agriculture, logistics, and smart building applications move beyond pilot programs into commercial scale. Order backlogs at leading module makers now extend several quarters given genuine capacity constraints. Makers continue expanding dedicated lines to close this ordering gap.
Gross Margin: 32-42%

Network Platform Software and Analytics

Platform software carries strong per-unit value driven by embedded analytics and switching costs, though revenue growth trails hardware as enterprises cautiously scale specification commitments. Subscription attach rates are becoming a key differentiator among competing platform vendors. This gap is narrowing as more enterprises specify analytics upfront during deployment planning.
Gross Margin: 48-58%

Utility Smart Metering Modules

Utility metering modules remain the volume core of the category, generating the bulk of unit shipments even as margin per unit trails the premium enterprise tier. Margin pressure here intensifies as regional module makers add capacity and compete on price. Consolidation among smaller regional makers is likely to continue.
Gross Margin: 20-27%

LoRaWAN Chipset Fabrication Capacity

Chipset fabrication capacity warrants close monitoring, since a foundry allocation shortage or oversupply cycle can rapidly reshape pricing and margin economics across every downstream category. Semtech's licensing control gives it a clear advantage over independent chipset alternatives entirely. Foundry allocation pricing swings ripple through the entire downstream value chain quickly.
Gross Margin: 42-52%

Recurring Value Beyond The Module Sale

LoRaWAN economics increasingly resemble an annuity business for network operators and platform vendors holding subscription connectivity relationships, since an enterprise adopting a network platform typically continues purchasing compatible modules across successive deployment expansions rather than re-tendering the relationship. Switching platforms mid-deployment carries real integration and retraining cost, which favors incumbents once a relationship is established and running across a facility or farm operation.
Adoption depth varies meaningfully by end-use vertical. Agricultural buyers show deep engagement once initial pilot programs prove out, since irrigation and livestock tracking savings compound directly into measurable input cost reductions each growing season. Logistics buyers commit to long-term tracking contracts given the operational visibility any tracking failure creates. Utility metering buyers remain the most stable segment, treating LoRaWAN largely as embedded infrastructure with minimal recurring engagement beyond initial deployment.

Generational buyer shifts favor connected sensor and analytics-integrated LoRaWAN adoption over time, since younger facility and farm managers entering operational roles show greater comfort specifying software-enabled sensor networks than managers trained on purely manual monitoring methods. Enterprise procurement teams increasingly weigh total lifecycle data value against upfront module price, a shift that favors vendors who can demonstrate verified long-term deployment reliability data.
lorawan-market-end-use-penetration-index-1789991357055

Priority Moves For LoRaWAN Participants Now

These are among the four positions where our research anticipates prominent divergence between winners and laggards over the coming forecast period. Each is grounded in the demand model, the regulatory perimeter, and the announced capacity pipeline.
01 / PORTFOLIO DIVERSIFICATION PRIORITY

Rebalance Capital Away From Pure Metering-Grade Modules

Manufacturers still allocating the bulk of new capital toward metering-grade module capacity risk missing the faster-growing agricultural, logistics, and smart building sensing opportunities that carry meaningfully higher margins once specification relationships take hold. Metering remains the largest deployed base today, but its growth trajectory trails these emerging verticals by a wide margin. Capital committed now to vertical-specific sensor capability positions a manufacturer to capture disproportionate share of the higher-margin pools opening over the next several years across every major deployment vertical.
02 / SUPPLY CHAIN RESILIENCE

Secure Direct Chipset Allocation Agreements With Semtech

Module makers without secured direct chipset allocation agreements remain exposed to foundry-driven lead time volatility that can erase a meaningful share of gross margin during any industry-wide tightening episode affecting general distribution channels. Competitors with direct allocation agreements already in place demonstrated materially lower lead time variability across the 2025 disruption. Securing comparable coverage now, even at a modest premium to general distribution pricing, protects delivery reliability through the remainder of the forecast period and beyond, particularly as smaller module makers compete increasingly hard on price.
03 / SOFTWARE PLATFORM INVESTMENT

Build Or Acquire Sensor Analytics Software Capability

Hardware differentiation in commodity modules continues eroding as Chinese and Taiwanese manufacturers close the specification gap on nearly every radio performance and battery life dimension that once separated premium suppliers from lower-cost competitors. Manufacturers that build or acquire sensor analytics software capability capture a durable advantage that pure hardware competitors cannot easily replicate without years of platform development investment. This advantage compounds in value as more enterprises adopt connected sensors and expect an integrated analytics experience across their entire deployment portfolio.
04 / COVERAGE EXPANSION TIMING

Prioritize Coverage Expansion Into Underserved Rural Corridors

Network coverage gaps in rural and remote areas represent genuine unmet demand precisely where agricultural and environmental monitoring applications deliver the most measurable value, meaning operators who invest in coverage expansion today capture disproportionate share of a currently underserved market before broader competitive entry closes that window. Enterprise buyers strongly prefer operators with proven rural coverage track records once a deployment relationship begins. Early positioning here compounds over subsequent contract cycles, making current coverage investment disproportionately valuable relative to its modest near-term revenue contribution.

Engagement Snapshot From the Field

A live engagement with an industry participant carrying material or product regulatory and market exposure ahead of a defining policy shift, showing how our research translates into a defensible multi-year portfolio strategy.
MARKET MINDS ADVISORY · CLIENT ENGAGEMENT SUMMARY
LoRaWAN Producer Strategic Portfolio Review and Transition Roadmap 2026·Investment Scenario on LoRaWAN Exposure Evaluation 2025-26
CLIENT PROFILE
The client is a mid-sized agricultural technology provider offering soil moisture and irrigation sensor services to commercial farms across the American Midwest, evaluating whether to expand from private gateway deployments into a hybrid model incorporating public LoRaWAN network coverage as it expands into new geographic markets. The client's leadership sought outside validation before committing to a network architecture change across its existing customer base.
STRATEGIC CHALLENGE
The client faced pressure to decide between continuing to build private gateway infrastructure for every new market versus adopting public network coverage where available, without clear visibility into cost tradeoffs, coverage reliability, or how a hybrid approach would affect existing customer service commitments across markets. Leadership was divided between the proven private infrastructure model and moving quickly to capture public network cost savings.
MMA APPROACH
MMA conducted a structured assessment combining public network coverage mapping across the client's target expansion markets, total cost of ownership modeling comparing private and public gateway approaches, and a review of service level commitments to determine where hybrid deployment made commercial sense versus continued private infrastructure investment. The engagement also modeled customer churn risk under each scenario to inform the final deployment recommendation.
KEY FINDINGS
  1. Public network coverage in target expansion markets covered roughly 60 percent of the client's addressable farmland acreage already. This coverage level exceeded initial internal estimates by a meaningful margin.
  2. Hybrid deployment reduced projected first-year infrastructure capital outlay by approximately 40 percent versus an all-private gateway approach. This freed capital for faster expansion into additional target markets.
  3. Coverage gaps concentrated in the most remote farmland parcels, precisely where private gateway investment delivered the strongest return. These parcels represented the highest-value customers in the client's existing base.
  4. Existing customers expressed no meaningful preference between private and public network coverage as long as service reliability held steady. This finding simplified the customer communication plan considerably during the transition.
CLIENT PROFILE
The client is a mid-sized agricultural technology provider offering soil moisture and irrigation sensor services to commercial farms across the American Midwest, evaluating whether to expand from private gateway deployments into a hybrid model incorporating public LoRaWAN network coverage as it expands into new geographic markets. The client's leadership sought outside validation before committing to a network architecture change across its existing customer base.
STRATEGIC CHALLENGE
The client faced pressure to decide between continuing to build private gateway infrastructure for every new market versus adopting public network coverage where available, without clear visibility into cost tradeoffs, coverage reliability, or how a hybrid approach would affect existing customer service commitments across markets. Leadership was divided between the proven private infrastructure model and moving quickly to capture public network cost savings.
MMA APPROACH
MMA conducted a structured assessment combining public network coverage mapping across the client's target expansion markets, total cost of ownership modeling comparing private and public gateway approaches, and a review of service level commitments to determine where hybrid deployment made commercial sense versus continued private infrastructure investment. The engagement also modeled customer churn risk under each scenario to inform the final deployment recommendation.
KEY FINDINGS
  1. Public network coverage in target expansion markets covered roughly 60 percent of the client's addressable farmland acreage already. This coverage level exceeded initial internal estimates by a meaningful margin.
  2. Hybrid deployment reduced projected first-year infrastructure capital outlay by approximately 40 percent versus an all-private gateway approach. This freed capital for faster expansion into additional target markets.
  3. Coverage gaps concentrated in the most remote farmland parcels, precisely where private gateway investment delivered the strongest return. These parcels represented the highest-value customers in the client's existing base.
  4. Existing customers expressed no meaningful preference between private and public network coverage as long as service reliability held steady. This finding simplified the customer communication plan considerably during the transition.
RECOMMENDED STRATEGY
Phase 1: Phase one: adopt public network coverage in markets where existing coverage meets service reliability thresholds already. This phase covers the majority of the client's near-term expansion markets. Phase 2: Phase two: deploy private gateways only in remaining coverage gaps identified through the mapping exercise. This targeted approach minimizes unnecessary capital deployment across the broader portfolio. Phase 3: Phase three: monitor public network reliability continuously and maintain private gateway fallback capability where warranted. This ongoing monitoring protects service continuity for the client's highest-value customers.
OUTCOME
The client adopted the hybrid deployment model, reducing first-year infrastructure capital outlay by approximately 40 percent (client-reported, unverified by MMA) while maintaining service reliability commitments, and used the coverage mapping data to prioritize expansion into three new states more efficiently. Customer satisfaction scores held steady throughout the transition period.

Frequently Asked Questions

Foundational context covering the market sizes, CAGR, scope, country, region and competition that inform every finding below. This section is provided to cover basics and most often pre-purchase conversations, answered from the MMA Primary Research Dataset.

What is the current size of the LoRaWAN Market?

The global LoRaWAN market reached an estimated 4.2 billion dollars in 2025. This valuation covers chipsets, modules, gateways, and network connectivity services built on the LoRaWAN protocol.

How large will the LoRaWAN Market be by 2036?

The market is projected to reach approximately 22.5 billion dollars by 2036. That represents more than a fourfold expansion from the 2026 base value over the forecast period.

What is the CAGR for the LoRaWAN Market 2026 to 2036?

The market is forecast to grow at a 16.5 percent compound annual growth rate between 2026 and 2036. Bull and bear scenarios range from 15.2 to 17.8 percent.

Which segment is growing fastest?

LoRaWAN sensor modules and end devices are growing fastest at a 20.0 percent CAGR, roughly 1.2 times the overall market rate. Gateway infrastructure follows as the second-fastest segment.

Who are the major companies in the LoRaWAN Market?

Semtech and Actility lead the category, followed by The Things Industries, Kerlink, and Milesight. Together these five players control an estimated 44 percent of global revenue.

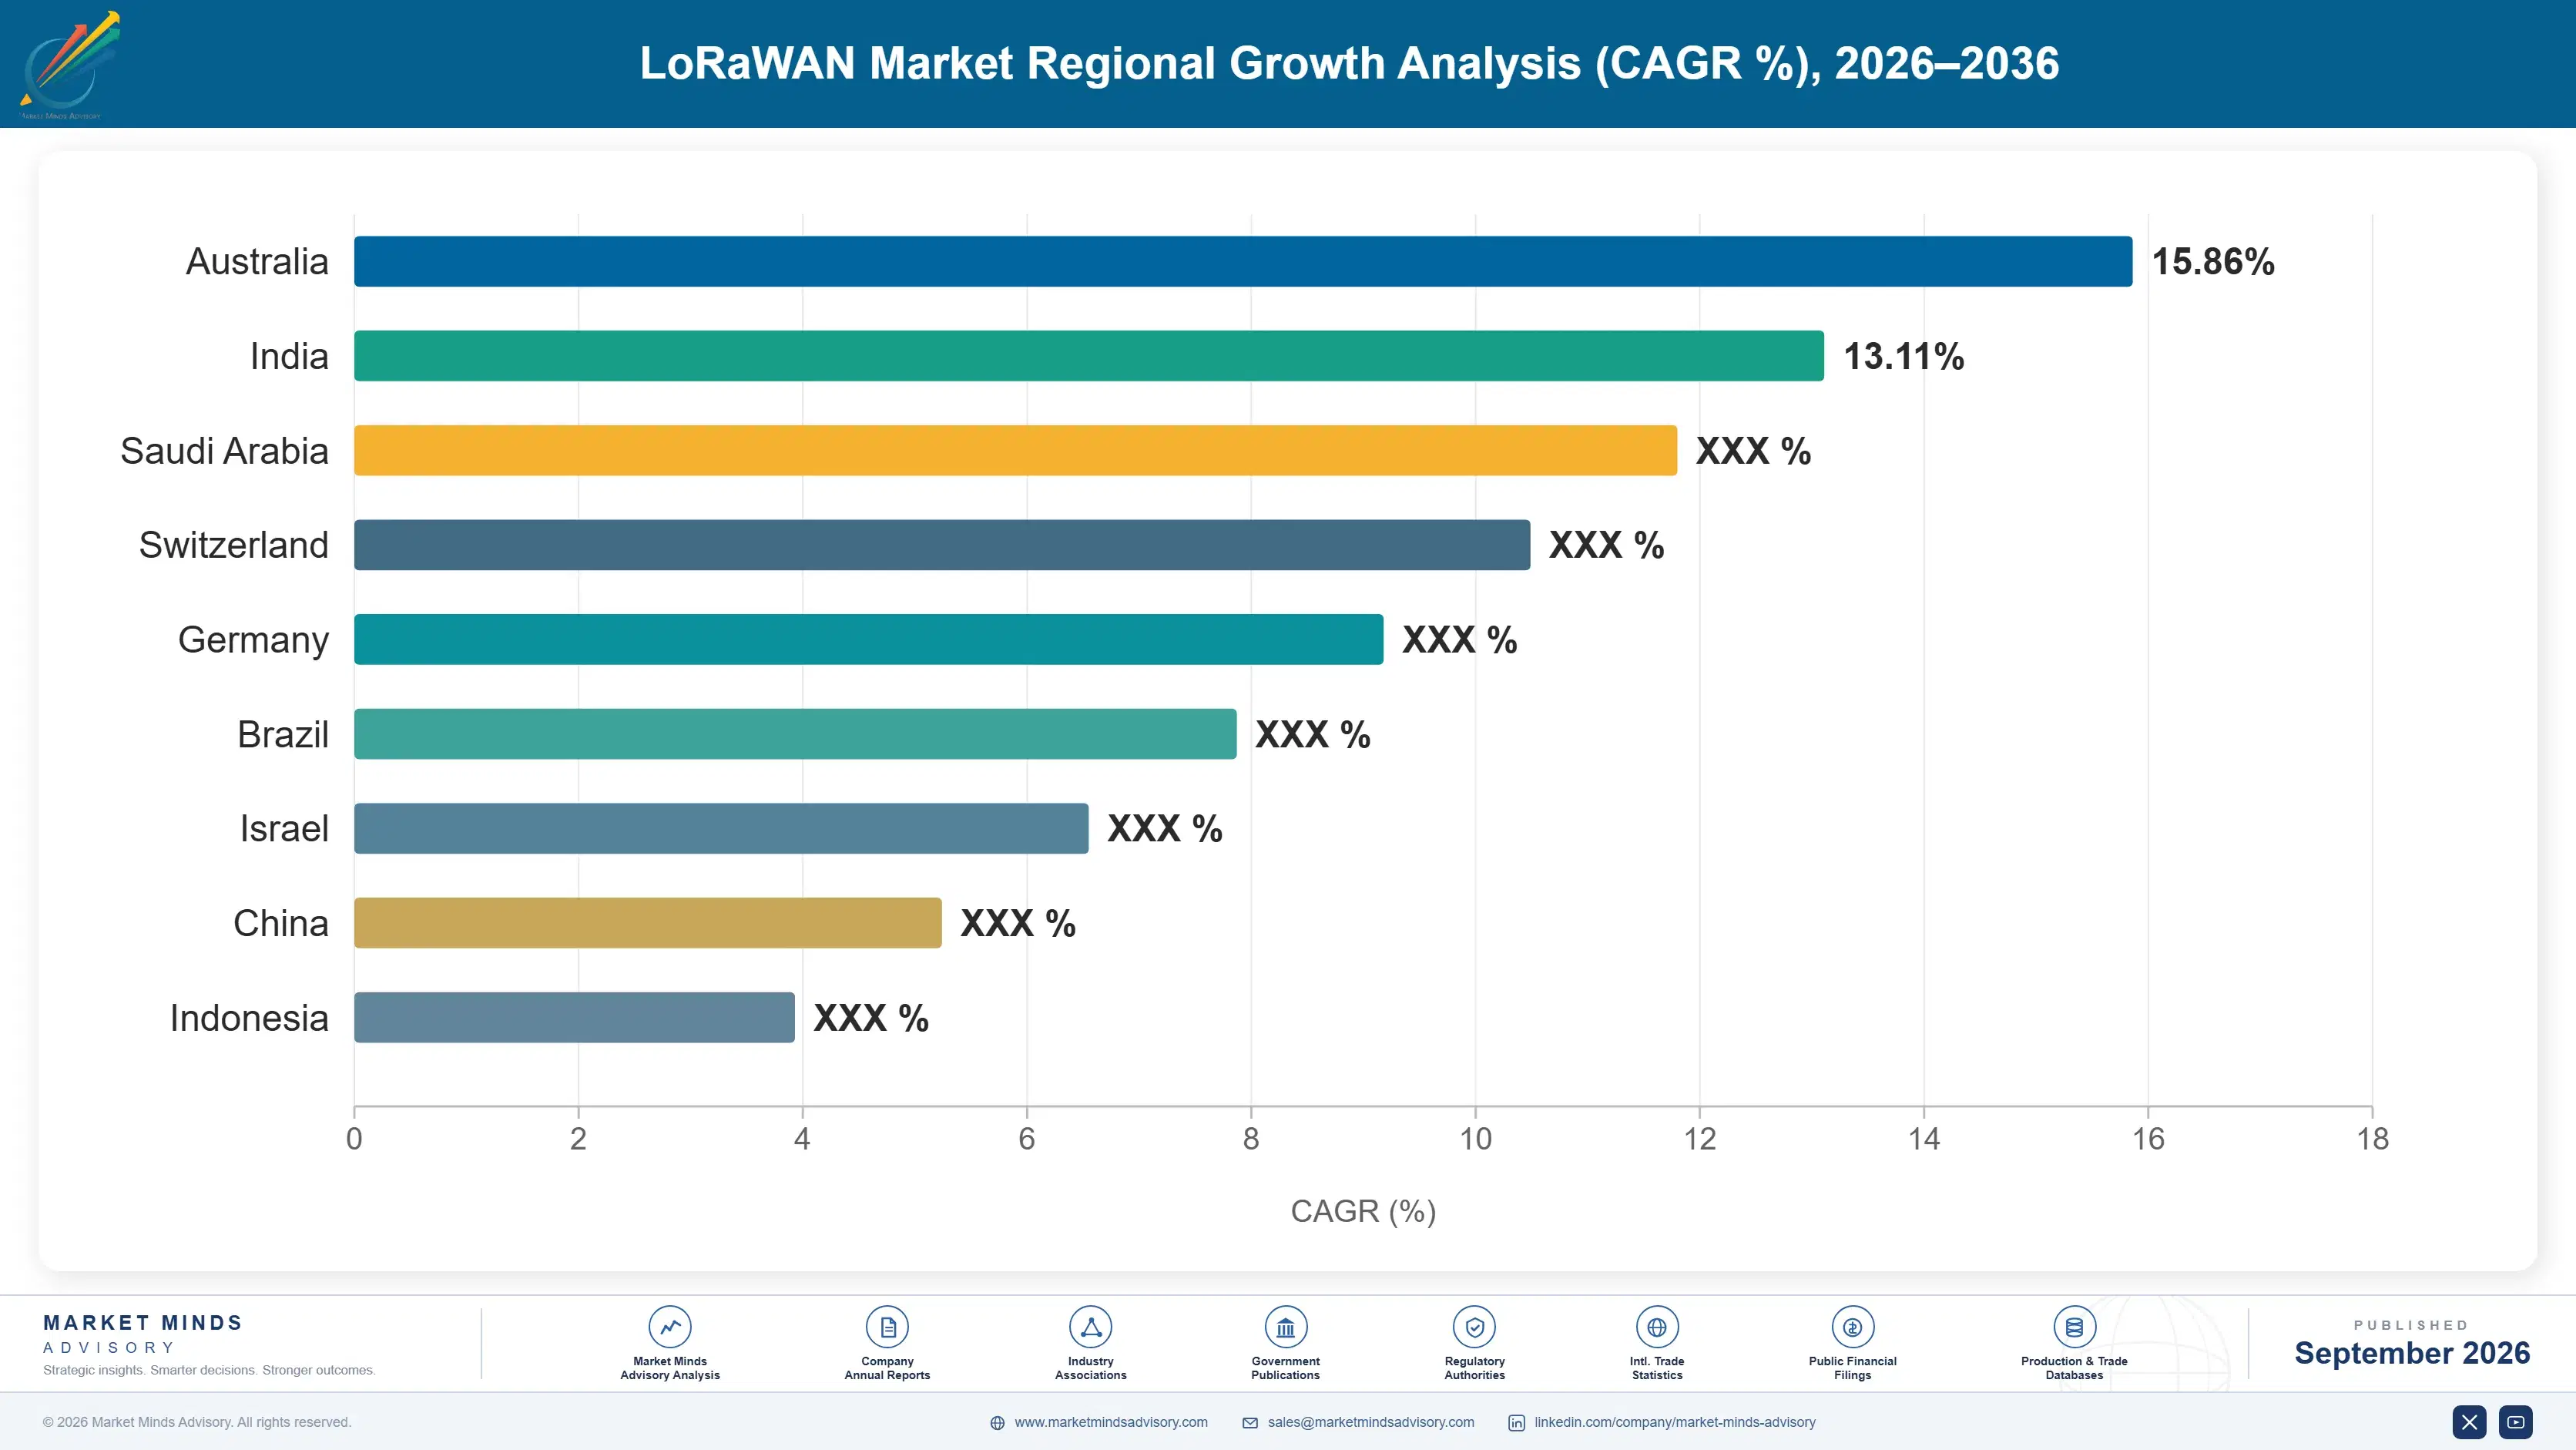
Which country is growing fastest?

India is growing fastest at an 18.5 percent CAGR, reflecting expanding agricultural technology adoption and domestic manufacturing incentives. This closely tracks the broader South Asia and Pacific regional growth rate.

Report Segmentation Architecture

The full report scope spans multiple orthogonal segmentation dimensions, with cross-tabulated demand data provided for each dimension pair. Coverage extends further to regional breakdowns, trend trajectories, and the competitive detail needed to support segment-level decision-making.

By Primary Market Dimension

  • LoRaWAN Sensor Modules and End Devices
  • LoRaWAN Gateway Infrastructure
  • Network Connectivity Services
  • LoRaWAN Chipset Components
  • Network Platform Software
  • Analytics and Data Services

By End-Use Industry

  • Agriculture
  • Utilities and Smart Metering
  • Logistics and Supply Chain
  • Commercial Real Estate and Smart Buildings
  • Industrial and Manufacturing

By Commercial Dimension

  • Direct OEM and Integrator Sales
  • Public Network Subscription Services
  • Private Network Deployment Services
  • Software and Analytics Licensing

By Region

  • East Asia
  • North America
  • Western Europe
  • South Asia and Pacific
  • Latin America
  • Middle East and Africa
  • Eastern Europe

Scope, Methodology, and Coverage

Every figure in this report is reproducible from documented input assumptions. The scope below maps the historical period, the forecast horizon, the segmentation dimensions, and the countries covered, alongside the underlying primary and qualitative methodology.
Historical Period
2020 to 2025
Forecast Period
2026 to 2036
Base Year
2025 (USD billions; MMA Primary Research Dataset, September 2026)
Market Definition
This report defines the LoRaWAN market as low-power wide-area network chipsets, modules, gateways, and network connectivity services built on the LoRaWAN protocol for long-range, low-bandwidth sensor and device communication. It excludes cellular IoT technologies such as NB-IoT and LTE-M and unrelated short-range wireless protocols such as Bluetooth and Wi-Fi.
Quantitative Units
USD billions, connected device shipments, CAGR percent
Segmentation Dimensions
Product and infrastructure layer, end-use industry, commercial channel
Regions Covered
East Asia, North America, Western Europe, South Asia and Pacific, Latin America, Middle East and Africa, Eastern Europe
Countries Covered
United States, Canada, Germany, France, Netherlands, United Kingdom, China, Japan, South Korea, India, Australia, Brazil, Mexico, Saudi Arabia, United Arab Emirates, South Africa, Poland, Czech Republic, Russia
Key Companies Profiled
Semtech, Actility, The Things Industries, Kerlink, Milesight, MultiTech Systems, Laird Connectivity, RAKwireless, Advantech, Sensecap, Browan Communications, Adeunis, Netvox Technology, Dragino Technology, Digital Matter, Loriot, ThingPark, Senet, Objenious, Machine Shop
Quantitative Methodology
Primary survey, n=3,800 respondents, Q4 2025, six countries; demand-side model with trade association cross-validation
Qualitative Methodology
47 expert interviews, Q4 2025; applied to validate demand model assumptions, identify emerging dynamics, and assess competitive positioning
Report Format
PDF and XLSX data workbook (Word format preview document)
Publisher
Market Minds Advisory
Report Code
MMA-2026-TEC-618
Published
September 2026
Contact
sales@marketmindsadvisory.com | www.marketmindsadvisory.com

Purchase the full LoRaWAN Market Report (2026 to 2036).

This report delivers a comprehensive analysis of the global LoRaWAN market across all major product layers, regions, and competitive dynamics through 2036. It covers detailed segmentation by product and infrastructure layer, end-use industry, and commercial channel, alongside regional demand architecture across all seven world regions. Competitive profiling examines the top five players controlling 44 percent of global revenue, along with fifteen additional participants shaping category evolution. The report also includes a portfolio tier analysis, input cost risk assessment, and a strategic verdict section identifying priority actions for participants navigating this rapidly diversifying category.
Seven-region demand share and CAGR breakdown
Five-tier top and secondary player profiling
Ten-year revenue and volume forecast model
Input cost and supply chain risk assessment
Portfolio margin tier and watch segment analysis
Anonymized client case study with strategy recommendations

Built For The People Who Decide

From boardroom strategy to bench-side execution, this report is read cover-to-cover by leaders shaping the next decade of their industry, turning demand scenarios, market dynamics and valuation benchmarks into decisions.
CXOs/ Presidents/ VPs/ Managers
M&A and Corporate Development
Strategy Teams and R&D Heads
Procurement and Product Directors
Regulatory and Compliance Leaders
Investor Relations and Equity Analysts