Market Minds Advisory
LoRa and LoRaWAN IoT Market

LoRa and LoRaWAN IoT Market: LoRa and LoRaWAN IoT Market: Device Classes, Deployment Economics and Certification Barriers 2026 to 2036

A sensor that runs ten years on one battery and reports through a wall from five kilometres away is not exciting technology. It is the only technology that makes most sensing deployments pay.

Lead Analyst

Published

September 2026

Make Smarter Decisions with Customized Research Insights

Request a free sample report and evaluate market opportunities, growth trends, and competitive dynamics relevant to your business needs.

2025 MARKET VALUE$1.8BMarket Size 2025
2036 FORECAST VALUE$7.0BBase Case , 2026 to 2036
CAGR 2026 TO 203613.2 %Bull 14.4% / Bear 11.8%
INCREMENTAL OPPORTUNITY$5.0BNet 10- year value creation
EXPANSION MULTIPLE3.46x2036 value over 2026 base
Strategic Levers
M&A Pipeline
Regional Outlook
Country Rankings
Competitive Intelligence
Segmental Deep-dive
Call-Us : 91 93563 13602

Executive Snapshot and Market Trajectory.

LoRa wins on the two numbers that decide whether a sensing deployment ever gets funded: battery life measured in years rather than months, and range measured in kilometres rather than metres. It gives up data rate to get them, which almost nobody deploying sensors actually minds.
The market reaches USD 2.04 billion in 2026 and USD 7.05 billion by 2036, a 3.46 times expansion at 13.2%. Asset tracking devices grow at 19.8%, half again the market rate of 13.2%, because a tracker that lasts five years without charging changes what logistics operators can afford to instrument. East Asia holds 32% of consumption on Chinese deployment volume and module manufacturing together, while India grows fastest at 17.2%. Nobody deploys at that scale.
Five suppliers hold 42% of shipped units, fragmented because the radio silicon comes from essentially one source while everything built around it does not. Semtech owns the transceiver. Quectel, Murata, RAKwireless and dozens of smaller firms compete on modules and finished devices at margins that reflect how little differentiation is available above the chip. Nothing else in wireless connectivity looks anything like it at all.
Market Definition
This report covers LoRa radio and LoRaWAN protocol hardware: asset tracking devices, industrial condition monitoring nodes, environmental and agricultural sensor nodes, gateways and base stations, building automation nodes, and utility metering end devices. It excludes network server and device management software, connectivity subscription services, cellular low-power wide-area technologies including NB-IoT and LTE-M, and the application platforms that consume the data these devices produce.
Base Year Value
$1.8B in 2025 (MMA Primary Research Dataset, September 2026)
Forecast Period
2026 to 2036, eleven discrete annual values
CAGR
13.2% base case. Bull 14.4%. Bear 11.8%.
Fastest Growth Segment
Asset Tracking Devices: 19.8% CAGR
Fastest Growth Country
India: 17.2% CAGR
Fastest Growth Region
South Asia and Pacific: 15.4% CAGR
Largest Region
East Asia: 32% of 2025 global value
Market Leaders
Semtech, Quectel Wireless Solutions, Murata Manufacturing, Kerlink and RAKwireless lead on shipped device and gateway units. Source: MMA Analysis.
Primary Survey
n=3,800 procurement and R&D decision-makers, Q4 2025, six countries
Methodology
Demand-side build-up, cross-validated against public data, 47 expert interviews

LoRa and LoRaWAN IoT Market Forecast Scenarios

lora-and-lorawan-iot-market-size-forecast-scenario-1788503739198
Between 2020 and 2025 the category compounded at 11.8% and the pattern was pilots turning into production deployments, slowly. Plenty of pilots never scaled because somebody discovered the sensor cost more than the problem. What did scale was anything where the alternative was sending a person to look: water meters, tank levels, remote agricultural monitoring and shipping container tracking all moved from trial to volume.
The base case holds 13.2% on three mechanisms. Asset tracking economics changed once trackers reached five year battery life, because a logistics operator can now instrument returnable assets previously untracked, and that segment compounds at 19.8%. Water and gas utilities keep replacing mechanical meters on regulatory cycles that run regardless of the economy. And industrial condition monitoring is moving from expensive wired systems to cheap wireless nodes on equipment nobody previously instrumented at all. Each of those runs on separate logic.
The bull case at 14.4% assumes satellite backhaul for LoRa devices matures, which removes the gateway requirement entirely in remote agriculture and logistics. The bear case at 11.8% is cellular low-power technologies winning on carrier convenience: NB-IoT and LTE-M require no private network, and plenty of buyers pay a subscription to avoid owning infrastructure.

Range And Battery Life Beat Bandwidth

Chirp spread spectrum trades data rate for link budget, and that trade is the entire product. A LoRa node reaches five kilometres in open country and gets through building fabric that defeats most alternatives, on a power budget that lets a primary cell last ten years. What it cannot do is carry much data, which rules it out of video, audio and anything conversational. Nobody deploying soil moisture sensors cares.
TOP FIVE CONCENTRATION42%Fragmented against most wireless connectivity hardware component categories
TYPICAL NODE BATTERY LIFE10 yearsAchieved on a primary cell under typical reporting intervals
GATEWAY COVERAGE RADIUS5 kilometresLine of sight in open rural deployment conditions
AVERAGE NODE SELLING PRICEUSD 24Blended across tracking, sensing and metering device classes
RADIO SILICON COST SHARE28%Transceiver silicon share of finished node bill cost
NODES PER GATEWAY1200 devicesTypical loading on a deployed urban network gateway
The commercial structure is unusual because Semtech supplies the transceiver silicon to essentially everybody. Module makers, gateway builders and device manufacturers all buy the same chip and compete on integration, certification, firmware and price. Transceiver silicon runs about 28% of a finished node's cost, which means the one differentiated component in the product is the one nobody competing can differentiate on.
Deployment economics turn on the gateway. One gateway serves roughly 1200 devices, so the infrastructure cost per node collapses as a deployment scales and looks impossible at pilot size. That single fact explains why so many proof-of-concept projects concluded the technology was too expensive: they were measuring the wrong thing at the wrong scale, and the vendors selling to them rarely said so.
"The pilot problem killed more LoRaWAN projects than any competing technology did. A hundred node trial carries the full gateway cost and looks absurd next to cellular, and by the time anybody works out the arithmetic at ten thousand nodes the budget has gone somewhere else."
Principal Analyst, Low Power Wide Area Networks Practice · MMA Technology Practice · September 2026

Market Trends

Five Year Trackers Changed What Logistics Instruments

An asset tracker that needed charging every few months was only worth deploying on high-value shipments where somebody would do the charging. Trackers now run five years on a primary cell, which puts returnable pallets, roll cages, gas cylinders and shipping containers inside the economics for the first time. Those assets number in the tens of millions and were previously tracked by paperwork or not at all. Asset tracking devices compound at 19.8% against 13.2% for the market, and the change was battery chemistry and duty cycle management rather than anything in the radio.
Market Impact: Cycles replace meters every 15 years

Satellite Backhaul Removes The Gateway Requirement Entirely

The gateway has always been the awkward part of a LoRaWAN deployment: somebody has to site it, power it, backhaul it and own it. Direct-to-satellite services for LoRa devices remove that requirement in exactly the places where gateways are hardest to justify, meaning remote agriculture, pipeline monitoring, maritime containers and anything crossing a border. Coverage is not continuous and message capacity is limited, which suits applications reporting a few times a day and rules out everything else. The economics change most for deployments that were never dense enough to pay for infrastructure.
Market Impact: Industrial nodes compound at 16.2%

Market Opportunities and Growth Drivers

Utility Meter Replacement Cycles Run Regardless Of Economics

Water and gas meters are replaced on regulatory schedules that have nothing to do with whether a utility feels like spending money, typically every twelve to fifteen years across most of Europe and increasingly elsewhere. Once a meter is being replaced anyway, adding a communicating module costs little against the labour already committed to opening the ground. LoRaWAN suits this application specifically because meters sit in pits and basements where cellular coverage is unreliable and mains power is absent. The deployments are large, slow and almost completely insensitive to the economic cycle.
Market Impact: Competes against 2 cellular standards

Industrial Monitoring Moves From Wired To Cheap Wireless

Condition monitoring used to mean running cable to a sensor, which cost enough that only critical rotating equipment got instrumented. A battery-powered wireless node at a fraction of that installed cost puts vibration, temperature and current monitoring onto pumps, motors and conveyors that nobody previously watched. The value is not in any single reading but in noticing the change before the failure, and plants that instrumented broadly report finding problems on equipment they had not considered worth monitoring. Industrial nodes compound at 16.2%, and the constraint is commissioning effort rather than hardware price.
Market Impact: One gateway serves 1200 devices

Market Restraints and Challenges

Cellular Low-Power Alternatives Win On Carrier Convenience

NB-IoT and LTE-M arrive with a network already built, which means a buyer signs a subscription rather than siting, powering and owning gateways. The root cause is organisational rather than technical: most enterprises would rather pay a monthly fee than take on infrastructure their facilities team has to maintain. Commercially this costs LoRaWAN deployments in dense urban applications where cellular coverage is good and the buyer has no appetite for network ownership. Mitigation runs through managed network operators who own the gateways and sell coverage, which converts the objection into a subscription conversation.
Market Impact: Tracker life now 5 years

Pilot Scale Economics Kill Projects Before Deployment

One gateway serves roughly 1200 devices, so a hundred node trial carries the full infrastructure cost against a fraction of the eventual device count and looks expensive next to cellular alternatives. The root cause is that the technology's economics only work at scale and most organisations evaluate at pilot size, which is the wrong measurement applied honestly. Commercially this loses deployments that would have been profitable, and the vendor rarely explains the arithmetic clearly enough. Mitigation runs through shared or operator-owned gateway infrastructure that removes the fixed cost from the pilot entirely, which several networks now offer.
Market Impact: Removes 1 gateway per site
3 additional market trends, 4 additional growth drivers, and 3 additional restraints and challenges are covered in the full report. Contact sales@marketmindsadvisory.com to access the complete intelligence.

Segment CAGR and Growth Architecture

Segmentation follows device class, because power budget, enclosure requirement and certification burden determine what a product costs to build and what it can command. Six classes cover the market: asset tracking devices, industrial condition monitoring nodes, environmental and agricultural sensor nodes, gateways and base stations, building automation nodes, and utility metering end devices. End-use industry and channel are separate dimensions.
lora-and-lorawan-iot-market-market-share-analysis-1788503739826

Asset Tracking Devices

Asset tracking devices grow at 19.8%, half again the market rate of 13.2%, and battery chemistry rather than radio design produced the change. A tracker running five years on a primary cell can be fitted to returnable pallets, roll cages, gas cylinders and shipping containers, which number in the tens of millions and were previously tracked by paperwork or not at all. The devices are cheap, the deployment is enormous, and the operator only needs to know roughly where something is rather than precisely. Direct-to-satellite services extend this into cross-border logistics where no gateway network exists, which removes the single largest objection to instrumenting moving assets at all. Margins are thin and the volumes are not.
CAGR 19.8%

Industrial Condition Monitoring Nodes

Industrial condition monitoring nodes grow at 16.2% and displace wired systems rather than competing with other wireless ones. Running cable to a vibration sensor cost enough that only critical rotating equipment got instrumented, which left most of a plant unmonitored by default. A battery node at a fraction of that installed cost puts vibration, temperature and current sensing onto pumps, motors and conveyors nobody previously watched, and plants that instrumented broadly report finding problems on equipment they had not considered worth the attention. The constraint is commissioning effort rather than hardware price: somebody still has to mount each node, name it and connect it to something that acts on the reading.
CAGR 16.2%
Full segment breakdown across 6 segments available in the complete report.

Regional Architecture and Country Demand Map

East Asia leads at 32%, above the standard band, because Chinese deployment volume and module manufacturing both sit there. North America takes 20%, below its band, since American enterprises prefer cellular subscriptions to owning network infrastructure. Western Europe remains the densest deployment territory. That split matters more than the shares.

East Asia

East Asia holds 32% of consumption, above the 30% band ceiling, and two things put it there. Chinese deployment volume across water metering, smart agriculture and municipal infrastructure is the largest anywhere, running on networks operated by carriers and platform companies rather than by enterprises. Separately, almost every LoRa module and gateway in the world is manufactured here, by Quectel, RAKwireless, Heltec, Ai-Thinker and dozens of smaller firms, which means the hardware is bought and fitted locally before export. Japanese and Korean building automation adds steady volume at higher specification. Growth at 14.4% reflects deployment scale rather than any technology advantage. The manufacturing concentration here is more complete than most people realise.
Share: 32% | CAGR: 14.4% (2026 to 2036)

Western Europe

Twenty six percent of consumption sits in Western Europe, which remains the densest LoRaWAN deployment territory anywhere despite growing slowest. Public networks operated by KPN in the Netherlands, Orange and Bouygues in France and Swisscom in Switzerland gave enterprises coverage without infrastructure ownership, which removed the objection that stalls deployments elsewhere. Water and gas meter replacement runs on regulatory cycles across the region and generates predictable volume regardless of the economy. Kerlink, Actility and Adeunis are all French, and the protocol itself was developed here. Growth at 11.6% is the slowest of any region, on a base that is already substantially deployed. Public network coverage is what made the difference here.
Share: 26% | CAGR: 11.6% (2026 to 2036)
Regional intelligence for 5 additional markets available in the complete report: North America, South Asia and Pacific, Latin America, Middle East and Africa, Eastern Europe. Contact sales@marketmindsadvisory.com.
lora-and-lorawan-iot-market-country-cagr-analysis-1788503740378

How To Earn Above The Chip

Everybody buys the same transceiver from the same supplier, which means nothing above the silicon differentiates on radio performance. What does differentiate is certification breadth, battery engineering, commissioning effort and whether the customer ever has to own a gateway. The four levers below address where margin actually exists in a market with one chip and a hundred device makers.

Engineer Battery Life, Not Radio Performance

Every competitor uses the same transceiver, so radio performance is not available as a differentiator and arguing about it wastes the conversation. Battery life is entirely available: duty cycle management, cell chemistry selection, sleep current and the way firmware handles retransmission decide whether a node lasts three years or 10. That difference determines whether an asset tracker can go on a returnable pallet or only on a high-value shipment, which is the difference between a small deployment and a large one. The engineering is unglamorous firmware and power supply work that most device makers underfund badly.
Market Impact: Battery life reaching 10 years wins deployments outright

Sell Coverage So Nobody Buys A Gateway

One gateway serves roughly 1200 devices, so a pilot carries the whole infrastructure cost and loses to cellular on arithmetic that has nothing to do with the technology. Operators who own the gateways and sell coverage remove that objection entirely, which is precisely why Western Europe deploys more densely than North America does. The buyer signs a subscription and never thinks about siting, power or backhaul again. The cost is owning infrastructure with uncertain loading, and the payoff is every deployment that would otherwise have died at pilot stage. That is a great many deployments indeed.
Market Impact: Removes the 1200 device fixed cost barrier entirely

Cut Commissioning Effort, Not Hardware Cost

Industrial condition monitoring nodes compound at 16.2% and the constraint on those deployments is not the price of the node. Somebody has to mount each one, identify it, associate it with a piece of equipment and connect it to something that acts on the reading, and at a thousand nodes that labour exceeds the hardware bill several times over. Devices that self-identify, pair by proximity and carry pre-loaded equipment profiles remove most of it. The engineering is provisioning software rather than radio work, which is why hardware-focused suppliers keep ignoring the largest cost in their customer's project.
Market Impact: Commissioning labour exceeds hardware cost at 1000 nodes

Carry Certification Across Every Regional Variant

LoRa operates in different unlicensed bands in Europe, North America, Asia and Australia, and each requires its own regulatory approval on each product variant. A supplier certified across all of them sells one design into a multinational customer's global deployment; one certified in two regions loses that customer to somebody who is not obviously better at anything else. The cost is testing and paperwork on every product in every market, running to a meaningful fraction of development budget. It is also the most reliable barrier available in a market where 42% concentration means very little.
Market Impact: Certification is needed across 4 regional band plans

Who Controls the Margin Pool

Five suppliers hold 42% of shipped device and gateway units, fragmented for an unusual reason: the radio silicon comes from essentially one source while everything built on it does not. Semtech supplies the transceiver to competitors and customers alike. Quectel and Murata lead on module volume. Kerlink holds a strong gateway position from a French base. RAKwireless built scale by making everything cheaply and shipping it everywhere. All participants are assessed on shipped device and gateway units.
Competition happens on everything except the radio, because nobody can differentiate on a chip they all buy. Certification breadth across regional band plans, battery engineering, commissioning software and enclosure quality decide most selections. Price competition on modules is severe and margins reflect it. The device makers who escaped that pressure did so by solving the customer's deployment problem rather than by building a better node.

Rankings shift on two pressures. Satellite backhaul services change who matters in remote deployments, and the firms positioning for that are not the ones holding gateway share today. The second is managed network operators taking the infrastructure burden off enterprises, which moves the purchasing decision away from device makers entirely and toward whoever sells the coverage.
lora-and-lorawan-iot-market-company-positioning-matrix-1788503740912

Competitive Moat and Risk Dimensions

SEMTECH

Moat: Sole Transceiver Silicon Source

Semtech designed the chirp spread spectrum modulation and supplies the transceiver silicon that every LoRa product in the market contains, including those from firms competing with it. That position means the company earns on every deployment regardless of which device maker wins it. Alternative implementations exist and none has achieved meaningful adoption, because the certification and interoperability burden is prohibitive.
SEMTECH

Risk: Standard Adoption Ceiling Risk

The company's fortunes are tied entirely to whether LoRaWAN keeps winning against cellular low-power alternatives, and that contest is decided by enterprise procurement preferences rather than by technical merit. NB-IoT and LTE-M arrive with a network already built, which suits buyers who do not want infrastructure. A single sourcing position is worth nothing if the standard loses ground.
QUECTEL WIRELESS SOLUTIONS

Moat: Module Scale And Certification Breadth

Quectel ships wireless modules across cellular and low-power technologies at volume that funds certification in every regional band plan. A multinational customer deploying across four continents can use one supplier and one design, which a regional specialist cannot offer at any price. That breadth also lets the company quote a cellular alternative when a customer decides against private network ownership.
QUECTEL WIRELESS SOLUTIONS

Risk: Geopolitical Sourcing Exposure

Chinese-manufactured connectivity modules face procurement restrictions in American and increasingly European government and utility deployments, on grounds that have nothing to do with product quality. Those are precisely the large, long-running deployments a module supplier most wants. Competitors manufacturing outside China win that business by default, which is an advantage no amount of engineering answers.

Players Tracked

Prominent Players

Semtech
Quectel Wireless Solutions
Murata Manufacturing
Kerlink
RAKwireless

Other Key Players

Ezurio
MultiTech
Tektelic Communications
Milesight IoT
Dragino Technology
Heltec Automation
Browan Communications
Advantech
Adeunis
Decentlab
Comtac
Seeed Studio
Ai-Thinker
Ubiik
Cisco Systems

Recent Developments

APRIL 2025

Semtech Extends Direct To Satellite Capability Across Transceiver Range

Semtech extended direct-to-satellite capability across its LoRa transceiver range, an organic product development rather than an acquisition or partnership announcement. The capability targets deployments where siting and owning a gateway has never been economic, meaning remote agriculture, pipeline monitoring and cross-border logistics where no terrestrial network exists.
Signal: Removing the gateway removes the objection that has killed more deployments than any competing technology has.
NOVEMBER 2024

Kerlink Expands Managed Gateway Service For European Utilities

Kerlink expanded its managed gateway service offering for European water and gas utilities, an organic service extension rather than any transaction. The model has the operator owning and maintaining the infrastructure while the utility buys coverage, which removes the fixed cost that makes small deployments look uneconomic against cellular alternatives.
Signal: Selling coverage rather than hardware is the reason Europe deploys more densely than anywhere else does.
JUNE 2025

Quectel Adds Regional Band Certifications Across Low Power Module Range

Quectel completed additional regional band plan certifications across its low-power module range, an organic regulatory programme rather than a partnership or acquisition. The work targets multinational customers deploying one hardware design across several continents, which a supplier certified in only two regions cannot serve at any price.
Signal: Certification breadth is the most reliable barrier available in a market as fragmented as this one.

What A Sensor Node Costs

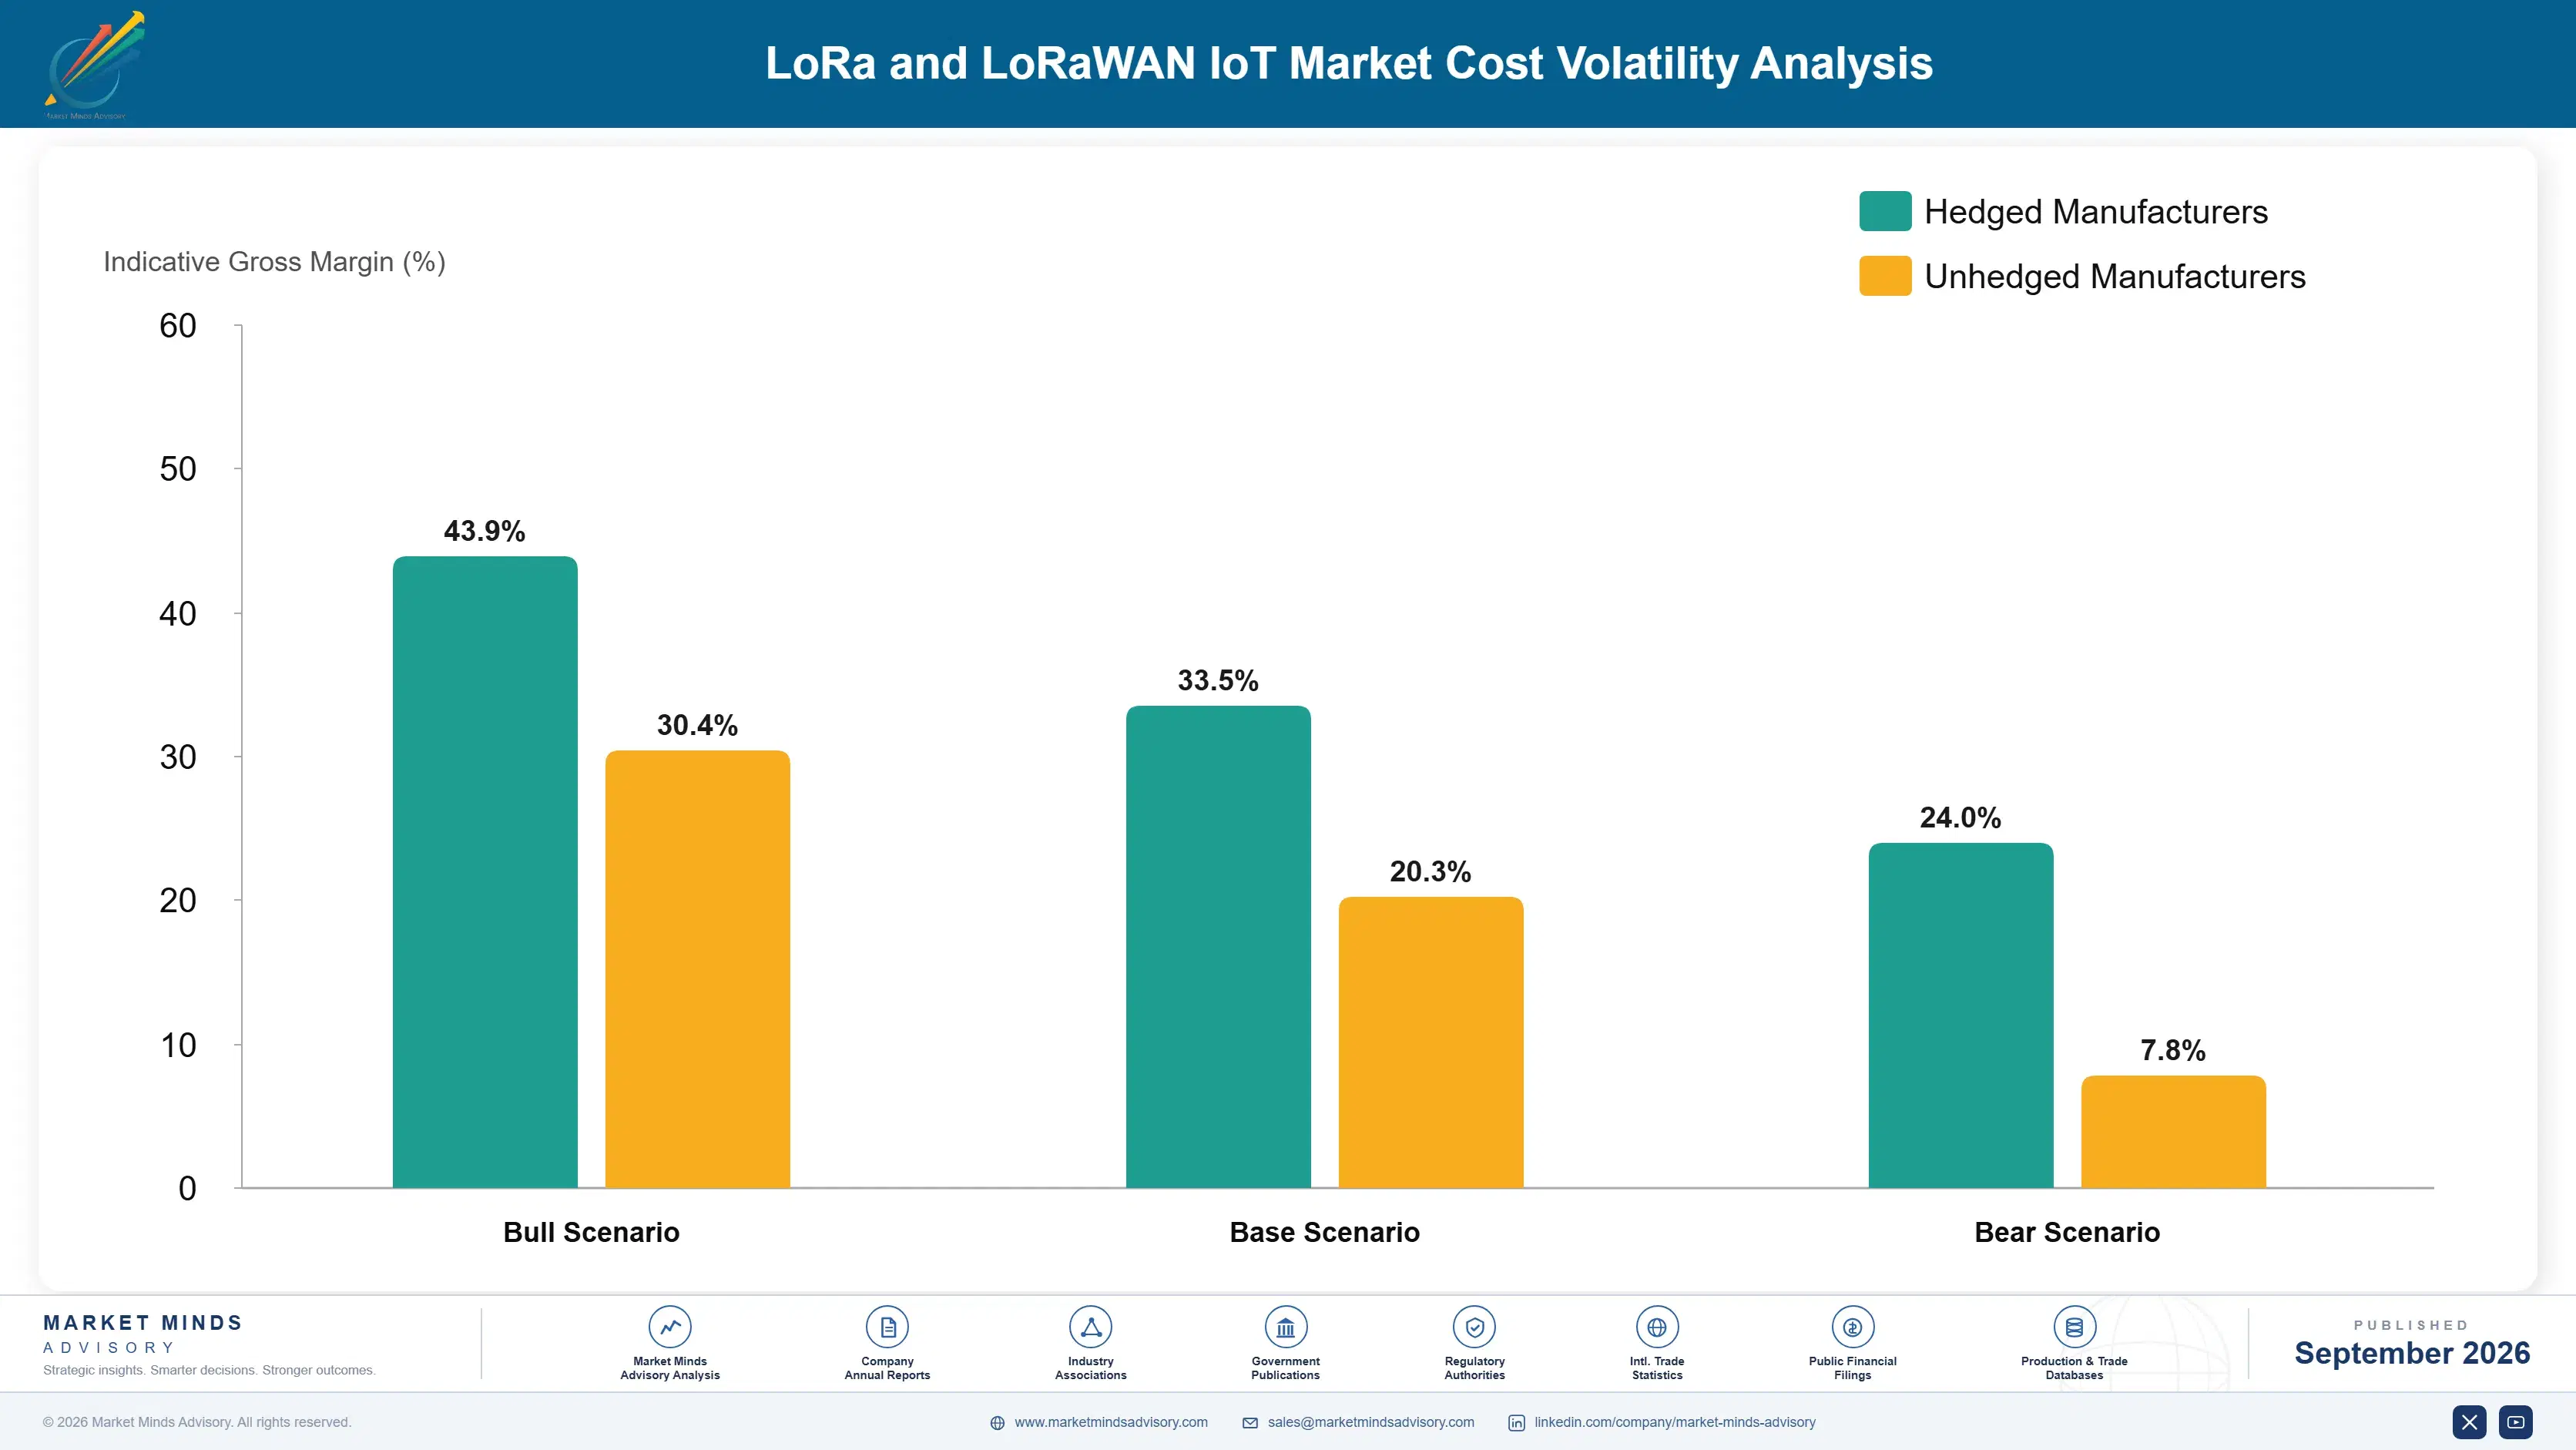
Transceiver and microcontroller silicon accounts for roughly 28% of a finished node's cost, with the LoRa transceiver itself sourced from a single supplier. The battery contributes about 18% and rises sharply for the long-life primary cells that asset trackers require. Enclosure, sealing and mounting hardware add around 21%, which surprises people until they price one. Assembly, test and certification amortisation carry the balance.
Semtech Corporation Annual Report 2024 notes wafer pricing and inventory correction across its signal integrity and IoT businesses, with foundry cost cited as the dominant external input. Murata Manufacturing Annual Report 2024 records comparable pressure on module lines alongside passive components. The 2022 lithium price spike raised primary cell cost materially, and device makers building long-life trackers absorbed most of it because the deployments were already priced.

The competitive disadvantage mechanism is single-source silicon rather than any commodity exposure. Every device maker buys the transceiver from the same supplier at broadly comparable terms, so nobody gains advantage there or escapes a price move. Where suppliers separate is on battery sourcing and enclosure manufacturing, both of which reward scale that most device makers do not have. Firms buying enclosures in thousands pay several times what volume buyers do.
lora-and-lorawan-iot-market-cost-volatility-analysis-1788503741112

Standardise Enclosure Platforms Across Every Device Family

Enclosure, sealing and mounting hardware run around 21% of node cost and most device makers tool a new one per product. Designing families around two or three shared enclosure platforms lets the supplier buy in volumes that earn real pricing rather than paying small-run rates. The constraint is product differentiation on appearance, which matters far less than anybody claims.

Contract Primary Cell Supply Ahead Of Deployment

The battery runs about 18% of node cost and rises sharply for the long-life primary cells asset trackers need, from a concentrated supply base. The 2022 lithium spike caught device makers who priced deployments before securing cells. Contracting supply when the deployment is won rather than when it is built removes that exposure, and the working capital cost is modest.

Amortise Certification Across Shared Radio Modules

Regional band plan certification is required on every product variant in every market, which suppliers with narrow ranges carry badly. Building every device around one certified radio module means the approval travels with the module rather than being repeated per product. The engineering constraint is board space and power routing, and the saving lands on every new product launched afterwards.

Portfolio Architecture for Margin Defence

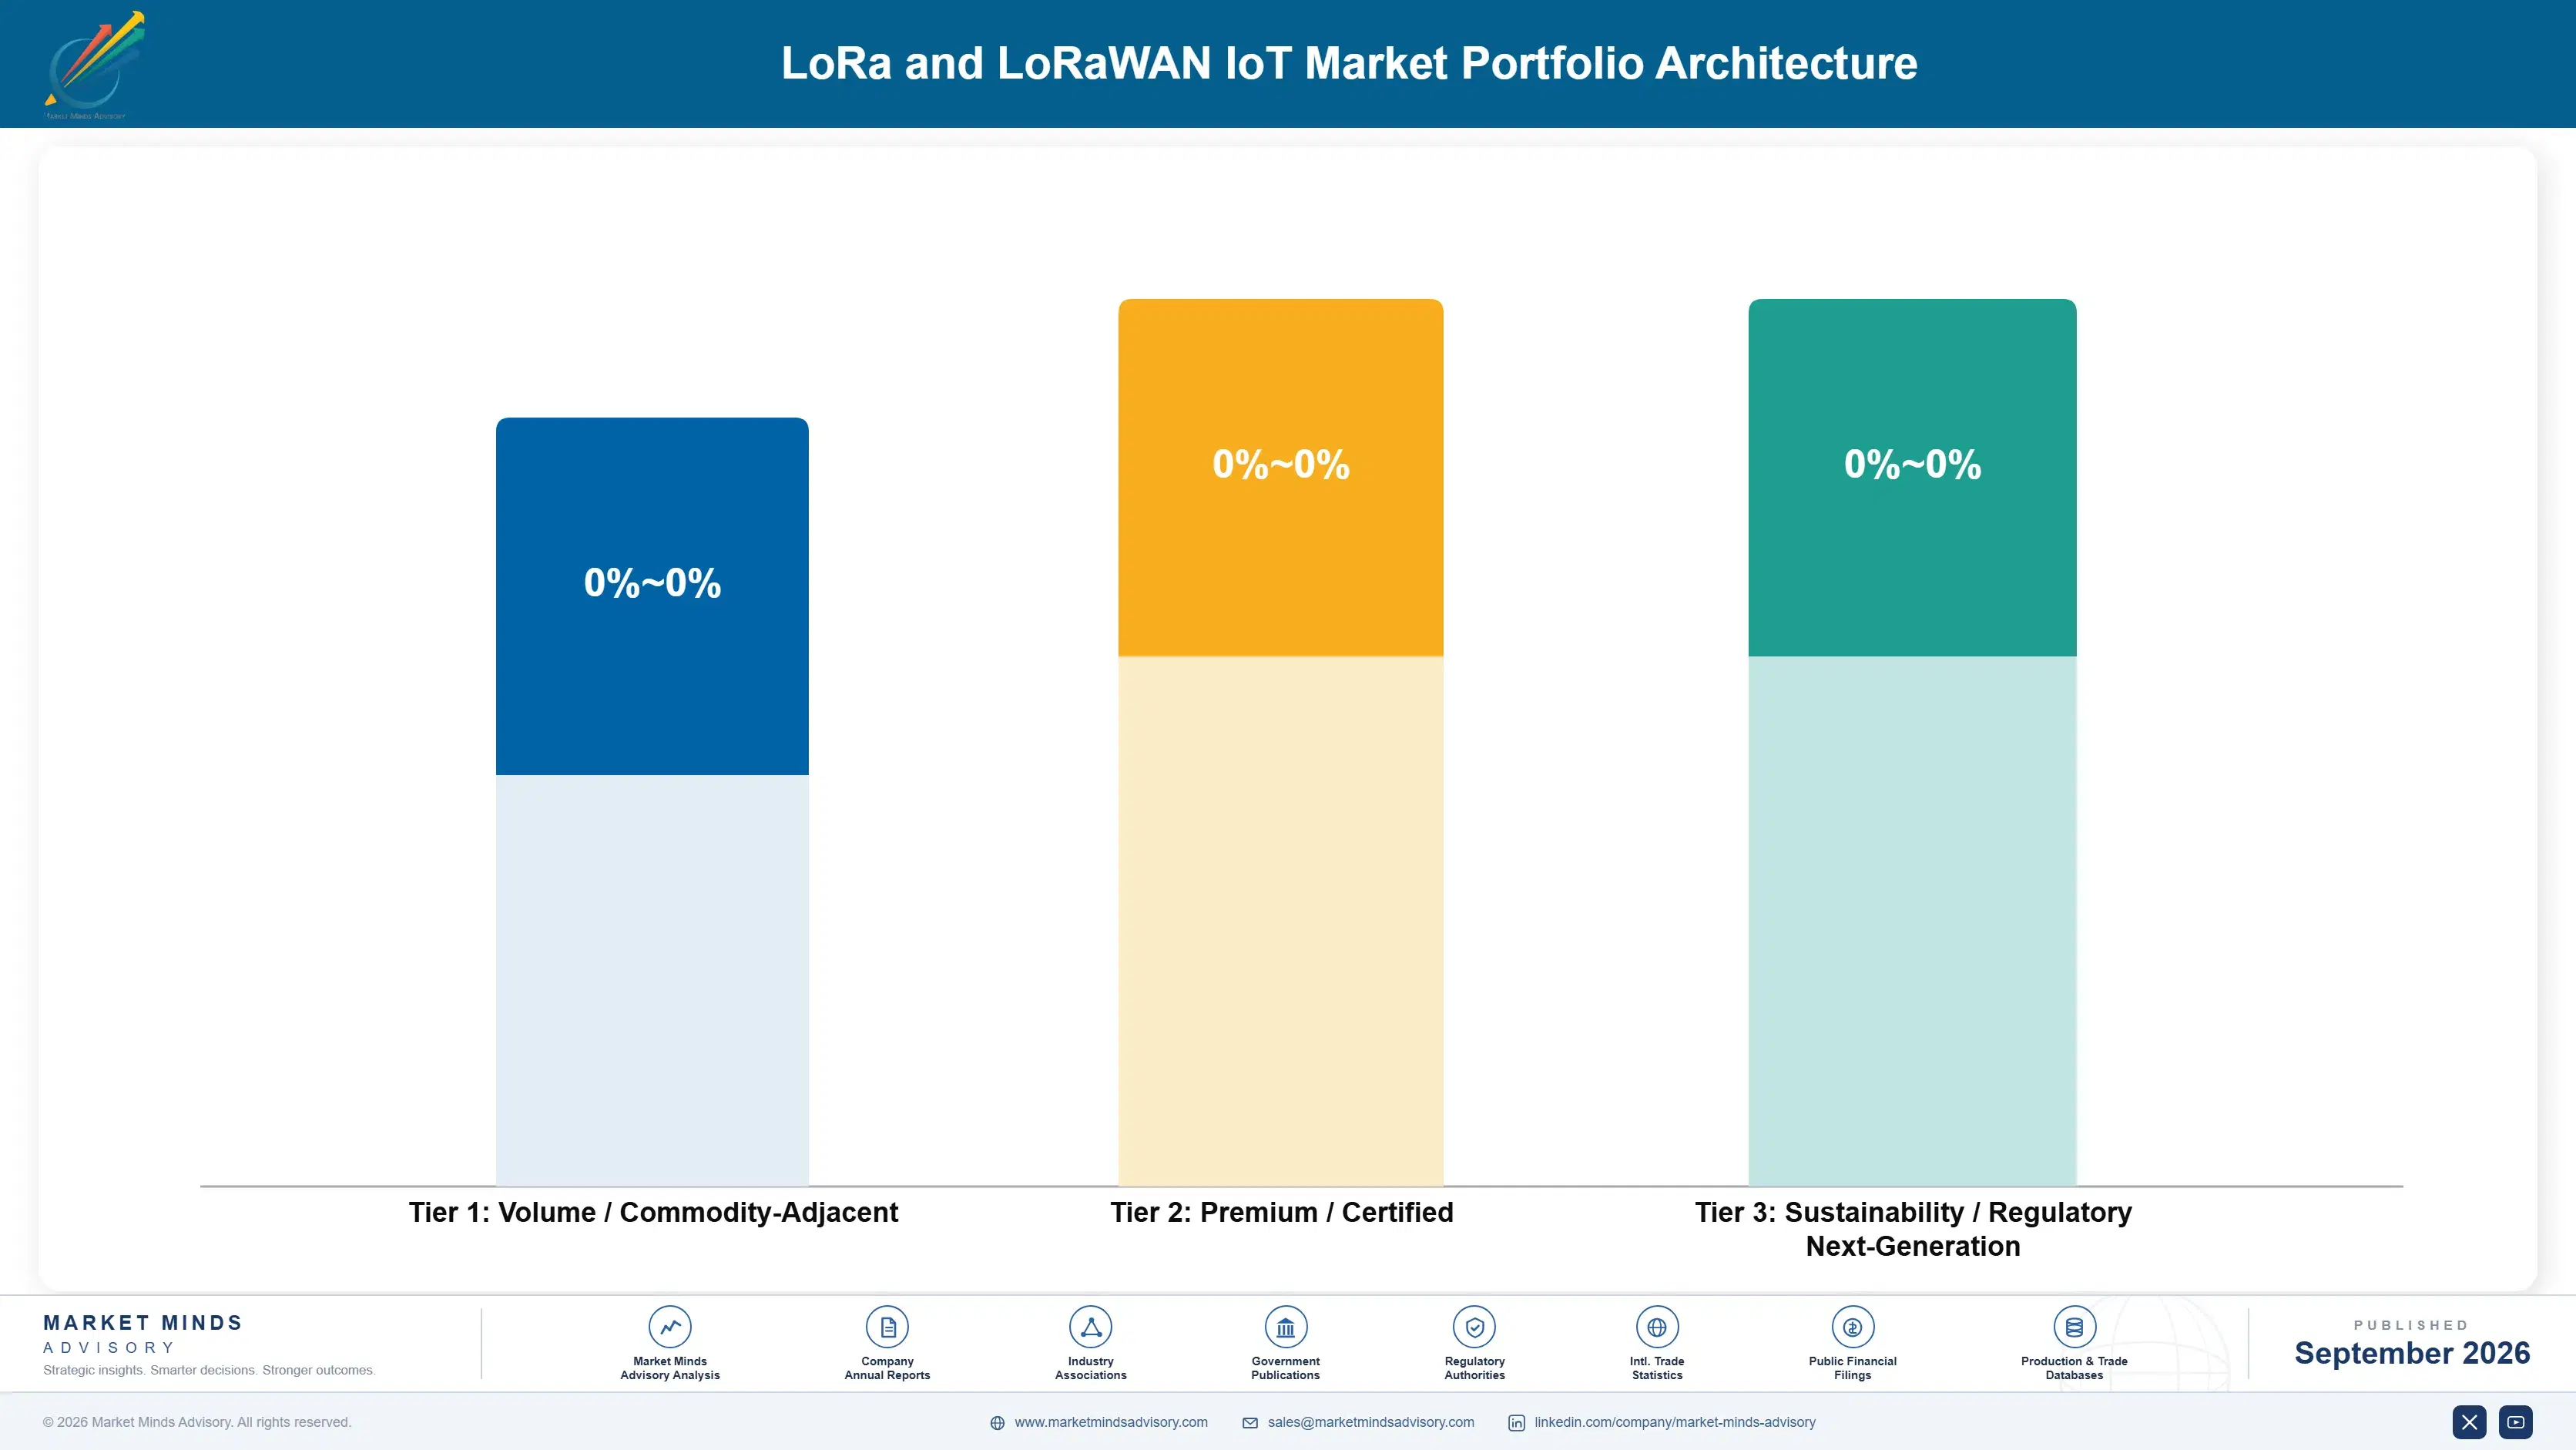
Margin architecture separates on how much of the customer's problem a supplier solves, not device sophistication. Modules and basic sensor nodes earn least, competed on price by dozens of manufacturers building on identical silicon. Gateways and building automation nodes sit in the middle, where certification and installation quality support pricing. Industrial condition monitoring and asset tracking devices earn most, not because the hardware is better but because commissioning software and battery engineering are hard and customers pay for both.
The volume versus premium tension is unusually simple because the same assembly line builds everything. What differs is the firmware, the provisioning software and the battery specification, all of which are development spending rather than capacity. A supplier can serve both ends without allocation conflict, and the real tension is where engineering time goes: firmware for a premium tracker or another price-competitive module variant.

High-value pools sit in asset tracking and industrial monitoring, and both reward software capability rather than hardware. Tracking rewards battery engineering and duty cycle management. Industrial rewards provisioning that removes commissioning labour from a customer's project. Almost every supplier in this market describes itself as a hardware company, which is why so few of them earn well.

Volume / Commodity-Adjacent

Radio modules and basic sensor nodes competed on price by dozens of manufacturers building on identical transceiver silicon. The eight point spread separates suppliers with enclosure and assembly scale from those buying components in small runs.
Gross Margin: 18% to 26%

Premium / Certified

Gateways, building automation nodes and utility metering devices sold on certification breadth and installation quality. The ten point spread tracks how many regional band plans a supplier carries approvals across.
Gross Margin: 34% to 44%

Sustainability / Regulatory / Next-Generation

Asset tracking and industrial condition monitoring devices where battery engineering and provisioning software rather than hardware decide selection. The twelve point spread reflects how much software capability each supplier actually built.
Gross Margin: 48% to 60%
lora-and-lorawan-iot-market-portfolio-architecture-1788503741617

High-value Sub-segments and Strategic Watch-out

Asset Tracking Devices

Grows at 19.8% because trackers reaching five year battery life brought returnable pallets, cages and cylinders inside the economics. The twelve point spread separates suppliers with real battery engineering from those assembling reference designs. Satellite backhaul extends this into cross-border logistics. Volumes here are very large indeed.
Gross Margin: 48% to 60%

Industrial Condition Monitoring Nodes

Grows at 16.2% by displacing wired systems on equipment nobody previously instrumented at all. The twelve point spread reflects how much provisioning software each supplier built, since commissioning labour exceeds hardware cost at 1000 nodes. Hardware price is not the constraint here. Very few suppliers have understood that yet.
Gross Margin: 48% to 60%

Gateways And Base Stations

Grows at 13.0% and carries the deployment economics for everything else, since one gateway serves roughly 1200 devices. The ten point spread tracks certification breadth and whether a supplier sells hardware or managed coverage. Managed models are taking share steadily. That shift changes who the customer actually buys from.
Gross Margin: 34% to 44%

Utility Metering End Devices

Grows at 10.4%, slowest of the six classes, but on regulatory replacement cycles that run regardless of the economy. The ten point spread reflects certification depth and utility approval status rather than any product advantage. Volumes are large, predictable and fiercely price-competitive. Nobody wins these on anything but price.
Gross Margin: 34% to 44%

How Deployments Actually Get Funded

The annuity is the deployment rather than any contract, and it builds slowly. A utility rolling out meters on a fifteen year replacement cycle buys from the same supplier for the whole programme, because changing mid-rollout means running two systems. An industrial customer who instruments a plant adds nodes for years afterwards on the same network. A small first order is frequently the opening of a decade-long relationship.
Adoption depth varies enormously by vertical. Utilities adopt broadly and permanently, on regulatory cycles that ignore economic conditions entirely. Agriculture adopts seasonally and expands after a season where the data changed a decision. Industrial adopts by plant and then spreads within it, which makes the second order larger than the first. Logistics adopts by asset category, and once returnable pallets are instrumented the roll cages follow within a year.

The buyer has moved from an innovation team to an operations manager, which changed what sells. An innovation team funded pilots and cared about the technology. An operations manager funds things that reduce a cost they are measured on, and does not care what radio is inside. That shift is why battery life and commissioning effort outsell any specification comparison.
lora-and-lorawan-iot-market-end-use-penetration-index-1788503742108

Where The Margin Actually Is

These are among the four positions where our research anticipates prominent divergence between winners and laggards over the coming forecast period. Each is grounded in the demand model, the regulatory perimeter, and the announced capacity pipeline.
01 / BATTERY ENGINEERING PRIORITY

Fund Firmware And Power, Not Radio

Every competitor buys the same transceiver from the same supplier, so radio performance is no differentiator and arguing about it wastes the customer's time. Battery life is entirely available, and duty cycle management, cell chemistry, sleep current and retransmission handling decide whether a node lasts three years or 10, which in turn decides whether a tracker goes on a returnable pallet or only on a high-value shipment. That is the difference between a small deployment and a large one, and the engineering behind it is work most device makers underfund.
02 / INFRASTRUCTURE BURDEN REMOVAL

Sell Coverage So Nobody Buys Gateways

One gateway serves roughly 1200 devices, so a pilot deployment carries the entire infrastructure cost against a fraction of the eventual device count and loses to cellular on arithmetic that has nothing to do with the technology. Operators who own the gateways and sell coverage remove that objection completely, which is precisely why Western Europe deploys more densely than North America despite no technical advantage whatsoever. The cost is owning infrastructure with uncertain loading, and the return is every deployment that would otherwise have died quietly at pilot stage.
03 / COMMISSIONING COST ATTACK

Remove Installation Labour From The Customer's Project

Industrial condition monitoring nodes compound at 16.2% and the constraint on those deployments has never been the price of the node. Somebody has to mount each one, identify it, associate it with a piece of equipment and connect it to something that acts on the reading, and at 1000 nodes that labour exceeds the entire hardware bill several times over. Devices that self-identify, pair by proximity and carry pre-loaded equipment profiles remove most of it, which is provisioning software work that hardware-focused suppliers keep declining to fund.
04 / CERTIFICATION COVERAGE BREADTH

Approve Every Product In Every Band Plan

LoRa operates in different unlicensed bands across Europe, North America, Asia and Australia, and every product variant needs its own regulatory approval in each of them. A supplier certified across all four sells one design into a multinational customer's global deployment, while one certified in two regions loses that customer to somebody no better at anything else. The cost is testing and paperwork on every product in every market, and it is also the most reliable barrier available in a market where 42% top five concentration means very little.

Engagement Snapshot From the Field

A live engagement with an industry participant carrying material or product regulatory and market exposure ahead of a defining policy shift, showing how our research translates into a defensible multi-year portfolio strategy.
MARKET MINDS ADVISORY · CLIENT ENGAGEMENT SUMMARY
LoRa and LoRaWAN IoT Producer Strategic Portfolio Review and Transition Roadmap 2026·Investment Scenario on LoRa and LoRaWAN IoT Exposure Evaluation 2025-26
CLIENT PROFILE
A European water utility group serving around two million connections across three countries, facing mandated mechanical meter replacement across most of its estate over the following decade. An earlier LoRaWAN pilot covering several hundred meters had been judged too expensive per connection and the programme was drifting toward a cellular alternative. Nobody had rerun the arithmetic at full rollout scale.
STRATEGIC CHALLENGE
The pilot had carried the full gateway infrastructure cost across a few hundred meters, which made the per connection figure look indefensible next to a cellular subscription. Engineering suspected the comparison was wrong and could not demonstrate it. A decision was due within two quarters and would fix the technology choice for the entire ten year replacement programme.
MMA APPROACH
MMA rebuilt the cost model at full deployment density rather than pilot density, mapping gateway siting against the actual connection geography across all three countries. We modelled cellular subscription cost across the fifteen year meter life alongside the private network alternative, and drew on 47 expert interviews conducted in Q4 2025 with utilities running comparable programmes, managed network operators and device suppliers.
KEY FINDINGS
  1. Per connection infrastructure cost fell by roughly 40 times between pilot density and full rollout density, which reversed the comparison entirely (client-reported, unverified by MMA).
  2. Cellular subscription cost across the full 15 year meter life exceeded the entire private network build and operation by a wide margin.
  3. Meter pit and basement locations produced cellular coverage failures on 2 in every 10 test connections, which no subscription model compensates for.
  4. A managed gateway service removed the capital requirement without changing the underlying economics, and three operators were willing to quote for the territory.
CLIENT PROFILE
A European water utility group serving around two million connections across three countries, facing mandated mechanical meter replacement across most of its estate over the following decade. An earlier LoRaWAN pilot covering several hundred meters had been judged too expensive per connection and the programme was drifting toward a cellular alternative. Nobody had rerun the arithmetic at full rollout scale.
STRATEGIC CHALLENGE
The pilot had carried the full gateway infrastructure cost across a few hundred meters, which made the per connection figure look indefensible next to a cellular subscription. Engineering suspected the comparison was wrong and could not demonstrate it. A decision was due within two quarters and would fix the technology choice for the entire ten year replacement programme.
MMA APPROACH
MMA rebuilt the cost model at full deployment density rather than pilot density, mapping gateway siting against the actual connection geography across all three countries. We modelled cellular subscription cost across the fifteen year meter life alongside the private network alternative, and drew on 47 expert interviews conducted in Q4 2025 with utilities running comparable programmes, managed network operators and device suppliers.
KEY FINDINGS
  1. Per connection infrastructure cost fell by roughly 40 times between pilot density and full rollout density, which reversed the comparison entirely (client-reported, unverified by MMA).
  2. Cellular subscription cost across the full 15 year meter life exceeded the entire private network build and operation by a wide margin.
  3. Meter pit and basement locations produced cellular coverage failures on 2 in every 10 test connections, which no subscription model compensates for.
  4. A managed gateway service removed the capital requirement without changing the underlying economics, and three operators were willing to quote for the territory.
RECOMMENDED STRATEGY
Phase 1: Phase one: reject the pilot cost model and re-evaluate at full rollout density, since the infrastructure cost per connection is not comparable between the two. Phase 2: Phase two: tender the network as a managed coverage service rather than a capital build, removing the balance sheet objection without losing the economics. Phase 3: Phase three: specify meter modules certified across all three national band plans, so one hardware design serves the whole group estate throughout.
OUTCOME
The group tendered a managed coverage service and awarded it within two quarters, retaining LoRaWAN for the full replacement programme (client-reported, unverified by MMA). Meter module procurement was consolidated to one certified design across all three countries. The pilot cost model has been withdrawn from the group's evaluation process.

Frequently Asked Questions

Foundational context covering the market sizes, CAGR, scope, country, region and competition that inform every finding below. This section is provided to cover basics and most often pre-purchase conversations, answered from the MMA Primary Research Dataset.

What is the current size of the LoRa and LoRaWAN IoT Market?

Global value reaches USD 2.04 billion in 2026, measured as supplier revenue across LoRa and LoRaWAN device and gateway hardware. The 2025 base is USD 1.8 billion.

How large will the LoRa and LoRaWAN IoT Market be by 2036?

Supplier revenue reaches USD 7.05 billion by 2036, an increase of USD 5.01 billion over the forecast period. That represents 3.46 times expansion from the 2026 base.

What is the CAGR for the LoRa and LoRaWAN IoT Market 2026 to 2036?

The base case runs at 13.2% annually, with a bull case at 14.4% if satellite backhaul matures quickly and a bear case at 11.8% if cellular low-power alternatives win on carrier convenience.

Which segment is growing fastest?

Asset tracking devices grow at 19.8%, half again the market rate of 13.2%. Five year battery life brought returnable pallets, cages and cylinders inside the deployment economics.

Who are the major companies in the LoRa and LoRaWAN IoT Market?

Semtech, Quectel Wireless Solutions, Murata Manufacturing, Kerlink and RAKwireless lead on shipped device and gateway units, together holding 42%. Dozens of smaller manufacturers hold the remainder.

Which country is growing fastest?

India leads at 17.2%, on smart agriculture deployments across Indian states that instrument irrigation, soil moisture and pump status. Brazil and Saudi Arabia follow some way behind.

Report Segmentation Architecture

The full report scope spans multiple orthogonal segmentation dimensions, with cross-tabulated demand data provided for each dimension pair. Coverage extends further to regional breakdowns, trend trajectories, and the competitive detail needed to support segment-level decision-making.

By Device Class

  • Asset Tracking Devices
  • Industrial Condition Monitoring Nodes
  • Environmental And Agricultural Sensor Nodes
  • Gateways And Base Stations
  • Building Automation Nodes
  • Utility Metering End Devices

By End-Use Industry

  • Water And Gas Utilities
  • Agriculture And Food Production
  • Logistics And Supply Chain
  • Manufacturing And Process Industry
  • Commercial Real Estate
  • Municipal And Public Infrastructure

By Commercial Dimension

  • Direct Enterprise Supply
  • Systems Integrator Channel
  • Managed Network Operator Supply
  • Original Equipment Manufacturer Embedding
  • Electronics Distribution
  • Utility Framework Procurement

By Region

  • North America
  • Western Europe
  • East Asia
  • South Asia and Pacific
  • Latin America
  • Middle East and Africa
  • Eastern Europe

Scope, Methodology, and Coverage

Every figure in this report is reproducible from documented input assumptions. The scope below maps the historical period, the forecast horizon, the segmentation dimensions, and the countries covered, alongside the underlying primary and qualitative methodology.
Historical Period
2020 to 2025
Forecast Period
2026 to 2036
Base Year
2025 (USD billions; MMA Primary Research Dataset, September 2026)
Market Definition
This report covers LoRa radio and LoRaWAN protocol hardware: asset tracking devices, industrial condition monitoring nodes, environmental and agricultural sensor nodes, gateways and base stations, building automation nodes, and utility metering end devices. It excludes network server and device management software, connectivity subscription services, cellular low-power wide-area technologies including NB-IoT and LTE-M, and the application platforms that consume the data these devices produce.
Quantitative Units
USD millions, supplier revenue basis; shipped device and gateway units; node battery life in years; gateway coverage radius in kilometres; average node selling price in USD.
Segmentation Dimensions
Device class; end-use industry; commercial channel; geography across seven regions.
Regions Covered
North America, Western Europe, East Asia, South Asia and Pacific, Latin America, Middle East and Africa, Eastern Europe
Countries Covered
China, Japan, South Korea, Taiwan, India, Australia, Singapore, United States, Canada, Mexico, France, Germany, Netherlands, Switzerland, United Kingdom, Poland, Czechia, Brazil, Saudi Arabia, South Africa.
Key Companies Profiled
Semtech, Quectel Wireless Solutions, Murata Manufacturing, Kerlink, RAKwireless, Ezurio, MultiTech, Tektelic Communications, Milesight IoT, Dragino Technology, Heltec Automation, Browan Communications, Advantech, Adeunis, Seeed Studio.
Quantitative Methodology
Primary survey, n=3,800 respondents, Q4 2025, six countries; demand-side model with trade association cross-validation
Qualitative Methodology
47 expert interviews, Q4 2025; applied to validate demand model assumptions, identify emerging dynamics, and assess competitive positioning
Report Format
PDF and XLSX data workbook (Word format preview document)
Publisher
Market Minds Advisory
Report Code
MMA-2026-TEC-331
Published
September 2026
Contact
sales@marketmindsadvisory.com | www.marketmindsadvisory.com

Purchase the full LoRa and LoRaWAN IoT Market Report (2026 to 2036).

This report sizes the global LoRa and LoRaWAN hardware market from 2026 to 2036 across six device classes, six end-use industries and seven regions. It explains why deployment economics rather than technical merit decide most selections, and why pilot-scale evaluation kills projects that would have been profitable at rollout scale. Cost composition is sourced to company annual reports, with transceiver and controller silicon at 28% of node cost. Regional analysis explains East Asia's manufacturing and deployment lead and North America's preference for cellular subscriptions. Competitive assessment covers 20 named suppliers with four revenue lever analyses.
Deployment economics modelled at pilot and rollout scale
Six device classes sized through to 2036
Node cost composition from company annual reports
Twenty named suppliers assessed on shipped units
Four revenue levers with quantified commercial impact
Anonymised utility metering deployment engagement included in full

Built For The People Who Decide

From boardroom strategy to bench-side execution, this report is read cover-to-cover by leaders shaping the next decade of their industry, turning demand scenarios, market dynamics and valuation benchmarks into decisions.
CXOs/ Presidents/ VPs/ Managers
M&A and Corporate Development
Strategy Teams and R&D Heads
Procurement and Product Directors
Regulatory and Compliance Leaders
Investor Relations and Equity Analysts