Market Minds Advisory
LNG Liquefaction Equipment Market

LNG Liquefaction Equipment Market: LNG Liquefaction Equipment Market. Electric-Drive Compression Meets the Gulf Coast Export Capacity Shift

Gulf Coast export terminal operators are shifting toward electric-drive compression trains as decarbonization pressure mounts, reshaping which equipment vendors capture margin as global fabrication yard scarcity tightens further across the industry.

Lead Analyst

Published

September 2026

Make Smarter Decisions with Customized Research Insights

Request a free sample report and evaluate market opportunities, growth trends, and competitive dynamics relevant to your business needs.

2025 MARKET VALUE$8.4BMarket Size 2025
2036 FORECAST VALUE$16.6BBase Case , 2026 to 2036
CAGR 2026 TO 20366.4 %Bull 7.6% / Bear 5.2%
INCREMENTAL OPPORTUNITY$7.7BNet 10- year value creation
EXPANSION MULTIPLE1.86x2036 value over 2026 base
Strategic Levers
M&A Pipeline
Regional Outlook
Country Rankings
Competitive Intelligence
Segmental Deep-dive
Call-Us : 91 93563 13602

Executive Snapshot and Market Trajectory.

Gulf Coast export terminal operators are shifting toward electric-drive compression trains as decarbonization pressure mounts, and that shift is reshaping which equipment vendors capture the strongest position in new liquefaction train awards. Buyers now treat electric-drive compression as a genuine competitive differentiator rather than a niche decarbonization feature.
Commercial momentum concentrates around main cryogenic heat exchangers and large compression trains, since both represent the highest-value equipment packages in any liquefaction facility and carry the longest lead times. North America and the Middle East account for the largest share of near-term equipment order volume, reflecting record Gulf Coast export capacity additions and Qatar's North Field expansion programme. Vendors without proven large-scale electric-drive references increasingly struggle to win specification in new final investment decision projects.
Competition splits between large integrated equipment conglomerates offering full liquefaction technology packages and specialist manufacturers selling standalone compressor or heat exchanger equipment. Rising electric-drive adoption and modular floating liquefaction designs are increasingly shaping which equipment architectures developers standardize around for the next generation of export projects. Developers are increasingly favoring modular fabrication approaches as onshore construction labor costs and schedule risk continue climbing steadily worldwide.
Market Definition
This market covers liquefaction equipment used in LNG production facilities, including main cryogenic heat exchangers, compression trains, gas turbine and electric motor drivers, and boil-off gas recovery systems. It excludes upstream gas processing equipment, LNG carriers, and regasification terminal equipment.
Base Year Value
$8.4B in 2025 (MMA Primary Research Dataset, September 2026)
Forecast Period
2026 to 2036, eleven discrete annual values
CAGR
6.4% base case. Bull 7.6%. Bear 5.2%.
Fastest Growth Segment
Modular and Floating Liquefaction Units: 12.6% CAGR
Fastest Growth Country
Qatar: 9.8% CAGR
Fastest Growth Region
South Asia and Pacific: 8.2% CAGR
Largest Region
North America: 31% of 2025 global value
Market Leaders
Baker Hughes Company, Air Products and Chemicals Inc, Chart Industries Inc, Linde plc, Honeywell International Inc. Source: MMA Analysis based on company annual reports.
Primary Survey
n=3,800 procurement and R&D decision-makers, Q4 2025, six countries
Methodology
Demand-side build-up, cross-validated against public data, 47 expert interviews

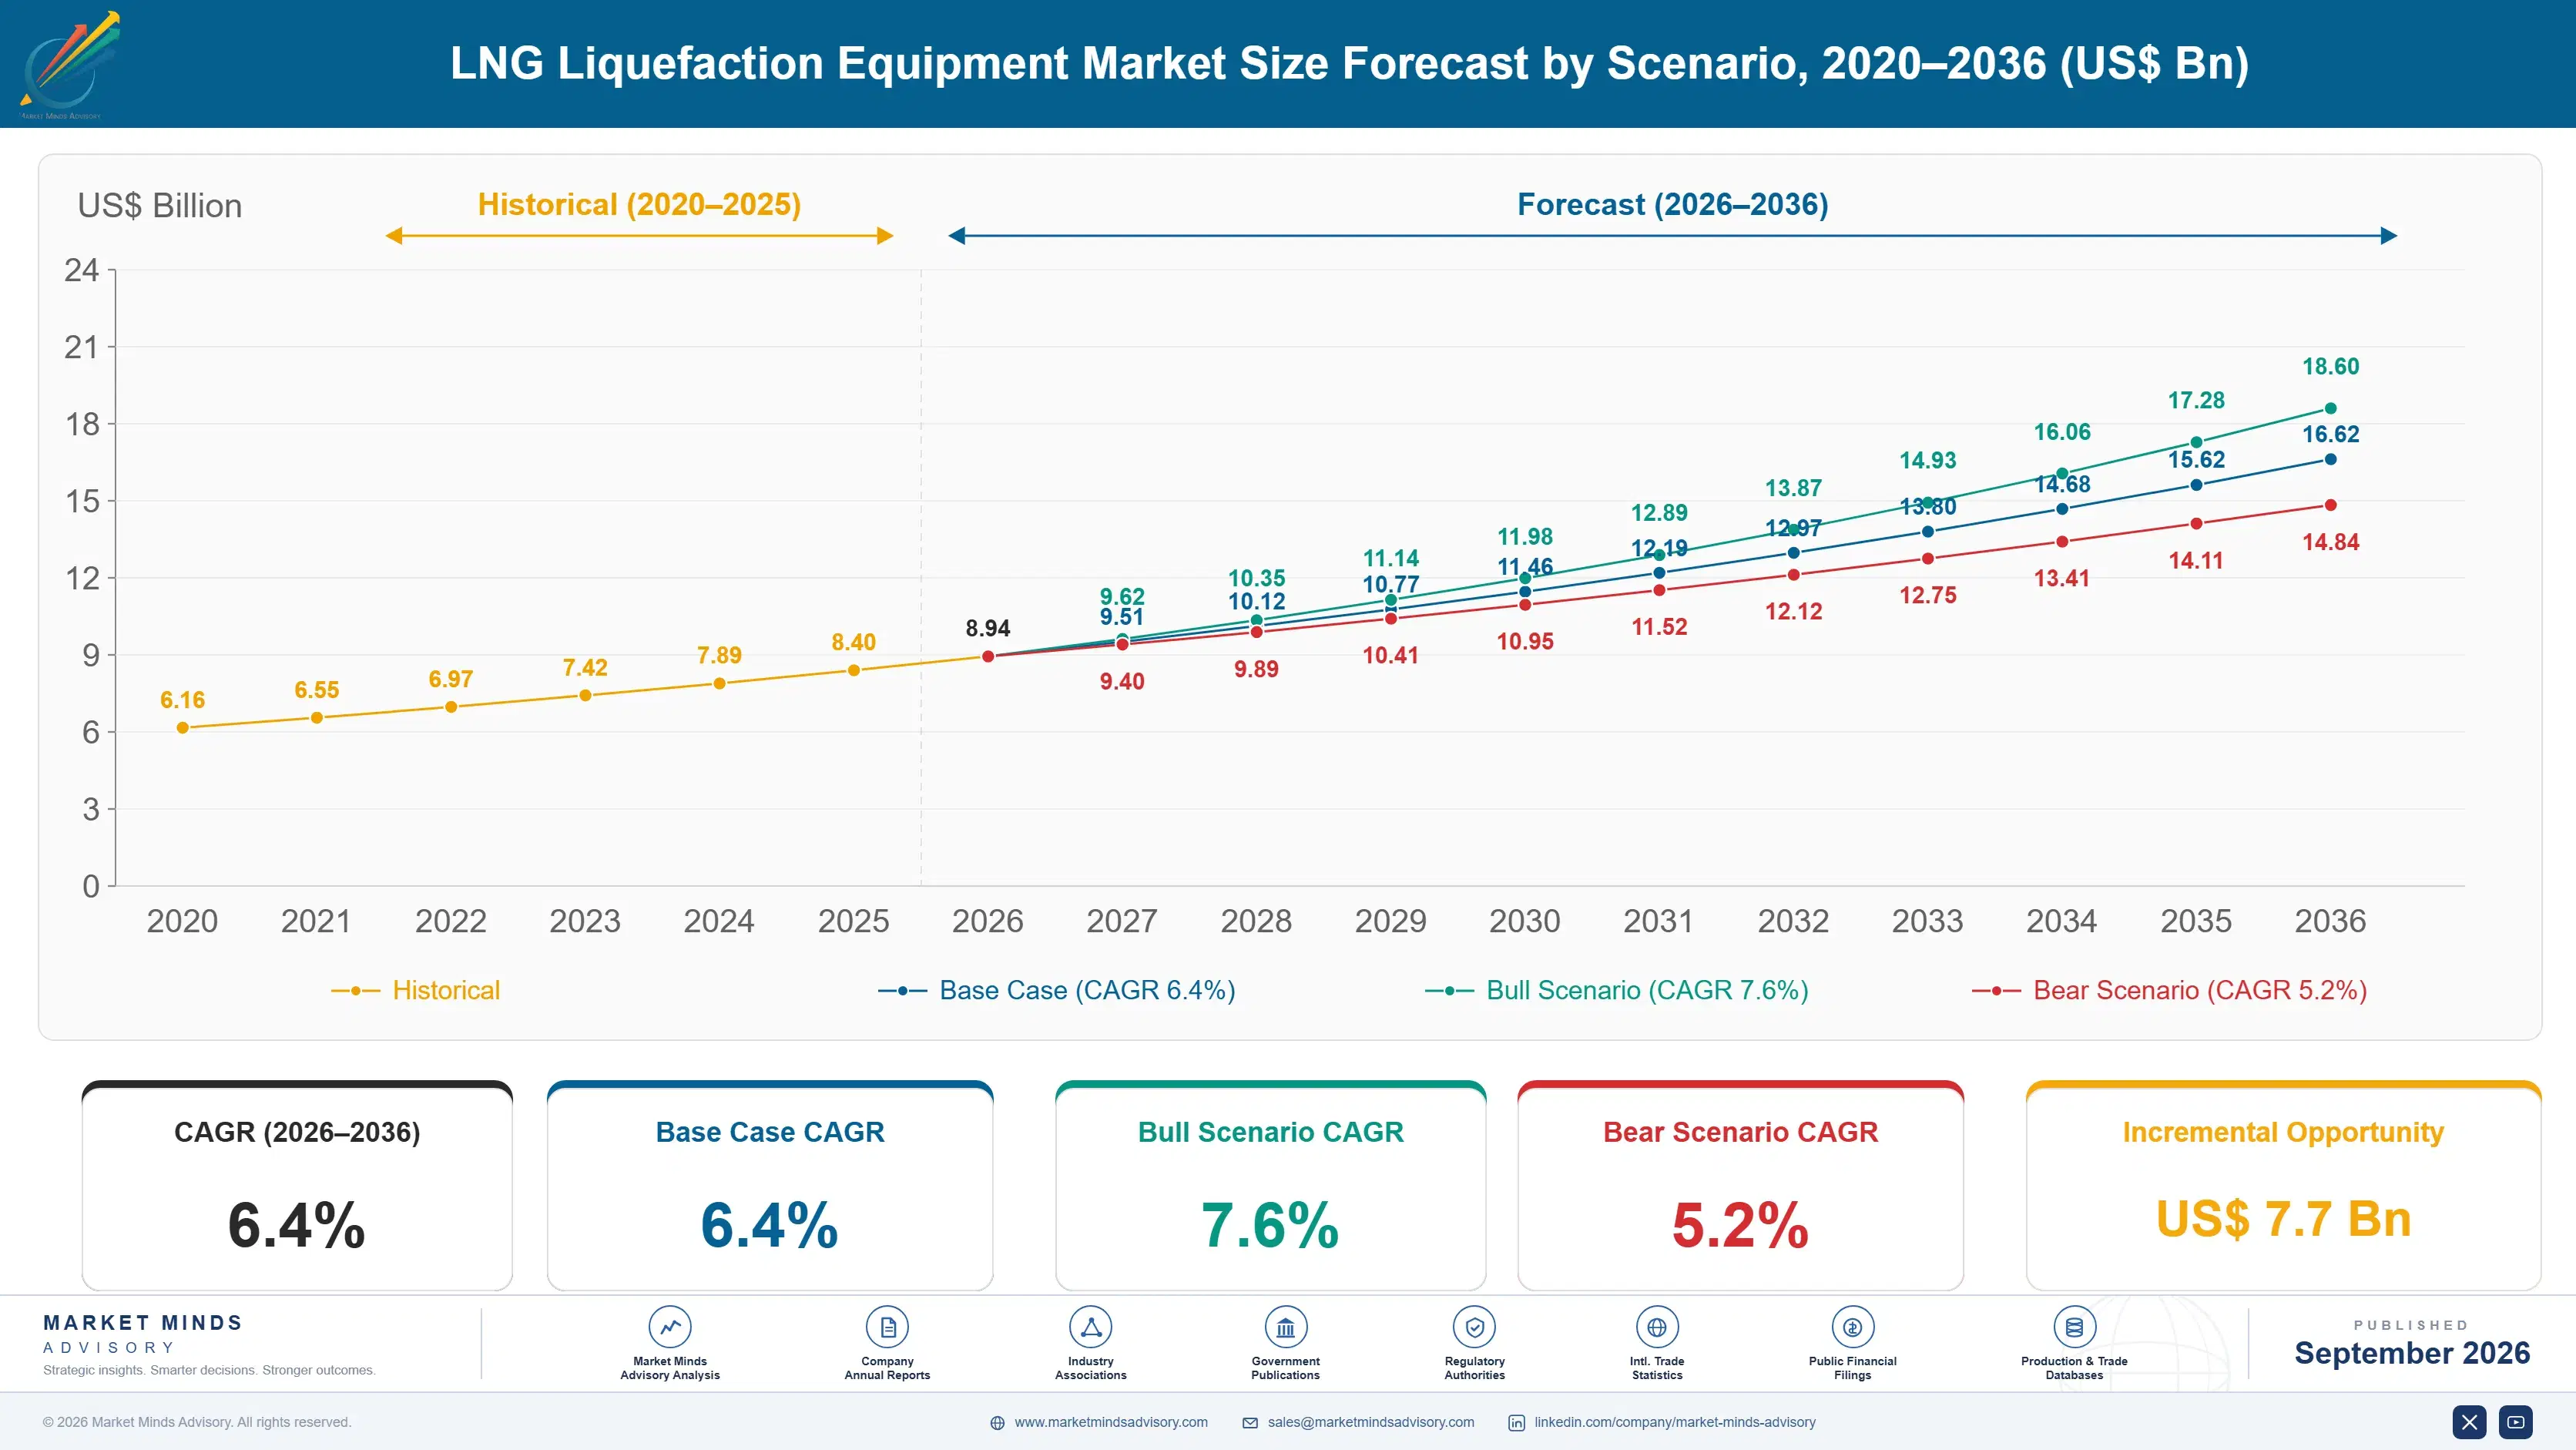
LNG Liquefaction Equipment Market Forecast Scenarios

lng-liquefaction-equipment-market-size-forecast-scenario-1788255329177
Between 2020 and 2025, LNG liquefaction equipment demand grew steadily as multiple Gulf Coast export terminals reached final investment decision and began major equipment procurement following a pandemic-driven pause in project sanctioning. Historical growth ran close to 5.7 percent annually over that period. Equipment vendors with pre-qualified engineering packages captured the strongest order gains as developers raced to lock in slots.
The base case assumes continued capacity expansion, driven by three commercial mechanisms working together: sustained European and Asian demand for diversified gas supply following recent geopolitical disruption, developers increasingly specifying electric-drive compression to meet corporate decarbonization commitments, and Qatar's North Field expansion pulling substantial equipment order volume into the Middle East region. These mechanisms together sustain steady mid-single-digit growth even as overall global gas price volatility complicates long-term project financing decisions.
A bull scenario assumes faster final investment decisions across the current project pipeline and broader electric-drive adoption, pushing growth toward the top of the forecast range. The bear risk centers on demand uncertainty: if global gas demand growth slows meaningfully, some proposed liquefaction projects could be deferred or cancelled entirely. Either scenario leaves demand above the flat growth rates typical of the most mature energy equipment categories.

Where Compression Technology Meets Export Economics

Converging forces are reshaping liquefaction equipment strategy: record Gulf Coast export capacity additions, growing corporate decarbonization commitments, and constrained global fabrication yard capacity are pushing equipment procurement decisions from routine specification into a genuine strategic capital allocation priority. Board-level scrutiny of fabrication yard availability has made equipment slot reservation a standing capital planning priority across most major export project developers.
MARKET CONCENTRATIONCR5 52%top five vendors hold roughly half of global share
AVERAGE TRAIN EQUIPMENT COST$1.2B-$3.5B per liquefaction trainvaries with train capacity and drive technology selected
LEADING PRODUCING COUNTRY SHAREUSA 34% of announced capacityreflecting record Gulf Coast export terminal construction activity
ELECTRIC-DRIVE ADOPTION RATE38% of new train announcementsrising steadily as decarbonization commitments shape procurement decisions
MODULAR FABRICATION PENETRATION26% of new project capacityreflecting growing preference for offsite construction and assembly
EQUIPMENT LEAD TIME EXPOSUREaverage 30-42 monthsreinforcing the value of early equipment slot reservation strategies
Commercial character in this market splits between large integrated equipment conglomerates offering full liquefaction technology packages and specialist manufacturers selling standalone compressor or heat exchanger equipment through direct developer procurement. Equipment lead time and fabrication yard capacity increasingly determine which vendors win specification in new export terminal awards. Vendors that lack established electric-drive reference projects increasingly struggle to win specification against incumbents with proven multi-decade operating track records.
Electric-drive compression adoption, modular fabrication yard capacity constraints, and rising Middle Eastern expansion investment will shape vendor strategy and product design over the next decade. Vendors that delay electric-drive investment risk losing specification to better-positioned rivals with proven decarbonization-aligned product lines. That lock-in dynamic already favors early movers who invested in electric-drive engineering capability well ahead of the broader industry shift.
"Everyone assumes the liquefaction technology license is the hard part, but the developers actually hitting their in-service dates are the ones who locked in fabrication yard slots years before breaking ground."
Director, Energy Practice · MMA Energy Practice · September 2026

Market Trends

Electric-Drive Compression Trains Displace Gas Turbine Designs

Developers are increasingly specifying electric motor-driven compressors over traditional gas turbine drives, since electric drives eliminate direct combustion emissions at the liquefaction facility and can be powered by grid electricity or dedicated renewable generation. Baker Hughes and Siemens Energy have both expanded large-scale electric-drive compression product lines within the past two years, and announced project data suggests electric-drive designs already account for a meaningfully growing share of new train announcements, a pace that smaller equipment vendors are increasingly racing to match through their own electric motor and variable frequency drive development investment.
Market Impact: Adds 16 percent to demand
Modular Fabrication Yards Reshape Construction Delivery Models

Developers are increasingly specifying modular pre-fabricated equipment modules assembled at dedicated fabrication yards rather than stick-built construction on site, reducing schedule risk and labor cost exposure considerably. Major fabrication yards in Southeast Asia and the Middle East have expanded capacity to meet growing demand, and several developers have signed multi-year yard reservation agreements to secure priority slots. This shift is reshaping how equipment vendors plan manufacturing and logistics investment across their broader global supply chain footprint. Vendors without established fabrication yard partnerships increasingly struggle to compete on delivery schedule against better-positioned rivals.
Market Impact: Expands electric-drive demand 20 percent

Market Opportunities and Growth Drivers

European Gas Diversification Sustains Long-Term Contract Demand

European utilities and governments continue signing long-term LNG supply agreements to diversify away from pipeline gas dependence following recent geopolitical supply disruption, sustaining demand visibility for developers seeking to reach final investment decision on new liquefaction capacity. Several major European buyers have signed contracts exceeding fifteen years in duration with Gulf Coast and Qatari export projects, giving equipment vendors unusually strong forward demand visibility relative to prior investment cycles that depended more heavily on shorter-term spot market pricing signals. Vendors continue racing to secure comparable long-term supply relationships across additional buyer markets.
Market Impact: Adds 6-12 months delay

Corporate Decarbonization Commitments Expand Electric-Drive Specification

Major energy companies developing new liquefaction capacity increasingly face investor and regulatory pressure to minimize facility-level emissions, pushing equipment specification toward electric-drive compression trains powered by grid or renewable electricity rather than direct gas turbine combustion. This shift is expanding addressable demand for electric motor and variable frequency drive manufacturers well beyond their historical share of the compression equipment market, pulling new vendors into a segment previously dominated by turbine manufacturers with decades of installed base advantage. Vendors continue racing to build comparable electric motor manufacturing capability at scale. Adoption keeps expanding.
Market Impact: Delays sanctioning by 18 months

Market Restraints and Challenges

Fabrication Yard Capacity Constraints Delay Project Delivery

Global modular fabrication yard capacity has not kept pace with the surge of liquefaction projects reaching final investment decision simultaneously, and the root cause is straightforward: building new fabrication yard capacity itself requires years of capital investment that developers cannot accelerate on short notice. This bottleneck has extended equipment delivery timelines for several major projects beyond original schedules, increasing financing carrying costs for developers. Vendors are mitigating this through early yard slot reservation agreements and diversified fabrication partnerships, though full capacity relief remains several years away for the most constrained yards.
Market Impact: Lifts electric-drive adoption to 38 percent

Demand Uncertainty Complicates Long-Term Project Financing

Global gas demand growth projections vary considerably across forecasting bodies, and the underlying cause traces to genuine uncertainty around the pace of renewable energy substitution and industrial gas demand in key importing economies over coming decades. This uncertainty complicates long-term project financing decisions, since lenders require confidence in decades-long revenue visibility before committing capital to multi-billion dollar liquefaction projects. Developers are mitigating this through long-term offtake contracts that de-risk financing, though some proposed projects remain stalled at final investment decision as a result. Progress remains slow but steady across most jurisdictions.
Market Impact: Lifts modular fabrication to 26 percent
4 additional market trends, 3 additional growth drivers, and 2 additional restraints and challenges are covered in the full report. Contact sales@marketmindsadvisory.com to access the complete intelligence.

Segment CAGR and Growth Architecture

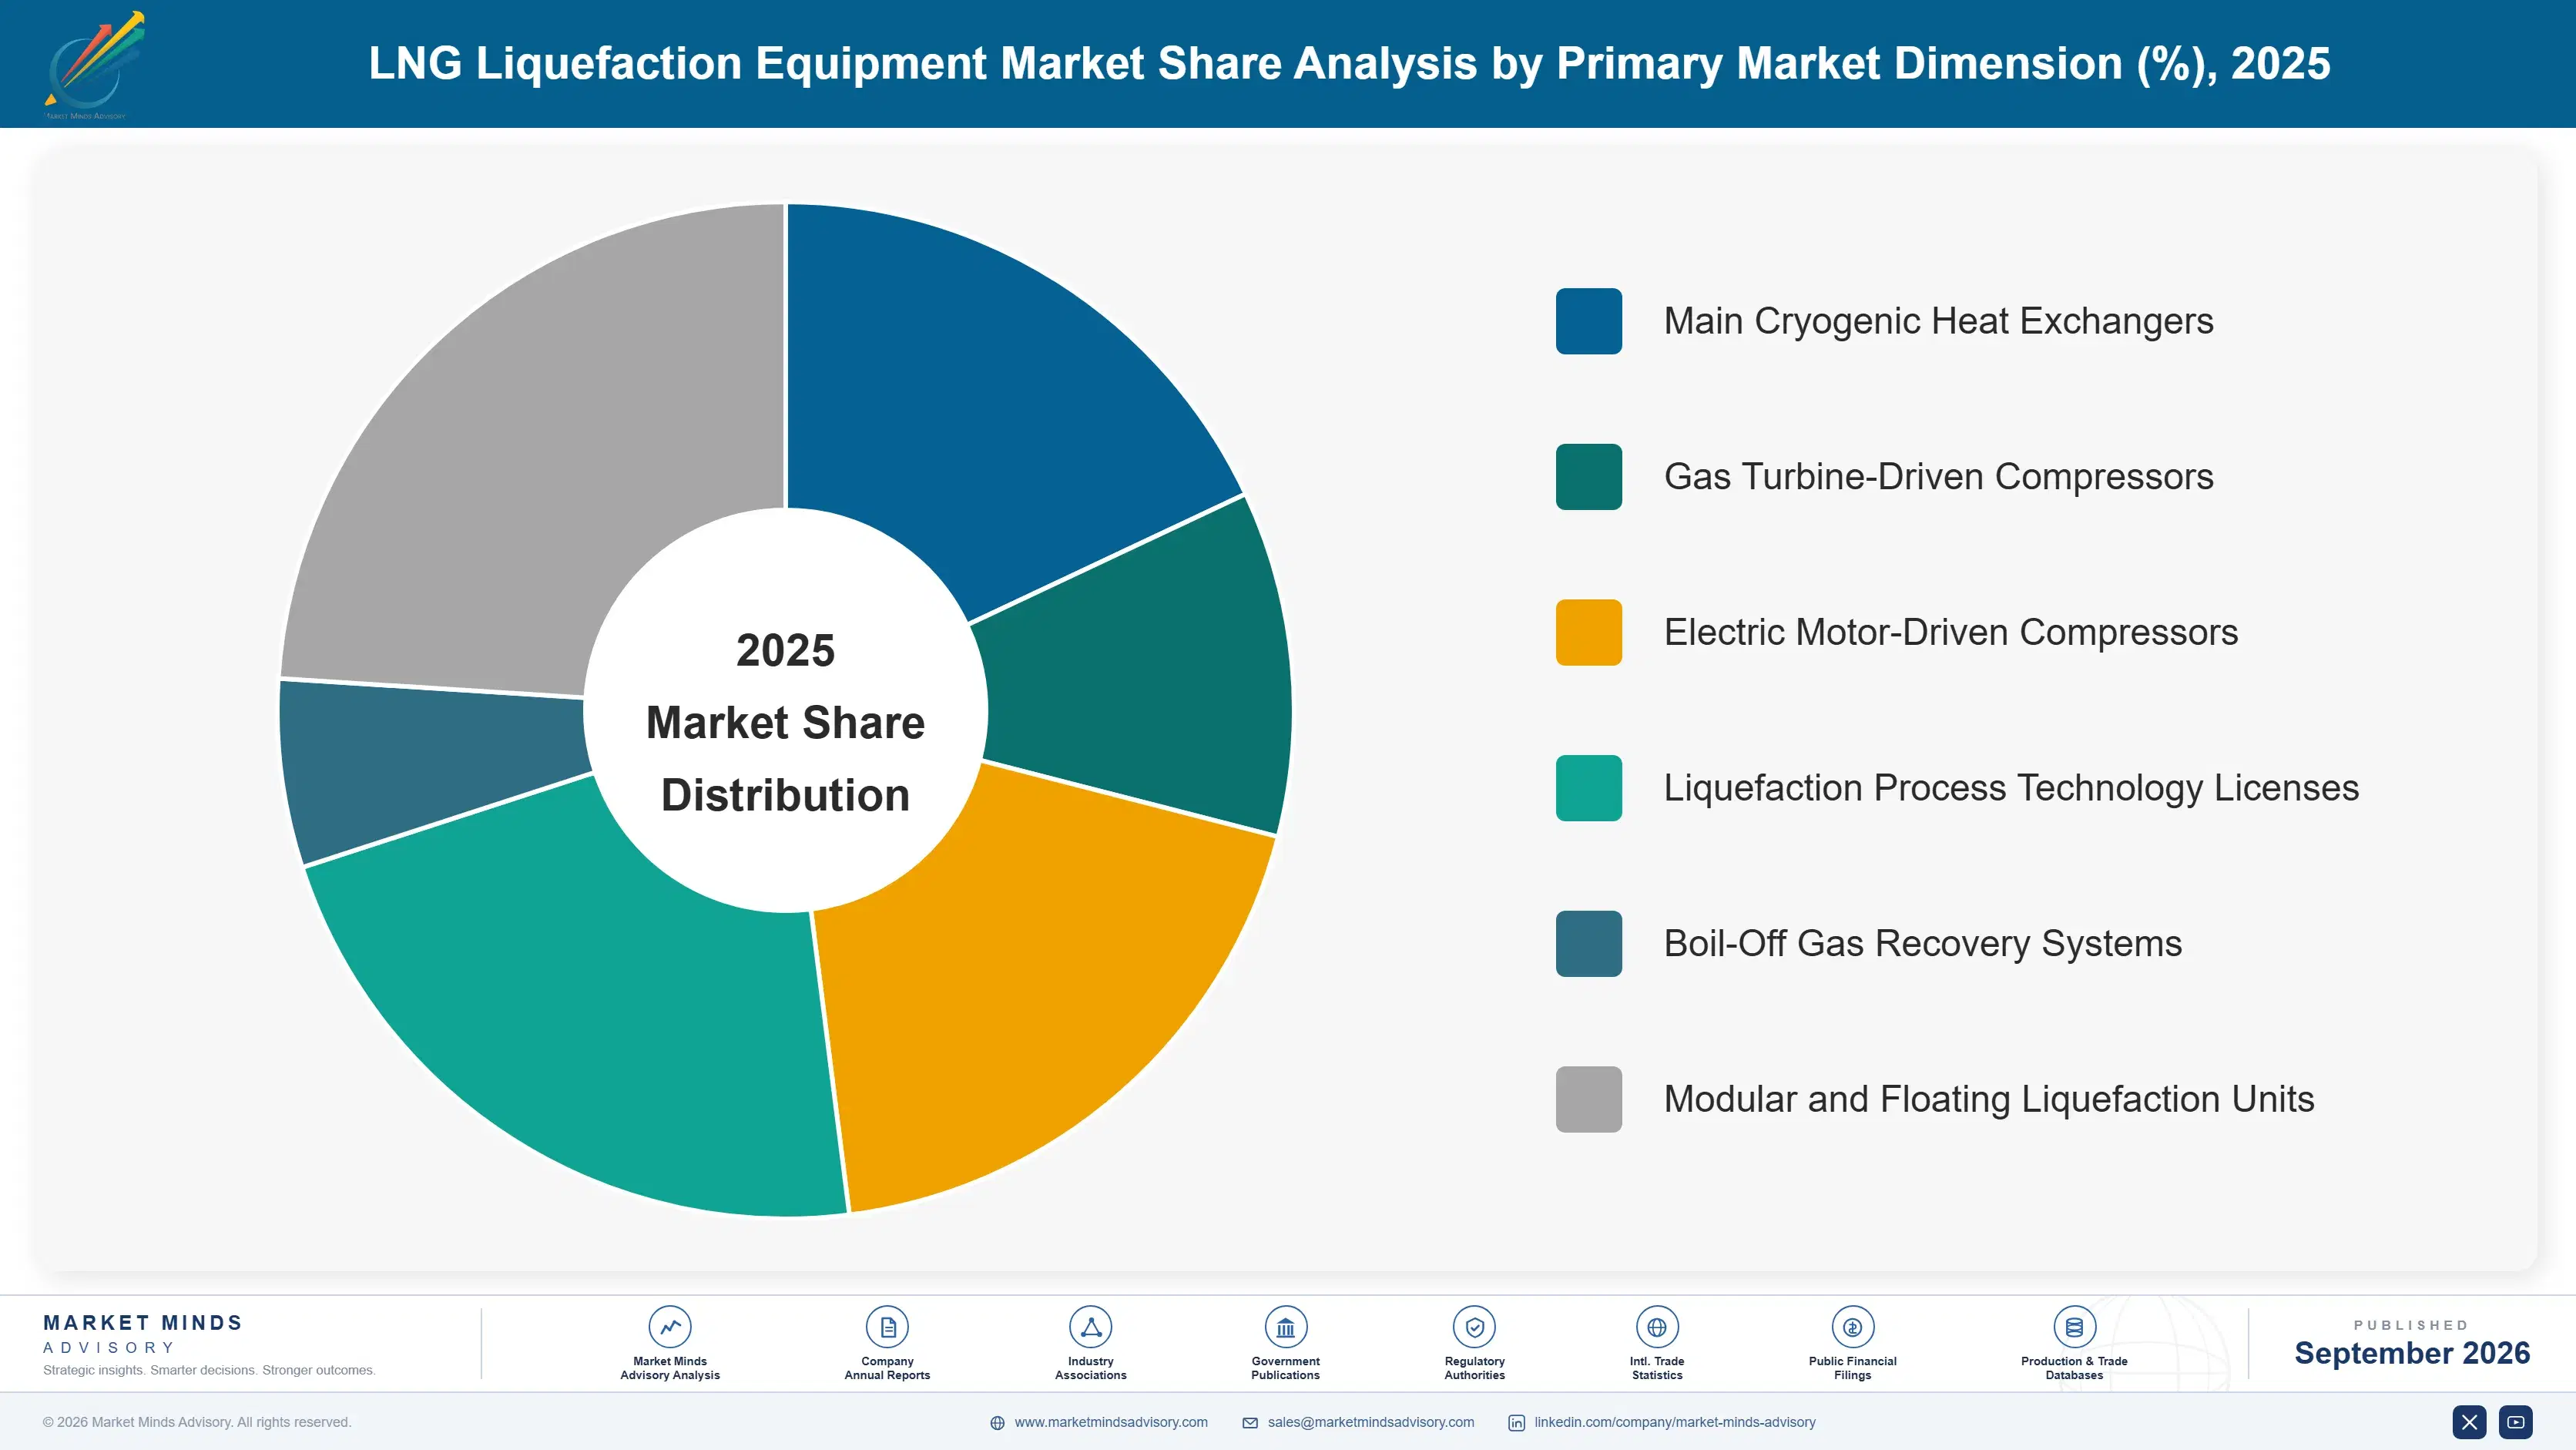
Segmentation follows equipment and technology type, since developers procure, specify, and price liquefaction equipment by distinct package category rather than by end-use application, and each type carries a genuinely different cost and delivery timeline profile. This dimension also lines up cleanly with how developer procurement specifications and vendor qualification processes are structured across the industry.
lng-liquefaction-equipment-market-market-share-analysis-1788255329716

Modular and Floating Liquefaction Units

Modular and floating liquefaction units combine liquefaction trains into pre-fabricated modules or dedicated floating vessels, eliminating much of the onsite construction and permitting complexity that traditional onshore facilities require. This segment is growing fastest because developers favor faster deployment and lower capital cost over the marginal efficiency edge of larger onshore trains, particularly for smaller stranded gas resources. Vendors compete heavily on modular fabrication yard access and proven floating platform engineering, since limited yard capacity increasingly determines which developers can secure near-term delivery slots, giving established specialists a durable advantage over new entrants lacking proven fabrication relationships. Fabrication yard operators report a steady pipeline of new module orders extending well into the next several years.
CAGR 12.6%

Electric Motor-Driven Compressors

Electric motor-driven compressors replace traditional gas turbine drivers with large electric motors powered by grid or dedicated renewable electricity, eliminating direct combustion emissions at the compression stage entirely. Growth here is driven by corporate decarbonization commitments and investor pressure pushing developers to minimize facility-level emissions wherever technically feasible. This segment increasingly competes directly with gas turbine designs for new train specification, and manufacturers able to demonstrate proven large-scale electric-drive reliability through operating references increasingly command a durable pricing advantage over turbine-only competitors lacking comparable track records. Vendors that invested early in large-scale electric-drive engineering are now capturing the strongest specification advantage across major decarbonization-focused developer procurement programmes worldwide. Growth continues broadly.
CAGR 9.4%
Full segment breakdown across 6 segments available in the complete report.

Regional Architecture and Country Demand Map

North America leads global demand given record Gulf Coast export capacity additions, with the Middle East close behind on Qatar's North Field expansion programme. East Asia's share sits below the typical range since the region is primarily an LNG importer rather than a liquefaction facility builder.

North America

The United States drives the region's demand, hosting the world's largest concentration of liquefaction projects under construction or recently sanctioned along the Texas and Louisiana Gulf Coast. Sabine Pass, Freeport, Golden Pass, Plaquemines, and Corpus Christi collectively represent tens of billions of dollars in equipment procurement across multiple simultaneous project phases. Canadian West Coast projects add meaningful additional regional demand, targeting Asian buyers with shorter shipping distances than Gulf Coast alternatives. This regional dominance reflects both abundant domestic shale gas feedstock and faster project permitting relative to many competing jurisdictions worldwide. Vendors expect this dominant position to persist given the scale of the current sanctioned project pipeline extending well into the next decade.
Share: 31% | CAGR: 7.5% (2026 to 2036)

Western Europe

The United Kingdom and Norway host modest regional liquefaction capacity, though the region functions primarily as an LNG import market rather than a major export equipment buyer given limited domestic gas surplus for export. Existing European liquefaction facilities are aging and receiving selective equipment upgrades rather than full new-build investment. Norwegian Arctic LNG facilities sustain modest ongoing equipment demand tied to harsh operating environment maintenance requirements. Growth here trails North America and the Middle East considerably, reflecting the region's underlying position as a demand center rather than a supply source for global gas trade. Vendors expect this secondary role to persist absent a major shift in the region's underlying gas supply position.
Share: 19% | CAGR: 5.1% (2026 to 2036)
Regional intelligence for 5 additional markets available in the complete report: East Asia, South Asia and Pacific, Latin America, Middle East and Africa, Eastern Europe. Contact sales@marketmindsadvisory.com.
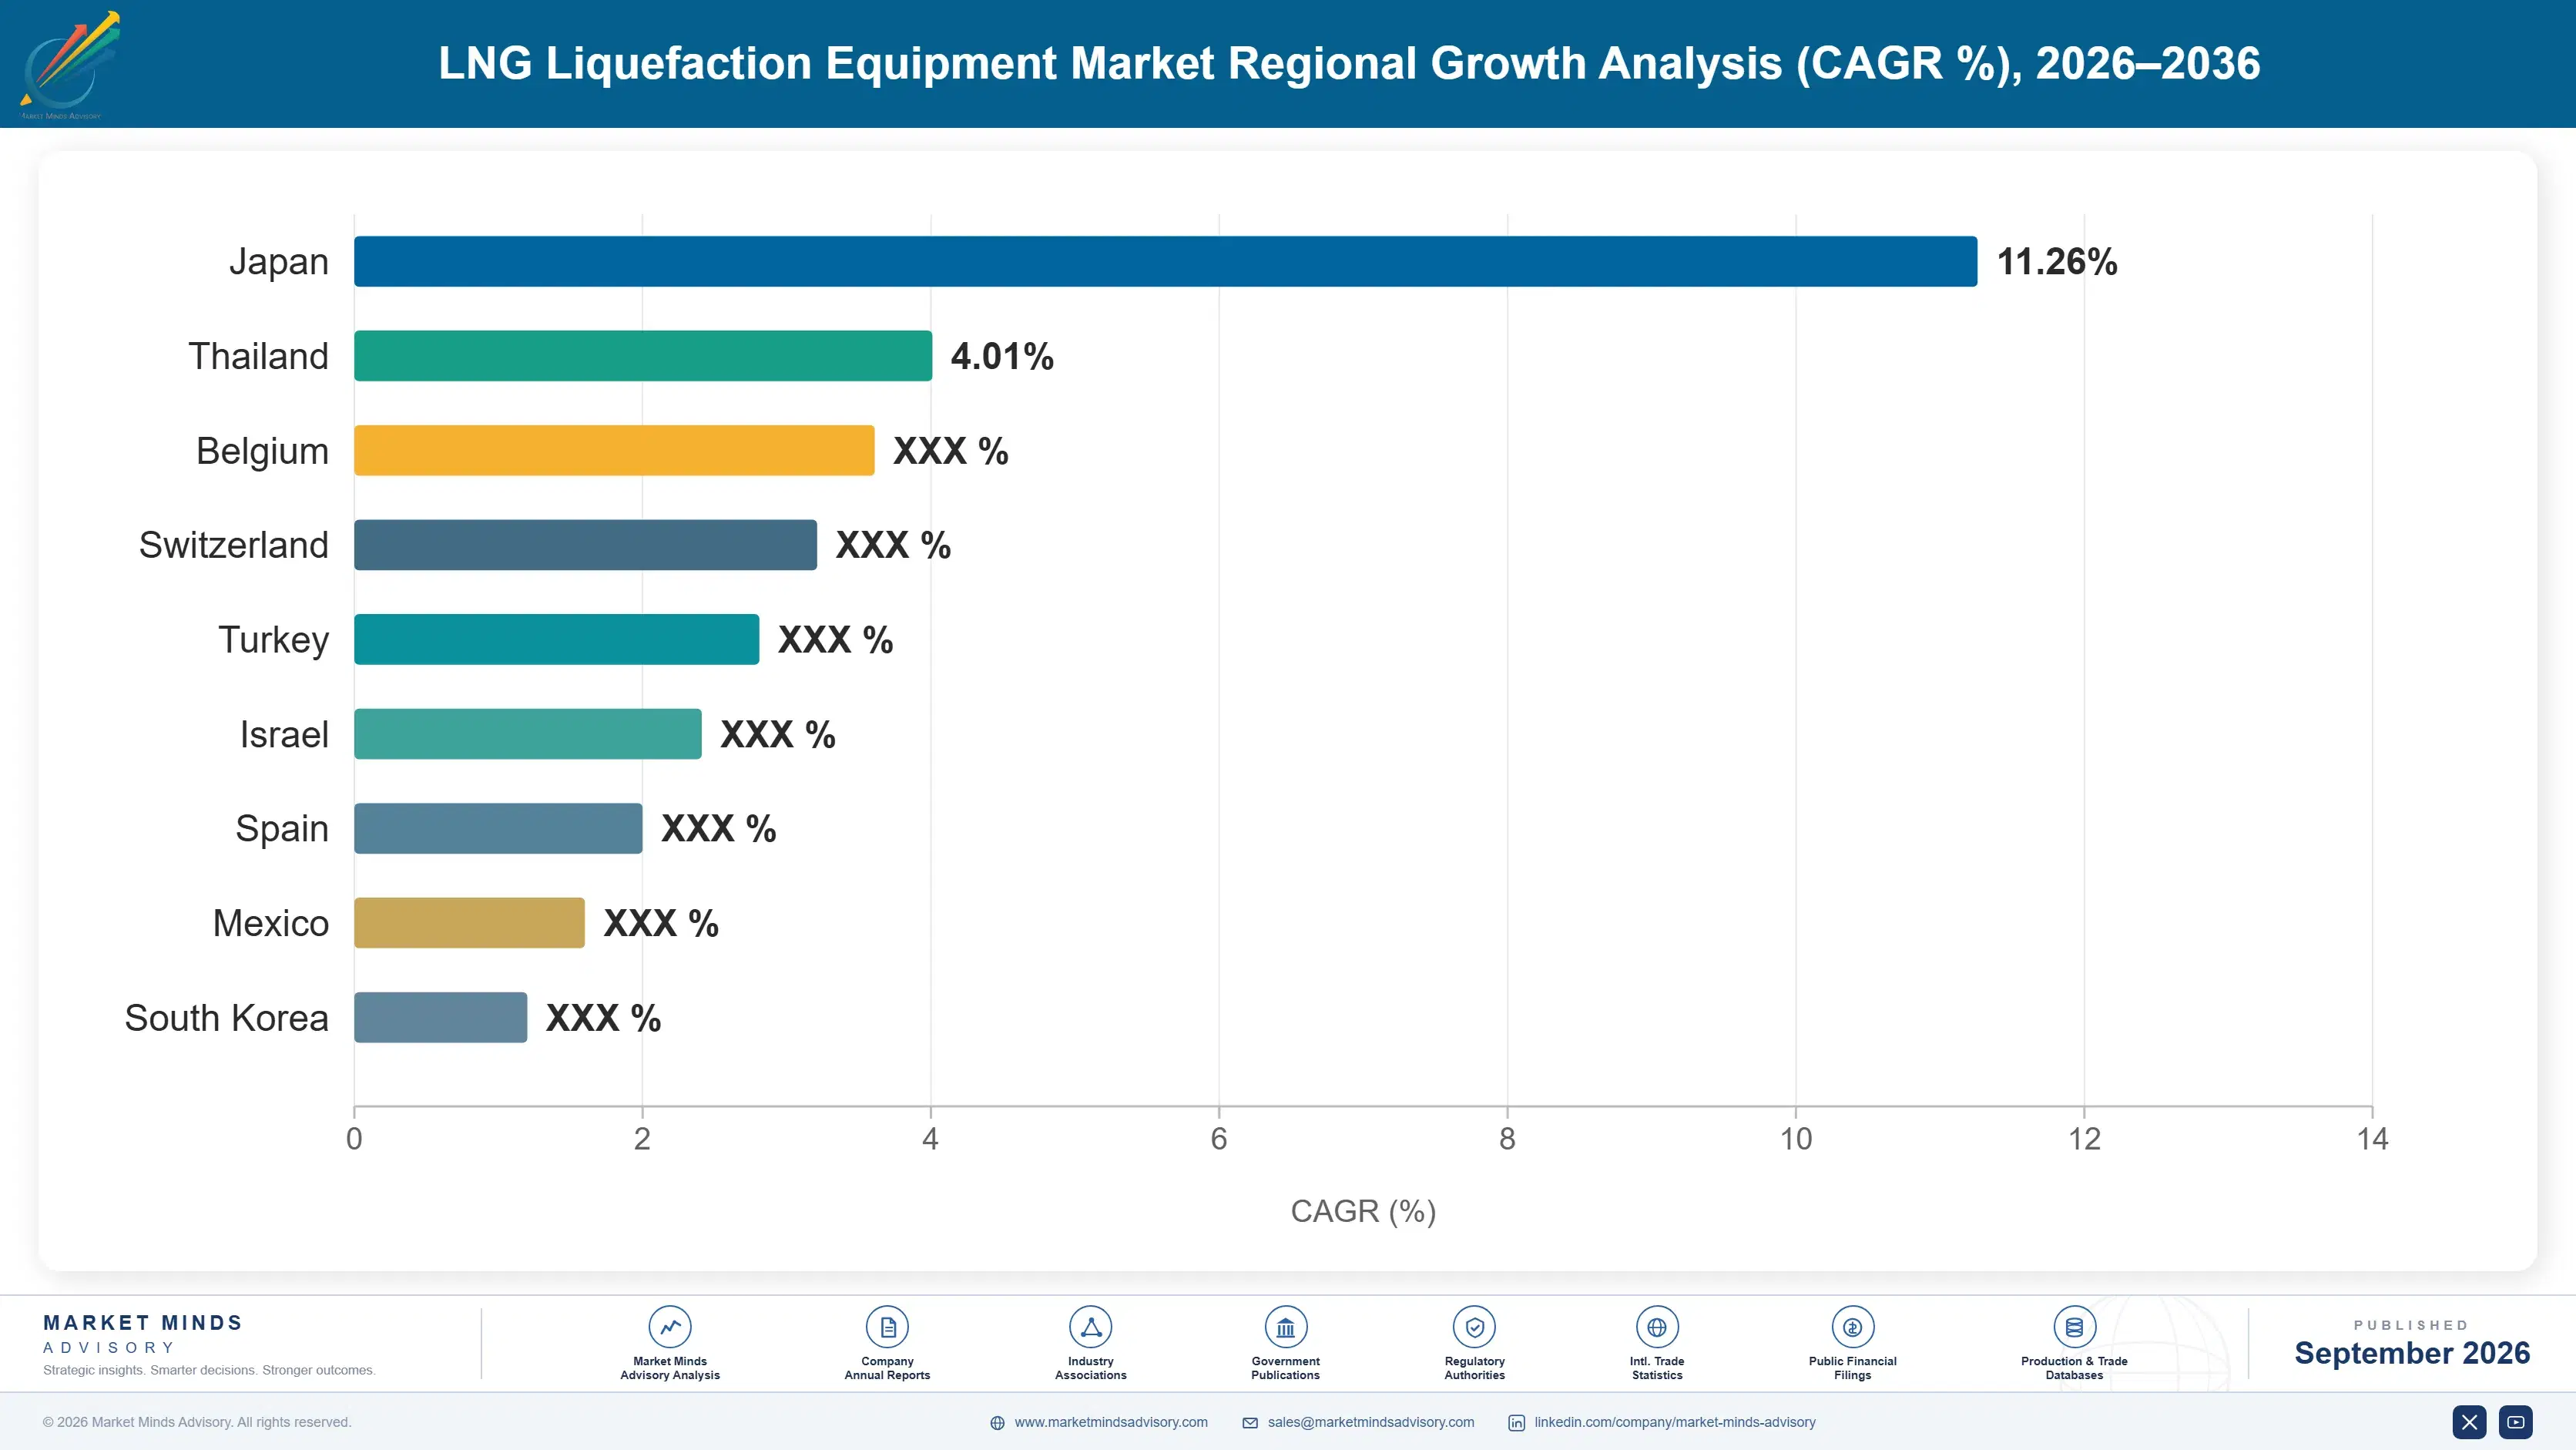
lng-liquefaction-equipment-market-country-cagr-analysis-1788255330244

Where Delivery Speed Pays Off

Beyond core equipment sales, four commercial mechanisms let vendors capture additional margin from existing manufacturing capacity without expanding installed fabrication footprint or engineering headcount they already maintain. Vendors executing on several of these simultaneously outgrow the broader market meaningfully faster than equipment-only competitors relying purely on unit sales. These levers separate top performers here.

Fabrication Yard Slot Reservation Premium Contracts

Vendors that secure priority fabrication yard slots ahead of capacity constraints can offer developers guaranteed delivery schedules that spot-market competitors cannot match, commanding a meaningful premium for this certainty. Developers report paying roughly 15 percent above standard pricing to secure guaranteed slots during periods of peak yard demand, a premium vendors increasingly capture given the genuine scarcity of available fabrication capacity across the industry. This premium pricing strategy is spreading quickly as more vendors recognize how quickly fabrication capacity has tightened across the industry. Few smaller vendors can match this fabrication scale today.
Market Impact: Captures roughly 15 percent premium pricing overall today

Long-Term Maintenance and Spare Parts Contracts

Vendors that bundle long-term maintenance and spare parts agreements alongside initial equipment sales capture recurring revenue that compounds across the facility's multi-decade operating life, well beyond the original equipment transaction. This bundled approach has already lifted total contract value by roughly 22 percent for vendors offering it, appealing particularly to developers seeking predictable long-term operating cost certainty. Manufacturers without established maintenance capability increasingly struggle to match this recurring revenue advantage across major developer relationships. Few smaller manufacturers can match this recurring service depth currently. Adoption keeps rising. Growth continues broadly.
Market Impact: Lifts total contract value by roughly 22 percent

Offering Electric-Drive Conversion Retrofit Services Directly

Vendors that offer retrofit conversion services transitioning existing gas turbine-driven facilities to electric-drive compression capture additional revenue from operators facing emissions reduction pressure without undertaking full facility replacement. This retrofit approach has already captured roughly 18 percent of new decarbonization-linked contract value for vendors offering it, appealing particularly to operators managing aging turbine-driven assets. This retrofit demand is expected to grow further as emissions regulation tightens across additional operating jurisdictions worldwide. Few smaller manufacturers can match this retrofit engineering depth currently. Adoption keeps rising steadily. Growth continues nationwide. Vendors expect this trend to continue.
Market Impact: Captures roughly 18 percent of retrofit value overall

Modular Design Licensing and Engineering Services

Vendors that license proven modular liquefaction designs to smaller developers lacking in-house engineering capability capture additional revenue beyond core equipment manufacturing, extending their commercial reach without proportional capital investment. This licensing approach has already lifted engineering services revenue by roughly 25 percent for vendors offering it, appealing particularly to smaller developers pursuing stranded gas monetization projects. Vendors offering this licensing model increasingly compete for the same emerging stranded gas project opportunities. Few smaller manufacturers can match this licensing engineering depth currently. Adoption keeps rising steadily. Growth continues broadly. Vendors expect this trend to continue.
Market Impact: Lifts engineering services revenue by roughly 25 percent

Who Controls the Margin Pool

The top five vendors hold roughly 52 percent of global equipment order value, a concentration built on decades of process technology licensing and large-scale engineering expertise that smaller entrants cannot easily replicate. The gap between leaders and mid-tier challengers is widening as fabrication yard access becomes increasingly scarce. Several mid-tier vendors have pursued acquisitions of electric motor manufacturers to compete more effectively on decarbonization-linked specification.
Current competitive activity centers on three fronts: expanding electric-drive compression capability to meet decarbonization-linked specification requirements, securing long-term fabrication yard partnerships to guarantee delivery schedules, and building modular design licensing capability for smaller stranded gas developers. Large conglomerates increasingly compete with specialist manufacturers on delivery certainty rather than technology alone. This convergence has become the dominant competitive pattern across nearly every major project award in recent years.

Emerging pressure comes from Asian shipyard-based fabricators scaling floating liquefaction modules and specialist electric motor manufacturers entering the large-scale compression segment directly. Rankings could shift meaningfully if a fabrication-focused entrant successfully displaces an incumbent's position in a major national programme, which several are actively pursuing. Several such fabrication-focused entrants are already gaining meaningful traction in regional project procurement as of this writing.
lng-liquefaction-equipment-market-company-positioning-matrix-1788255330781

Competitive Moat and Risk Dimensions

BAKER HUGHES COMPANY

Moat: Compression Technology and Scale

Baker Hughes combines decades of large-scale gas compression engineering with a growing electric-drive product portfolio, giving it specification advantages across both traditional and decarbonization-linked project requirements that newer entrants must earn project by project. This dual capability makes displacement genuinely difficult. Few competitors can match this combined scale of compression engineering and electric-drive capability built over decades.
BAKER HUGHES COMPANY

Risk: Legacy Turbine Business Tension

Baker Hughes' substantial existing gas turbine business creates some internal tension as electric-drive adoption accelerates, and balancing investment between legacy and emerging technology lines has proven a genuine strategic challenge across the industry. Investors have flagged this transition tension as a genuine risk worth monitoring closely over coming quarters.
AIR PRODUCTS AND CHEMICALS INC

Moat: Heat Exchanger Engineering Depth

Air Products holds deep proprietary expertise in main cryogenic heat exchanger design, a highly specialized engineering discipline that few competitors have successfully replicated at comparable scale across dozens of major liquefaction project references worldwide. Few competitors can match this concentrated engineering depth built over decades of continuous heat exchanger development.
AIR PRODUCTS AND CHEMICALS INC

Risk: Narrow Product Line Concentration

Air Products' concentration in heat exchanger technology specifically, rather than a broader equipment portfolio, leaves it more exposed to project delays or cancellations than diversified competitors with multiple equipment revenue streams. This narrower revenue base could complicate Air Products' long-term positioning relative to more diversified competitors.

Players Tracked

Prominent Players

Baker Hughes Company
Air Products and Chemicals Inc
Chart Industries Inc
Linde plc
Honeywell International Inc

Other Key Players

Technip Energies N.V.
Black & Veatch Holding Company
KBR Inc
Samsung Heavy Industries Co Ltd
Hyundai Heavy Industries Co Ltd
Hanwha Ocean Co Ltd
Wison Engineering Services Co Ltd
Siemens Energy AG
GE Vernova Inc
Ariel Corporation
Elliott Group
Atlas Copco AB
Sulzer Ltd
Cryostar SAS
Wartsila Corporation

Recent Developments

MARCH 2025

Baker Hughes Wins Electric-Drive Compression Contract For Gulf Coast Train

Baker Hughes secured a major electric-drive compression equipment contract for a new Gulf Coast liquefaction train, marking one of the largest electric motor-driven compression packages awarded to date across the domestic export terminal construction pipeline. Analysts view this as a meaningful scale advantage over smaller electric-drive competitors in the category.
Signal: Signals accelerating electric-drive adoption among major Gulf Coast export developers nationwide. Rivals are expected to respond.
OCTOBER 2024

Air Products Signs Multi-Train Heat Exchanger Supply Agreement

Air Products signed a multi-train heat exchanger supply agreement covering several liquefaction trains at a major Middle Eastern expansion project, securing a multi-year manufacturing commitment tied to the broader North Field capacity programme. The deal covers several billion dollars in equipment value over its duration.
Signal: Signals deepening equipment supply relationships between major vendors and Middle Eastern developers broadly across the industry.
MAY 2024

Chart Industries Expands Modular Fabrication Capacity In Response To Demand

Chart Industries expanded modular fabrication capacity at its primary manufacturing facility to address growing order backlogs tied to expanding floating and modular liquefaction project demand across multiple developer procurement programmes worldwide. The expansion is expected to complete within the next eighteen months. across several production lines.
Signal: Signals continued capacity investment across major modular fabrication equipment manufacturers. Expect peer manufacturers to pursue similar capacity investments over time.

Specialty Steel and Aluminum Cost Exposure

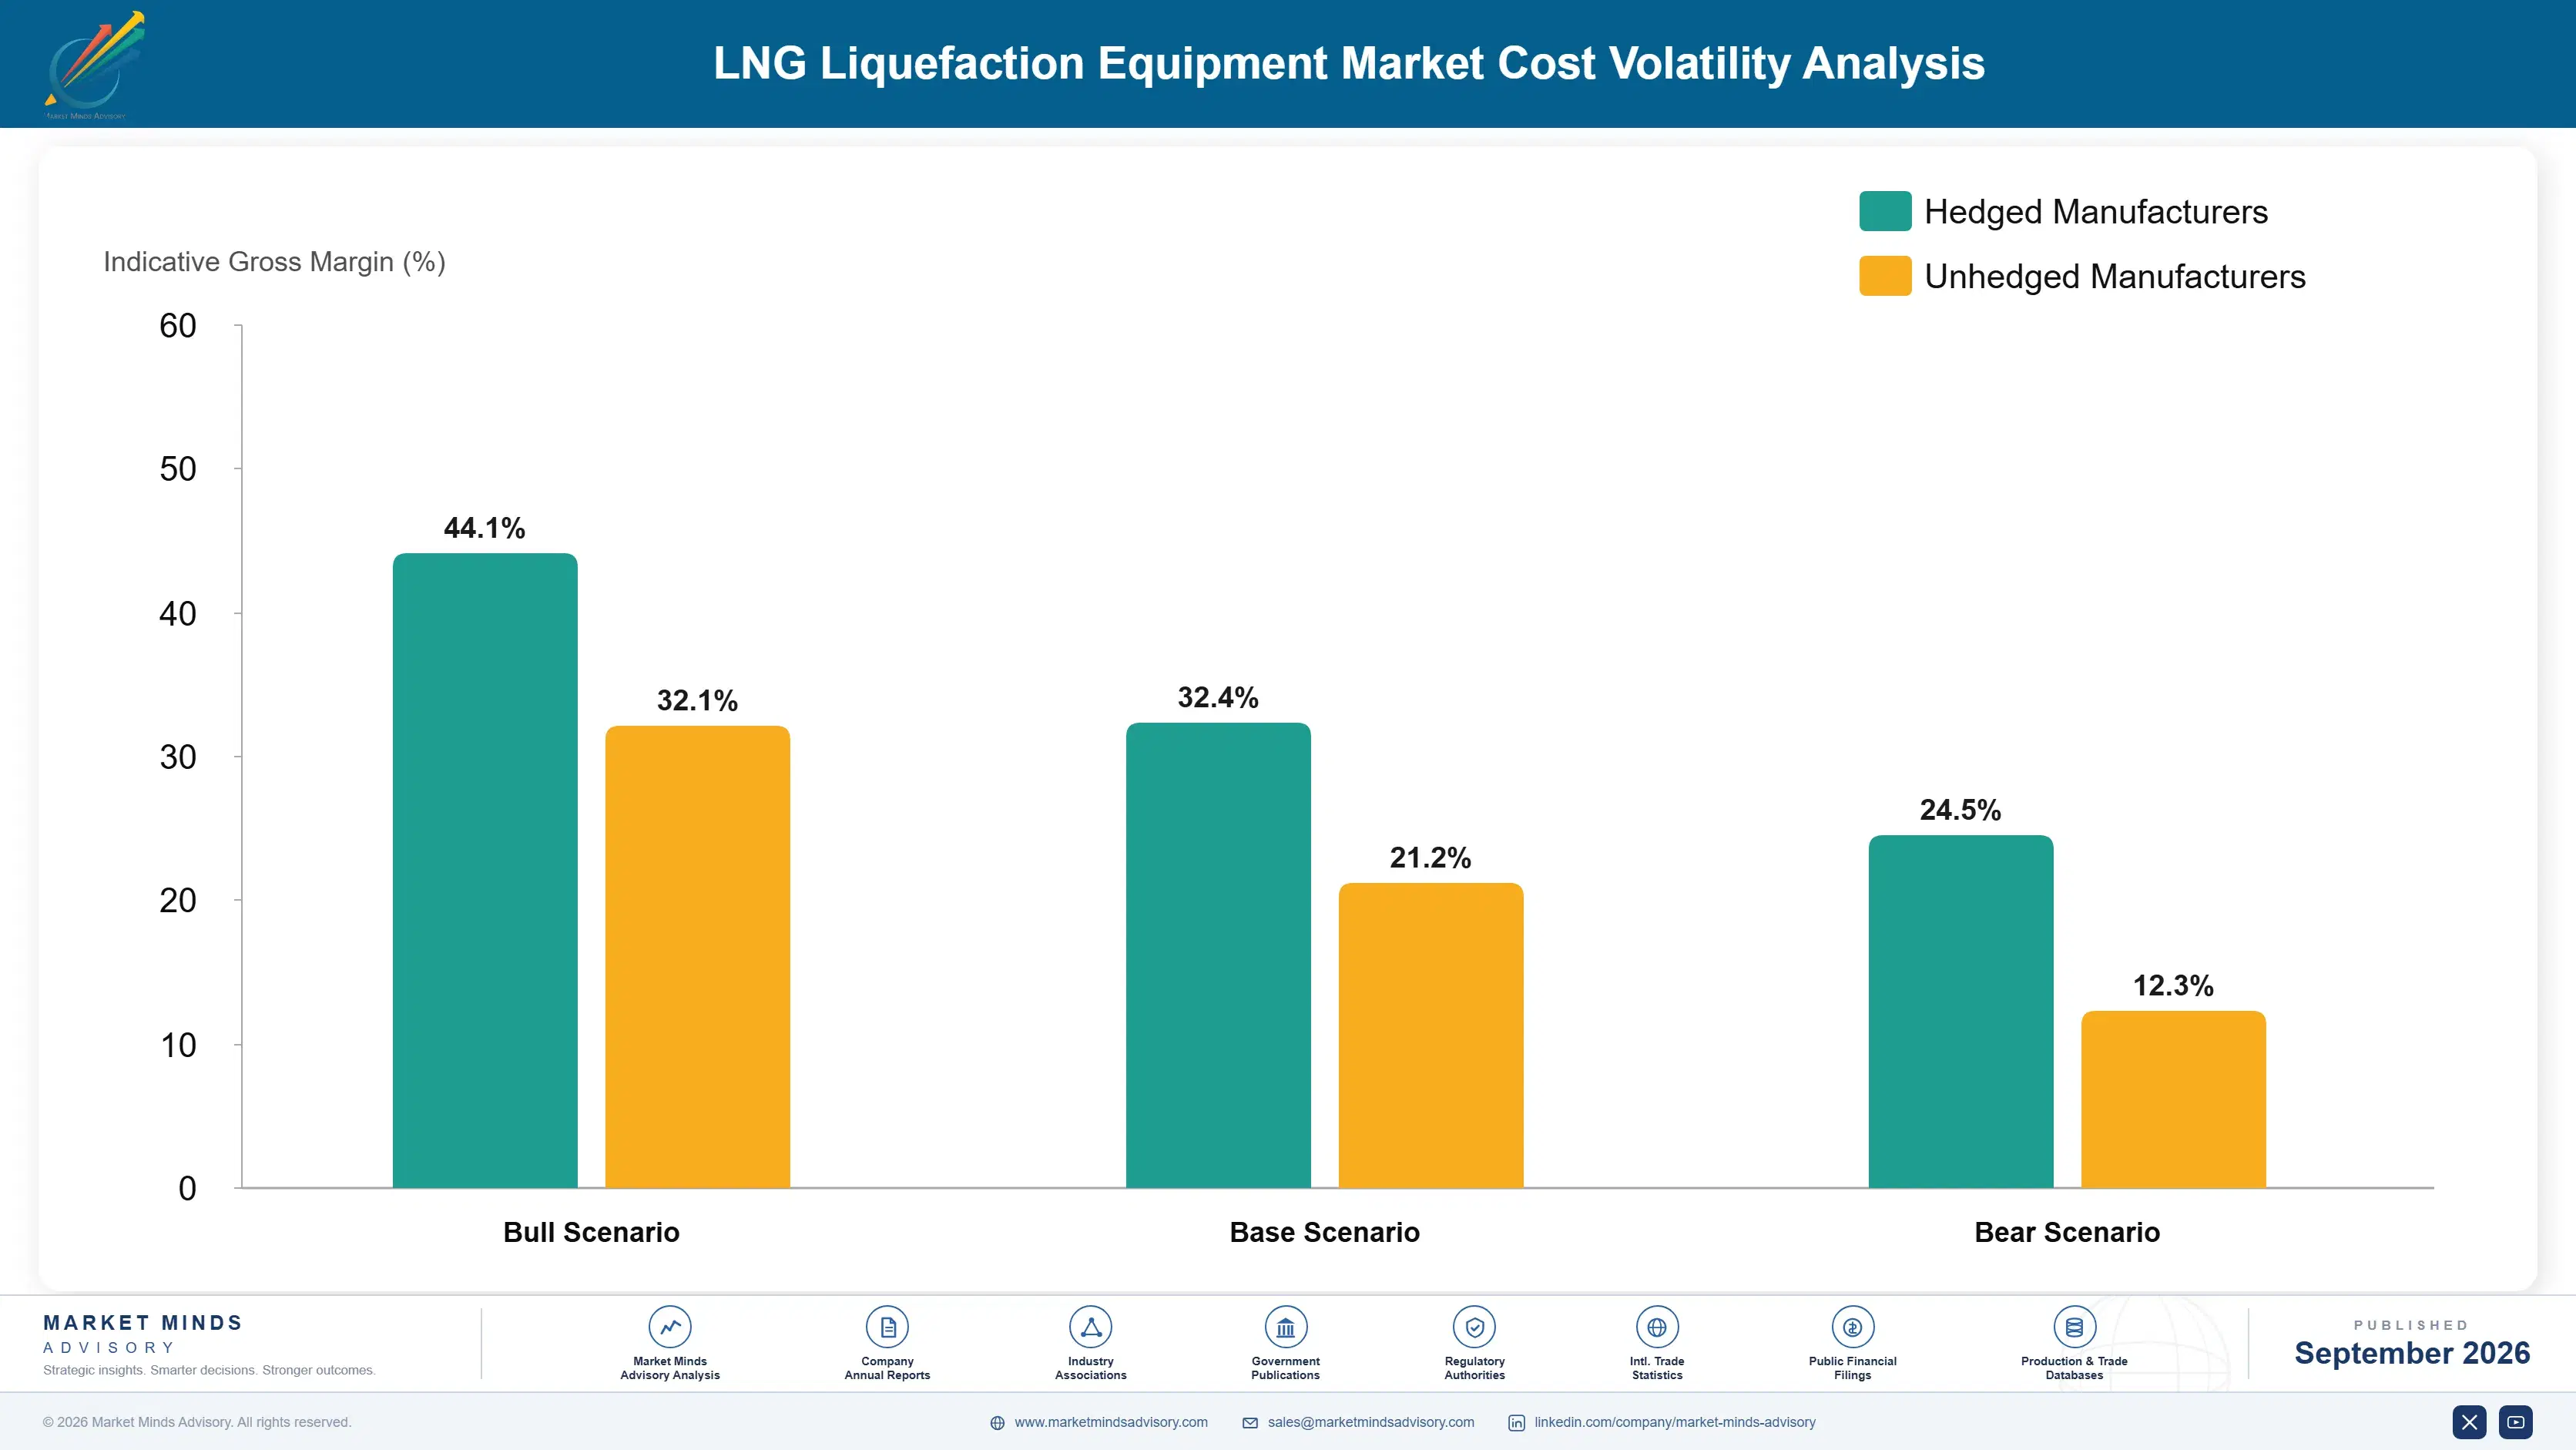
Specialty stainless steel and aluminum alloy components account for roughly 42 percent of equipment manufacturing cost, sourced primarily from Japan, South Korea, and Western Europe, with electric motor and compressor components adding a further meaningful cost share. This concentration in a small number of manufacturing regions leaves equipment vendors genuinely exposed to trade policy and shipping disruption beyond their direct operational control.
The 2022 to 2023 global steel and aluminum price spike, documented extensively by the World Steel Association's market reports, pushed equipment manufacturing costs sharply higher within months, compressing vendor margins considerably as material costs rose faster than project contract pricing could adjust in response. Vendors that had pre-negotiated long-term material supply contracts weathered the spike considerably better than those relying on spot market purchasing during the tightest months of the disruption.

Cost exposure varies meaningfully by player type: large diversified conglomerates with hedging programmes and diversified sourcing absorb material price volatility more easily, while smaller specialist manufacturers dependent on single-region alloy suppliers face more direct and immediate exposure to input cost spikes without an offsetting sourcing cushion. This divergence shapes which vendors sustain competitive project bidding without eroding margin below acceptable levels.
lng-liquefaction-equipment-market-cost-volatility-analysis-1788255330977

Multi-Region Alloy Sourcing Diversification

Vendors are qualifying specialty steel and aluminum suppliers across multiple manufacturing regions rather than depending on a single source, reducing exposure to any single country's trade policy or capacity disruption. This diversification adds modest qualification cost upfront but meaningfully reduces the risk of production delays during future price spike cycles. Few smaller vendors can match this diversified sourcing footprint today.

Long-Term Material Supply Agreements

Larger vendors are locking in multi-year steel and aluminum pricing agreements ahead of anticipated market tightness, smoothing cost exposure across production cycles in ways smaller competitors without comparable purchasing scale generally cannot replicate. This approach proved decisive during the last major price spike cycle for vendors that had it in place. Few smaller competitors can match this negotiating scale currently.

Design Standardization Across Project Scopes

Vendors are standardizing equipment designs across multiple project scopes and train capacities, allowing bulk material purchasing that reduces per-unit cost while preserving the ability to customize for site-specific project requirements. This approach increasingly substitutes for pure volume-based negotiation as a primary cost mitigation lever. Adoption is spreading quickly across the vendor landscape as fabrication yards standardize component libraries.

Portfolio Architecture for Margin Defence

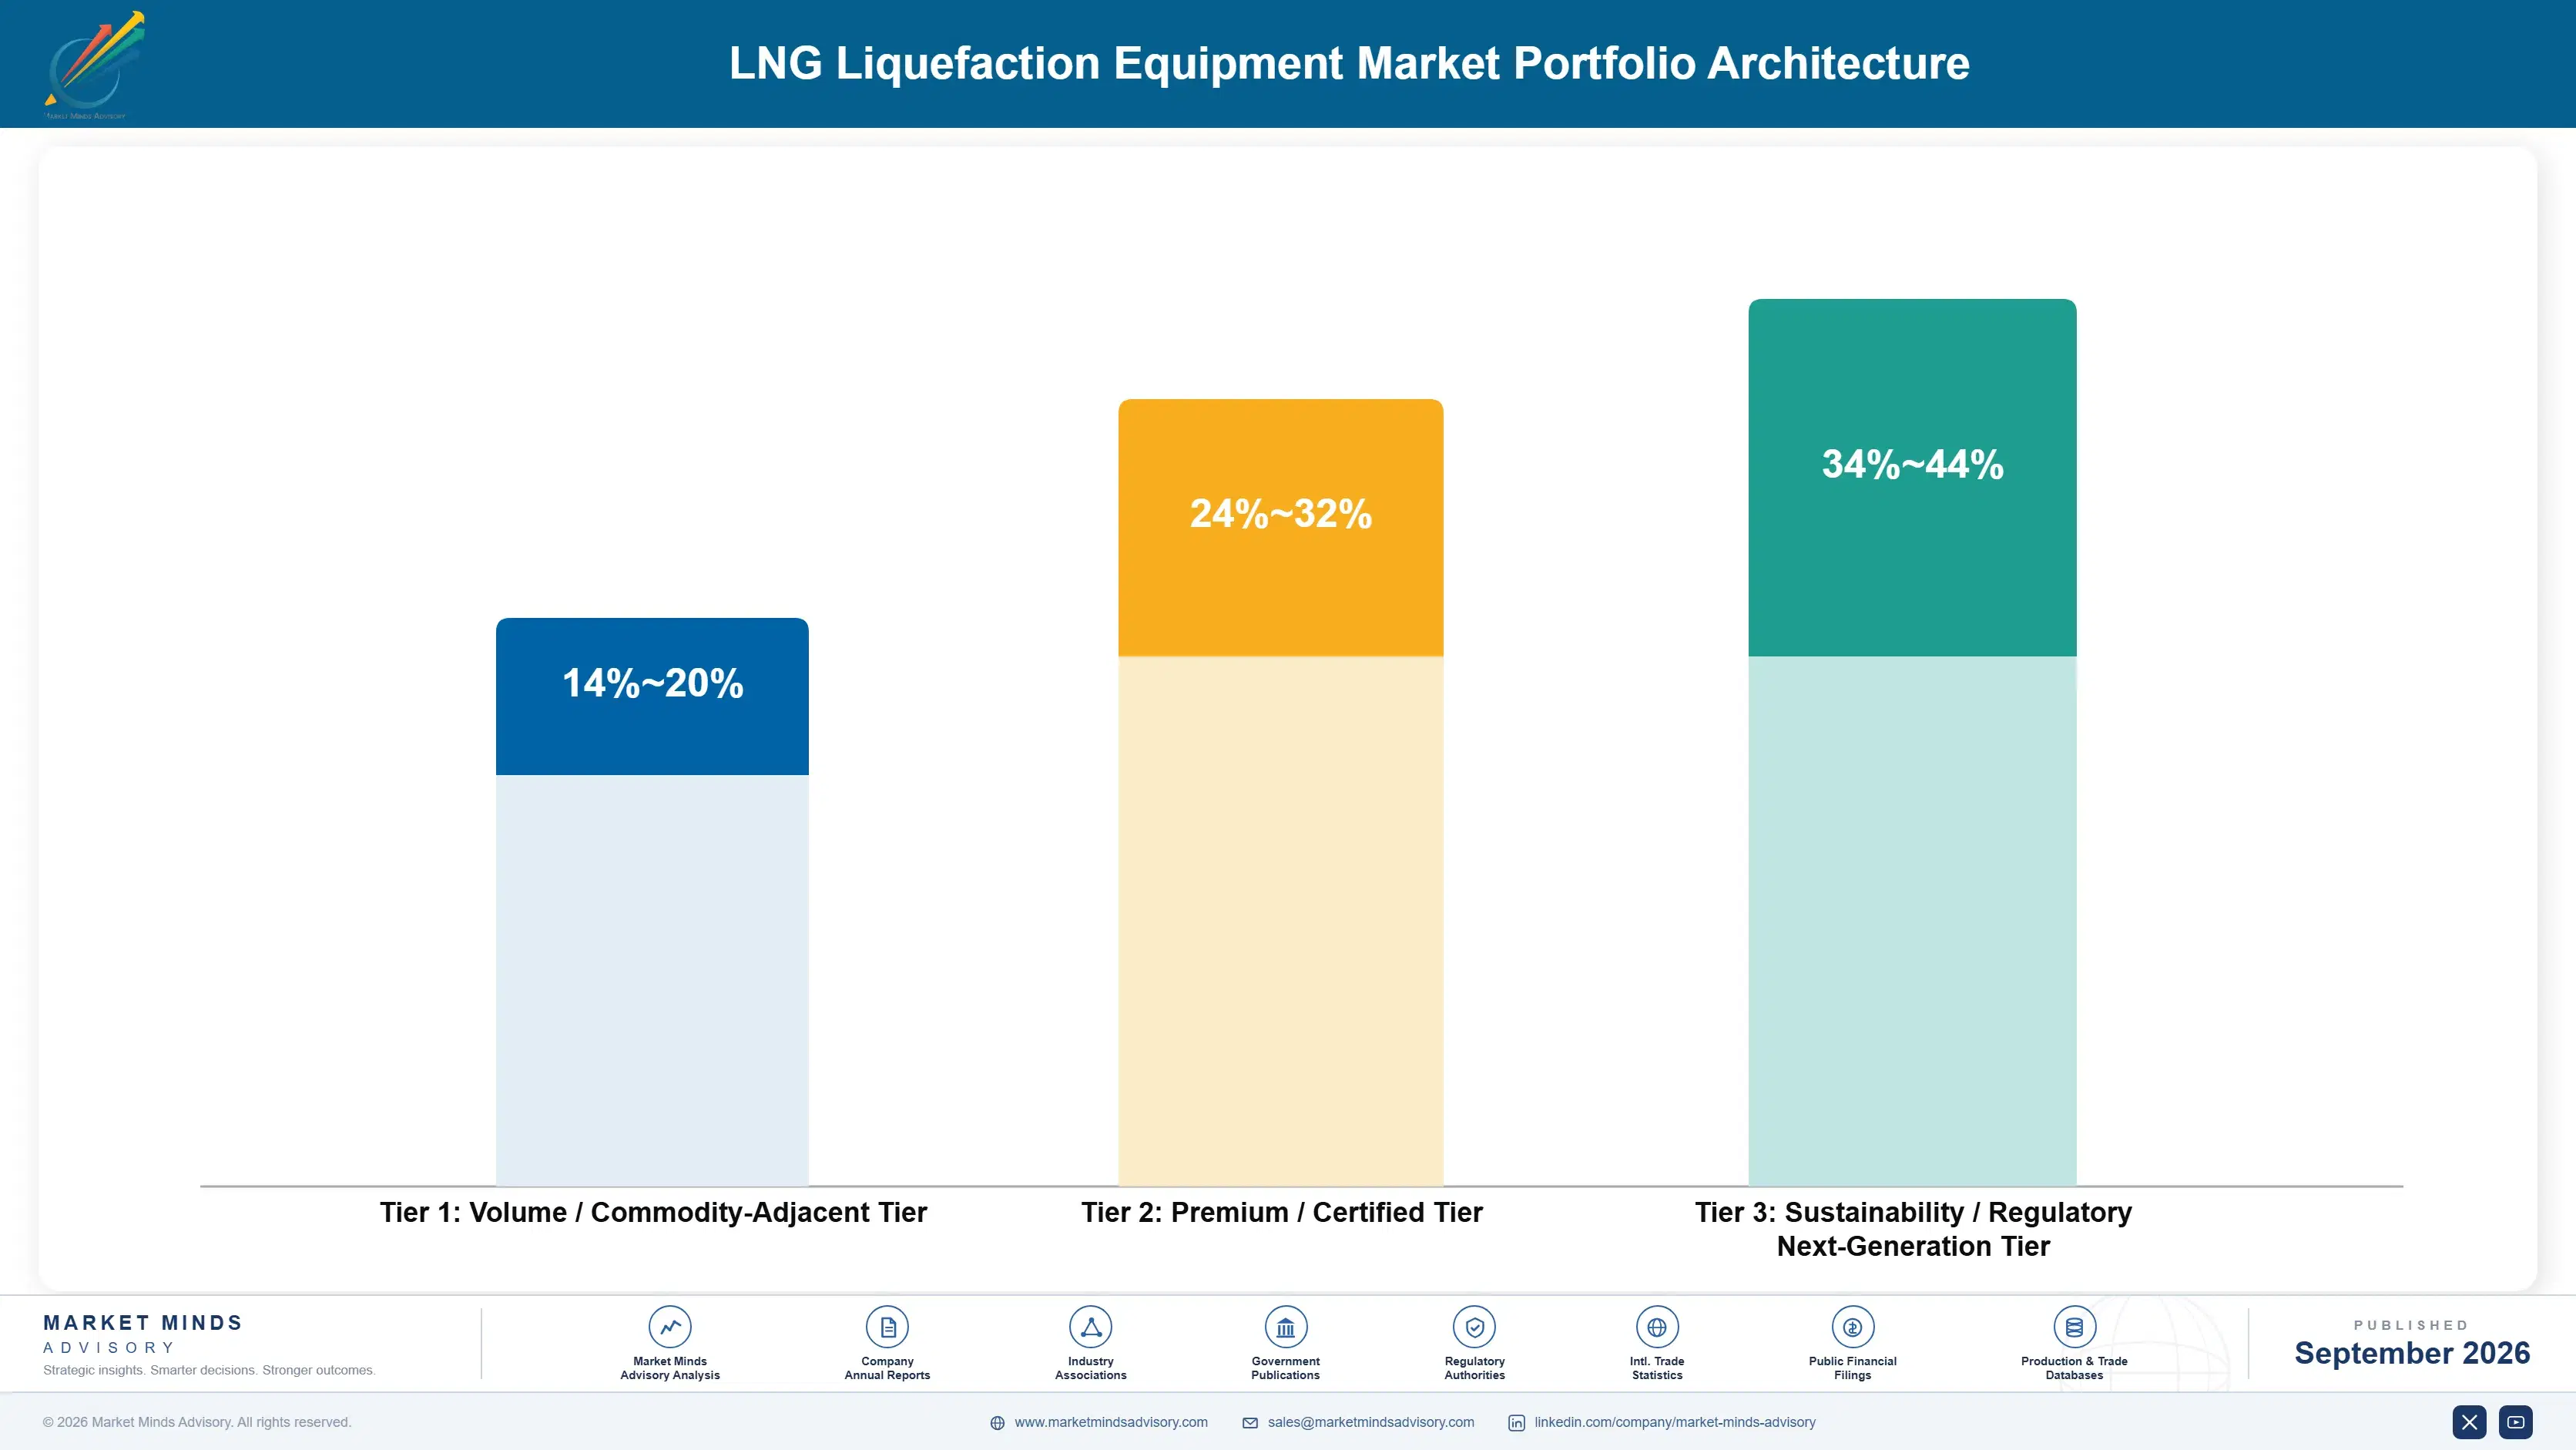
Equipment production splits into three commercial tiers with distinct margin economics. Volume commodity gas turbine-driven compression sells through standard project procurement, sustaining moderate margins that reward manufacturing scale and proven reliability rather than any single technical differentiator among competing vendors. Distribution reach and proven track record matter more than any single feature claim at this level of the market.
Premium certified electric-drive and modular systems, backed by demonstrated decarbonization credentials and proven fabrication yard delivery, command meaningfully wider margins by trading on emissions performance rather than pure unit volume. Vendors serving this tier increasingly compete on drive efficiency and delivery certainty rather than price alone, favoring established players with proven infrastructure. These vendors increasingly view emissions performance as their primary defense against commodity price competition.

Sustainability and next-generation formats, including AI-optimized compression systems with predictive maintenance built in, remain a smaller share of total equipment volume today but carry the widest margins of the three tiers, since technical scarcity and engineering development capability still constrain competition meaningfully. High-value pools concentrate squarely within this tier and the premium tier immediately below it. That tension between volume and premium credibility defines competitive positioning across the category broadly.

Volume / Commodity-Adjacent Tier

Standard gas turbine-driven compression sold through conventional project procurement, competing primarily on manufacturing scale and proven reliability rather than differentiated technology, with limited pricing power. Scale wins here consistently. Consistency helps too.
Gross Margin: 14-20%

Premium / Certified Tier

Electric-drive and modular systems with demonstrated decarbonization credentials and proven fabrication yard delivery, commanding wider margins on emissions performance and delivery certainty in demanding project applications. Efficiency matters most here.
Gross Margin: 24-32%

Sustainability / Regulatory / Next-Generation Tier

AI-optimized compression systems with predictive maintenance built directly into the control architecture, where limited engineering development capability and integration scarcity sustain the widest margins across the category despite modest volume.
Gross Margin: 34-44%
lng-liquefaction-equipment-market-portfolio-architecture-1788255331489

High-value Sub-segments and Strategic Watch-out

High-value high-growth segment

AI-optimized electric-drive compression systems paired with predictive maintenance capability sit at the intersection of premium margin and the fastest unit volume growth, as major developers standardize procurement around certified decarbonization-linked platforms rather than legacy turbine designs across new project sanctioning and construction. This is the clearest growth vector ahead.
Gross Margin: 36-44%

High-value moderate-growth segment

Long-term maintenance and spare parts service contracts carry strong recurring margins tied to buyer confidence in equipment uptime guarantees, though adoption grows more gradually as developers weigh service cost against in-house maintenance capability development plans. Vendors treat this as a durable, if slower-building, opportunity worth pursuing.
Gross Margin: 32-40%

Volume core segment

Standard gas turbine-driven compression trains remain the largest equipment volume base across established liquefaction facilities globally, sustaining steady if unremarkable margins as the category matures and price competition among established vendors intensifies nationwide. Scale and distribution reach determine who wins share here overall. Adoption keeps rising steadily.
Gross Margin: 14-18%

Strategic watch-out segment

Asian shipyard-based fabricators scaling floating liquefaction modules rapidly threaten to disintermediate established Western equipment vendors over the coming decade, particularly where developers favor integrated fabrication and equipment packages over separately sourced components. Western vendors are responding through deeper fabrication yard partnerships nationwide. This shift bears close monitoring ahead.
Gross Margin: n/a

Maintenance Contracts Behave Like Annuities

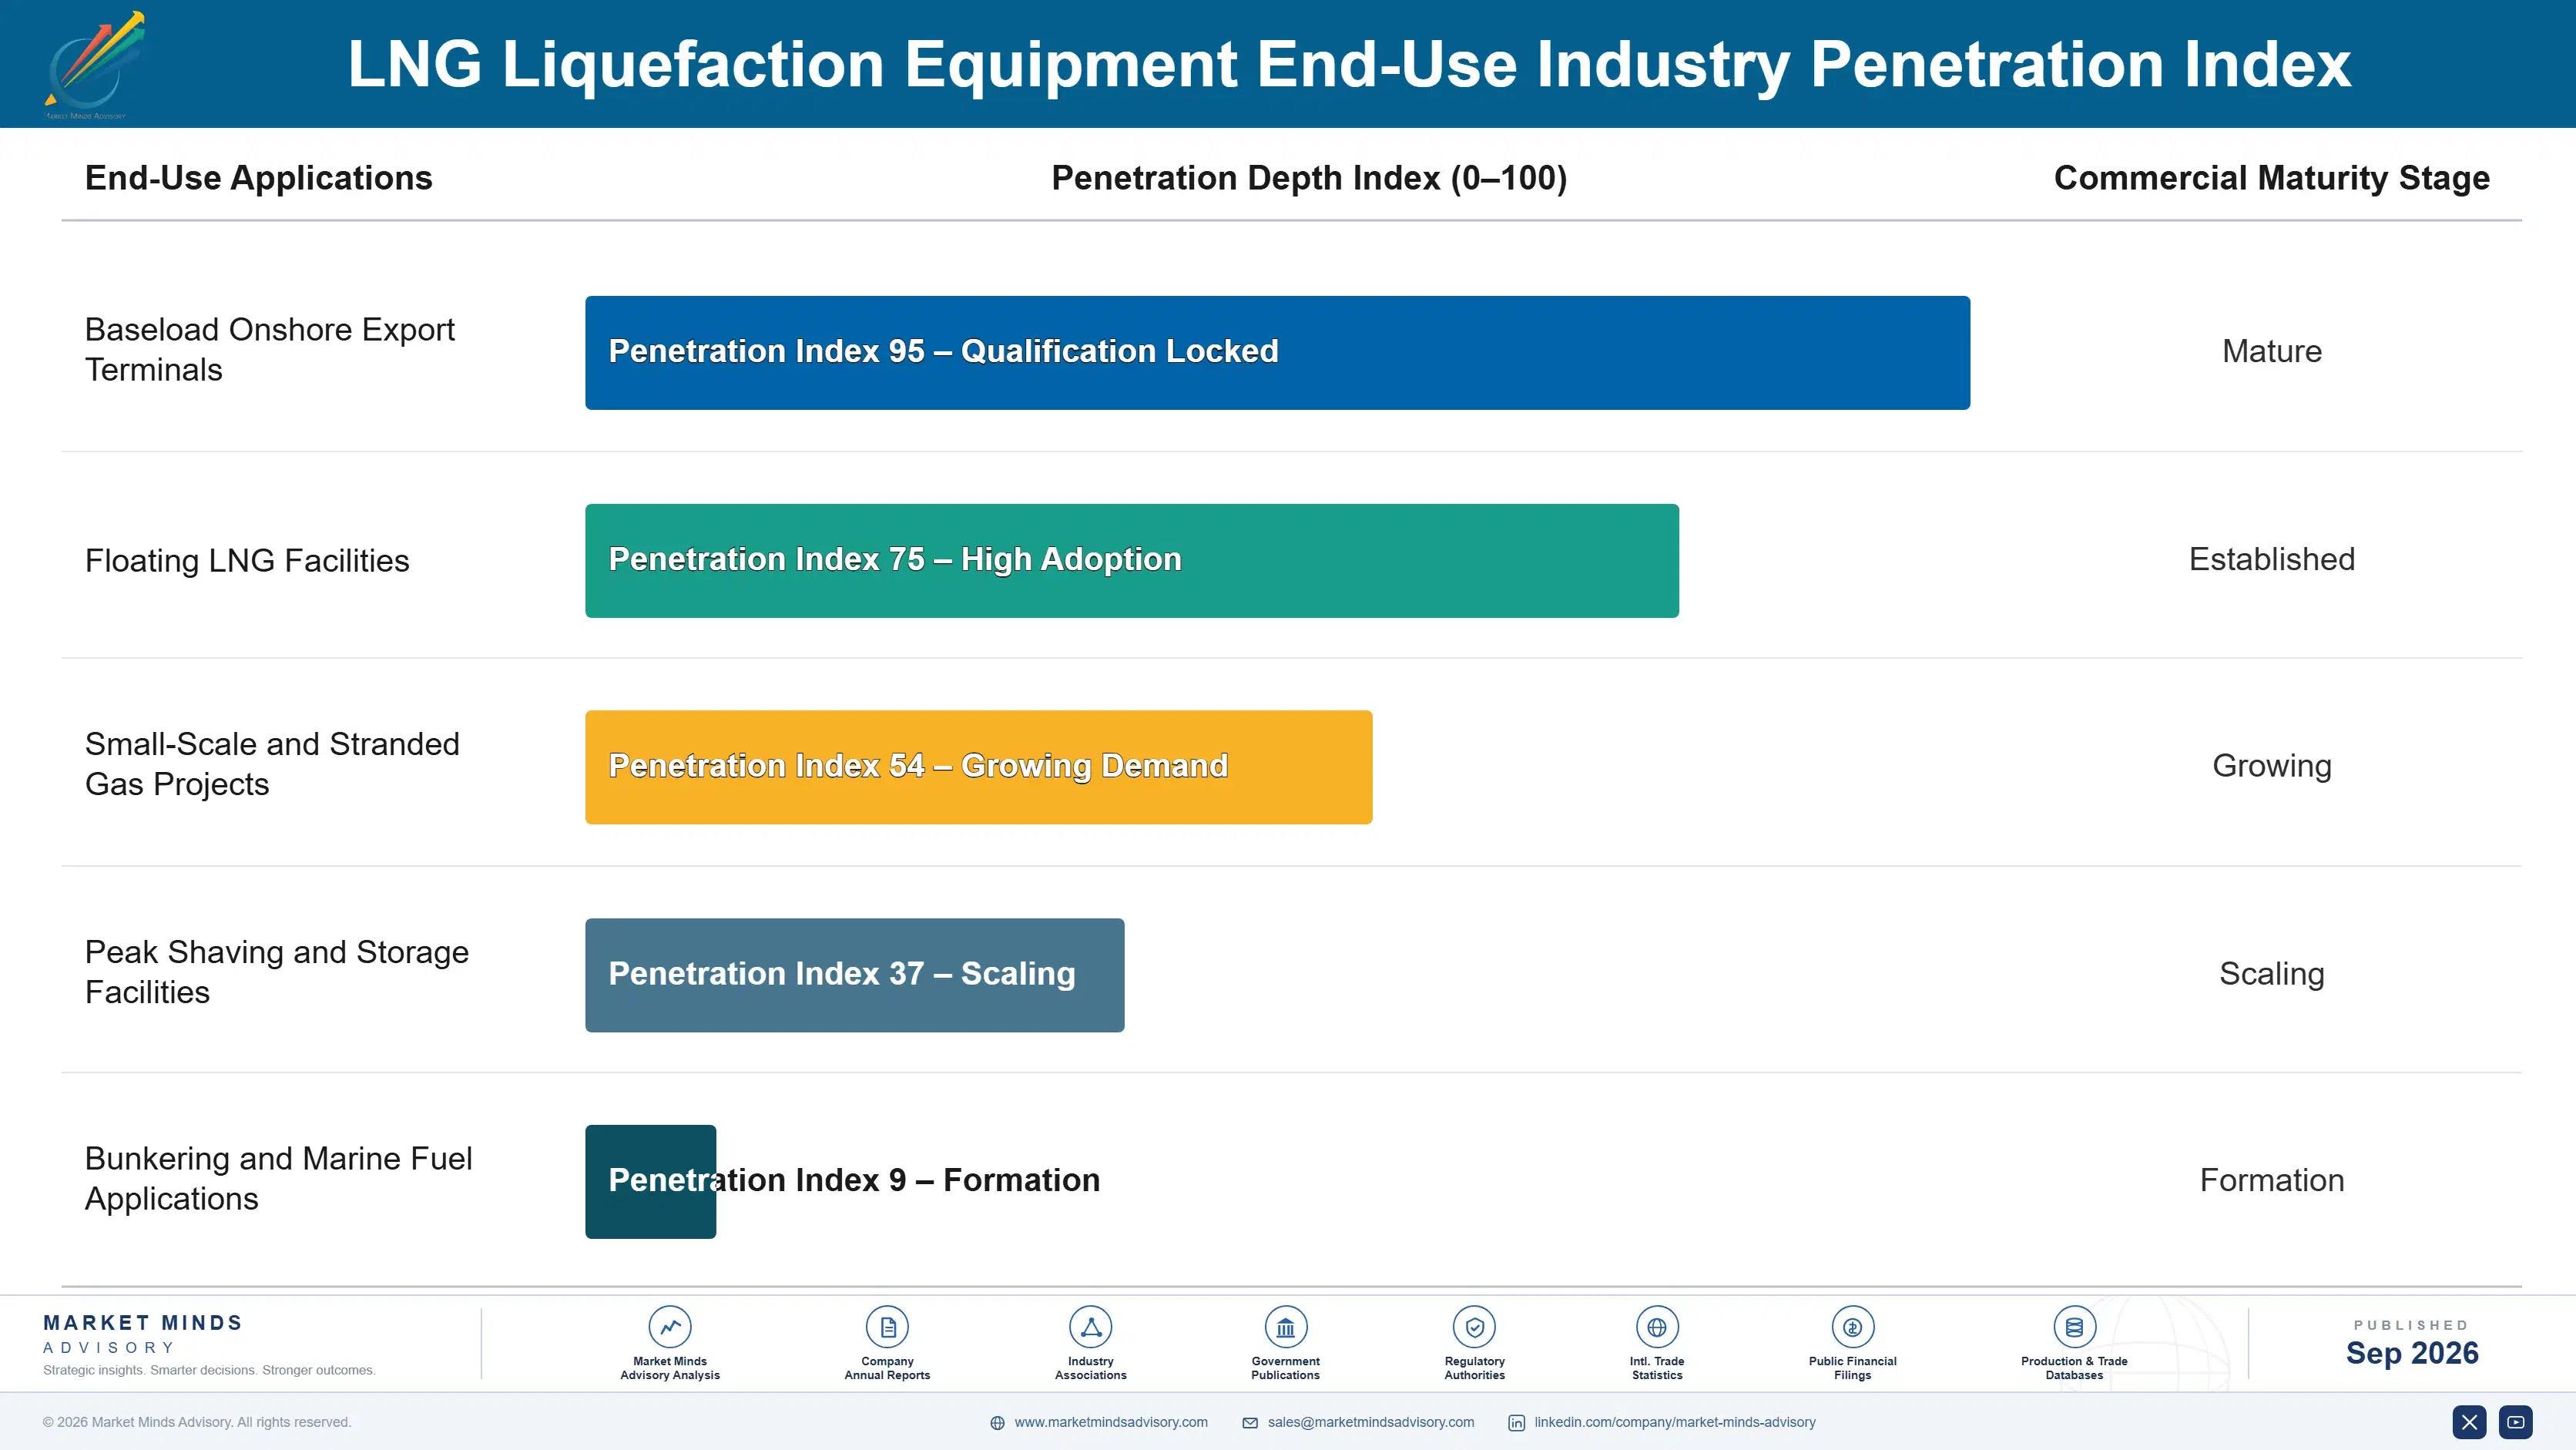
Liquefaction equipment generates revenue well beyond the initial sale, since developers standardize maintenance schedules, spare parts procurement, and operator training around whichever vendor's equipment a facility originally installed. That locked specification behavior turns a single project win into a multi-decade annuity relationship across the facility's operating life, particularly given the specialized certification required for approved replacement parts and services. Switching vendors mid-facility carries real requalification cost, keeping incumbent suppliers entrenched after the original contract closes.
Adoption depth varies sharply by end-use vertical. Major integrated energy companies embed vendor relationships into decade-long portfolio planning cycles, while smaller independent developers treat purchases as a more opportunistic, project-specific decision. State-backed national oil companies sit between the two, adopting proven vendor relationships selectively where strategic supply security demands documented reliability. That spread explains why order volume and margin diverge across the three vertical categories.

Buyer profiles are shifting generationally as well. A younger cohort of project engineers, trained on electric-drive and modular design principles rather than traditional gas turbine engineering alone, increasingly favors decarbonization-aligned vendors, even where legacy procurement teams still default to whatever equipment supplier a previous project originally specified. This generational split is reshaping which vendors win new project specification decisions.
lng-liquefaction-equipment-market-end-use-penetration-index-1788255331978

Where Vendors Should Focus Next

These are among the four positions where our research anticipates prominent divergence between winners and laggards over the coming forecast period. Each is grounded in the demand model, the regulatory perimeter, and the announced capacity pipeline.
01 / ELECTRIC-DRIVE INVESTMENT PRIORITY

Build electric-drive capability before turbine demand fully declines

Electric-drive compression already commands the widest margins in the category, and that gap is widening as developers increasingly treat decarbonization credentials as essential to project financing rather than a discretionary emissions feature layered on top. Vendors without electric-drive capability risk exclusion from the fastest-growing project segment within the next several years, not just margin erosion, since lenders increasingly favor projects with documented emissions performance. Building that capability now, ahead of full market consolidation, converts a technical investment into a lasting specification advantage.
02 / FABRICATION YARD PARTNERSHIP STRATEGY

Secure fabrication yard access before capacity constraints intensify further

Global fabrication yard capacity has not kept pace with the surge of projects reaching final investment decision, and that scarcity is creating order backlogs that favor whichever vendors have already secured priority yard access ahead of rivals. Vendors without established yard partnerships risk exclusion from projects with the tightest delivery schedules, since developers increasingly prioritize delivery certainty over marginal cost differences between competing bids in most negotiations. This positioning advantage compounds the longer a vendor waits to act on securing fabrication capacity.
03 / LONG-TERM SERVICE CONTRACT EXPANSION

Expand maintenance services before competitors lock in accounts

Long-term maintenance and spare parts contracts increasingly determine long-term customer retention more than the initial equipment sale itself, since developers value operational uptime guarantees over marginal price differences between otherwise comparable competing systems. Vendors that build this service capability now secure a durable revenue relationship that compounds across the facility's entire multi-decade operating life, well beyond the original equipment purchase decision itself. Competitors without comparable service infrastructure increasingly find themselves locked out of renewal negotiations entirely and permanently going forward.
04 / DOMESTIC MANUFACTURING PARTNERSHIP STRATEGY

Partner with regional fabricators before local content rules tighten

National energy programmes increasingly favor equipment suppliers with regional manufacturing presence over pure imports for strategic supply chain security reasons, a trend that will intensify as governments treat energy infrastructure as sensitive national capability going forward. Vendors that establish regional manufacturing partnerships now avoid future exclusion from flagship national programmes that increasingly require local content compliance and demonstrated manufacturing presence within the country. This partnership strategy matters more as sourcing requirements keep tightening across additional jurisdictions in the coming years ahead.

Engagement Snapshot From the Field

A live engagement with an industry participant carrying material or product regulatory and market exposure ahead of a defining policy shift, showing how our research translates into a defensible multi-year portfolio strategy.
MARKET MINDS ADVISORY · CLIENT ENGAGEMENT SUMMARY
LNG Liquefaction Equipment Producer Strategic Portfolio Review and Transition Roadmap 2026·Investment Scenario on LNG Liquefaction Equipment Exposure Evaluation 2025-26
CLIENT PROFILE
The client is a mid-size independent LNG developer pursuing a mid-scale liquefaction project on the Gulf Coast, with total project capital budget in the low billions of dollars (client-reported, unverified by MMA). The company had historically evaluated equipment vendors on price alone without a formal fabrication yard access strategy, treating delivery schedule risk as a secondary consideration relative to headline equipment cost.
STRATEGIC CHALLENGE
Rising fabrication yard capacity constraints, combined with lender pressure to demonstrate credible project schedule certainty, forced the client to reconsider its vendor selection approach entirely. Management needed to decide whether to pay a premium for guaranteed fabrication yard slots, continue standard competitive bidding, or pursue a hybrid approach securing partial slot reservations while continuing broader vendor negotiations.
MMA APPROACH
MMA conducted structured interviews with the client's project development and procurement leadership alongside a benchmarking exercise against four peer independent developers' vendor selection strategies and fabrication outcomes. The engagement combined primary qualitative interviews with MMA's proprietary equipment vendor dataset to assess pricing, delivery schedule reliability, and total cost of delay under each vendor selection option.
KEY FINDINGS
  1. Securing guaranteed fabrication yard slots reduced the client's projected schedule risk exposure by roughly 30 percent compared to standard competitive bidding approaches.
  2. Peer developers who paid schedule certainty premiums reported measurably fewer project delays than those who selected vendors on price alone across their portfolios.
  3. Pursuing pure price-based vendor selection would have introduced meaningful schedule risk given current fabrication yard capacity constraints seen across the broader industry.
  4. Developers that delayed vendor selection faced meaningfully longer wait times during the most recent industry-wide capacity crunch tracked in this entire study.
CLIENT PROFILE
The client is a mid-size independent LNG developer pursuing a mid-scale liquefaction project on the Gulf Coast, with total project capital budget in the low billions of dollars (client-reported, unverified by MMA). The company had historically evaluated equipment vendors on price alone without a formal fabrication yard access strategy, treating delivery schedule risk as a secondary consideration relative to headline equipment cost.
STRATEGIC CHALLENGE
Rising fabrication yard capacity constraints, combined with lender pressure to demonstrate credible project schedule certainty, forced the client to reconsider its vendor selection approach entirely. Management needed to decide whether to pay a premium for guaranteed fabrication yard slots, continue standard competitive bidding, or pursue a hybrid approach securing partial slot reservations while continuing broader vendor negotiations.
MMA APPROACH
MMA conducted structured interviews with the client's project development and procurement leadership alongside a benchmarking exercise against four peer independent developers' vendor selection strategies and fabrication outcomes. The engagement combined primary qualitative interviews with MMA's proprietary equipment vendor dataset to assess pricing, delivery schedule reliability, and total cost of delay under each vendor selection option.
KEY FINDINGS
  1. Securing guaranteed fabrication yard slots reduced the client's projected schedule risk exposure by roughly 30 percent compared to standard competitive bidding approaches.
  2. Peer developers who paid schedule certainty premiums reported measurably fewer project delays than those who selected vendors on price alone across their portfolios.
  3. Pursuing pure price-based vendor selection would have introduced meaningful schedule risk given current fabrication yard capacity constraints seen across the broader industry.
  4. Developers that delayed vendor selection faced meaningfully longer wait times during the most recent industry-wide capacity crunch tracked in this entire study.
RECOMMENDED STRATEGY
Phase 1: Phase 1 (Months 1-3): Negotiate guaranteed fabrication yard slot reservations with the top two qualified equipment vendors immediately and quite decisively today and firmly. Phase 2: Phase 2 (Months 4-9): Finalize vendor selection based on combined pricing and schedule certainty criteria rather than price alone going forward quite carefully overall. Phase 3: Phase 3 (Months 10-18): Formalize a long-term maintenance and spare parts agreement with the selected vendor covering the facility's entire operating life fully and completely.
OUTCOME
Within eighteen months of implementation, the client reported securing a fabrication delivery schedule with meaningfully reduced delay risk compared to its original procurement approach (client-reported, unverified by MMA). The schedule certainty also strengthened the client's position with project lenders, and the client has since recommended this approach to a sister project entering its own vendor selection phase.

Frequently Asked Questions

Foundational context covering the market sizes, CAGR, scope, country, region and competition that inform every finding below. This section is provided to cover basics and most often pre-purchase conversations, answered from the MMA Primary Research Dataset.

What is the current size of the LNG Liquefaction Equipment Market?

The global LNG liquefaction equipment market reached approximately 8.4 billion dollars in 2025. Growth is driven primarily by Gulf Coast export capacity expansion and Qatar's North Field development.

How large will the LNG Liquefaction Equipment Market be by 2036?

MMA projects the market will reach approximately 16.62 billion dollars by 2036. That represents roughly a 1.86 times expansion over the eleven-year forecast window from 2026 onward.

What is the CAGR for the LNG Liquefaction Equipment Market 2026 to 2036?

The market is forecast to grow at a 6.4 percent compound annual rate between 2026 and 2036. Bull and bear scenarios range from 5.2 to 7.6 percent.

Which segment is growing fastest?

Modular and Floating Liquefaction Units is the fastest-growing segment at a 12.6 percent CAGR through 2036. That is roughly 1.97 times the overall market growth rate.

Who are the major companies in the LNG Liquefaction Equipment Market?

Leading vendors include Baker Hughes, Air Products, Chart Industries, Linde, and Honeywell. Together these five companies hold an estimated 52 percent combined share of global order value.

Which country is growing fastest?

Qatar leads growth among major markets, driven by the North Field expansion, the largest single liquefaction capacity programme globally. Its growth rate outpaces most other national markets tracked.

Report Segmentation Architecture

The full report scope spans multiple orthogonal segmentation dimensions, with cross-tabulated demand data provided for each dimension pair. Coverage extends further to regional breakdowns, trend trajectories, and the competitive detail needed to support segment-level decision-making.

By Primary Market Dimension

  • Main Cryogenic Heat Exchangers
  • Gas Turbine-Driven Compressors
  • Electric Motor-Driven Compressors
  • Liquefaction Process Technology Licenses
  • Boil-Off Gas Recovery Systems
  • Modular and Floating Liquefaction Units

By End-Use Industry

  • Baseload Onshore Export Terminals
  • Floating LNG Facilities
  • Small-Scale and Stranded Gas Projects
  • Peak Shaving and Storage Facilities
  • Bunkering and Marine Fuel Applications

By Commercial Dimension

  • Direct EPC Contractor Procurement
  • Technology Licensing Agreements
  • Long-Term Maintenance Service Contracts
  • Modular Design Licensing Services

By Region

  • North America
  • Western Europe
  • East Asia
  • South Asia and Pacific
  • Latin America
  • Middle East and Africa
  • Eastern Europe

Scope, Methodology, and Coverage

Every figure in this report is reproducible from documented input assumptions. The scope below maps the historical period, the forecast horizon, the segmentation dimensions, and the countries covered, alongside the underlying primary and qualitative methodology.
Historical Period
2020 to 2025
Forecast Period
2026 to 2036
Base Year
2025 (USD billions; MMA Primary Research Dataset, September 2026)
Market Definition
This market covers liquefaction equipment used in LNG production facilities, including main cryogenic heat exchangers, compression trains, gas turbine and electric motor drivers, and boil-off gas recovery systems. It excludes upstream gas processing equipment, LNG carriers, and regasification terminal equipment.
Quantitative Units
USD billions (current prices); train capacity in million tonnes per annum where noted
Segmentation Dimensions
By Primary Market Dimension; By End-Use Industry; By Commercial Dimension; By Region
Regions Covered
North America, Western Europe, East Asia, South Asia and Pacific, Latin America, Middle East and Africa, Eastern Europe
Countries Covered
USA, Qatar, Australia, Russia, Malaysia, Nigeria, Mozambique, Canada, Mexico, Indonesia, Papua New Guinea, Trinidad and Tobago, Egypt, UAE, Oman, Argentina, Norway, UK, China, Japan, South Korea, and additional markets relevant to this sector
Key Companies Profiled
Baker Hughes Company, Air Products and Chemicals Inc, Chart Industries Inc, Linde plc, Honeywell International Inc, Technip Energies N.V., Black & Veatch Holding Company, KBR Inc, Samsung Heavy Industries Co Ltd, Hyundai Heavy Industries Co Ltd, Hanwha Ocean Co Ltd, Wison Engineering Services Co Ltd, Siemens Energy AG, GE Vernova Inc, Ariel Corporation, Elliott Group, Atlas Copco AB, Sulzer Ltd, Cryostar SAS, Wartsila Corporation
Quantitative Methodology
Primary survey, n=3,800 respondents, Q4 2025, six countries; demand-side model with trade association cross-validation
Qualitative Methodology
47 expert interviews, Q4 2025; applied to validate demand model assumptions, identify emerging dynamics, and assess competitive positioning
Report Format
PDF and XLSX data workbook (Word format preview document)
Publisher
Market Minds Advisory
Report Code
MMA-2026-ENE-144
Published
September 2026
Contact
sales@marketmindsadvisory.com | www.marketmindsadvisory.com

Purchase the full LNG Liquefaction Equipment Market Report (2026 to 2036).

The full report delivers comprehensive market sizing, segmentation, and competitive analysis for the global LNG liquefaction equipment market through 2036. It profiles twenty leading vendors across compression, heat exchanger, and modular fabrication technologies, covering their product portfolios, project references, and recent corporate developments. Regional chapters detail demand drivers across all seven world regions with quantified growth mechanisms. The report also includes forecast scenarios, materials cost analysis, and a strategic verdict section identifying where vendors should prioritize investment. Analysts additionally benchmark contract structures and margin economics across the full vendor portfolio landscape.
Eleven-year market sizing and forecast model
Six-segment MECE segmentation with growth analysis
Full seven-region demand and share breakdown
Twenty-company competitive benchmarking and profiling analysis
Steel and aluminum material cost risk analysis
Anonymized client case study with strategic recommendations

Built For The People Who Decide

From boardroom strategy to bench-side execution, this report is read cover-to-cover by leaders shaping the next decade of their industry, turning demand scenarios, market dynamics and valuation benchmarks into decisions.
CXOs/ Presidents/ VPs/ Managers
M&A and Corporate Development
Strategy Teams and R&D Heads
Procurement and Product Directors
Regulatory and Compliance Leaders
Investor Relations and Equity Analysts