

Market Minds Advisory
Litigation Funding Investment Market

Litigation Funding Investment Market: Quoted In Multiples, Earned In Years

Funders advertise a 2.8 times return and live on the internal rate. The difference between those two numbers is how long a court takes, and courts are getting slower everywhere.

Lead Analyst

Published

September 2026

Make Smarter Decisions with Customized Research Insights

Request a free sample report and evaluate market opportunities, growth trends, and competitive dynamics relevant to your business needs.

2025 MARKET VALUE$6.4BMarket Size 2025
2036 FORECAST VALUE$21.0BBase Case , 2026 to 2036
CAGR 2026 TO 203611.4 %Bull 12.6% / Bear 10.2%
INCREMENTAL OPPORTUNITY$13.9BNet 10- year value creation
EXPANSION MULTIPLE2.94x2036 value over 2026 base
Strategic Levers
M&A Pipeline
Regional Outlook
Country Rankings
Competitive Intelligence
Segmental Deep-dive
Call-Us : 91 93563 13602

Executive Snapshot and Market Trajectory

Duration decides everything and almost nobody prices it properly. A 2.8 times return over three years is an excellent investment; the identical multiple realised after eight years is barely worth the capital it consumed along the way. Nobody puts that on a fact sheet.
North America holds 38% of commitments, above the usual regional band, because there is no loser pays rule to create adverse costs exposure and claim values run far higher than anywhere else. Portfolio and cross-collateralised funding grows at 17.1%, half again the market rate of 11.4%, since bundling matters converts a set of binary outcomes into something an institutional allocator can actually underwrite. Single-case commitments increasingly get what the portfolio funders already declined.
Concentration reaches 34% among funders competing on diligence quality and capital cost rather than on price. The 2023 Supreme Court decision on percentage-based funding agreements forced wholesale restructuring across British portfolios, and the legislation drafted to reverse it has still not been passed. Defendants keep testing enforceability wherever a funded claim gives them the opening, and funders keep drafting agreements they consider workable rather than genuinely settled at all.
Market Definition
The market covers capital committed and deployed into litigation funding investments, spanning single-case commercial litigation funding, portfolio and cross-collateralised funding, international arbitration funding, insolvency and claim monetisation funding, class and group action funding, and law firm working capital facilities secured against case inventory. Contingency fee arrangements between lawyers and clients, after-the-event insurance premiums earned by insurers, legal expenses insurance, law firm equity investment, and recourse lending to law firms are excluded.
Base Year Value
$6.4B in 2025 (MMA Primary Research Dataset, August 2026)
Forecast Period
2026 to 2036, eleven discrete annual values
CAGR
11.4% base case. Bull 12.6%. Bear 10.2%.
Fastest Growth Segment
Portfolio and Cross-Collateralised Funding: 17.1% CAGR
Fastest Growth Country
India: 13.4% CAGR
Fastest Growth Region
South Asia and Pacific: 13.6% CAGR
Largest Region
North America: 38% of 2025 global value
Market Leaders
Burford Capital, Omni Bridgeway, Fortress Investment Group, Bench Walk Advisors, Harbour Litigation Funding. Source: MMA Analysis based on disclosed litigation finance assets under management and capital deployed, company annual reports 2025.
Primary Survey
n=3,800 procurement and R&D decision-makers, Q4 2025, six countries
Methodology
Demand-side build-up, cross-validated against public data, 47 expert interviews

Litigation Funding Investment Market Forecast Scenarios

litigation-funding-investment-market-size-forecast-scenario-1787913408897
Growth from 2020 to 2025 ran at 10.2% and two things shaped it. Institutional allocators discovered an asset class genuinely uncorrelated with markets, which is rare enough to attract capital quickly. Then rates rose and a non-recourse illiquid position resolving in four years looked considerably less attractive against a risk-free alternative. The 2023 judgment on percentage-based agreements forced British funders to restructure existing portfolios wholesale.
The 11.4% base case rests on three mechanisms. Portfolio structures keep displacing single-case commitments because diversified case bundles behave like an asset rather than a wager. International arbitration funding keeps growing on award sizes and cross-border enforceability. And insolvency claim monetisation keeps expanding, since an estate with no cash has no other route to pursuing a valuable claim at all. None of the three needs the legal position to be resolved.
The bull case at 12.6% assumes British legislation restores percentage-based agreements and disclosure regimes settle into something predictable rather than shifting court by court. The bear case at 10.2% is court delay lengthening further, which damages internal rates of return without touching headline multiples at all, alongside adverse costs losses running above underwriting assumptions in loser pays jurisdictions.

The Multiple Hides The Clock

The capital is non-recourse and that is the whole product. A funder pays legal costs and receives a share of proceeds only if the claim succeeds, which means the claimant carries no downside and the funder carries all of it. Insolvency practitioners use this constantly, because an estate with no money cannot pursue a valuable claim any other way. Nobody else will lend against a lawsuit.
FIVE-FIRM CONCENTRATION34%Share of committed capital held by the largest funders
AVERAGE CASE DURATION43 monthsTime from commitment to resolution across funded matters
FUNDER RETURN MULTIPLE2.8xGross realisation against capital deployed on won cases
ADVERSE COSTS PREMIUM18%Insurance cost against covered exposure in loser pays jurisdictions
CASE WIN RATE68%Proportion of funded matters resolving favourably for the claimants
PORTFOLIO DEAL SHARE61%Commitments made across bundled matters rather than single cases
Everybody quotes multiples and everybody earns internal rates. Average duration from commitment to resolution runs around 43 months and has been lengthening as court backlogs grow. A 2.8 times realisation over three years is excellent; the same multiple after seven produces a return an allocator could have matched in credit with none of the binary risk. Marketing materials quote the multiple almost without exception.
Geography changes the risk profile more than most people expect. Under loser pays rules in England, Australia and much of Europe, a failed claim exposes the funder to the defendant's costs as well as its own, which makes after-the-event insurance effectively compulsory at premiums around 18% of covered exposure. American courts impose no such liability. That single procedural difference explains why case selection discipline differs so sharply across the Atlantic.
"Show me a funder quoting multiples and hiding duration and I will show you a portfolio that has stopped resolving. The multiple is what you tell your investors. The internal rate is what you actually earned, and one of those two numbers gets worse every month a case sits unheard."
Director, Alternative Assets Practice · MMA Alternative Assets and Legal Finance Practice · August 2026

Market Trends

Portfolio Structures Convert Wagers Into Underwritable Assets

Cross-collateralising ten or twenty matters means a funder's return depends on portfolio performance rather than on whether one judge decides one way. That is the difference between an asset class and a lottery ticket, and institutional allocators have made it clear which of the two they will fund. Portfolio commitments now represent around 61% of the market. Single-case funding persists mainly where a claim is large enough to justify concentrated exposure on its own. Nobody funds a single case on an allocator's behalf any more without explaining exactly why first.
Market Impact: Grows insolvency funding at 12.6%

Percentage-Based Agreements Remain Legally Unresolved In Britain

The 2023 Supreme Court decision holding that percentage-of-damages funding agreements were unenforceable damages-based arrangements forced British funders to restructure live portfolios onto multiple-of-outlay returns at considerable cost and speed. Legislation drafted to reverse the position stalled and has not passed. Funders continue writing agreements under a structure they consider workable rather than settled, and defendants continue challenging enforceability wherever a funded claim gives them the opening. The economics changed overnight for every live position, and nobody involved had any warning that the question was even properly in play at all.
Market Impact: Enforces across 170 jurisdictions

Market Opportunities and Growth Drivers

Insolvency Estates Have No Other Route To Claims

An insolvent estate frequently holds valuable claims against directors, auditors or counterparties and has no cash whatsoever to pursue them, which makes funding the only mechanism by which creditors ever see any recovery from those assets. That segment grows at 12.6%. Officeholders are experienced buyers who negotiate hard on terms, and the claims themselves benefit from documentary evidence already gathered during the insolvency process itself at somebody else's expense. No competing funder is ever bidding for a claim that the estate cannot pay anybody else at all to go and pursue.
Market Impact: Extends duration past 43 months

Arbitration Awards Enforce Across Borders Far More Reliably

International arbitration funding grows at 13.8% because awards enforce under the New York Convention across more than 170 jurisdictions, which makes collection considerably more predictable than pursuing a foreign court judgment through unfamiliar enforcement procedures. Award values are large, tribunals set timetables that courts cannot match, and confidentiality suits both parties. Sovereign and investor-state matters carry the largest values and the most difficult collection problems anybody in this business faces. Winning the award is frequently the straightforward part and collecting it is where the value is actually made or lost.
Market Impact: Adds 18% insurance premium cost

Market Restraints and Challenges

Court Delay Destroys Returns Without Touching Multiples

Duration runs around 43 months on average and has been lengthening as court backlogs grow across most jurisdictions, and every additional month reduces internal rate of return while leaving the headline multiple entirely unchanged. Root cause is judicial capacity that funders cannot influence at all. Commercial impact falls on realised returns and fund performance. Mitigation involves arbitration preference, jurisdiction selection and secondary sales of positions, though each carries costs of its own. Nobody in this business can make a judge list a hearing any sooner than they already intend to.
Market Impact: Holds 61% of total commitments

Adverse Costs Exposure Doubles The Downside In Britain

Under loser pays rules a failed claim leaves the funder liable for the defendant's costs alongside its own, which roughly doubles downside exposure and makes after-the-event insurance effectively compulsory at premiums around 18% of covered exposure. Root cause is civil procedure the funder cannot change. Commercial impact is a materially higher cost base than American competitors carry. Mitigation runs through capped insurance, security for costs negotiation and stricter case selection discipline. An American competitor writing the identical claim carries roughly half the downside for none at all of that added cost.
Market Impact: Restructured agreements since 2023 judgment
3 additional market trends, 4 additional growth drivers, and 2 additional restraints and challenges are covered in the full report. Contact sales@marketmindsadvisory.com to access the complete intelligence.

Segment CAGR and Growth Architecture

Segmentation follows investment structure, since risk profile, diligence requirement and return characteristics all differ by structure rather than by the underlying dispute type. Six categories cover the market without overlap. Claim value, jurisdiction and counterparty type are treated as separate commercial dimensions throughout this report rather than as segmentation logic in their own right here.
litigation-funding-investment-market-market-share-analysis-1787913409436

Portfolio and Cross-Collateralised Funding

Bundled commitments across ten or twenty matters grow at 17.1%, half again the market rate of 11.4%, by converting a set of binary outcomes into a distribution an institutional allocator can genuinely underwrite rather than merely hope about. Around 61% of commitments now take this form. Pricing is finer than single-case terms because the risk is lower, and the funders who cannot offer portfolio structures find themselves competing for the concentrated matters that everybody else has already declined to write. Allocators who would never write a cheque against one judge's decision will commit readily against twenty of them, which is the entire reason this structure took over the market so quickly.
CAGR 17.1%

International Arbitration Funding

Arbitration funding grows at 13.8% on award enforceability across more than 170 New York Convention jurisdictions, which makes collection far more predictable than chasing a foreign court judgment through procedures nobody involved understands properly. Award values are large and tribunal timetables beat court listings comfortably. Investor-state matters carry the highest values and the worst collection problems, since a sovereign that declines to pay an award creates an enforcement exercise that can outlast the original dispute entirely. Tribunal timetables are the other attraction, since a panel that has agreed a procedural calendar generally keeps to it, and duration certainty is worth a great deal more to a funder than most claimants ever realise.
CAGR 13.8%
Full segment breakdown across 6 segments available in the complete report.

Regional Architecture and Country Demand Map

Geography follows civil procedure rather than economic size, because whether a losing party pays the winner's costs changes funder economics more than any other single variable anywhere in this business. Damages culture and discovery cost between them do rather most of the remaining explanatory work.

North America

Share sits at 38%, above the standard regional band, because American procedure imposes no loser pays liability, claim values run far above other jurisdictions and discovery costs make funding necessary even for well-resourced claimants. That justification reflects genuine procedural difference rather than any modelling preference. Patent and antitrust matters carry the largest commitments. Champerty restrictions vary by state and remain a live consideration in a handful of them. Disclosure requirements in federal courts have tightened considerably in recent years. Portfolio structures took hold here earlier than anywhere else, largely because institutional allocators arrived early and made clear they would not underwrite concentrated single-case exposure at any price they considered reasonable.
Share: 38% | CAGR: 10.2% (2026 to 2036)

Western Europe

Loser pays rules across most of the region create adverse costs exposure that roughly doubles funder downside and makes after-the-event insurance effectively compulsory. British courts remain the busiest venue and the 2023 decision on percentage-based agreements still shapes how every domestic agreement is drafted. Dutch foundation structures have become the preferred route for competition damages claims across Europe. German and Nordic markets are smaller and considerably more conservative in both case selection and pricing. Duration is the recurring underwriting problem across the region, since court listing times vary enormously between jurisdictions that otherwise look comparable, and funders who select on merits alone routinely discover that a strong claim in a slow court produces a disappointing internal rate of return.
Share: 24% | CAGR: 9.8% (2026 to 2036)
Regional intelligence for 5 additional markets available in the complete report: East Asia, South Asia and Pacific, Latin America, Middle East and Africa, Eastern Europe. Contact sales@marketmindsadvisory.com.
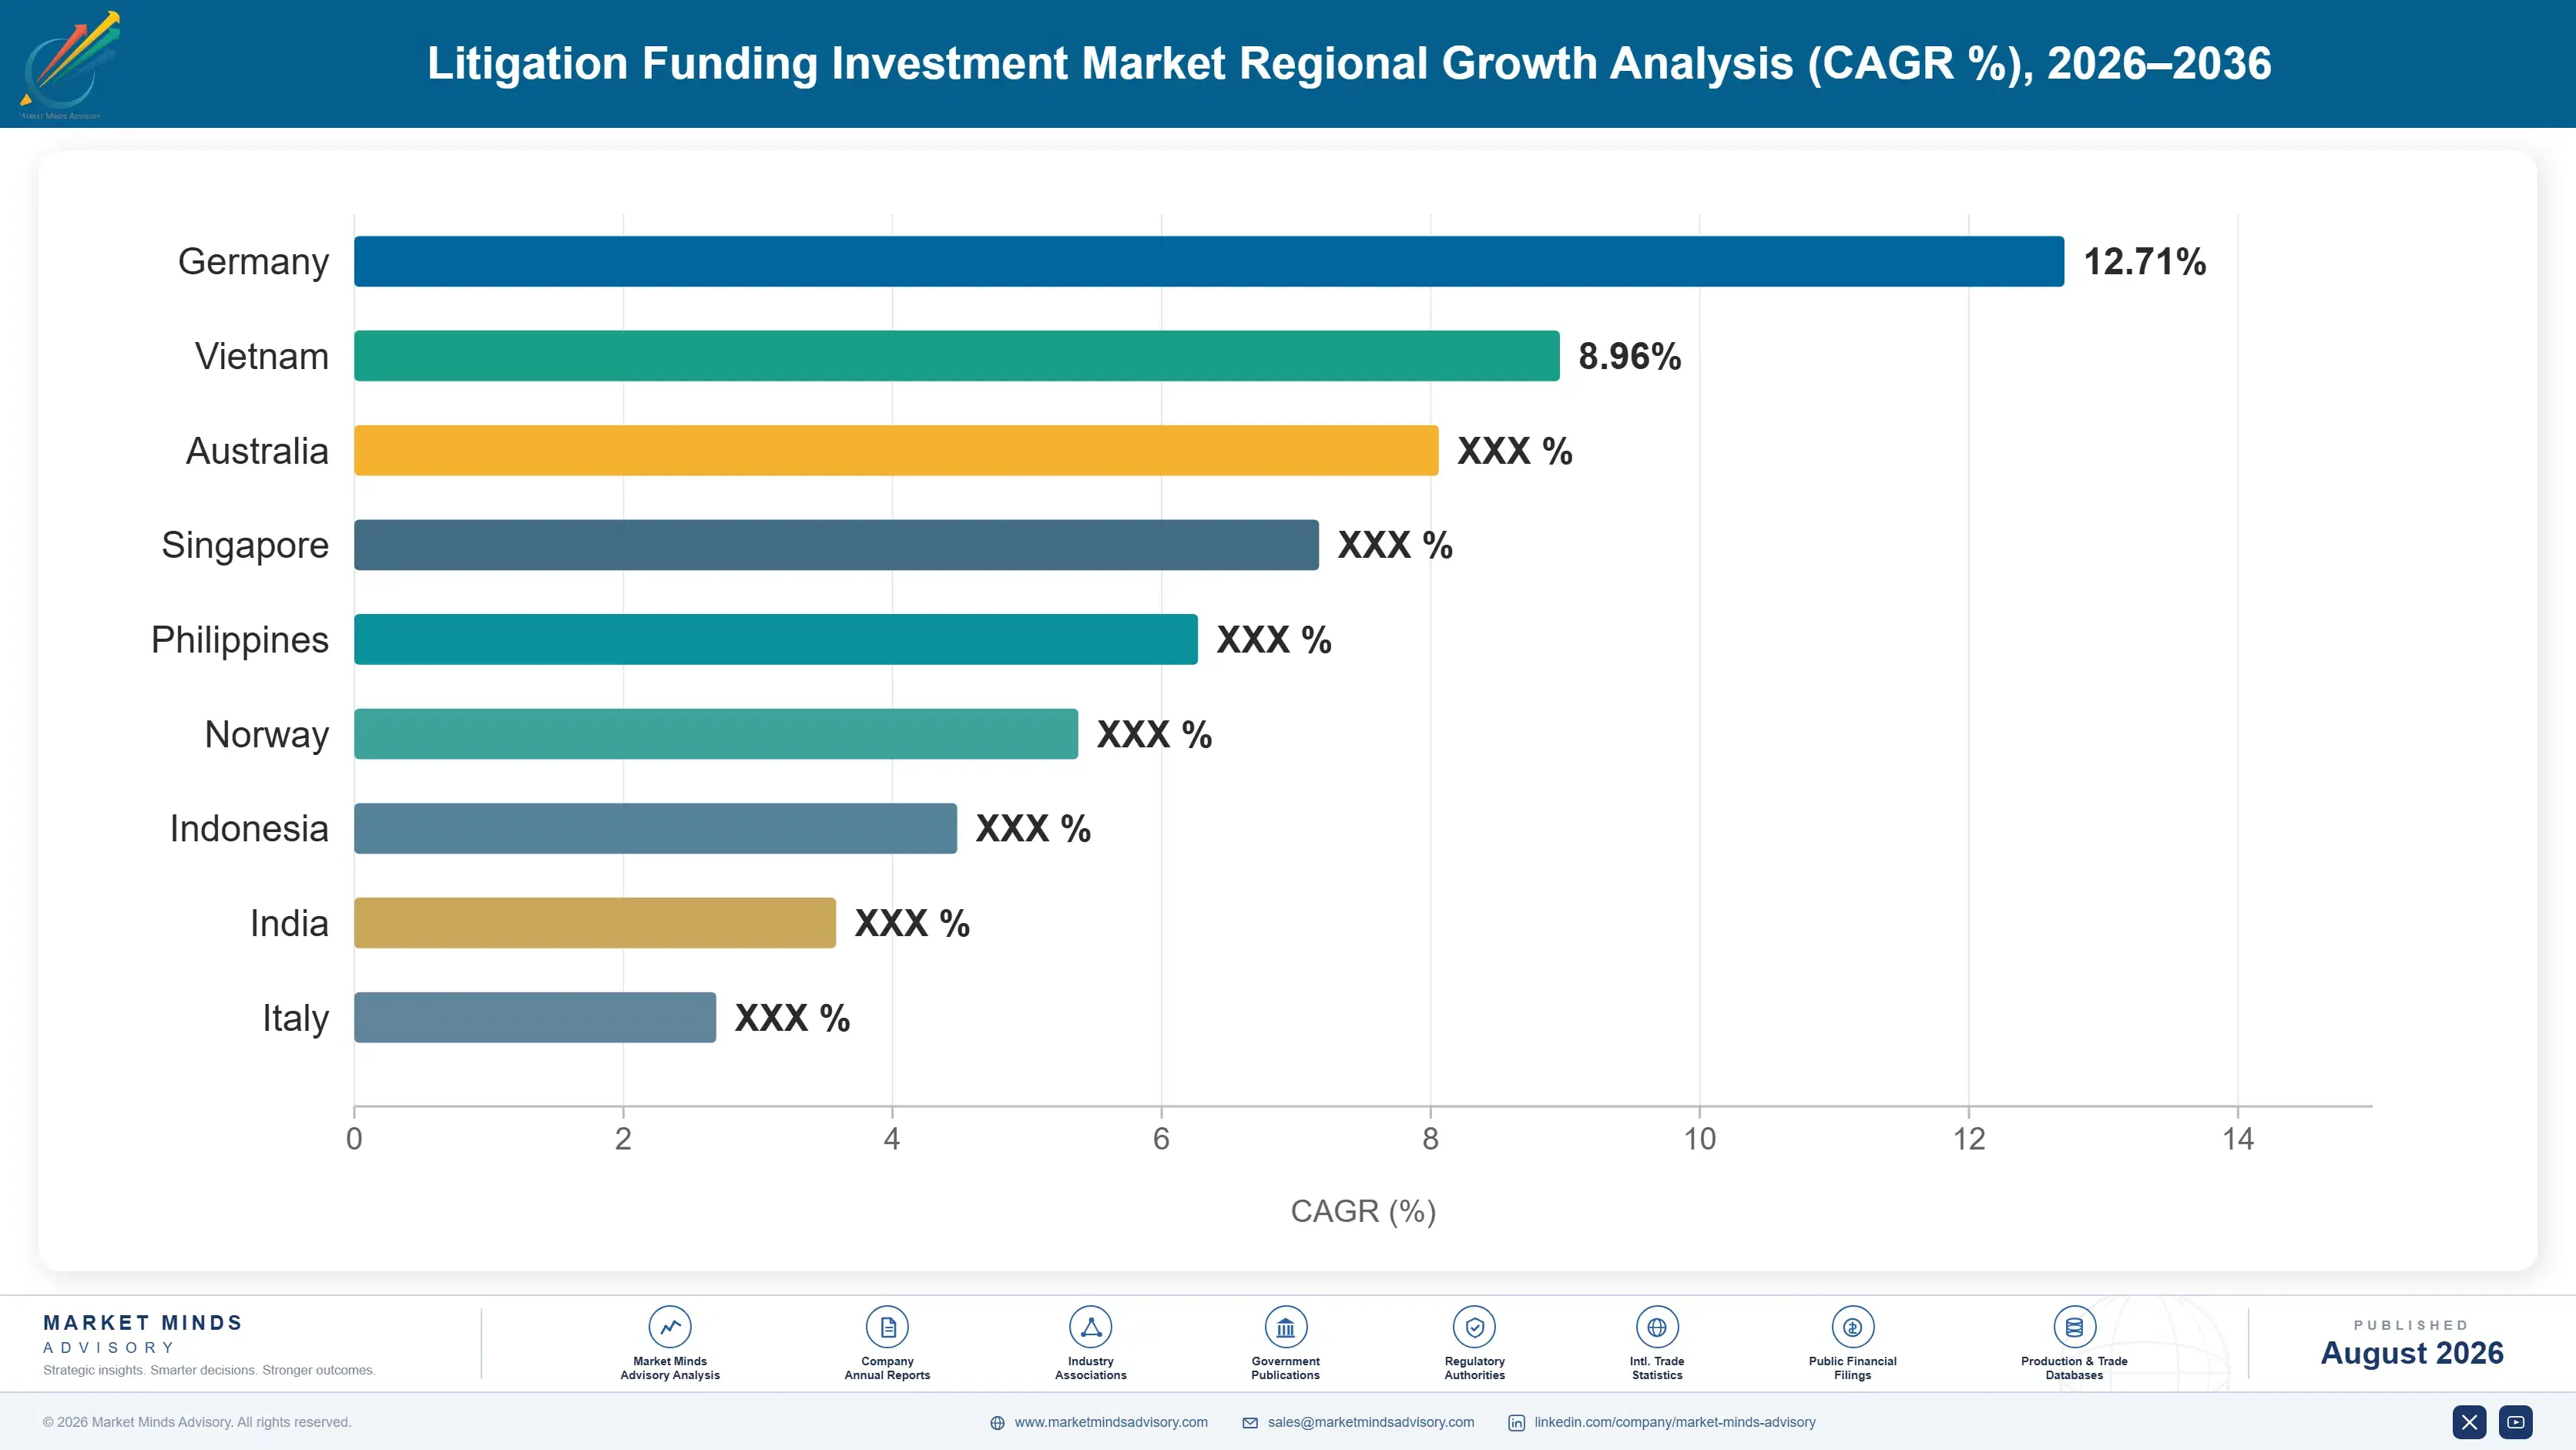
litigation-funding-investment-market-country-cagr-analysis-1787913409956

Underwrite The Calendar, Not Merits

Duration averages 43 months, portfolios hold 61% of commitments, adverse costs insurance runs 18% of covered exposure and win rates sit near 68%. Four levers work on duration underwriting, portfolio structuring, insurance efficiency and secondary liquidity rather than on the headline pricing terms that everybody in this particular market keeps advertising to anybody who asks.

Underwrite Duration As Rigorously As Merits

Every additional month beyond the 43 month average reduces internal rate of return while leaving the advertised multiple untouched, which is why portfolios can look healthy on paper and disappoint every allocator holding them. Funders modelling court listing times, appeal probability and enforcement duration by jurisdiction price risk that competitors ignore entirely. It means declining strong claims in slow courts, which is commercially painful and analytically correct. Merits diligence is well developed across the sector and duration diligence is barely developed at all, which is a curious allocation of effort for an asset priced on time.
Market Impact: Models duration well beyond the 43 month average

Offer Portfolio Structures Or Take What Remains

Cross-collateralised commitments hold around 61% of the market because they convert binary outcomes into a distribution allocators can underwrite, and pricing on them is finer precisely because the risk is genuinely lower. Funders without portfolio capability compete for concentrated single matters that portfolio funders have already declined. That is adverse selection operating in plain sight, and the funders experiencing it usually describe it as specialisation instead. Every allocator conversation now begins with portfolio construction rather than with case merits, which tells you exactly where this market has arrived over the past five years.
Market Impact: Competes for the 61% of commitments made annually

Negotiate Adverse Costs Cover At Portfolio Level

After-the-event premiums around 18% of covered exposure are priced case by case at most funders, when a portfolio-level facility spreads insurer risk across matters and prices considerably better. It also removes the scramble to place cover on individual claims against listing deadlines. Insurers prefer the diversification and will pay for it in pricing. Funders still buying case by case in loser pays jurisdictions are carrying a cost their competitors have already removed. It is a cost that competitors have already removed and that most funders have never once seriously examined.
Market Impact: Reduces the 18% premium by bundling covered matters

Build Secondary Market Positions Quite Deliberately

A four year non-recourse position is illiquid by construction, and funds reaching the end of their life hold matters that will resolve after the fund does. Buying those positions at a discount from constrained sellers is a genuinely attractive entry point, since diligence has been done once already. Around 68% of funded matters resolve favourably, so a discounted portfolio of seasoned cases carries far better odds than fresh origination does. Constrained sellers appear on a predictable schedule, which is the closest thing to a reliable entry signal this asset class offers anybody.
Market Impact: Buys into seasoned cases with 68% win rates

Who Controls the Margin Pool

Measured on disclosed litigation finance assets under management and capital deployed, the five largest funders hold a CR5 of 34%, reflecting a market where diligence quality and cost of capital decide outcomes rather than any scale advantage in origination. Burford Capital holds the largest portfolio and the only substantial public listing, Omni Bridgeway carries deep cross-jurisdiction enforcement capability, Fortress Investment Group brings institutional capital scale, and Bench Walk Advisors and Harbour Litigation Funding hold established positions. Nobody outside that group holds permanent capital at any comparable scale.
Two contests define activity. Large portfolio and law firm facilities compete on capital cost, where institutional backing wins. Single-case and specialist matters compete on diligence depth and speed of decision. The two reward completely different organisations, and very few funders manage both convincingly at once.

Pressure builds from insurers entering with contingent legal risk products that compete with funding on parts of the same risk. Rankings shift toward whoever can price duration properly rather than whoever writes the most commitments. Commitment volume has become a poor proxy for anything worth measuring in this business, since the money is made or lost years after the cheque was written.
litigation-funding-investment-market-company-positioning-matrix-1787913410474

Competitive Moat and Risk Dimensions

BURFORD CAPITAL

Moat: Public Capital And Portfolio Scale

A listed structure gives permanent capital rather than fund vehicles with finite lives, which matters enormously in an asset class where positions routinely outlast a ten year fund. That removes the forced-seller dynamic competitors face at fund end and allows genuinely patient underwriting. Scale also supports facilities that smaller funders cannot write.
BURFORD CAPITAL

Risk: Concentration In Very Large Matters

A portfolio weighted toward a small number of very large positions means individual outcomes move reported results materially, and public disclosure requirements amplify every fluctuation. Fair value accounting for unresolved claims attracts persistent scepticism. One adverse decision on a headline matter affects sentiment far beyond its actual economic weight in the book.
OMNI BRIDGEWAY

Moat: Cross-Border Enforcement Capability Depth

Decades of judgment and award enforcement work across difficult jurisdictions gives the firm capability that most funders simply outsource and price poorly as a result. Winning an award against a sovereign or a well-advised corporate is often the easy part; collecting it is where value is actually created or lost. That specialism is unusually hard to acquire quickly.
OMNI BRIDGEWAY

Risk: Australian Regime Regulatory Exposure

Substantial exposure to the Australian class action market means regulatory treatment of funded group proceedings moves the business directly, and that treatment has changed repeatedly over the past decade. Managed investment scheme requirements and court-supervised commission approval both compress returns in ways funders elsewhere do not face at all.

Players Tracked

Prominent Players

Burford Capital
Omni Bridgeway
Fortress Investment Group
Bench Walk Advisors
Harbour Litigation Funding

Other Key Players

Therium
Parabellum Capital
Longford Capital
Woodsford
Nivalion
Deminor
Litigation Capital Management
Legalist
Pravati Capital
Certum Group
Curiam Capital
Validity Finance
LitFin
Balance Legal Capital
Augusta Ventures

Recent Developments

MARCH 2025

British funding legislation remains unpassed after further parliamentary delay

The bill drafted to reverse the 2023 decision on percentage-based funding agreements failed to progress further through parliament. This was a legislative stall rather than any judicial development, and funders continue operating under restructured multiple-of-outlay agreements whose enforceability defendants keep testing wherever the opportunity arises.
Signal: Legal uncertainty here has now persisted long enough that everybody simply prices it as being permanent.
JULY 2025

Insurer launches contingent legal risk product covering case outcomes

A specialty insurer expanded a contingent legal risk product transferring adverse outcome exposure on commercial disputes. This was a product launch rather than any market entry by acquisition, and it competes with funding on part of the same risk while pricing it on actuarial rather than portfolio principles.
Signal: Insurance capital is entering the same risk from a completely different pricing tradition entirely of its own.
NOVEMBER 2025

Fund reaching end of life sells seasoned positions at discount

A litigation funding vehicle approaching the end of its stated life sold a portfolio of unresolved seasoned positions to a secondary buyer at a discount to carrying value. This was a secondary transaction rather than any distress sale, and it established comparable pricing that the market had previously lacked entirely.
Signal: Fund life and case duration are badly mismatched, and secondary buyers profit directly from that mismatch.

Capital, Cover, Diligence

Three costs sit against realisations. Cost of capital across fund and debt structures, after-the-event insurance premium in loser pays jurisdictions, and underwriting and monitoring cost together account for 54 to 71% of gross realisations at a typical funder. Capital comes from institutional limited partners expecting returns commensurate with illiquidity and binary risk, and from debt for the larger listed participants, and those two sources price the same risk quite differently.
Rates changed the arithmetic. Policy rates across advanced economies rose sharply through 2022 and 2023, which IMF data documents, and a non-recourse position resolving in roughly four years suddenly competed against risk-free alternatives yielding meaningfully more than nothing. Allocator hurdle rates rose accordingly. Burford Capital Annual Report 2024 disclosures describe the resulting cost of capital environment across the sector clearly enough for anybody reading them.

Exposure divides by capital permanence rather than by portfolio quality. Funders with permanent or evergreen capital underwrite patiently and hold positions until natural resolution. Funders operating finite-life vehicles face a mismatch between fund term and case duration that forces secondary sales at discount precisely when they have least negotiating room. That is where the sector's genuinely distressed pricing comes from, and it recurs predictably.
litigation-funding-investment-market-cost-volatility-analysis-1787913410669

Match capital duration to realistic case resolution timelines

Cases resolve around 43 months on average and frequently take considerably longer once appeals and enforcement are included, which sits awkwardly inside a ten year fund that also needs an investment period. Evergreen or permanent structures cost flexibility and investor familiarity. They remove the forced-seller position that recurs at the end of every finite fund life.

Place adverse costs cover at portfolio rather than case level

After-the-event premiums around 18% of covered exposure price considerably better when an insurer sees a diversified portfolio rather than an individual claim they must assess alone. Portfolio facilities require committing volume in advance and disclosing more than some funders prefer. The premium saving across a loser pays book is large enough to change competitive cost position materially.

Systematise duration data across jurisdictions and courts

Court listing times, appeal rates and enforcement duration vary enormously by jurisdiction and are rarely collected systematically by funders underwriting there. Building that dataset takes years and generates no immediate return whatsoever. It prices the single variable that determines realised returns and that most competitors still continue to treat as being essentially unknowable anyway.

Portfolio Architecture for Margin Defence

Realised returns follow risk diversification and capital permanence rather than headline pricing. Class and group action funding earns modestly against regulatory commission caps. Single-case commercial funding earns unevenly, with outcomes genuinely binary. Law firm working capital facilities earn reasonably on secured recourse structures. Insolvency claim monetisation earns well on negotiating position. International arbitration earns better on award values. Portfolio structures earn best, on risk that has actually been diversified rather than merely described.
The tension is that the highest-returning structures require the patient capital that fewest funders hold. Portfolio and arbitration positions resolve slowly and reward waiting, while finite-life vehicles need realisations on a schedule the courts have never agreed to observe. Funders resolve that conflict by selling seasoned positions at discount, which transfers exactly the returns they were chasing to whoever holds permanent capital.

High-value pools sit in three places. Portfolio structures, where diversification genuinely lowers risk and pricing has not fully caught up. Insolvency claim monetisation, where the estate has no alternative and the evidence is already assembled. And secondary purchases of seasoned positions from constrained sellers, which is where the sector's best risk-adjusted entries have consistently been available.

Volume / Commodity-Adjacent

Class action funding and law firm working capital facilities where commissions face court approval or recourse security caps the return. The 12-point range separates jurisdictions with commission supervision from those where terms are negotiated commercially.
Gross Margin: 18-30%

Premium / Certified

Single-case commercial funding and insolvency claim monetisation carrying full diligence cost and concentrated outcome risk. The 16-point spread reflects genuinely binary case outcomes rather than any variation in pricing discipline across funders.
Gross Margin: 34-50%

Sustainability / Regulatory / Next-Generation

Portfolio structures and international arbitration positions held by funders with patient capital through to natural resolution. The 24-point range is wide because diversified portfolio returns and individual arbitration award outcomes behave in completely different ways.
Gross Margin: 46-70%
litigation-funding-investment-market-portfolio-architecture-1787913411166

High-value Sub-segments and Strategic Watch-out

Cross-Collateralised Portfolios

Highest returns and fastest growth at 17.1%, protected by diversification that genuinely lowers risk while pricing has not fully adjusted to reflect it. The risk is that competitors reprice as portfolio track records accumulate and the advantage narrows. And that window is already narrowing steadily.
Gross Margin: 54-70%

Insolvency Claim Monetisation

Strong economics from estates with no alternative funding route and evidence already gathered during the insolvency process itself. The risk is that officeholders are experienced negotiators who understand exactly how little competition a funder usually faces. They negotiate accordingly, and they have always done so.
Gross Margin: 44-58%

Single-Case Commercial Funding

The volume core, where most funders built their books and where diligence capability was originally demonstrated to allocators. Funders hold it for origination flow and track record, not because concentrated binary risk pays well. Track record matters rather more here than the actual returns do.
Gross Margin: 26-40%

Finite-Fund Duration Mismatch

The strategic watch-out. Cases outlast fund lives and forced secondary sales transfer returns to permanent capital holders. The risk is underwriting positions that will resolve years after the vehicle holding them has to wind up. The winding up date always arrives regardless of anything else.
Gross Margin: 14-24%

Repeat Buyers, Single Transactions

Annuity characteristics here are almost entirely absent and funders should stop pretending otherwise. Each commitment is a discrete transaction resolving once, generating no recurring revenue and no renewal. What does recur is the counterparty. Law firms and insolvency practitioners bring matters repeatedly, and a funder who prices fairly and decides quickly sees the next case first. That relationship is the only annuity in the business and it is entirely informal.
Stickiness therefore lives with intermediaries rather than claimants. A claimant funds one dispute in a lifetime and never returns. A litigation department at a large firm generates matters continuously and remembers precisely who was slow to decide, who retraded terms after diligence, and who behaved badly when a case went sideways. Insolvency practitioners are the same and considerably more organised about comparing funders with one another.

The buyer profile has shifted from claimant toward institution over the past decade. Early funding served individuals and small companies who could not otherwise litigate. Corporate claimants now use funding as balance sheet management, moving legal cost off profit and loss regardless of whether they could afford it. General counsel and finance directors decide jointly, evaluating funders the way they evaluate any capital provider.
litigation-funding-investment-market-end-use-penetration-index-1787913411653

Time Is The Real Risk

These are among the four positions where our research anticipates prominent divergence between winners and laggards over the coming forecast period. Each is grounded in the demand model, the regulatory perimeter, and the announced capacity pipeline.
01 / DURATION UNDERWRITING RIGOUR

Every extra month costs return the multiple never shows

Cases resolve at around 43 months on average and court backlogs have been lengthening steadily across most jurisdictions, so every additional month erodes the internal rate of return while leaving the advertised multiple entirely unchanged. Funders who properly model listing times, appeal probability and enforcement duration by jurisdiction are pricing the one variable that actually determines realised performance here. Doing it properly means declining strong claims sitting in slow courts, which is commercially painful and yet analytically quite correct anyway.
02 / PORTFOLIO STRUCTURING CAPABILITY

Diversified books get funded, single cases get declined

Cross-collateralised commitments now hold around 61% of the whole market because bundling ten or twenty separate matters converts a set of binary outcomes into a distribution that institutional allocators are actually willing to go and underwrite properly. Pricing on those portfolios is finer precisely because the underlying risk really is genuinely lower. Funders without that capability end up competing for the concentrated single matters that the portfolio funders have already declined, which is simply adverse selection operating in plain view.
03 / CAPITAL PERMANENCE ALIGNMENT

Cases outlast the funds that were meant to hold them

A ten year vehicle carrying an investment period cannot comfortably hold positions that average some 43 months that frequently run considerably longer still once appeals and enforcement are both counted in properly. That mismatch forces secondary sales at a discount precisely at the moment when the seller has the least negotiating room available to them. Permanent or evergreen capital removes the forced-seller position entirely and captures the returns that finite structures keep quietly handing over to somebody else altogether instead.
04 / SECONDARY ENTRY DISCIPLINE

Seasoned positions from constrained sellers price best

Funds approaching the end of their stated lives hold unresolved matters that they simply must sell, and buyers acquire seasoned positions on which the diligence has already been performed and much of the procedural risk has already passed by then. Around 68% of all funded matters resolve favourably, so a discounted book of seasoned cases carries considerably better odds than any fresh origination does. The sector's best risk-adjusted entries have consistently come from exactly this one source rather than anywhere else.

Engagement Snapshot From the Field

A live engagement with an industry participant carrying material or product regulatory and market exposure ahead of a defining policy shift, showing how our research translates into a defensible multi-year portfolio strategy.
MARKET MINDS ADVISORY · CLIENT ENGAGEMENT SUMMARY
Litigation Funding Investment Producer Strategic Portfolio Review and Transition Roadmap 2026·Investment Scenario on Litigation Funding Investment Exposure Evaluation 2025-26
CLIENT PROFILE
A litigation funding manager operating two finite-life vehicles across British and European matters, with reported committed capital of 340 million dollars (client-reported, unverified by MMA). Roughly 71% sat in single-case commercial commitments. Adverse costs cover was placed case by case and the first vehicle was approaching the end of its stated investment life quite rapidly.
STRATEGIC CHALLENGE
Realised returns were tracking below target because case durations had extended well beyond underwriting assumptions, and the first fund faced positions that would resolve after its term ended. Management proposed raising a third vehicle on similar terms. That repeated the duration mismatch that was already destroying returns in the first two and left the underlying underwriting gap unaddressed.
MMA APPROACH
MMA rebuilt the portfolio on internal rate of return rather than multiple, then modelled resolution timing against actual court listing data by jurisdiction. Twenty-four expert interviews with allocators, insolvency practitioners, litigation partners and after-the-event insurers established how funders are actually compared. The analysis treated duration underwriting, portfolio structuring and capital permanence as the routes available.
KEY FINDINGS
  1. Reported multiples were meeting targets while internal rates of return sat roughly four percentage points below them, and no investor report had ever presented the second figure.
  2. Matters in two specific jurisdictions accounted for most of the duration overrun, and both had been selected on merits alone with no listing time analysis performed.
  3. Case-by-case adverse costs placement was costing materially more than a portfolio facility would, and three insurers confirmed they would price a bundled book better.
  4. The first vehicle held nine positions certain to outlast its term, all of which would require secondary sale at a discount to carrying value.
CLIENT PROFILE
A litigation funding manager operating two finite-life vehicles across British and European matters, with reported committed capital of 340 million dollars (client-reported, unverified by MMA). Roughly 71% sat in single-case commercial commitments. Adverse costs cover was placed case by case and the first vehicle was approaching the end of its stated investment life quite rapidly.
STRATEGIC CHALLENGE
Realised returns were tracking below target because case durations had extended well beyond underwriting assumptions, and the first fund faced positions that would resolve after its term ended. Management proposed raising a third vehicle on similar terms. That repeated the duration mismatch that was already destroying returns in the first two and left the underlying underwriting gap unaddressed.
MMA APPROACH
MMA rebuilt the portfolio on internal rate of return rather than multiple, then modelled resolution timing against actual court listing data by jurisdiction. Twenty-four expert interviews with allocators, insolvency practitioners, litigation partners and after-the-event insurers established how funders are actually compared. The analysis treated duration underwriting, portfolio structuring and capital permanence as the routes available.
KEY FINDINGS
  1. Reported multiples were meeting targets while internal rates of return sat roughly four percentage points below them, and no investor report had ever presented the second figure.
  2. Matters in two specific jurisdictions accounted for most of the duration overrun, and both had been selected on merits alone with no listing time analysis performed.
  3. Case-by-case adverse costs placement was costing materially more than a portfolio facility would, and three insurers confirmed they would price a bundled book better.
  4. The first vehicle held nine positions certain to outlast its term, all of which would require secondary sale at a discount to carrying value.
RECOMMENDED STRATEGY
Phase 1: Phase one: report internal rate of return alongside multiple to investors immediately, since the gap will surface eventually anyway regardless. Phase 2: Phase two: place adverse costs cover at portfolio level and build jurisdiction duration data into every future underwriting decision made. Phase 3: Phase three: structure the next vehicle with evergreen features rather than a fixed term that the case durations cannot fit inside.
OUTCOME
Internal rate of return reporting was adopted and received better than management expected (client-reported, unverified by MMA). A portfolio adverse costs facility was placed at a materially lower effective premium. Jurisdiction duration screening now precedes every merits assessment. The third finite-life vehicle was redesigned with evergreen features, having originally proposed repeating the exact mismatch that caused the problem.

Frequently Asked Questions

Foundational context covering the market sizes, CAGR, scope, country, region and competition that inform every finding below. This section is provided to cover basics and most often pre-purchase conversations, answered from the MMA Primary Research Dataset.

What is the current size of the Litigation Funding Investment Market?

The market represented 6.4 billion dollars of capital committed and deployed in 2025, across single-case, portfolio, arbitration, insolvency and group action funding. It reaches 7.13 billion dollars in 2026.

How large will the Litigation Funding Investment Market be by 2036?

MMA forecasts 20.99 billion dollars by 2036, an increase of 13.86 billion dollars over the 2026 base. That represents an expansion multiple of 2.94 times across the forecast period.

What is the CAGR for the Litigation Funding Investment Market 2026 to 2036?

The base case compounds at 11.4% annually. The bull case reaches 12.6% if British legislation restores percentage-based agreements, while the bear case sits at 10.2% on lengthening court delay.

Which segment is growing fastest?

Portfolio and cross-collateralised funding, at 17.1%, half again the market rate of 11.4%. Bundling matters converts binary outcomes into something institutional allocators can genuinely underwrite.

Who are the major companies in the Litigation Funding Investment Market?

Burford Capital, Omni Bridgeway, Fortress Investment Group, Bench Walk Advisors and Harbour Litigation Funding lead on disclosed assets under management. Concentration is only 34% across the sector.

Which country is growing fastest?

India at 13.4%, where courts have declined to treat third-party funding as impermissible and case backlogs make duration the central underwriting question rather than merits.

Report Segmentation Architecture

The full report scope spans multiple orthogonal segmentation dimensions, with cross-tabulated demand data provided for each dimension pair. Coverage extends further to regional breakdowns, trend trajectories, and the competitive detail needed to support segment-level decision-making.

By Investment Structure

  • Single-Case Commercial Litigation Funding
  • Portfolio and Cross-Collateralised Funding
  • International Arbitration Funding
  • Insolvency and Claim Monetisation Funding
  • Class and Group Action Funding
  • Law Firm Working Capital Facilities

By End-Use Industry

  • Technology and Intellectual Property
  • Financial Services and Banking
  • Construction and Infrastructure
  • Energy and Natural Resources
  • Pharmaceutical and Life Sciences
  • Consumer and Competition Claims

By Commercial Dimension

  • Law Firm Referral Origination
  • Direct Corporate Claimant Engagement
  • Insolvency Practitioner Mandates
  • Broker and Intermediary Introduction
  • Secondary Position Purchases
  • Co-Investment and Syndication Arrangements

By Region

  • North America
  • Western Europe
  • East Asia
  • South Asia and Pacific
  • Latin America
  • Middle East and Africa
  • Eastern Europe

Scope, Methodology, and Coverage

Every figure in this report is reproducible from documented input assumptions. The scope below maps the historical period, the forecast horizon, the segmentation dimensions, and the countries covered, alongside the underlying primary and qualitative methodology.
Historical Period
2020 to 2025
Forecast Period
2026 to 2036
Base Year
2025 (USD billions; MMA Primary Research Dataset, August 2026)
Market Definition
Scope covers capital committed and deployed into litigation funding investments on a non-recourse basis, spanning single-case commercial litigation funding, portfolio and cross-collateralised funding across bundled matters, international arbitration funding including investor-state and commercial arbitration, insolvency and claim monetisation funding provided to estates and officeholders, class and group action funding, and working capital facilities extended to law firms secured against case inventory. Contingency and conditional fee arrangements between lawyers and their clients, after-the-event and legal expenses insurance premiums earned by insurers, contingent legal risk insurance products, equity investment into law firms or alternative business structures, and recourse lending to legal practices are excluded from the market size and all derived figures.
Quantitative Units
USD billions of capital committed and deployed (current prices); case duration in months; return multiple against capital deployed; adverse costs insurance premium as percentage of covered exposure; funded matter win rate
Segmentation Dimensions
By Investment Structure; By End-Use Industry; By Commercial Dimension; By Region
Regions Covered
North America, Western Europe, East Asia, South Asia and Pacific, Latin America, Middle East and Africa, Eastern Europe
Countries Covered
USA, UK, Australia, Netherlands, Germany, Canada, Singapore, Hong Kong, India, Brazil, France, Spain, United Arab Emirates, South Africa, Poland
Key Companies Profiled
Burford Capital, Omni Bridgeway, Fortress Investment Group, Bench Walk Advisors, Harbour Litigation Funding, Therium, Parabellum Capital, Longford Capital, Woodsford, Nivalion, Deminor, Litigation Capital Management, Legalist, Pravati Capital, Certum Group, Curiam Capital, Validity Finance, LitFin, Balance Legal Capital, Augusta Ventures
Quantitative Methodology
Primary survey, n=3,800 respondents, Q4 2025, six countries; demand-side model with trade association cross-validation
Qualitative Methodology
47 expert interviews, Q4 2025; applied to validate demand model assumptions, identify emerging dynamics, and assess competitive positioning
Report Format
PDF and XLSX data workbook (Word format preview document)
Publisher
Market Minds Advisory
Report Code
MMA-2026-TEC-161
Published
August 2026
Contact
sales@marketmindsadvisory.com | www.marketmindsadvisory.com

Purchase the full Litigation Funding Investment Market Report (2026 to 2036).

The full report runs to 170 pages and covers all six investment structure segments, seven regions and 20 profiled funders in detail. It includes the complete segment CAGR set, regional analysis of civil procedure and its effect on funder economics, and duration modelling comparing headline multiples against realised internal rates of return. Company profiles carry evaluation on disclosed litigation finance assets under management and capital deployed, with moat and risk assessment for the top five funders. The competitive section extends to 12 tracked legal, regulatory and transactional developments across 2024 and 2025. Primary research inputs include a quantitative survey of 3,800 respondents and 47 expert interviews conducted in Q4 2025.
Six investment structure segments with individual CAGR forecasts
Seven regional markets compared on civil procedure and cost rules
Twenty funder profiles on consistent capital deployment basis
Twelve tracked legal and transactional developments with commercial interpretation
Duration modelled against realised internal rates of return
Adverse costs exposure quantified across loser pays jurisdictions

Built For The People Who Decide

From boardroom strategy to bench-side execution, this report is read cover-to-cover by leaders shaping the next decade of their industry, turning demand scenarios, market dynamics and valuation benchmarks into decisions.
CXOs/ Presidents/ VPs/ Managers
M&A and Corporate Development
Strategy Teams and R&D Heads
Procurement and Product Directors
Regulatory and Compliance Leaders
Investor Relations and Equity Analysts