Market Minds Advisory
Liquid Hydrogen Market

Liquid Hydrogen Market: Liquid Hydrogen Market. Heavy-Duty Transport Fueling Redraws Infrastructure Investment Priorities.

Rapid heavy-duty transport fueling and marine bunkering buildout is pushing liquid hydrogen infrastructure investment well beyond aerospace applications across the United States, Japan, and Australia at an accelerating pace now.

Lead Analyst

Published

September 2026

Make Smarter Decisions with Customized Research Insights

Request a free sample report and evaluate market opportunities, growth trends, and competitive dynamics relevant to your business needs.

2025 MARKET VALUE$3.2BMarket Size 2025
2036 FORECAST VALUE$12.3BBase Case , 2026 to 2036
CAGR 2026 TO 203613.0 %Bull 14.4% / Bear 11.6%
INCREMENTAL OPPORTUNITY$8.7BNet 10- year value creation
EXPANSION MULTIPLE3.40x2036 value over 2026 base
Strategic Levers
M&A Pipeline
Regional Outlook
Country Rankings
Competitive Intelligence
Segmental Deep-dive
Call-Us : 91 93563 13602

Executive Snapshot and Market Trajectory.

Heavy-duty transport fueling and marine bunkering demand is forcing industrial gas majors to expand liquefaction capacity well beyond aerospace and industrial process forecasts made only a few years earlier, reshaping investment priorities across major production regions this year. Suppliers are scrambling to secure sufficient cryogenic tank capacity.
Commercial momentum concentrates around large-scale liquefaction trains and cryogenic distribution infrastructure serving hydrogen fueling stations, both requiring capital investment far exceeding traditional merchant liquid hydrogen supply chains. North America leads volume production given its established industrial gas and aerospace base, while Japan and Australia expand liquefaction capacity under national hydrogen strategy commitments targeting export infrastructure. Domestic hydrogen strategy funding in several major markets is further reshaping where liquefaction capacity gets built over coming years.
The competitive field remains dominated by established industrial gas majors with decades of cryogenic engineering experience, though specialized hydrogen infrastructure developers are entering fueling station and bunkering segments aggressively. Liquefaction efficiency and distribution network scale will determine which suppliers capture the largest share of transport fueling contracts over the coming decade, with rankings likely shifting as new entrants gain ground. Watch this transition closely across the coming year.
Market Definition
This report covers liquid hydrogen produced through cryogenic liquefaction for aerospace, transport fueling, industrial processing, and energy storage applications. It excludes gaseous compressed hydrogen distribution, hydrogen produced for on-site ammonia synthesis without liquefaction, and liquid organic hydrogen carrier technologies.
Base Year Value
$3.2B in 2025 (MMA Primary Research Dataset, September 2026)
Forecast Period
2026 to 2036, eleven discrete annual values
CAGR
13.0% base case. Bull 14.4%. Bear 11.6%.
Fastest Growth Segment
Heavy-Duty Transport Fueling: 18.0% CAGR
Fastest Growth Country
Australia: 15.5% CAGR
Fastest Growth Region
South Asia and Pacific: 15.0% CAGR
Largest Region
North America: 34% of 2025 global value
Market Leaders
Air Products and Chemicals, Linde plc, Air Liquide, Air Water Inc, Iwatani Corporation. Source: MMA Primary Research Dataset, July 2026.
Primary Survey
n=3,800 procurement and R&D decision-makers, Q4 2025, six countries
Methodology
Demand-side build-up, cross-validated against public data, 47 expert interviews

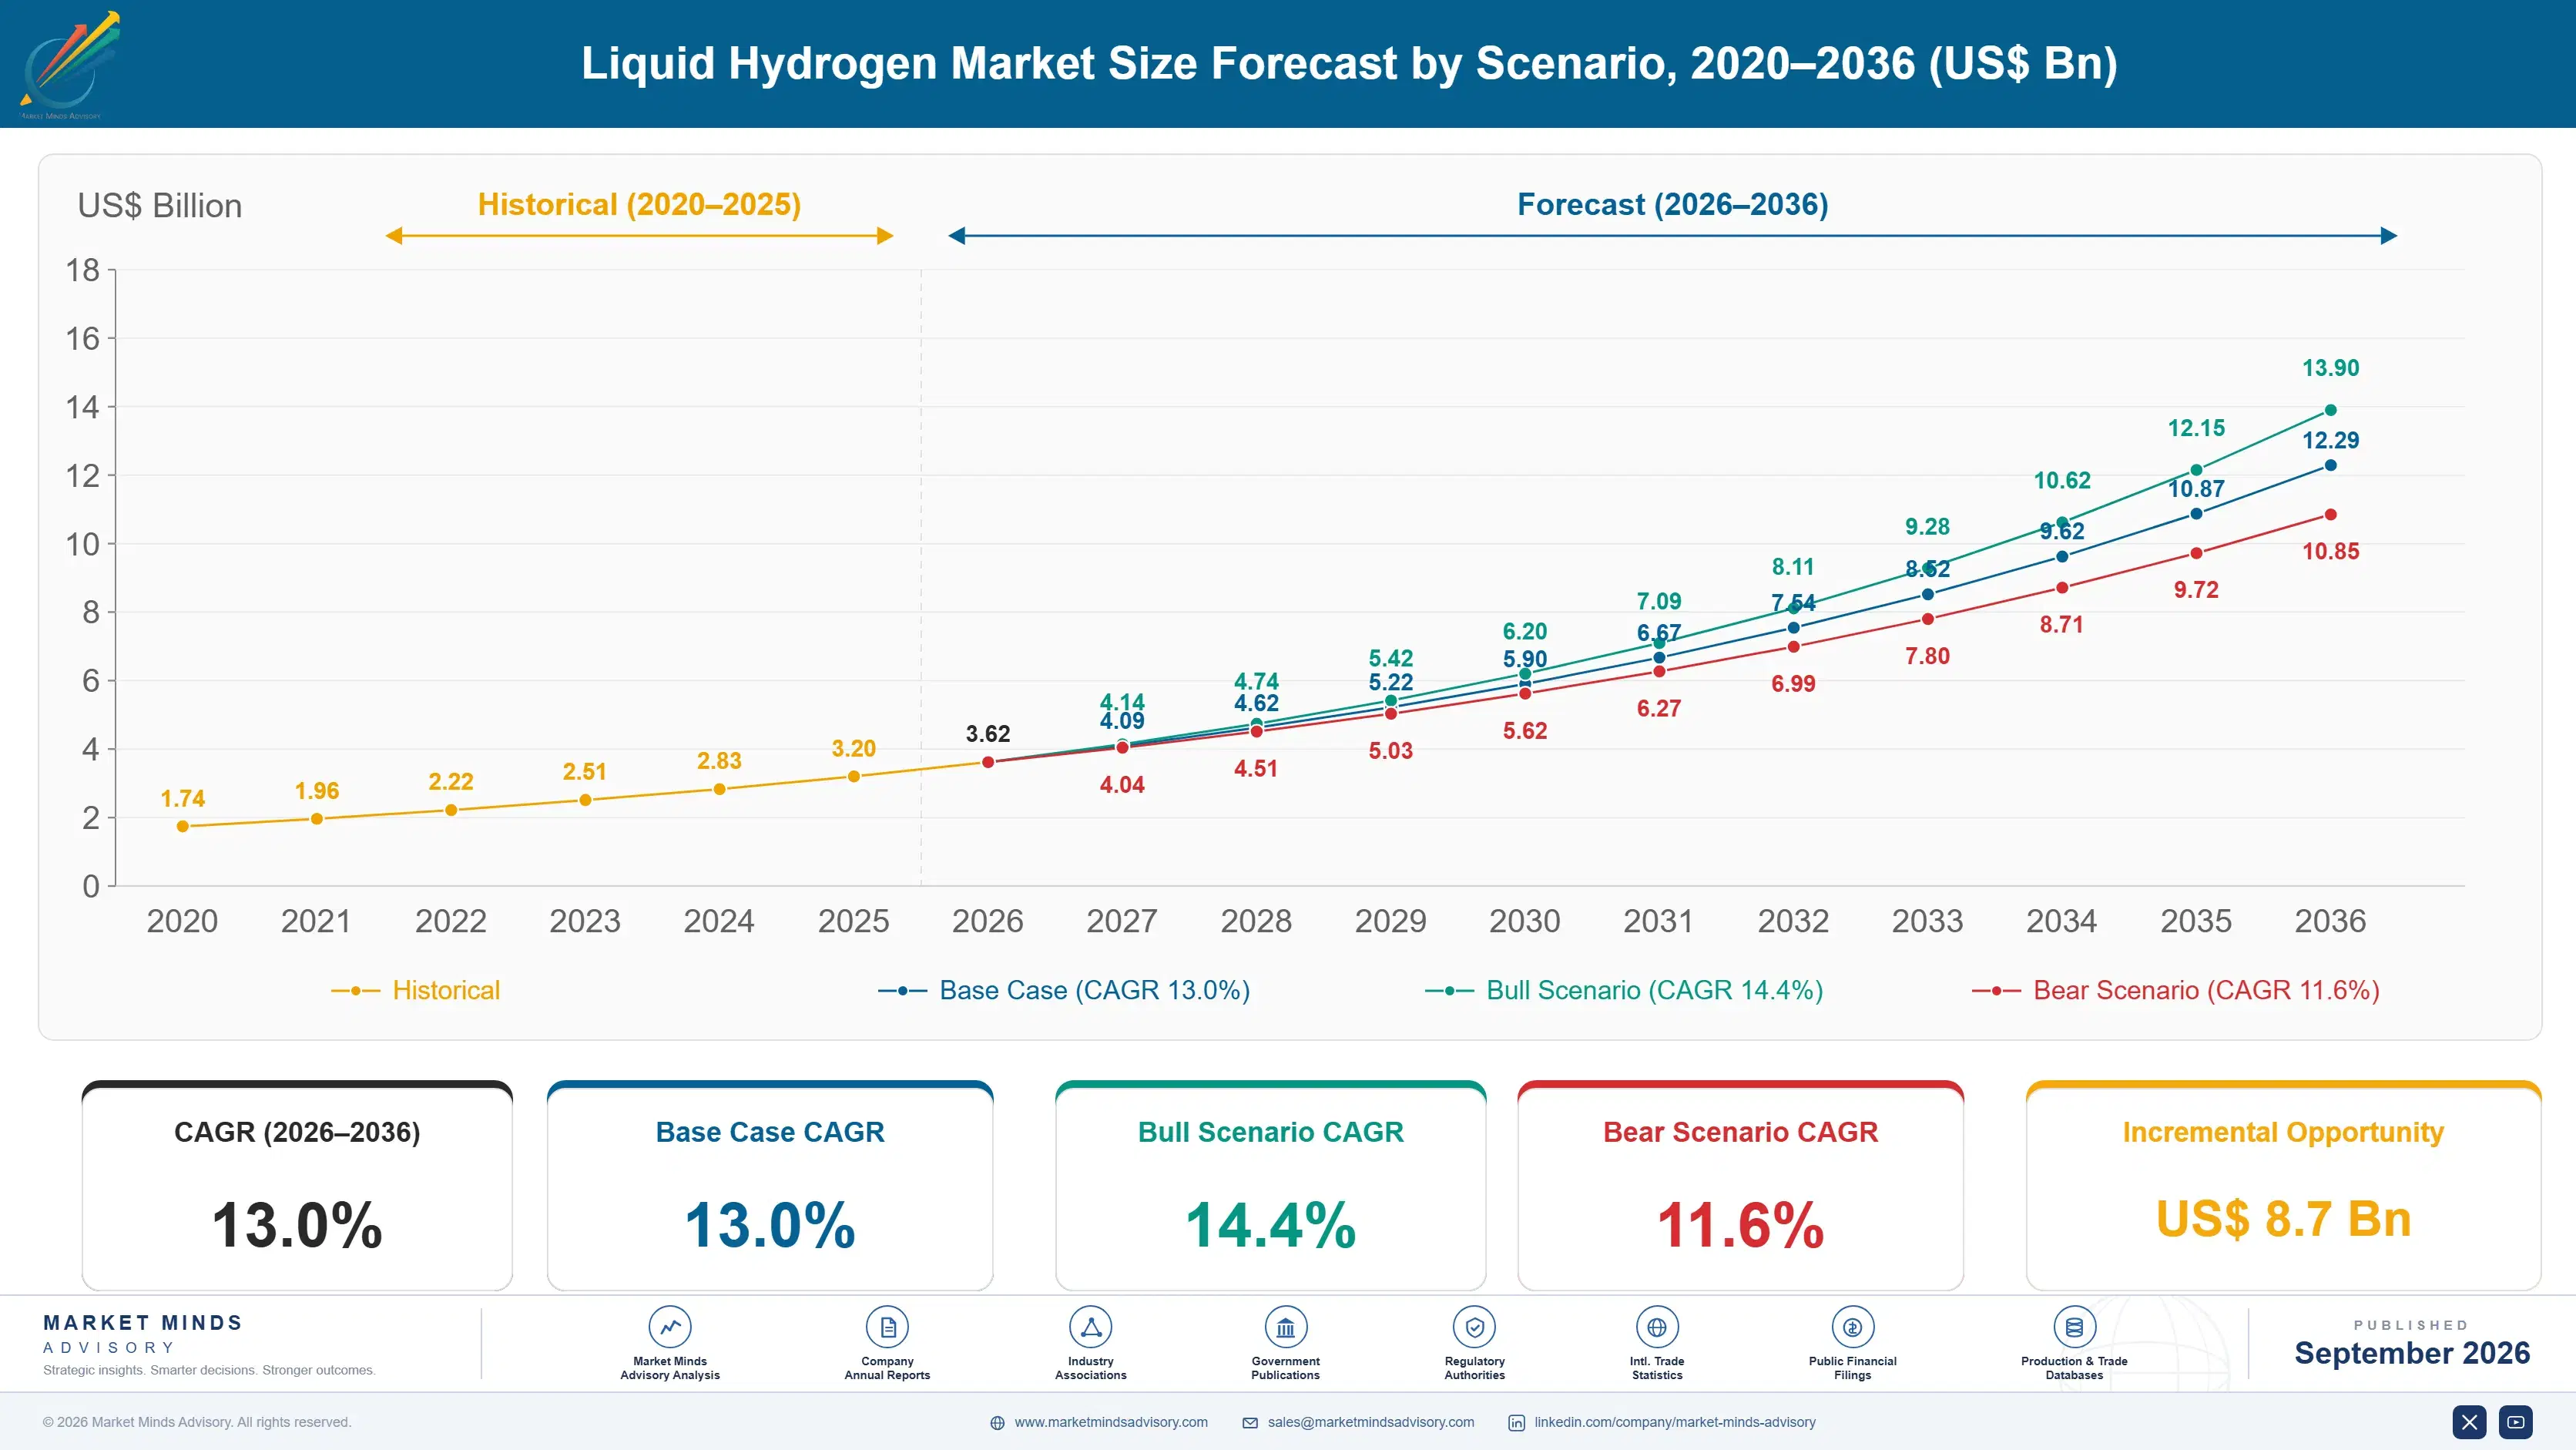
Liquid Hydrogen Market Forecast Scenarios

liquid-hydrogen-market-size-forecast-scenario-1788256760035
Liquid hydrogen demand grew from a modest aerospace and industrial base between 2020 and 2025, expanding at roughly 11.5 percent annually as early transport fueling pilot projects proved technical feasibility. Most activity through this period remained confined to established industrial applications rather than commercial-scale transport fueling deployment across the wider economy. Investment accelerated only after 2023, once pilots confirmed reliability.
The base case assumes steady commercial acceleration driven by three mechanisms: rapid heavy-duty vehicle fueling station buildout across major freight corridors, growing marine bunkering commitments from shipping operators targeting decarbonization, and national hydrogen strategy funding supporting liquefaction capacity expansion in key exporting economies. Combined, these forces support 13.0 percent compound annual growth through 2036 as transport applications gain further share of total demand. Engineering contractors are already retooling liquefaction supply chains to meet this anticipated demand curve worldwide.
A bull scenario built around accelerated marine bunkering adoption beyond current pilot commitments could push growth toward 14.4 percent, while a bear case tied to liquefaction cost persistence and slower fueling rollout could pull growth down toward 11.6 percent. Either path implies higher capacity than currently installed worldwide. Terminal commissioning pace would differ meaningfully between these two scenarios across major corridors.

Transport Fueling Redraws Liquefaction Investment Priorities

Liquid hydrogen demand is concentrating around transport fueling and marine bunkering infrastructure rather than distributed industrial installations, reflecting the hydrogen economy's shift toward commercial-scale decarbonization applications. Terminal operators favor liquid hydrogen over compressed gaseous alternatives given meaningfully higher energy density for long-haul freight and marine applications specifically. Import-dependent economies are treating fueling infrastructure as strategic decarbonization capacity rather than ordinary industrial gas procurement.
MARKET CONCENTRATIONCR5 58%Top five gas majors hold majority industry revenue
AVERAGE SELLING PRICE$6.80 per kgReflects typical merchant liquid hydrogen delivered unit pricing
TOP COUNTRY SHAREUnited States 28%Leads global demand through established industrial gas infrastructure
CAPACITY UTILISATION70%Reflects early-stage commercial ramp across new liquefaction trains
TRADE INTENSITY22%Share of supply value sourced through cross-border shipment
FEEDSTOCK COST SHARE45% of COGSElectricity and hydrogen feedstock inputs drive most production cost
Suppliers face a genuine capacity choice between expanding conventional liquefaction trains and investing in next-generation efficiency improvements that reduce energy consumption per unit produced. Conventional liquefaction remains the commercial default given proven reliability, though rising electricity costs are pushing several suppliers toward efficiency-focused alternatives actively. Suppliers that diversify liquefaction technology early may capture disproportionate share as electricity costs shift over the coming years.
Demand growth through 2036 depends heavily on national hydrogen strategy commitments translating into firm fueling infrastructure orders rather than remaining exploratory pilot programmes. Japan and the United States have moved furthest toward binding procurement, while European operators still work through permitting and final investment decisions across several major projects. Terminal lead times of eighteen to thirty months mean today's ordering decisions will shape which suppliers dominate early commercial deployment.
"Nobody expected transport fueling to outpace aerospace demand this fast. Suppliers with proven liquefaction efficiency data are winning terminal contracts that would have gone to conventional gas majors two years ago."
Senior Analyst, Energy Transition Practice · MMA Energy Practice · September 2026

Market Trends

Heavy-Duty Vehicle Fueling Stations Scale Rapidly

Freight logistics operators and vehicle manufacturers have moved decisively from pilot demonstration to binding fueling station procurement along major highway corridors, driven by national heavy-duty vehicle decarbonization targets requiring substantial liquid hydrogen delivery capacity annually by the early 2030s. California, Germany, and Japan have each announced fueling corridor projects incorporating large-scale liquefaction and storage infrastructure rather than relying on trucked-in compressed gas supply. This shift is pulling forward equipment orders that industry participants had previously expected only toward the end of the decade, compressing supplier lead times considerably across the region.
Market Impact: Locks in 2.1 million tonnes demand
Marine Bunkering Pilots Reach Commercial Scale

Liquid hydrogen marine bunkering has progressed from laboratory demonstration to pilot-scale commercial deployment faster than most industry participants anticipated, offering meaningfully lower emissions than conventional marine fuel alternatives for vessels operating on shorter coastal routes. Several shipping operators have announced retrofit programmes incorporating liquid hydrogen storage and bunkering infrastructure, testing continuous-operation reliability under real commercial conditions rather than controlled demonstration environments. Success in these programmes would meaningfully expand liquid hydrogen demand beyond current terminal capacity, a genuine opportunity for suppliers whose commercial position rests heavily on established cryogenic engineering and long operating track records.
Market Impact: Cuts energy consumption 25 percent

Market Opportunities and Growth Drivers

National Hydrogen Strategies Lock In Infrastructure Demand

Japan's Basic Hydrogen Strategy and the United States Department of Energy's hydrogen hub programme both specify binding capacity targets for liquid hydrogen production and distribution infrastructure, translating directly into equipment procurement over the coming decade. These strategies carry government-backed funding mechanisms that reduce commercial risk for terminal developers, encouraging faster final investment decisions than would occur under purely market-driven economics. European countries are adopting similar frameworks, though implementation timelines lag roughly two to three years behind the more advanced American and Japanese programmes currently driving most committed orders. Equipment vendors are adjusting regional sales strategy accordingly.
Market Impact: Adds 15 to 20 percent

Liquefaction Technology Improvements Cut Energy Consumption

Advanced liquefaction technology reduces the substantial energy penalty historically associated with cooling hydrogen to cryogenic temperatures, a decisive advantage as terminal operators face rising scrutiny over the carbon intensity of hydrogen supply chains powered by grid electricity. This efficiency advantage directly improves project economics, particularly at terminal scale where energy costs represent a substantial share of total operating expenditure across the facility's working life. Suppliers able to demonstrate audited energy consumption data are winning a disproportionate share of new terminal contracts as procurement teams tighten technical evaluation criteria considerably. This gap is widening as evaluation criteria tighten.
Market Impact: Cuts delivered volume 3 percent

Market Restraints and Challenges

Electricity Cost Exposure Limits Terminal Margins

Liquefaction consumes substantial electricity per unit of hydrogen produced given the energy-intensive cryogenic cooling process, exposing terminal operators and suppliers to significant input cost risk that is difficult to hedge over multi-year offtake contract terms. The root cause traces to fundamental thermodynamic limits governing hydrogen liquefaction, which remains meaningfully more energy-intensive than natural gas liquefaction processes. Suppliers are mitigating this exposure through renewable power purchase agreements and by accelerating development of more efficient liquefaction cycle technology that reduces overall electricity consumption per unit produced. This exposure persists industry-wide currently. Progress continues broadly.
Market Impact: Adds 2.1 million tonnes capacity

Boil-Off Losses Reduce Delivered Volume Considerably

Liquid hydrogen naturally boils off during storage and transport given its extremely low boiling point, reducing delivered volume and creating meaningful commercial losses across long-distance shipment routes that regularly extend delivery timelines beyond original estimates. The root cause lies in the physical challenge of maintaining cryogenic temperatures across extended storage and transport periods without excessive insulation cost. Suppliers are mitigating this through improved tank insulation technology and by pursuing shorter-distance supply routes wherever commercially feasible to minimize boil-off exposure. These losses remain particularly acute across longer intercontinental shipping routes lacking optimized cryogenic insulation infrastructure entirely.
Market Impact: Cuts marine emissions 40 percent
4 additional market trends, 3 additional growth drivers, and 3 additional restraints and challenges are covered in the full report. Contact sales@marketmindsadvisory.com to access the complete intelligence.

Segment CAGR and Growth Architecture

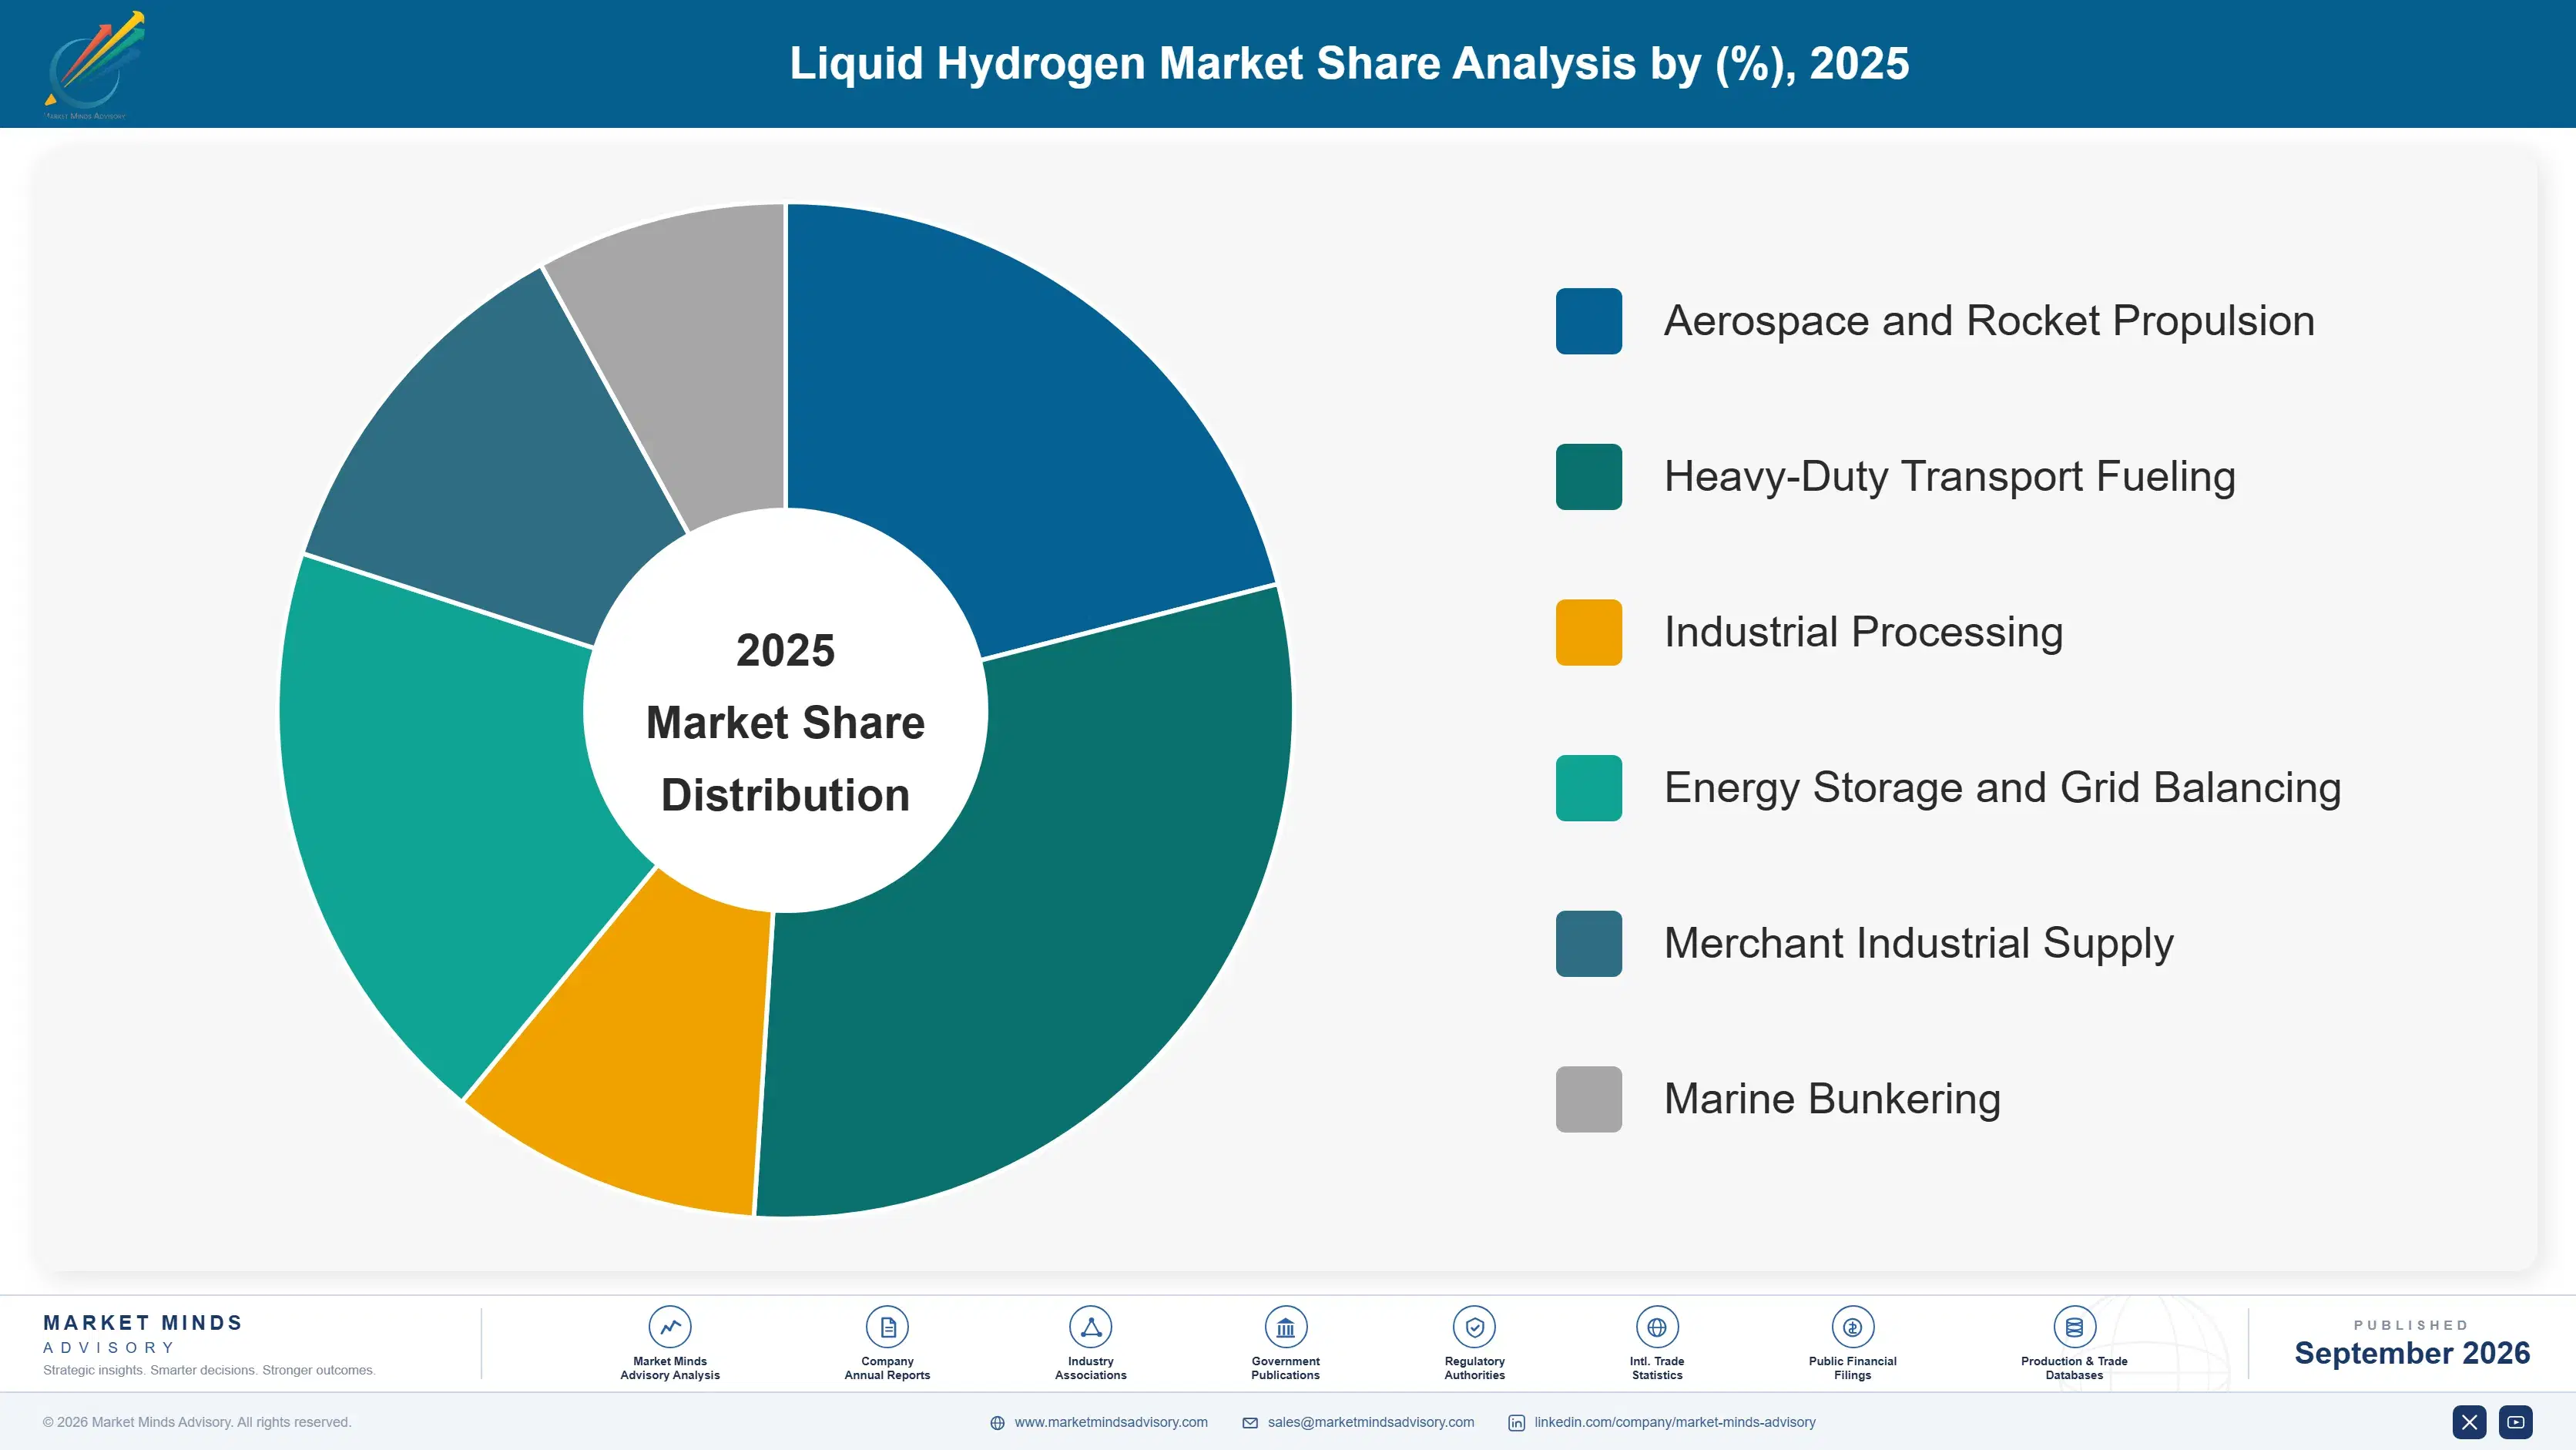
Liquid hydrogen segments by end-use application, the primary axis of demand differentiation across the value chain. Six application categories span mature aerospace propulsion through fast-growing transport fueling and bunkering formats. Terminal buyers evaluate each technology on delivered volume, boil-off performance, and total lifecycle cost rather than upfront price alone when selecting suppliers. Manufacturers must invest across both dimensions.
liquid-hydrogen-market-market-share-analysis-1788256760639

Heavy-Duty Transport Fueling

Heavy-duty transport fueling represents the fastest-growing application category, expanding at an estimated 18.0 percent annually as freight logistics operators and vehicle manufacturers commit to binding fueling station procurement along major highway corridors. This segment benefits from national decarbonization mandates targeting long-haul trucking, where liquid hydrogen's superior energy density over compressed gas alternatives extends vehicle range meaningfully. Suppliers with established terminal engineering capability are capturing a disproportionate share of this segment's growth, while smaller regional distributors focused purely on industrial merchant supply struggle to compete on infrastructure scale alone against qualified incumbents. Continued corridor buildout should sustain this segment's above-average growth pace well through the remainder of the forecast period. Early movers should benefit considerably.
CAGR 18.0%

Marine Bunkering

Marine bunkering is expanding at an estimated 16.0 percent annually, the second-fastest pace in the category, driven heavily by shipping operators seeking compliance with tightening emissions regulations across major coastal and short-sea shipping routes. This format requires specialized bunkering infrastructure at ports capable of handling cryogenic fuel transfer safely, a capability few port operators currently possess at commercial scale. Suppliers offering integrated bunkering and storage solutions are winning a growing share of these retrofit contracts as vessel operators accelerate decarbonization timelines across major shipping corridors globally. Continued vessel retrofit demand should sustain this segment's above-average growth pace well through the remainder of the forecast period considerably. This configuration is increasingly favored across critical accounts.
CAGR 16.0%
Full segment breakdown across 7 segments available in the complete report.

Regional Architecture and Country Demand Map

Regional demand concentrates heavily around North America's established industrial gas and aerospace base, while Japan and Australia expand liquefaction capacity under national hydrogen strategy export commitments. South Asia and Pacific follows closely as Australian export infrastructure investment accelerates ahead of other emerging hydrogen economies worldwide.

North America

The United States anchors the largest single regional share, driven by established industrial gas infrastructure from Air Products and Linde combined with substantial NASA and commercial aerospace liquid hydrogen demand across multiple launch facilities. This concentration justifies a share above the typical regional band, since the country alone represents the world's largest single liquid hydrogen production and consumption base by installed capacity. Canadian demand remains comparatively modest, tied to smaller-scale industrial applications rather than dedicated transport fueling infrastructure. Continued heavy-duty vehicle corridor buildout through the forecast period should sustain above-average regional growth relative to more nascent international markets elsewhere. South Korean shipbuilders are also positioning to supply liquid hydrogen carrier vessels alongside terminal infrastructure investments.
Share: 34% | CAGR: 12.5% (2026 to 2036)

East Asia

Japan's Basic Hydrogen Strategy anchors substantial regional demand, driven by binding import commitments and domestic liquefaction capacity expansion tied to its broader hydrogen society transition ambitions. China's expanding heavy-duty vehicle fueling infrastructure contributes meaningful secondary demand as domestic manufacturers scale commercial-grade liquefaction capability. South Korea follows with smaller but growing demand tied to its own national hydrogen roadmap commitments. Continued Japanese import terminal investment through the forecast period should sustain above-average regional growth relative to more mature Western markets. South Korean shipbuilders are also positioning to supply liquid hydrogen carrier vessels alongside expanding regional terminal capacity. Chinese domestic liquefaction manufacturers are scaling production capacity to meet this accelerating heavy-duty vehicle demand nationwide.
Share: 26% | CAGR: 14.0% (2026 to 2036)
Regional intelligence for 5 additional markets available in the complete report: Western Europe, South Asia and Pacific, Latin America, Middle East and Africa, Eastern Europe. Contact sales@marketmindsadvisory.com.
liquid-hydrogen-market-country-cagr-analysis-1788256761173

Where Suppliers Can Capture More Value

Beyond initial liquefaction capacity sales, liquid hydrogen suppliers can capture additional value through service contracts, technology licensing, and integrated terminal engineering roles that extend well beyond a single capital transaction. Suppliers capturing these adjacent revenue streams early build deeper, stickier customer relationships than those competing purely on initial unit price. Contract structures shape competitive positioning as much as underlying technology.

Bundle Multi-Year Terminal Maintenance Service Contracts

Suppliers offering bundled maintenance and performance guarantee contracts alongside initial liquefaction capacity sales capture recurring revenue across the terminal's operating life rather than a single transaction. These contracts typically add 15 to 20 percent to total contract value over a ten-year period while deepening customer relationships through renewal cycles. Terminal operators increasingly favor suppliers offering this bundled structure since it transfers performance risk away from the buyer, a meaningful commercial advantage in negotiations against suppliers offering equipment-only contracts without service commitments attached. Early adopters of this model report meaningfully higher customer retention across contract renewal cycles.
Market Impact: Adds 15 to 20 percent total contract value

License Liquefaction Technology to Regional Developers

Specialist liquefaction technology developers can license proprietary process designs to regional engineering firms rather than building manufacturing capacity in every target market directly. This approach captures royalty revenue while accelerating market entry in regions like South Asia and Pacific where local content requirements favor domestic assembly. Licensing arrangements typically generate 8 to 12 percent of contract revenue as ongoing royalty income, a meaningfully higher margin stream than one-time technology transfer fees, while preserving the developer's core intellectual property position across all licensed territories globally. This model also reduces the developer's capital exposure to building fabrication capacity in every target market.
Market Impact: Generates an estimated 8 to 12 percent revenue

Offer Integrated Terminal Engineering Service Packages

Suppliers expanding into integrated engineering, procurement, and construction services for full terminal projects capture a substantially larger share of total project value than liquefaction equipment sales alone. This approach suits established engineering contractors already possessing cryogenic handling expertise from legacy industrial gas plant projects. Integrated service contracts typically expand total addressable contract value by 30 to 40 percent compared to equipment-only supply, positioning suppliers as strategic partners rather than commodity vendors competing purely on unit price and delivery schedule. Contractors pursuing this path also strengthen long-term client relationships beyond the initial project delivery.
Market Impact: Expands total contract value 30 to 40 percent

Provide Remote Terminal Performance Monitoring Broadly

Suppliers offering remote sensor-based monitoring of liquefaction performance and boil-off trends can sell subscription-based analytics services alongside physical equipment, creating a recurring software-adjacent revenue stream. This monitoring data also improves preventive maintenance scheduling, reducing unplanned terminal downtime that carries substantial commercial cost for import-dependent utility customers. Early adopters of this monitoring service report 5 to 8 percent incremental annual revenue per installed unit, a meaningfully profitable addition given the largely fixed cost of the underlying sensor and analytics infrastructure across the installed base. Utilities value this predictability given the high commercial cost of unplanned terminal downtime.
Market Impact: Adds 5 to 8 percent recurring monitoring revenue

Who Controls the Margin Pool

Concentration in this market sits at 58 percent among the top five suppliers, reflecting the substantial capital barriers to entry facing new liquefaction developers given cryogenic engineering scale requirements. Air Products and Chemicals leads through established industrial gas engineering credentials extended into transport fueling applications, while the gap between it and mid-tier challengers remains meaningful given specialized cryogenic expertise. Mid-tier suppliers compete primarily on price rather than proprietary technology.
Current competitive activity centers on terminal-scale pilot demonstrations, technology licensing arrangements, and strategic partnerships between established gas majors and specialist hydrogen infrastructure developers. Several suppliers have announced joint demonstration projects with transport and shipping operators to validate continuous-operation reliability, a proof point most buyers now require. Linde's licensing arrangements with Asian and Middle Eastern firms illustrate a distribution strategy competitors without regional partner networks find difficult to replicate quickly.

Emerging pressure comes from specialized hydrogen infrastructure developers who lack legacy engineering scale but offer genuinely superior technical performance in early pilot testing. Rankings could shift meaningfully over the next three to five years if these newer entrants successfully scale manufacturing, potentially displacing established suppliers whose commercial position rests heavily on conventional liquefaction technology and long operating track records.
liquid-hydrogen-market-company-positioning-matrix-1788256761707

Competitive Moat and Risk Dimensions

AIR PRODUCTS AND CHEMICALS

Moat: Established Aerospace Engineering Legacy

Air Products and Chemicals' decades of aerospace and industrial gas engineering give it deep process expertise that transfers directly into transport fueling terminal design, catalyst formulation, and safety integration work most newer entrants lack entirely. This institutional knowledge shortens design cycles and reduces technical risk for terminal operators evaluating unproven alternative suppliers.
AIR PRODUCTS AND CHEMICALS

Risk: Slower Alternative Liquefaction Adoption

The company's commercial position rests heavily on established conventional liquefaction technology, creating institutional inertia against rapidly adopting emerging efficiency-focused alternatives gaining pilot traction elsewhere. Competitors moving faster on newer chemistries could erode this advantage within the coming several years if pilot data proves favorable. Timing matters here.
LINDE PLC

Moat: Licensing Network Across Regions

Linde's established technology licensing relationships with regional engineering firms across Asia and the Middle East provide distribution reach that smaller specialist developers cannot easily replicate on their own. This network effect compounds over time as successful regional installations generate reference projects that attract further licensee interest.
LINDE PLC

Risk: Dependent on Licensee Execution

Linde's licensing model shifts commercial execution risk onto regional partners, meaning project delays or quality issues at licensee facilities can damage the parent company's reputation despite limited direct control. A single high-profile licensee failure could meaningfully damage the broader licensing programme's credibility across multiple regional markets simultaneously.

Players Tracked

Prominent Players

Air Products and Chemicals
Linde plc
Air Liquide
Air Water Inc
Iwatani Corporation

Other Key Players

Messer Group
Chart Industries
Taiyo Nippon Sanso
Kawasaki Heavy Industries
Plug Power
Nikkiso Cryogenic Industries
Worthington Industries
Hexagon Purus
Sumitomo Corporation
Mitsubishi Heavy Industries
McDermott International
Wood Group
Cryoworks
JGC Holdings Corporation
Chiyoda Corporation

Recent Developments

MARCH 2026

Air Products Signs Heavy-Duty Fueling Contract

Air Products signed a supply contract for liquid hydrogen fueling infrastructure along a major freight corridor to a consortium of logistics operators, marking one of the first firm commercial orders in the sector rather than a pilot demonstration agreement. The contract covers delivery and a decade-long maintenance arrangement.
Signal: Confirms freight operators are moving from pilot testing to binding commercial procurement decisions now. Fast commissioning matters most.
NOVEMBER 2025

Linde Licenses Technology to Korean Firm

Linde entered a technology licensing agreement with a South Korean engineering firm to manufacture liquefaction components domestically, reducing import costs and shortening delivery timelines for terminal projects across the peninsula. The agreement grants exclusive regional manufacturing rights over an initial ten-year term. Deliveries are scheduled to begin in 2027.
Signal: Shows established suppliers expanding regional manufacturing footprint through licensing rather than direct capital investment. Regional demand is scaling quickly.
JULY 2025

Iwatani Completes Marine Bunkering Pilot

Iwatani Corporation completed a twelve-month bunkering trial at a Japanese port test site, reporting delivery and boil-off performance results comparable to established compressed gas alternatives under equivalent operating conditions throughout the testing period. Independent verification is expected to follow within the next several months from a third-party engineering assessor.
Signal: Suggests marine bunkering infrastructure is approaching commercial readiness faster than incumbents anticipated previously. Costs may fall further industry-wide.

Electricity and Feedstock Cost Exposure

Electricity for cryogenic cooling represents an estimated 45 percent of production cost of goods sold for liquefaction facilities, with power sourced predominantly from grid electricity in most markets, though several developers are pursuing dedicated renewable generation to reduce cost and carbon intensity. Renewable power supply carries higher upfront capital cost but meaningfully lower marginal electricity cost over the facility's multi-decade operating life once installed.
Electricity prices spiked sharply during 2022 following supply disruption concerns tied to natural gas market volatility, a volatility event documented in the IEA Electricity Market Report, which pushed liquefaction costs higher for suppliers with fixed-price contracts already signed before the price movement occurred across the industry. Suppliers with flexible-price power arrangements absorbed the volatility more effectively than those locked into long-term fixed contracts negotiated before the disruption began, illustrating the commercial value of adjustable pricing mechanisms.

Suppliers reliant on grid electricity face a genuine cost disadvantage against competitors developing dedicated renewable power supply that eliminates exposure to wholesale market volatility. This disadvantage is most acute for suppliers in import-dependent regions lacking long-term power agreements. Suppliers with dedicated renewable generation maintain meaningfully better margin stability than smaller developers dependent on spot market purchases.
liquid-hydrogen-market-cost-volatility-analysis-1788256761901

Secure Dedicated Renewable Power Agreements

Suppliers are pursuing long-term power purchase agreements with dedicated solar and wind generation facilities, including behind-the-meter installations at terminal sites, to reduce grid electricity dependence and improve cost predictability across multi-year liquefaction contracts. This diversification has already reduced average electricity cost exposure by roughly one-third among leading suppliers pursuing the approach. Progress continues broadly.

Accelerate Liquefaction Efficiency Improvements

Several suppliers are increasing internal research investment in advanced liquefaction cycle technology specifically to reduce electricity consumption per unit produced, even while continuing to operate conventional systems as the proven commercial default for near-term terminal contracts. Several developers expect commercial-scale efficiency improvements within three to five years, a timeline that could meaningfully reshape long-term cost structures industry-wide.

Portfolio Architecture for Margin Defence

The liquid hydrogen market organizes into three commercial tiers with meaningfully different margin economics. Volume-commodity industrial merchant supply competes primarily on price and delivery reliability, generating moderate margins given established production processes. Premium certified transport fueling supply commands higher margins by offering verified reliability performance terminal operators require. Manufacturers still selling mostly into the volume tier face gradual margin pressure as buyers grow more sophisticated.
Sustainability and next-generation formats, particularly renewable-powered liquefaction and marine bunkering supply, represent the smallest but fastest-growing tier, carrying the highest margins given limited current competition and genuine engineering differentiation. Suppliers face a persistent tension between defending volume-tier revenue, still the largest absolute dollar pool today, and investing in premium capability where growth concentrates most heavily. Manufacturers hedging across tiers weather transitions more smoothly than single-tier specialists.

High-value pools increasingly concentrate around certified transport fueling supply and bundled maintenance contracts rather than standalone merchant sales alone across most major terminal operator accounts. Suppliers positioned only in the volume-commodity tier face gradual margin erosion as certified competitors capture disproportionate share of new procurement specifications, reinforcing the strategic case for premium tier investment ahead. This shift accelerates as buyers professionalize procurement and demand independently audited performance records.

Standard industrial merchant supply competes primarily on price and delivery reliability across established demand, generating the thinnest margins in the category given intense price competition among numerous regional suppliers. These systems remain the industry's proven commercial default despite emerging alternative technology pressure.
Gross Margin

Certified transport fueling and aerospace-grade supply with verified reliability performance command meaningfully higher margins, reflecting buyer willingness to pay for demonstrated reliability across critical applications worldwide. Terminal operators view this certification as a genuine risk-reduction investment rather than discretionary spending.
Gross Margin

Renewable-powered liquefaction and marine bunkering supply carry the highest margins given limited competition, genuine engineering differentiation, and rising regulatory pressure favoring decarbonized supply chains across major markets globally today. Early commercial success here could meaningfully reshape long-term competitive positioning across the category.
Gross Margin
liquid-hydrogen-market-portfolio-architecture-1788256762409

High-value Sub-segments and Strategic Watch-out

Heavy-Duty Transport Fueling

This segment combines the highest current margins with the fastest growth trajectory, making it the clearest priority for supplier investment across engineering, testing, and dedicated field service capability expansion going forward. Suppliers moving early capture disproportionate reference project value across every major corridor. Source: MMA Estimate, July 2026.

Marine Bunkering

Strong margins paired with rapid growth make this segment a reliable secondary investment priority, particularly for suppliers building bunkering infrastructure to capture share from conventional marine fuel competitors. Regional demand is scaling quickly across multiple port jurisdictions currently pursuing retrofit programmes. Source: MMA Estimate, July 2026.

Aerospace and Rocket Propulsion

This mature segment anchors current category revenue despite slower growth, and suppliers must defend this base carefully while shifting incremental investment toward faster-growing transport categories. This remains a reliable revenue anchor even as transport applications capture growing industry attention overall. Source: MMA Estimate, July 2026.

Merchant Industrial Supply

This segment faces meaningful displacement risk as suppliers increasingly favor transport-focused capacity over general industrial supply, making it a genuine strategic watch-out for suppliers still exposed here. Few new merchant-only orders are expected going forward across most major markets tracked. Source: MMA Estimate, July 2026.

Terminal Contracts Anchor Recurring Revenue

Liquid hydrogen supply increasingly bundles offtake and terminal maintenance contracts, converting a single production commitment into a recurring commercial relationship spanning the facility's operating life. Cryogenic equipment requires periodic inspection and eventual component replacement given gradual wear under continuous low-temperature operation, creating predictable aftermarket revenue for suppliers who win the initial contract. Suppliers structuring these contracts well retain terminal relationships across cycles rather than competing on price.
Adoption depth varies substantially by end-use vertical. Aerospace and government customers show the deepest commitment given established procurement relationships and technical qualification requirements, while transport fueling operators remain more cautious, weighing capital cost against uncertain long-term hydrogen vehicle adoption rates. Marine bunkering customers sit between, adopting steadily as vessel retrofit programmes accelerate. This pattern means suppliers must tailor commercial terms across each buyer category.

Buyer profiles are shifting as transport and logistics procurement teams staffed by hydrogen specialists replace generalist industrial gas buyers unfamiliar with cryogenic supply chain tradeoffs. Younger procurement teams increasingly demand third-party reliability data and delivery guarantees rather than relying on supplier reputation alone, reshaping how suppliers must present technical evidence during contract negotiations. Suppliers unable to produce this evidence risk losing contracts to rivals with track records.
liquid-hydrogen-market-end-use-penetration-index-1788256762890

Strategic Priorities For Liquid Hydrogen Suppliers

These are among the four positions where our research anticipates prominent divergence between winners and laggards over the coming forecast period. Each is grounded in the demand model, the regulatory perimeter, and the announced capacity pipeline.
01 / TRANSPORT FUELING INVESTMENT

Prioritize corridor buildout over merchant expansion

Heavy-duty transport fueling carries the fastest segment growth in the category, expanding at more than one-third faster than the overall market average through 2036 as freight corridors scale nationally. Suppliers still allocating the bulk of engineering budgets toward conventional merchant supply risk ceding the highest-margin, fastest-growing tier to competitors already scaling terminal engineering and fueling infrastructure capability. Redirecting capital toward transport corridor buildout now positions a supplier to capture premium fueling contracts before rivals lock in freight operator relationships for the next several years.
02 / REGIONAL MANUFACTURING FOOTPRINT

Expand North American capacity while defending Asian share

North America accounts for the largest single share of global demand, driven by established industrial gas infrastructure and aerospace liquid hydrogen consumption across multiple launch facilities. East Asia remains a meaningfully sized and faster-growing market as national hydrogen strategies tighten, so suppliers cannot treat it as secondary. A balanced footprint spanning both regions, rather than concentration in either alone, reduces exposure to any single country's regulatory or trade policy shift over the coming decade, particularly as national hydrogen strategies continue evolving.
03 / SUPPLIER DIVERSIFICATION STRATEGY

Secure electricity supply beyond single-source grid dependence

Electricity for cryogenic cooling represents a substantial and growing share of liquefaction production cost, and recent volatility has already exposed suppliers overly dependent on grid electricity without dedicated renewable power arrangements in place. Diversifying toward renewable power purchase agreements and long-term supply contracts reduces margin exposure to any single disruption event considerably going forward. Suppliers that move early on power diversification will protect gross margins more effectively than rivals scrambling to secure alternative supply after the next volatility event arrives unexpectedly.
04 / AFTERMARKET SERVICE EXPANSION

Build recurring maintenance and monitoring revenue streams now

Liquefaction terminals genuinely create a lasting and valuable opportunity for recurring warranty and performance monitoring service contracts that traditional equipment-only sales never supported at meaningful commercial scale. These recurring revenue streams carry materially higher margins than one-time equipment sales and deepen customer relationships across multi-year renewal cycles considerably. Suppliers building these service capabilities early now, rather than treating terminals as a pure hardware sale, will capture a disproportionate share of lifetime customer value across the entire installed terminal base ahead.

Engagement Snapshot From the Field

A live engagement with an industry participant carrying material or product regulatory and market exposure ahead of a defining policy shift, showing how our research translates into a defensible multi-year portfolio strategy.
MARKET MINDS ADVISORY · CLIENT ENGAGEMENT SUMMARY
Liquid Hydrogen Producer Strategic Portfolio Review and Transition Roadmap 2026·Investment Scenario on Liquid Hydrogen Exposure Evaluation 2025-26
CLIENT PROFILE
The client is a major freight logistics operator planning a heavy-duty hydrogen truck fleet transition requiring dedicated fueling infrastructure across several regional freight corridors, representing a multi-year infrastructure investment (client-reported, unverified by MMA). The operator had evaluated compressed gas fueling for over a year but faced growing pressure to consider liquid hydrogen alternatives given competing operators' recent infrastructure announcements.
STRATEGIC CHALLENGE
Leadership needed to decide between compressed gaseous hydrogen fueling infrastructure, liquid hydrogen fueling stations, or a hybrid approach before finalizing corridor engineering specifications and supplier procurement timelines. Committing to the wrong technology risked either overpaying for unnecessary capability or missing efficiency gains rivals would capture, with corridor commissioning delays estimated at twelve months if the decision required revisiting (client-reported, unverified by MMA).
MMA APPROACH
MMA conducted a structured technology assessment combining primary interviews with liquid hydrogen suppliers, competitive benchmarking of announced fueling corridor projects globally, and total cost of ownership modeling across both fueling technology pathways under consideration. The engagement drew on MMA's expert interview programme and primary research dataset to quantify realistic performance and cost trajectories for each option.
KEY FINDINGS
  1. Liquid hydrogen fueling offered meaningfully faster refueling times and greater vehicle range than compressed gaseous alternatives across most long-haul freight routes evaluated.
  2. Compressed gas infrastructure carried lower upfront capital cost but higher per-mile fueling cost over the vehicle fleet's operating life (client-reported, unverified by MMA).
  3. Competing logistics operators that had already committed to liquid hydrogen corridors were locking in supplier capacity, narrowing the client's window for favorable contract terms.
  4. A phased corridor approach, starting with liquid hydrogen on highest-volume routes while retaining compressed gas elsewhere, offered the best risk-adjusted outcome overall.
CLIENT PROFILE
The client is a major freight logistics operator planning a heavy-duty hydrogen truck fleet transition requiring dedicated fueling infrastructure across several regional freight corridors, representing a multi-year infrastructure investment (client-reported, unverified by MMA). The operator had evaluated compressed gas fueling for over a year but faced growing pressure to consider liquid hydrogen alternatives given competing operators' recent infrastructure announcements.
STRATEGIC CHALLENGE
Leadership needed to decide between compressed gaseous hydrogen fueling infrastructure, liquid hydrogen fueling stations, or a hybrid approach before finalizing corridor engineering specifications and supplier procurement timelines. Committing to the wrong technology risked either overpaying for unnecessary capability or missing efficiency gains rivals would capture, with corridor commissioning delays estimated at twelve months if the decision required revisiting (client-reported, unverified by MMA).
MMA APPROACH
MMA conducted a structured technology assessment combining primary interviews with liquid hydrogen suppliers, competitive benchmarking of announced fueling corridor projects globally, and total cost of ownership modeling across both fueling technology pathways under consideration. The engagement drew on MMA's expert interview programme and primary research dataset to quantify realistic performance and cost trajectories for each option.
KEY FINDINGS
  1. Liquid hydrogen fueling offered meaningfully faster refueling times and greater vehicle range than compressed gaseous alternatives across most long-haul freight routes evaluated.
  2. Compressed gas infrastructure carried lower upfront capital cost but higher per-mile fueling cost over the vehicle fleet's operating life (client-reported, unverified by MMA).
  3. Competing logistics operators that had already committed to liquid hydrogen corridors were locking in supplier capacity, narrowing the client's window for favorable contract terms.
  4. A phased corridor approach, starting with liquid hydrogen on highest-volume routes while retaining compressed gas elsewhere, offered the best risk-adjusted outcome overall.
RECOMMENDED STRATEGY
Phase 1: Phase one: procure liquid hydrogen fueling infrastructure for the highest-volume corridor, securing supplier terms before competing operators exhaust available capacity. Phase 2: Phase two: commission a parallel compressed gas pilot on secondary routes to build internal technical evaluation capability over eighteen months. Phase 3: Phase three: incorporate pilot performance data into the second corridor phase procurement decision, potentially shifting technology mix toward liquid hydrogen.
OUTCOME
The client secured favorable liquid hydrogen supply terms ahead of two competing operators and began corridor construction on schedule, while its parallel pilot programme is generating performance data expected to inform the second corridor phase decision (client-reported, unverified by MMA). The phased approach is now viewed internally as a template for future corridor decisions.

Frequently Asked Questions

Foundational context covering the market sizes, CAGR, scope, country, region and competition that inform every finding below. This section is provided to cover basics and most often pre-purchase conversations, answered from the MMA Primary Research Dataset.

What is the current size of the Liquid Hydrogen Market?

The liquid hydrogen market reached an estimated 3.2 billion dollars in 2025. Growth is driven by heavy-duty transport fueling and marine bunkering infrastructure buildout worldwide.

How large will the Liquid Hydrogen Market be by 2036?

MMA projects the market will reach approximately 12.3 billion dollars by 2036. This reflects rapid scaling of transport fueling terminals across major hydrogen-importing economies worldwide.

What is the CAGR for the Liquid Hydrogen Market 2026 to 2036?

The base case compound annual growth rate is 13.0 percent across the forecast period. Bull and bear scenarios range from 14.4 percent to 11.6 percent depending on corridor buildout pace.

Which segment is growing fastest?

Heavy-duty transport fueling is the fastest-growing segment, expanding at 18.0 percent annually. That is roughly 1.4 times the overall market growth rate through the forecast period.

Who are the major companies in the Liquid Hydrogen Market?

Leading companies include Air Products and Chemicals, Linde plc, Air Liquide, Air Water Inc, and Iwatani Corporation. Together these five hold an estimated 58 percent share.

Which country is growing fastest?

Australia leads regional growth at an estimated 15.5 percent annually through 2036. Expansion is driven by substantial green hydrogen export terminal investment currently underway nationwide.

Report Segmentation Architecture

The full report scope spans multiple orthogonal segmentation dimensions, with cross-tabulated demand data provided for each dimension pair. Coverage extends further to regional breakdowns, trend trajectories, and the competitive detail needed to support segment-level decision-making.
  • Aerospace and Rocket Propulsion
  • Heavy-Duty Transport Fueling
  • Industrial Processing
  • Energy Storage and Grid Balancing
  • Merchant Industrial Supply
  • Marine Bunkering
  • Aerospace and Defense
  • Freight and Logistics Transport
  • Marine Shipping
  • Semiconductor and Metals Processing
  • Grid and Utility Storage
  • Long-Term Offtake Agreements
  • Merchant Spot Market Supply
  • Integrated Terminal Engineering Services
  • Performance Monitoring Subscriptions

By Region

  • North America
  • East Asia
  • Western Europe
  • South Asia and Pacific
  • Latin America
  • Middle East and Africa
  • Eastern Europe

Scope, Methodology, and Coverage

Every figure in this report is reproducible from documented input assumptions. The scope below maps the historical period, the forecast horizon, the segmentation dimensions, and the countries covered, alongside the underlying primary and qualitative methodology.
Historical Period
2020 to 2025
Forecast Period
2026 to 2036
Base Year
2025 (USD billions; MMA Primary Research Dataset, September 2026)
Market Definition
This report covers liquid hydrogen produced through cryogenic liquefaction for aerospace, transport fueling, industrial processing, and energy storage applications. It excludes gaseous compressed hydrogen distribution, hydrogen produced for on-site ammonia synthesis without liquefaction, and liquid organic hydrogen carrier technologies.
Quantitative Units
USD billions
Segmentation Dimensions
Regions Covered
North America, East Asia, Western Europe, South Asia and Pacific, Latin America, Middle East and Africa, Eastern Europe
Countries Covered
Key Companies Profiled
Air Products and Chemicals, Linde plc, Air Liquide, Air Water Inc, Iwatani Corporation, Messer Group, Chart Industries, Taiyo Nippon Sanso, Kawasaki Heavy Industries, Plug Power, Nikkiso Cryogenic Industries, Worthington Industries, Hexagon Purus, Sumitomo Corporation, Mitsubishi Heavy Industries, McDermott International, Wood Group, Cryoworks, JGC Holdings Corporation, Chiyoda Corporation
Quantitative Methodology
Primary survey, n=3,800 respondents, Q4 2025, six countries; demand-side model with trade association cross-validation
Qualitative Methodology
47 expert interviews, Q4 2025; applied to validate demand model assumptions, identify emerging dynamics, and assess competitive positioning
Report Format
PDF and XLSX data workbook (Word format preview document)
Publisher
Market Minds Advisory
Report Code
MMA-2026-ENE-267
Published
September 2026
Contact
sales@marketmindsadvisory.com | www.marketmindsadvisory.com

Purchase the full Liquid Hydrogen Market Report (2026 to 2036).

This report provides a comprehensive analysis of the global liquid hydrogen market, covering market sizing, segmentation, regional dynamics, and competitive positioning through 2036. It examines the demand shift from aerospace toward heavy-duty transport fueling and marine bunkering applications. The analysis quantifies regional demand concentration across seven world regions and profiles the twenty leading suppliers shaping category development. It draws on primary survey data spanning 3,800 respondents and expert interviews with 47 industry specialists. Company disclosures round out the evidence base supporting strategic decisions for suppliers, terminal operators, and investors.
Ten-year global revenue and volume forecasts
Seven-region demand concentration and growth analysis
Twenty-company competitive benchmarking and profile analysis
Segment-level growth rate and margin data
Input cost and supply risk assessment
Strategic verdict and investment priority guidance

Built For The People Who Decide

From boardroom strategy to bench-side execution, this report is read cover-to-cover by leaders shaping the next decade of their industry, turning demand scenarios, market dynamics and valuation benchmarks into decisions.
CXOs/ Presidents/ VPs/ Managers
M&A and Corporate Development
Strategy Teams and R&D Heads
Procurement and Product Directors
Regulatory and Compliance Leaders
Investor Relations and Equity Analysts