Market Minds Advisory
Liquefied Petroleum Gas Storage Market

Liquefied Petroleum Gas Storage Market: Liquefied Petroleum Gas Storage Market: Trade Flows Redraw Terminal Investment

Shifting LPG trade flows between exporting and importing regions are redrawing terminal investment priorities, reshaping which storage operators can serve cooking fuel and industrial feedstock demand profitably across every major market.

Lead Analyst

Published

October 2026

Make Smarter Decisions with Customized Research Insights

Request a free sample report and evaluate market opportunities, growth trends, and competitive dynamics relevant to your business needs.

2025 MARKET VALUE$8.5BMarket Size 2025
2036 FORECAST VALUE$13.4BBase Case , 2026 to 2036
CAGR 2026 TO 20364.2 %Bull 5.3% / Bear 3.0%
INCREMENTAL OPPORTUNITY$4.5BNet 10- year value creation
EXPANSION MULTIPLE1.51x2036 value over 2026 base
Strategic Levers
M&A Pipeline
Regional Outlook
Country Rankings
Competitive Intelligence
Segmental Deep-dive
Call-Us : 91 93563 13602

Executive Snapshot and Market Trajectory.

LPG trade flows are shifting fast as shale-driven export capacity in North America competes directly against Gulf producers for import terminal contracts across Asia, and storage operators on the wrong side of that competition are losing throughput volume this cycle. Operators with long-term supply contracts are weathering this more comfortably.
Household cooking fuel demand in South Asia remains the single largest commercial force shaping storage investment, pulled forward by subsidy programs that keep connecting new rural households every year. Middle Eastern producers hold export terminal scale while East Asian importers build parallel receiving capacity to secure supply security against price volatility. Safety regulation on aging storage infrastructure is adding a second meaningful capital pressure across several major import markets simultaneously.
Competition spans a genuinely fragmented field where national oil companies and multinational distributors compete on storage capacity and logistics reach rather than brand alone. Expanding rural distribution programs and tightening safety regulation on aging storage infrastructure are pulling more capital toward newer, larger terminal builds every year. Operators slow to modernize aging tank fleets risk losing throughput contracts to newer, larger terminal competitors permanently. now.
Market Definition
This report covers bulk and terminal storage infrastructure for liquefied petroleum gas, including import-export terminal tanks, cylinder filling plant storage, and industrial and autogas bulk storage. It excludes LPG production, transport vessels, and residential cylinder retail distribution activity itself.
Base Year Value
$8.5B in 2025 (MMA Primary Research Dataset, October 2026)
Forecast Period
2026 to 2036, eleven discrete annual values
CAGR
4.2% base case. Bull 5.3%. Bear 3.0%.
Fastest Growth Segment
Terminal and Import-Export Storage: 5.9% CAGR
Fastest Growth Country
India: 6.5% CAGR
Fastest Growth Region
South Asia and Pacific: 6.2% CAGR
Largest Region
North America: 26% of 2025 global value
Market Leaders
Royal Vopak, SHV Energy, UGI Corporation, Chart Industries, McDermott International. Source: MMA Primary Research Dataset, July 2026.
Primary Survey
n=3,800 procurement and R&D decision-makers, Q4 2025, six countries
Methodology
Demand-side build-up, cross-validated against public data, 47 expert interviews

Liquefied Petroleum Gas Storage Market Forecast Scenarios

liquefied-petroleum-gas-storage-market-size-forecast-scenario-1790915965745
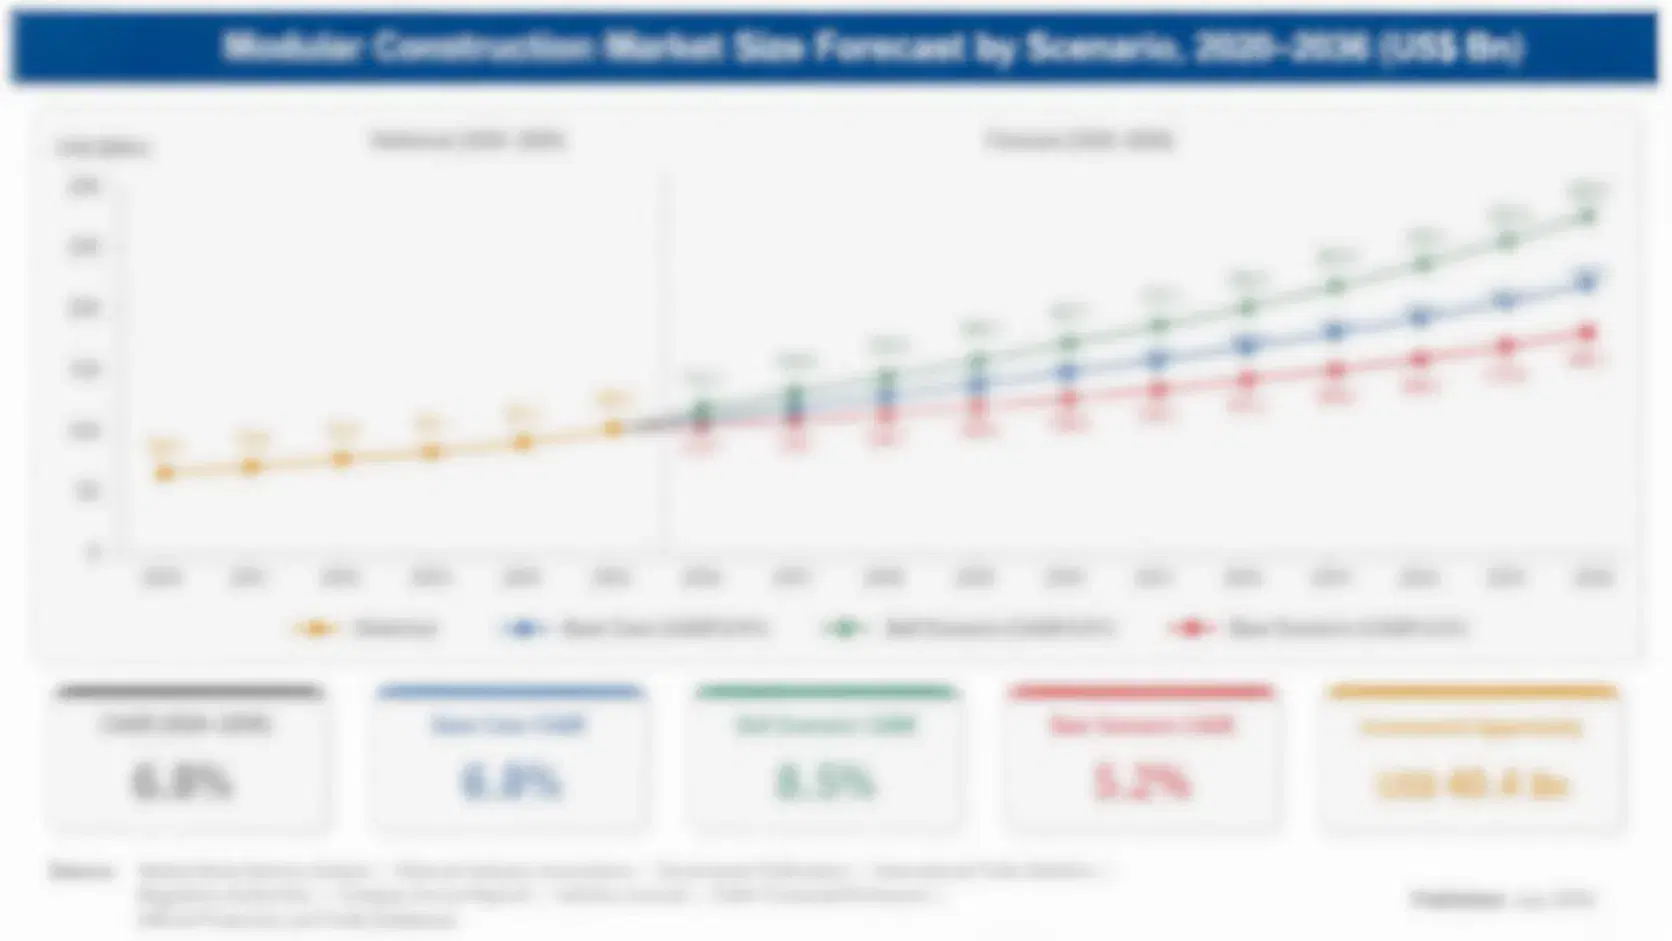
Between 2020 and 2025 the LPG storage market grew at a 3.7 percent annual rate, propelled by steady household cooking fuel distribution expansion across South Asia and a first wave of North American export terminal construction tied to shale production growth. Pandemic-era demand volatility briefly disrupted terminal utilization in 2020. Operators that had already secured long-term throughput contracts weathered that disruption more comfortably than spot-market dependent terminals.
The base case assumes 4.2 percent annual growth through 2036, built on three mechanisms: continued subsidy-driven household connection growth across India and Indonesia, expanding North American export terminal capacity capturing share from traditional Middle Eastern suppliers, and rising industrial feedstock demand as petrochemical producers diversify their LPG sourcing base. Autogas fueling infrastructure adds a smaller fourth tailwind in select markets pursuing cleaner transport fuel alternatives. This fourth driver remains smaller than the other three but is growing steadily.
A bull case near 5.3 percent hinges on faster-than-expected North American export capacity additions capturing additional Asian import contracts. The bear risk, closer to 3.0 percent, is slower household connection growth if subsidy program funding tightens amid broader fiscal pressure across major consuming governments. Neither scenario assumes a reversal of existing household subsidy commitments. now.

Export Terminal Buildout Redraws Global Trade Flows

North American export terminal capacity has expanded substantially over the past five years, a direct result of sustained shale gas production growth that keeps domestic propane and butane supply well ahead of local demand. This surplus is reshaping which import terminals in Asia and Latin America secure long-term supply contracts. Export terminal operators increasingly compete on contract flexibility as much as raw storage capacity itself.
MARKET CONCENTRATIONCR5 38%Top five operators together hold this combined capacity share
AVERAGE SELLING PRICE$420/tonBlended storage throughput fee across terminal and bulk grades
TOP PRODUCING COUNTRYUnited States 24%Share of global export terminal capacity from domestic sites
CAPACITY UTILIZATION74%Average rate across major terminal and bulk storage facilities
TRADE INTENSITY52%Share of throughput volume crossing a border before final use
FEEDSTOCK COST SHARE46%Portion of terminal build cost from steel and civil works
Storage infrastructure remains concentrated around major coastal terminal hubs in the United States, Middle East and East Asia, where deepwater port access and pipeline connectivity cluster around established export and import facilities. Smaller inland bulk storage sites increasingly depend on these coastal hubs for supply reliability. Freight costs matter considerably for landlocked distribution markets sourcing from distant coastal terminals.
Household distribution networks across South Asia continue expanding storage and cylinder filling plant capacity to serve new subsidy program connections, since each newly connected rural household requires dedicated distribution infrastructure reaching back to regional storage depots. This buildout represents a meaningfully different capital profile than terminal-scale export infrastructure. Capital intensity per connection has fallen as distribution networks mature and gain operational experience.
"Terminal capacity is becoming a geopolitical asset as much as a commercial one, and operators that read trade flow shifts correctly two years ago are capturing contracts that caught slower competitors completely off guard."
Senior Analyst, Energy Infrastructure Practice · MMA Energy Practice · October 2026

Market Trends

North American Export Terminal Capacity Reshapes Global Supply

Sustained shale gas production growth has pushed North American propane and butane output well ahead of domestic demand, driving a wave of export terminal construction along the Gulf Coast that is reshaping which import markets secure favorable supply contracts. Export terminal capacity grew roughly 21 percent between 2023 and 2025 alone, capturing meaningful contract share from traditional Middle Eastern suppliers in several Asian and Latin American import markets. This shift is forcing established exporters to compete more aggressively on contract terms and delivery flexibility than they have in decades. now.
Market Impact: Grew 16 percent in 2025
Household Subsidy Programs Expand Rural Storage Infrastructure

India and Indonesia continue expanding household LPG subsidy programs that connect new rural households to cylinder distribution networks, requiring corresponding growth in regional storage depot and cylinder filling plant capacity to serve these new connections reliably. Roughly 18 million new household connections were added across both countries in 2025 alone, each requiring distribution infrastructure reaching back to dedicated storage depots. This expansion represents one of the largest coordinated infrastructure buildouts in the sector's history to date. Government officials cite this program as a central pillar of broader rural energy access policy across both countries.
Market Impact: Grew 13 percent in incentive markets

Market Opportunities and Growth Drivers

Petrochemical Feedstock Diversification Sustains Industrial Demand

Petrochemical producers are increasingly diversifying their feedstock sourcing to include LPG alongside naphtha and ethane, driven by relative pricing advantages that have persisted through recent volatility in competing feedstock markets across major production regions. Industrial storage demand tied specifically to this diversification grew roughly 16 percent in 2025, outpacing general industrial storage growth meaningfully as producers lock in longer-term supply agreements to secure this increasingly important feedstock source going forward. Storage operators serving major petrochemical hubs report strong order books extending well into the next several years. Growth here shows no sign of slowing.
Market Impact: 6 to 12 month project delays

Autogas Fueling Infrastructure Expands in Select Transport Markets

Several transport markets, particularly across Eastern Europe and parts of Asia, are expanding autogas fueling infrastructure as a lower-cost alternative to gasoline and diesel for passenger vehicle fleets, requiring dedicated bulk storage capacity at fueling station sites. Autogas-tied storage capacity additions grew roughly 13 percent in markets with active fleet conversion incentive programs, a figure that continues climbing as fuel price differentials widen further in several key consuming countries this year. Fueling station operators increasingly view bulk storage capacity as a competitive differentiator against traditional fuel retailers nearby. Momentum continues building steadily.
Market Impact: 22 percent of original cost

Market Restraints and Challenges

Steel and Construction Cost Volatility Delays Terminal Projects

Terminal construction projects depend heavily on structural steel and civil works inputs whose pricing has grown considerably more volatile following recent supply chain disruption across the broader construction materials sector globally. The root cause is concentrated steel production capacity serving many competing construction categories simultaneously, leaving terminal projects competing for allocation against larger buyers. Several planned terminal expansions were delayed by six to twelve months during 2024 cost spikes. Developers are now locking in steel pricing earlier in the project planning cycle. Smaller developers without diversified sourcing remain the most exposed to future cost-driven delivery delays.
Market Impact: Grew 21 percent since 2023

Aging Storage Infrastructure Requires Costly Safety Retrofits

Much of the installed storage base across mature markets was built decades ago and increasingly requires costly safety retrofits to meet tightening regulatory standards on tank integrity and leak detection systems. The root cause is the original design life of these facilities, which did not anticipate the extended operating timelines many now face without major capital investment. Retrofit costs now average roughly 22 percent of original construction cost at affected sites. Operators are responding by phasing retrofits across multi-year capital budgets rather than all at once. Early retrofit completions suggest meaningful safety improvement at relatively modest incremental cost.
Market Impact: 18 million new connections added
4 additional market trends, 3 additional growth drivers, and 2 additional restraints and challenges are covered in the full report. Contact sales@marketmindsadvisory.com to access the complete intelligence.

Segment CAGR and Growth Architecture

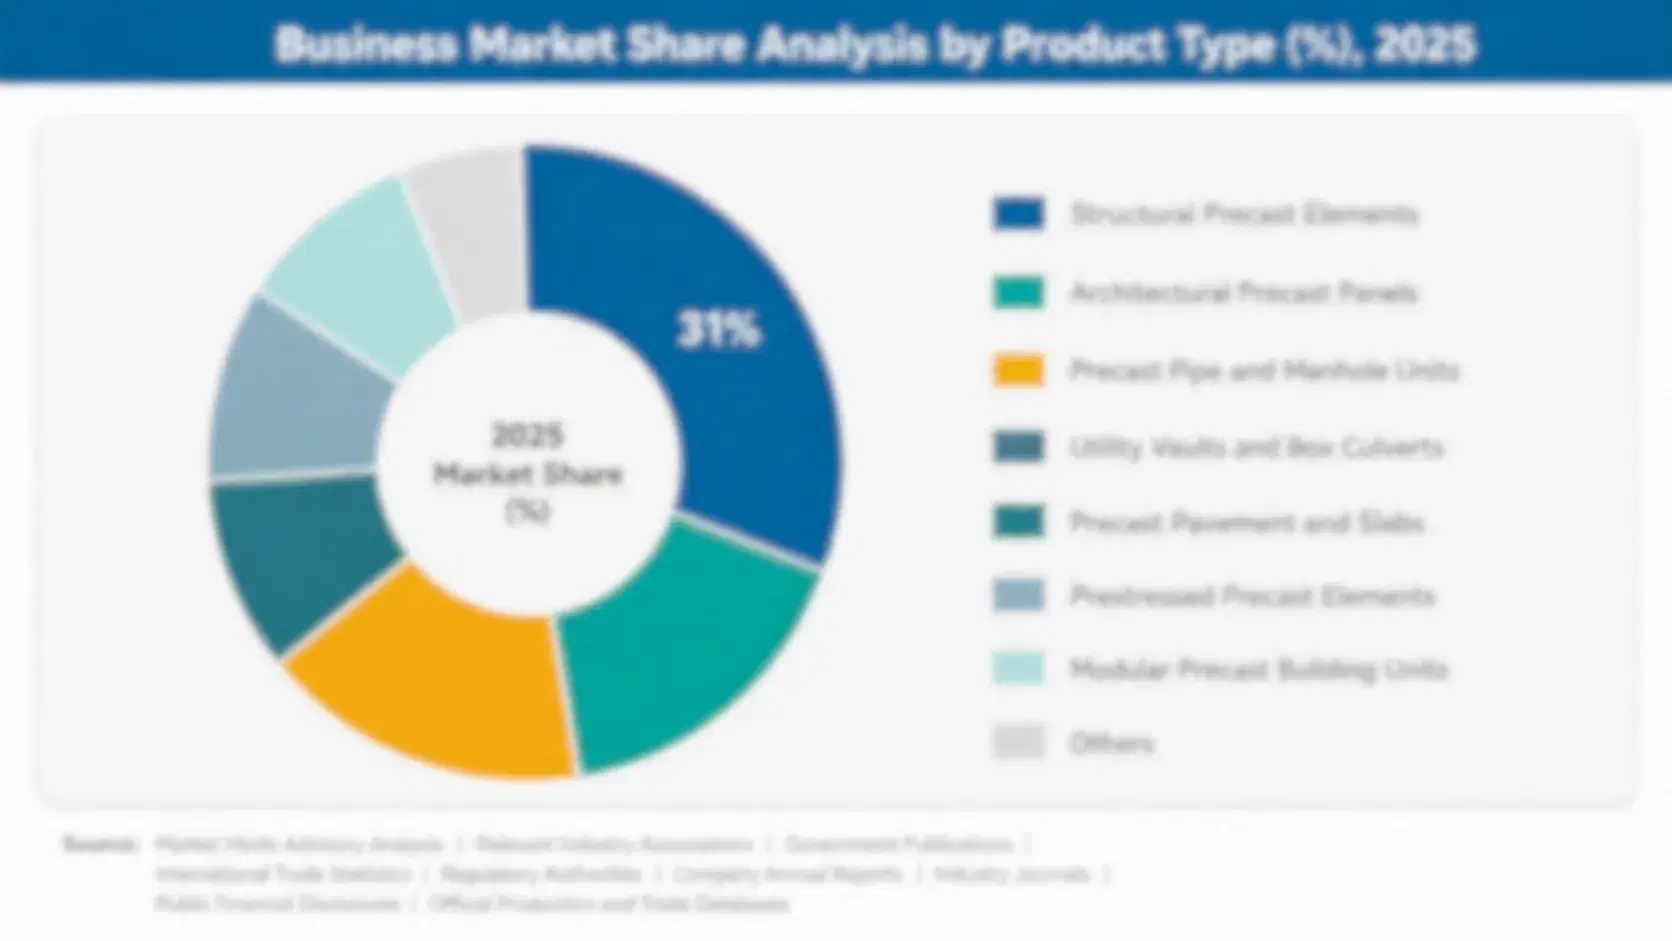
The market splits into six application segments defined by end-use function and trade position. Terminal and industrial storage segments lead near-term growth while household distribution and cylinder filling segments anchor the steady volume manufacturers depend on through the cycle. Autogas fueling, agricultural and specialty storage applications round out the remaining four segments by scale.
liquefied-petroleum-gas-storage-market-market-share-analysis-1790915966041

Terminal and Import-Export Storage

Import and export terminal storage has become the most strategically important segment in the market as shifting trade flows between North American exporters and traditional Middle Eastern suppliers reshape which coastal facilities secure long-term throughput contracts. New terminal construction concentrates along the United States Gulf Coast and major Asian import hubs, where deepwater port access and pipeline connectivity justify the substantial capital investment these projects require. Royal Vopak and several national oil companies lead supply into this segment given their established coastal terminal operating relationships. Growth here is expected to keep outpacing every other segment through the forecast window as trade flow realignment continues. Financing structures for these projects increasingly involve multi-party consortiums spreading capital risk across several partners.
CAGR 5.9%

Industrial Process and Feedstock Storage

Petrochemical producers increasingly diversifying their feedstock sourcing to include LPG alongside naphtha and ethane are driving steady demand for dedicated industrial storage capacity at or near major production facilities. These facilities typically require larger, more technically sophisticated storage infrastructure than residential distribution depots, reflecting the continuous throughput demands of industrial operations. Chart Industries and McDermott International hold strong positions here given their established industrial engineering relationships. Demand growth tracks broader petrochemical feedstock diversification trends alongside genuine LPG-specific adoption momentum across multiple production regions. Fertilizer and agrochemical producers represent a growing secondary demand pool within this segment, using LPG as a process input for several downstream chemical synthesis pathways increasingly favored by regional producers.
CAGR 5.0%
Full segment breakdown across 7 segments available in the complete report.

Regional Architecture and Country Demand Map

Regional demand follows production, trade position and household consumption together rather than any single factor alone. South Asia's household subsidy programs and the Middle East's export scale push both well beyond typical regional weighting seen in other energy infrastructure markets. North America's export buildout adds a third demand pole.

North America

Sustained shale gas production growth has pushed United States propane and butane output well ahead of domestic demand, driving a wave of Gulf Coast export terminal construction that keeps this region's revenue share at the upper end of its typical band for an energy infrastructure category. Canadian producers contribute smaller but growing export volume through Pacific coast terminals serving Asian markets directly. Domestic industrial feedstock demand adds a second steady driver, as petrochemical producers near major production hubs secure dedicated storage capacity. Export terminal operators increasingly compete on contract flexibility as much as raw capacity. Mexican demand remains tied closely to cross-border pipeline and rail supply arrangements with United States suppliers specifically.
Share: 26% | CAGR: 4.7% (2026 to 2036)

Western Europe

Germany, France and the United Kingdom anchor regional demand, though this region sits below its typical band here since European LPG consumption has declined steadily as electrification and natural gas heating displace LPG in both residential and light industrial applications across most member states. Remaining demand concentrates in rural areas without natural gas pipeline access and in autogas fueling infrastructure serving fleet conversion programs. Aging storage infrastructure across the region increasingly requires costly safety retrofits rather than new capacity additions, reflecting the market's broadly mature and contracting character. Scandinavian markets add a smaller but notable autogas fueling contribution given extensive rural fleet conversion programs there. Spain and Italy round out the region's remaining demand reasonably well.
Share: 9% | CAGR: 2.7% (2026 to 2036)
Regional intelligence for 5 additional markets available in the complete report: East Asia, South Asia and Pacific, Latin America, Middle East and Africa, Eastern Europe. Contact sales@marketmindsadvisory.com.
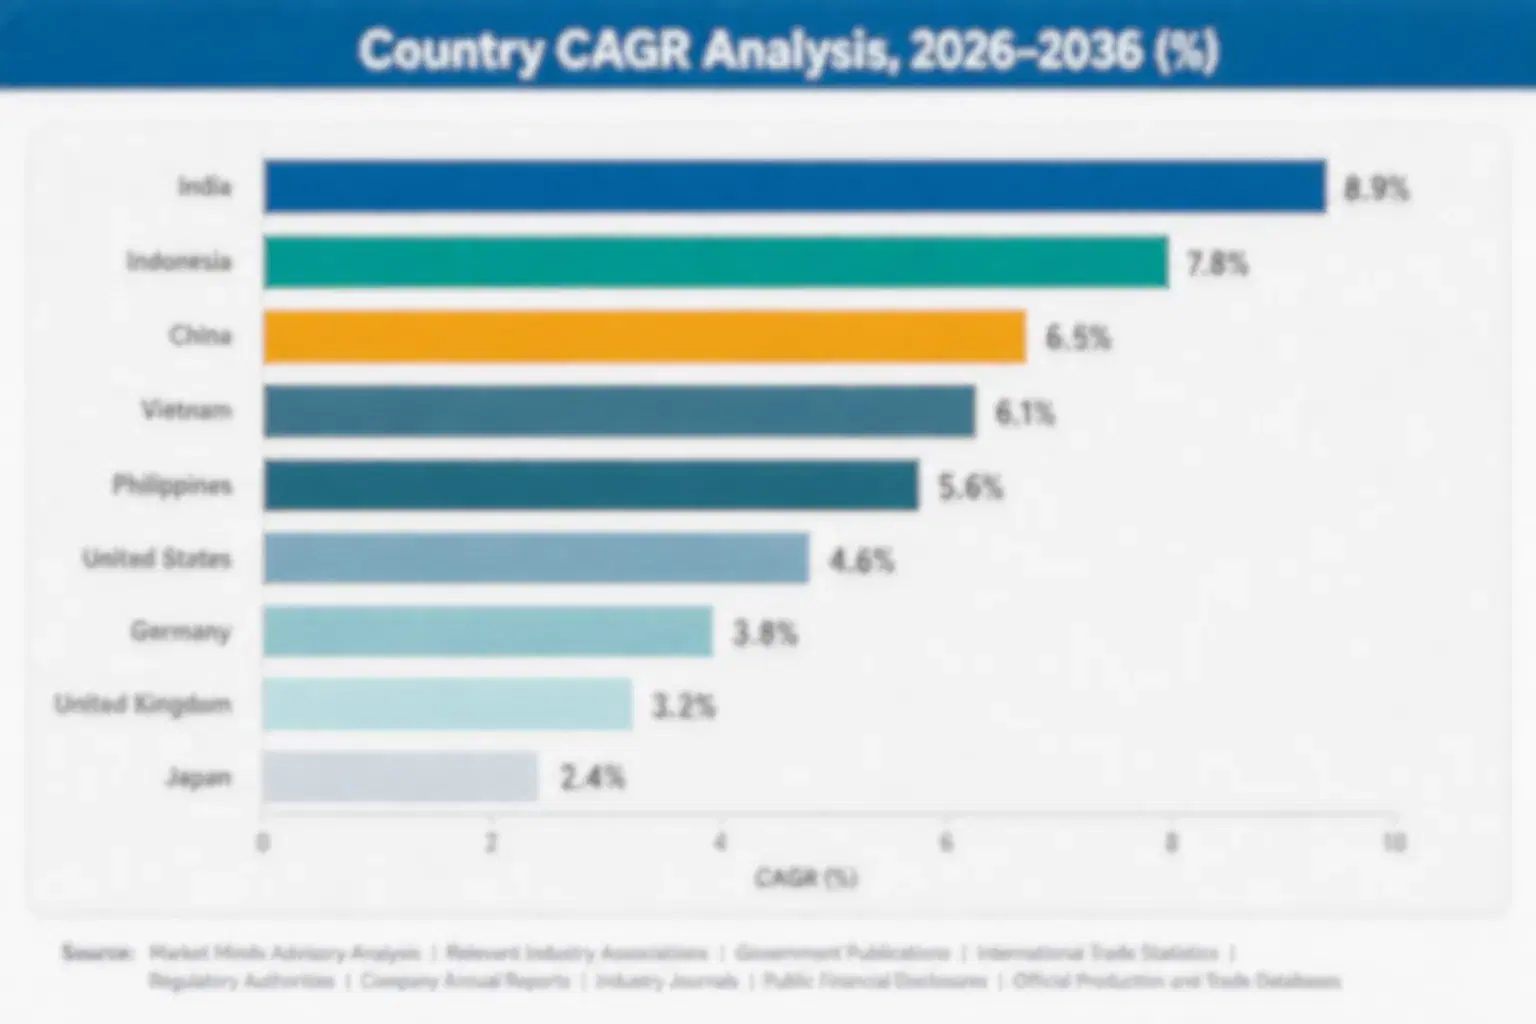
liquefied-petroleum-gas-storage-market-country-cagr-analysis-1790915966356

Capturing Value as Trade Flows Shift

Three commercial moves let operators capture more value from shifting LPG trade flows than storage throughput fees alone would deliver. Each targets a different point in the supply chain relationship, from contract flexibility to distribution infrastructure partnership programs. Operators that execute on all three simultaneously tend to outgrow peers still selling only standard storage capacity.

Flexible Short-Term Throughput Contracts for Trade Shifts

Offering flexible short-term throughput contracts alongside traditional long-term agreements lets terminal operators capture spot demand as trade flows shift between North American and Middle Eastern suppliers competing for the same import contracts. Operators offering this flexibility report capturing meaningfully more volume during trade flow realignment periods than competitors locked entirely into rigid long-term agreements. Early adopters report capturing roughly 14 percent more spot volume than peers during recent realignment. Several terminal operators are now building dedicated spot-market trading desks specifically to capture this flexibility advantage over time. Adoption continues expanding.
Market Impact: Captures roughly 14 percent more spot volume now

Distribution Infrastructure Partnership Programs for Subsidy Markets

Partnering directly with government subsidy programs to co-invest in rural distribution infrastructure positions storage operators as preferred partners for new household connections, ahead of competitors relying purely on commercial channel relationships. This partnership model frequently converts into long-term exclusive distribution agreements once the program reaches full household connection targets across a given region. Operators offering this partnership report winning roughly 20 percent more new connection volume than competitors. This co-investment model also reduces the capital burden that subsidy programs would otherwise carry entirely on their own balance sheets. Momentum remains strong.
Market Impact: Wins roughly 20 percent more connection volume now

Strategic Reserve Storage Service Agreements for Governments

Offering dedicated strategic reserve storage services to governments seeking supply security independent of commercial throughput cycles commands premium pricing over standard commercial storage contracts, since reserve requirements carry different operational and contractual obligations entirely. Several governments across East Asia already maintain these arrangements, and operators offering this service report pricing premiums of roughly 9 percent over comparable commercial storage agreements. This revenue stream also provides meaningful insulation against commercial throughput cycle volatility that affects standard storage contracts more directly. Several governments are now evaluating similar arrangements across additional strategic commodity categories beyond LPG specifically.
Market Impact: Commands roughly a 9 percent pricing premium now

Who Controls the Margin Pool

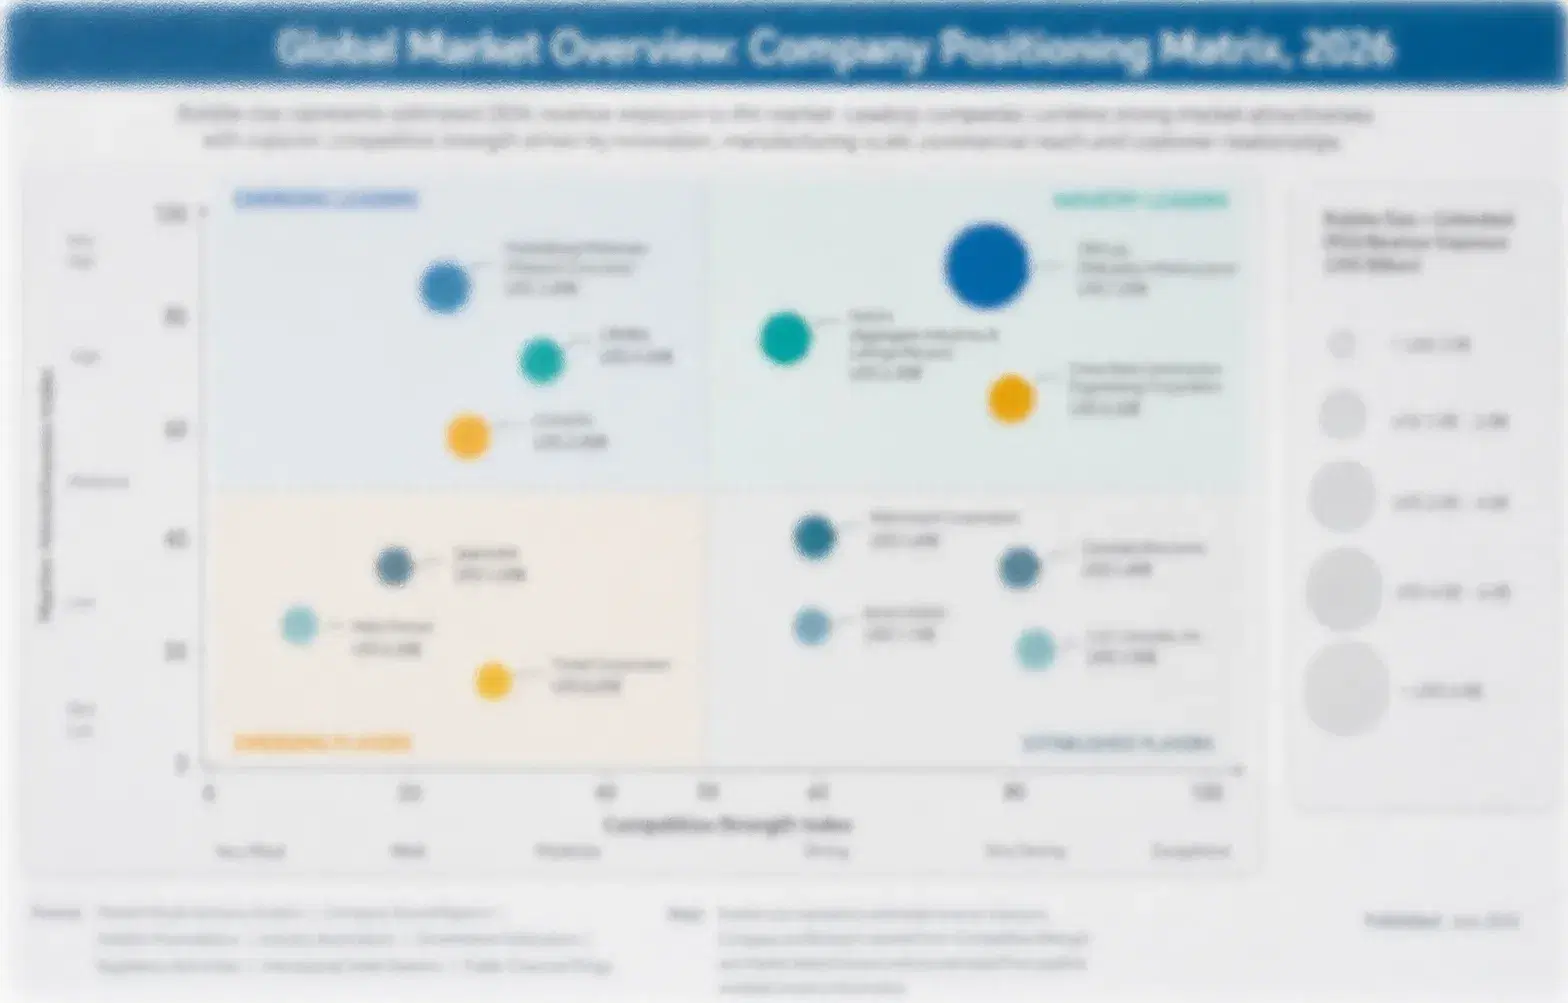
Five operators hold roughly 38 percent of global storage capacity on a throughput revenue basis, a genuinely fragmented concentration that reflects how national oil companies and regional distributors dominate different geographic markets rather than competing head-to-head globally. The gap between the leader and challengers varies considerably by region rather than following a single global pattern. Market share shifts gradually as trade flows realign.
Competitive activity currently centers on three dimensions: flexible short-term throughput contracts that capture spot demand during trade flow shifts, distribution infrastructure partnerships with government subsidy programs, and strategic reserve storage services offered to governments seeking supply security. Several operators are also expanding export terminal capacity to capture share from traditional suppliers. Several operators have also expanded strategic reserve service offerings this cycle to diversify revenue away from pure commercial throughput.

Emerging pressure is coming from North American export terminal operators expanding aggressively into import markets previously dominated by Middle Eastern suppliers, winning contracts on pricing flexibility specifically. Rankings could shift meaningfully over the next five years as this trade flow realignment continues, rewarding whichever operators adapt contract structures fastest. Established Middle Eastern suppliers are responding by offering more flexible contract terms to defend existing relationships.
liquefied-petroleum-gas-storage-market-company-positioning-matrix-1790915966625

Competitive Moat and Risk Dimensions

ROYAL VOPAK

Moat: Global Coastal Terminal Network

Royal Vopak's extensive network of coastal terminal facilities across major trade routes gives it geographic reach that regional operators cannot easily replicate, letting it serve customers shifting supply sources without switching terminal relationships entirely. This reputation lets it command premium pricing with multinational customers who value supply chain continuity across multiple regions simultaneously.
ROYAL VOPAK

Risk: Limited Household Distribution Presence

Royal Vopak's presence in household cylinder distribution, the fastest-growing consumption category in South Asia specifically, remains limited compared to national oil companies with established retail networks there. As household-driven demand keeps outpacing terminal-scale growth, this gap could cap its exposure to the market's largest consumption pool.
SHV ENERGY

Moat: Household Distribution Network Depth

SHV Energy's established household cylinder distribution network across multiple continents gives it direct access to the consumption segment growing fastest in subsidy-driven markets, a position terminal-focused competitors cannot easily match. This lets it capture new household connections more efficiently than operators without comparable last-mile distribution infrastructure already built out.
SHV ENERGY

Risk: Thin Export Terminal Scale Presence

SHV Energy's presence in large-scale export terminal infrastructure remains thinner than integrated oil majors and dedicated terminal operators, limiting its exposure to the trade flow realignment currently reshaping global supply patterns. As terminal-scale contracts keep growing in strategic importance, this gap could cap its participation in the market's highest-value segment.

Players Tracked

Prominent Players

Royal Vopak
SHV Energy
UGI Corporation
Chart Industries
McDermott International

Other Key Players

Worthington Industries
CB&I Storage Solutions
Burckhardt Compression
Indian Oil Corporation
Bharat Petroleum Corporation
Hindustan Petroleum Corporation
Saudi Aramco
Abu Dhabi National Oil Company
Suburban Propane Partners
Ferrellgas Partners
Pertamina
PTT Public Company Limited
Rubis Energie
Primagaz
Elgas Limited

Recent Developments

JANUARY 2026

Royal Vopak Expands Gulf Coast Terminal Capacity

Royal Vopak announced an organic capacity expansion at its Gulf Coast export terminal to serve rising Asian import demand shifting away from traditional Middle Eastern suppliers. The expansion adds dedicated berths for larger vessels, with strong early customer interest reported from Asian importers. Volumes look promising.
Signal: Signals Vopak's push to capture additional trade flow share as North American export capacity continues expanding against established competitors
AUGUST 2025

SHV Energy Signs Rural Distribution Partnership

SHV Energy signed a distribution infrastructure partnership agreement with a South Asian government subsidy program to co-invest in rural storage depot capacity supporting new household connections. The agreement does not constitute a joint venture, and SHV expects to extend it to additional countries within two years.
Signal: Signals growing government interest in private sector partnership models to accelerate rural distribution infrastructure buildout nationwide
MAY 2026

UGI Corporation Acquires Regional Distribution Assets

UGI Corporation acquired a regional propane distribution network and associated storage assets from a smaller operator exiting the market, expanding its footprint across several additional states. The acquisition brings last-mile distribution capacity closer to UGI's existing terminals, reaching full integration within twelve months. Integration proceeds smoothly.
Signal: Signals continued consolidation among regional distribution operators as scale increasingly determines competitive position in household markets

Steel and Construction Cost Exposure

Structural steel and civil works together represent roughly 46 percent of terminal construction cost, sourced primarily from major steel producers and regional construction contractors that serve the broader energy infrastructure sector. This concentration leaves terminal developers exposed whenever steel supply tightens or construction labor markets face disruption. Specialized tank fabrication adds a smaller but still meaningful cost layer on top of these two primary inputs.
Steel prices surged sharply through 2024, an episode the International Energy Agency's infrastructure cost reporting linked partly to competing demand from renewable energy and grid infrastructure projects drawing on the same supply base. Several planned terminal expansions were delayed by six to twelve months as developers absorbed higher input costs before locking in final construction contracts. Several developers renegotiated supply terms during this period to pass through a portion of the increase.

Smaller regional developers carry proportionally higher cost exposure than Royal Vopak and other integrated operators who negotiate volume discounts directly with steel producers and major contractors. This gap widens further for developers without long-term construction partnerships, who pay spot market premiums during tight periods that erode their already thinner project margins. This dynamic rewards scale where volume discounts compound meaningfully.
liquefied-petroleum-gas-storage-market-cost-volatility-analysis-1790915966947

Early Steel Pricing Lock-In Agreements

Leading developers lock in steel pricing early in the project planning cycle through forward purchase agreements with major producers, trading some flexibility for budget certainty across large terminal construction projects spanning several years. This approach shields project economics from spot market swings during periods like the 2024 surge. Several developers are extending these agreements into their forward pipeline.

Phased Capital Deployment Across Project Stages

Developers are phasing capital deployment across multiple project stages rather than committing full construction budgets upfront, reducing exposure to any single period of cost volatility during the multi-year construction timeline. This approach adds scheduling complexity but meaningfully reduces total cost risk exposure. Several operators report this phasing approach has already paid off during recent volatility.

Portfolio Architecture for Margin Defence

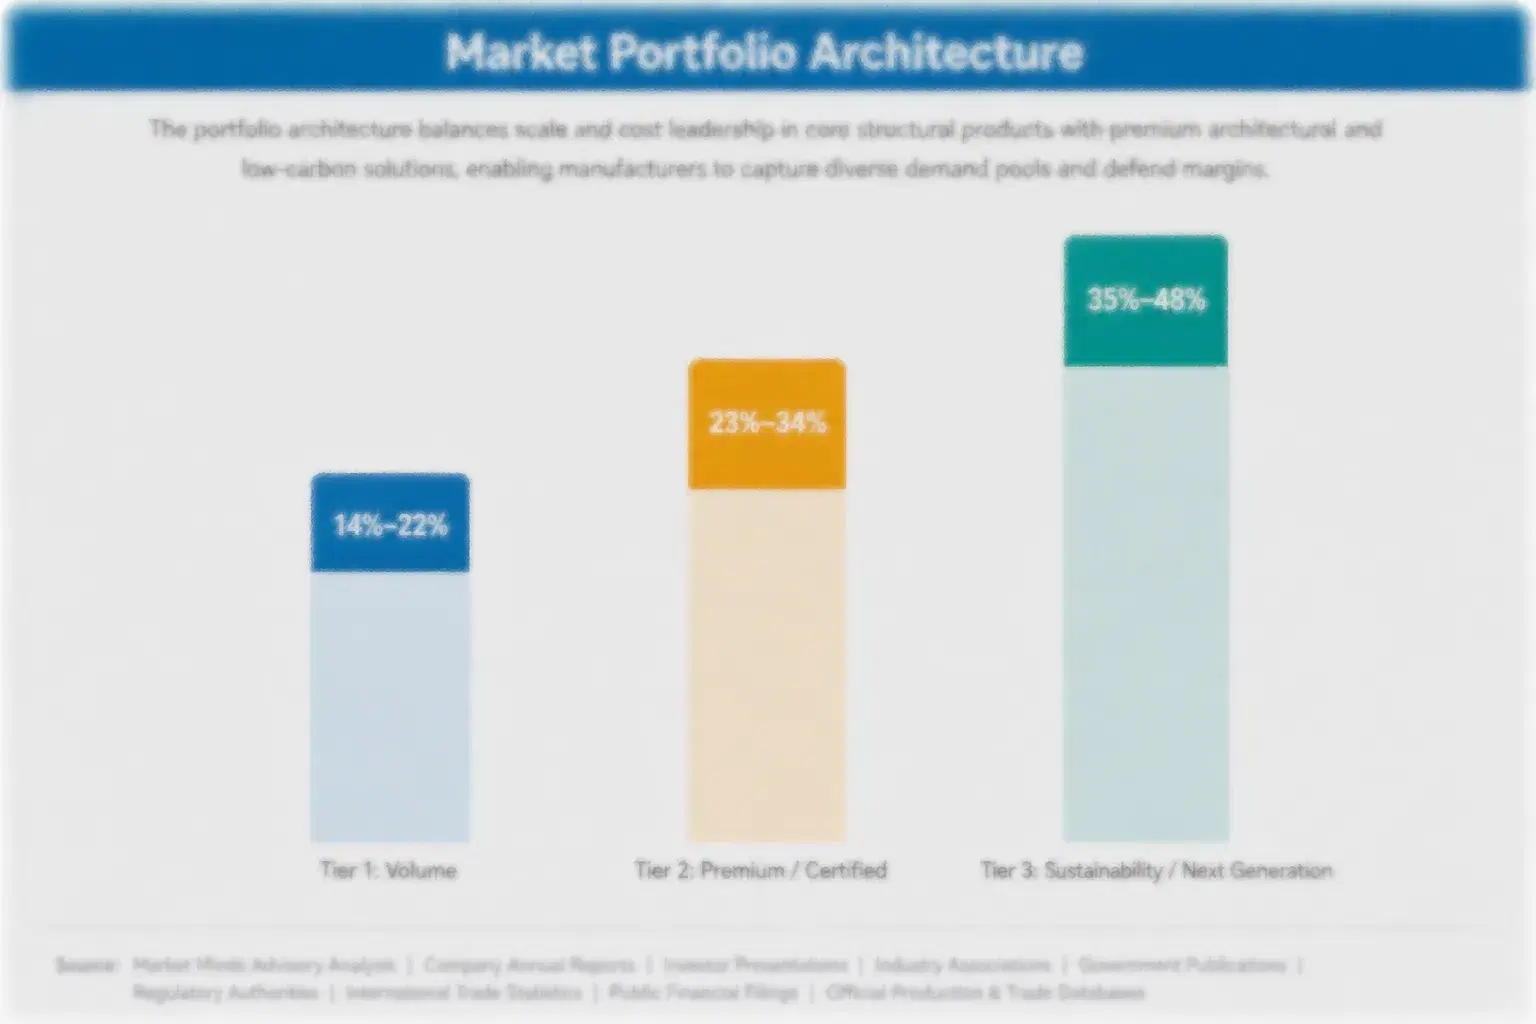
The market splits into three tiers with distinct margin economics. Volume and commodity-adjacent household cylinder distribution storage carries gross margins of 14 to 20 percent, reflecting thin per-unit economics across high-volume rural connection programs. Premium and certified terminal storage serving export and strategic contracts commands 24 to 32 percent margins on specialized infrastructure. Mid-tier operators sit uncomfortably between these two poles, squeezed from both directions.
Sustainability, regulatory, and next-generation storage, meaning strategic reserve service agreements and partnership-backed distribution infrastructure, reaches 28 to 38 percent margins, reflecting scarcity of qualified operators and governments' willingness to pay for supply security. The volume versus premium tension is real: subsidy programs push for lowest-cost distribution while governments pay for reserve assurance. Operators that serve both camps well tend to maintain separate commercial and government-facing business units.

High-value pools concentrate most heavily in terminal storage and strategic reserve services, where trade flow realignment and supply security concerns sustain pricing power that standard household distribution no longer offers operators competing on volume alone. Operators positioned early in reserve services capture disproportionate share of this margin pool. This pool expands faster than any other tier across the forecast period.

Volume / Commodity-Adjacent

Household cylinder distribution and standard bulk storage serving high-volume rural connection programs, competing primarily on throughput efficiency rather than premium pricing. Margins remain thin as a result, rewarding scale and distribution efficiency above all else.
Gross Margin: 14-20%

Premium / Certified

Terminal storage serving export and long-term import contracts carrying specialized infrastructure requirements that command pricing premiums from buyers who value supply reliability. These contracts typically run multiple years once secured by established operators.
Gross Margin: 24-32%

Sustainability / Regulatory / Next-Generation

Strategic reserve storage services and partnership-backed distribution infrastructure where scarcity and government supply security needs sustain the strongest margins in the market. These arrangements also carry the fastest growth of any tier across the forecast.
Gross Margin: 28-38%
liquefied-petroleum-gas-storage-market-portfolio-architecture-1790915967293

High-value Sub-segments and Strategic Watch-out

Terminal and Import-Export Storage

The fastest-growing and highest-value segment, driven by shifting trade flows between North American and Middle Eastern suppliers. Growth here is expected to keep outpacing every other segment through the forecast window as realignment continues. Several operators have already shifted capital allocation decisively toward this category.
Gross Margin: MMA Estimate, July 2026.

Industrial Process and Feedstock Storage

High-value and still growing well above the market average, anchored by petrochemical feedstock diversification trends. Chart Industries and McDermott remain the names most closely associated with this segment specifically. Growth tracks broader petrochemical feedstock diversification trends closely across regions. Growth here shows no sign of slowing meaningfully through the forecast.
Gross Margin: MMA Estimate, July 2026.

Household Cylinder Distribution Storage

The volume core of the market, serving established subsidy-driven household connections across South Asia. Growth remains strong but margins stay thin as programs prioritize connection volume over pricing power in most markets. Established distributors depend heavily on this steady volume baseline for core revenue. now.
Gross Margin: MMA Estimate, July 2026.

Autogas Fueling Infrastructure Storage

A strategic watch-out segment where adoption pace depends heavily on fuel price differentials that vary considerably by country. Demand could accelerate quickly if more transport markets pursue fleet conversion incentive programs. Suppliers monitor fuel price differentials closely across every major transport market. Adoption remains uneven across regions.
Gross Margin: MMA Estimate, July 2026.

Long-Term Contracts Anchor Terminal Revenue

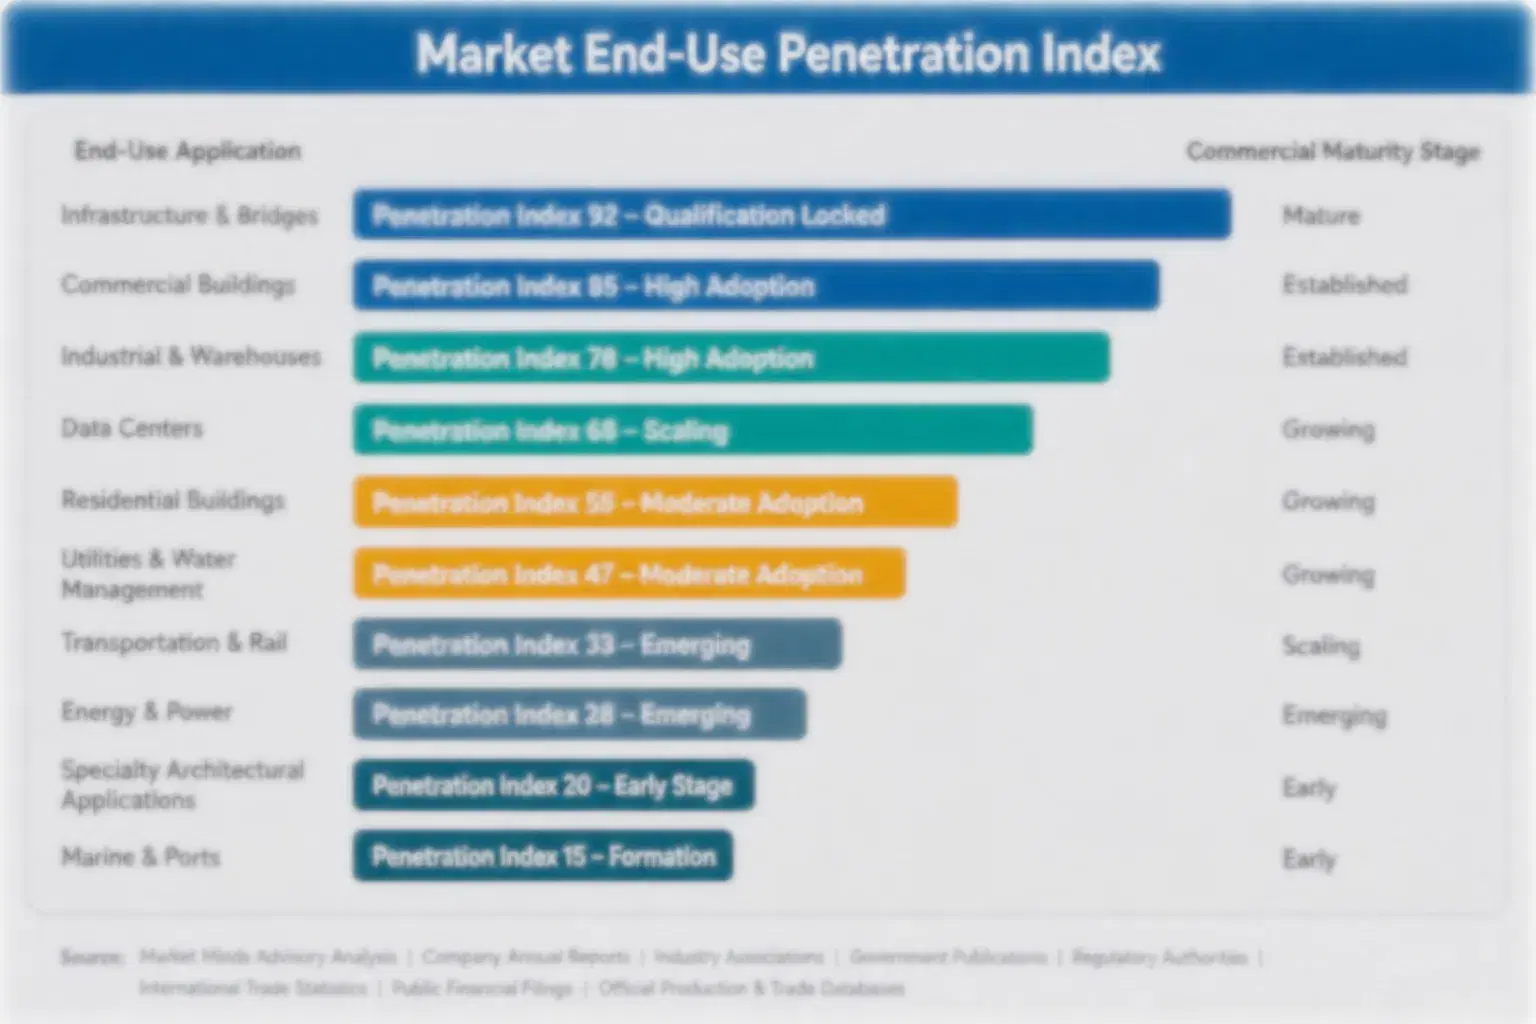
LPG storage demand carries annuity-like characteristics once a terminal operator secures a long-term throughput contract with an exporter or import distributor, since these agreements typically span five to ten years and rarely change mid-term given the capital commitments both parties have made. This gives incumbent operators revenue visibility spanning entire trade relationship cycles rather than single transactions. now.
Adoption stickiness and depth vary meaningfully by end-use vertical. Export terminal operators rarely switch supply partners mid-contract given the logistics coordination these agreements require, while household distribution programs remain more open to competitive rebidding as subsidy administrators periodically review vendor performance. Industrial feedstock buyers sit between these two extremes, favoring proven suppliers but open to diversification. Misjudging which category a buyer falls into costs operators bids they should win comfortably.

A generational shift in buyer profiles is underway as government procurement officials, rather than traditional commercial purchasing agents, increasingly lead strategic reserve storage specification given rising supply security concerns tied to trade flow volatility. These buyers evaluate operators on geopolitical reliability and contract flexibility as much as price, reshaping how terminal operators pitch new government relationships entirely.
liquefied-petroleum-gas-storage-market-end-use-penetration-index-1790915967575

Where LPG Storage Value Concentrates Next

These are among the four positions where our research anticipates prominent divergence between winners and laggards over the coming forecast period. Each is grounded in the demand model, the regulatory perimeter, and the announced capacity pipeline.
01 / TRADE FLOW REALIGNMENT POSITIONING

Capture spot volume as flows shift between regions

Terminal and import-export storage is growing at 5.88 percent annually, roughly 1.40 times the overall market rate, driven by trade flow realignment between North American and Middle Eastern suppliers competing for the same long-term import contracts. Operators without flexible short-term contract offerings are losing spot volume to competitors who can capture demand during these realignment windows more effectively than rigid long-term agreements allow. Early positioning on contract flexibility pays off disproportionately as this realignment continues over the next several years.
02 / SUBSIDY PARTNERSHIP INFRASTRUCTURE INVESTMENT

Co-invest in rural distribution ahead of competitors

Eighteen million new household connections were added across India and Indonesia in 2025 alone, and operators that co-invest directly in rural distribution infrastructure alongside government subsidy programs capture preferred partner status before commercial competitors arrive on the scene across these fast-expanding markets. Operators without this partnership model risk losing these relationships to competitors already embedded in government distribution planning processes. The window to establish this position is narrowing quickly as more operators recognize the long-term value involved even in markets they currently overlook.
03 / STEEL COST HEDGING

Lock in steel pricing before the next cost spike

Steel and construction costs represent 46 percent of terminal build cost, and the 2024 price surge delayed several planned terminal expansions by six to twelve months for developers without early pricing lock-in agreements already in place across their project pipeline and forward construction schedule. Developers that expand hedging programs now will protect project economics during the next volatility event, while those that delay will face the same delays repeatedly. Terminal demand keeps rising steadily across nearly every major trade corridor worldwide.
04 / STRATEGIC RESERVE SERVICE EXPANSION

Build reserve service capability for governments

Strategic reserve storage service agreements already command a 9 percent pricing premium over standard commercial contracts, reflecting governments' willingness to pay for supply security independent of commercial throughput cycles affecting typical terminal operations across most major consuming markets. Operators that build dedicated reserve service capability now will capture this premium segment before competitors recognize its value. Trade flow volatility keeps raising supply security concerns among major consuming governments worldwide, a trend that shows little sign of reversing anytime soon at all.

Engagement Snapshot From the Field

A live engagement with an industry participant carrying material or product regulatory and market exposure ahead of a defining policy shift, showing how our research translates into a defensible multi-year portfolio strategy.
MARKET MINDS ADVISORY · CLIENT ENGAGEMENT SUMMARY
Liquefied Petroleum Gas Storage Producer Strategic Portfolio Review and Transition Roadmap 2026·Investment Scenario on Liquefied Petroleum Gas Storage Exposure Evaluation 2025-26
CLIENT PROFILE
A mid-sized regional terminal operator in Southeast Asia engaged MMA to evaluate whether to renegotiate existing long-term supply contracts with Middle Eastern exporters or diversify toward North American suppliers given shifting trade flow economics. The client's board wanted an independent assessment before committing to a multi-year contract decision affecting its next decade of operations. (client-reported, unverified by MMA).
STRATEGIC CHALLENGE
The operator's existing supply contracts were approaching renewal, and the board needed to decide whether locking in renewed terms with existing Middle Eastern suppliers or diversifying toward newer North American supply relationships offered better long-term economics given shifting global trade flow patterns and freight cost trends. (client-reported, unverified by MMA).
MMA APPROACH
MMA's research team modeled landed cost economics across both supply scenarios using primary interviews with comparable terminal operators that had already diversified their supply base, cross-referencing findings against current shipping and freight cost trends. The team built a risk-adjusted comparison weighing price, reliability and geopolitical exposure. This comparison incorporated best-case and worst-case freight cost scenarios for both supply regions.
KEY FINDINGS
  1. North American supply offered landed costs roughly 7 percent below renewed Middle Eastern contract terms, based on current freight rates and shale production economics.
  2. Diversifying supply across both regions would reduce the operator's geopolitical concentration risk meaningfully compared to remaining fully dependent on a single supply region.
  3. Existing Middle Eastern relationships offered superior contract flexibility during demand spikes, a factor not fully captured in simple landed cost comparisons alone.
  4. A split supply arrangement across both regions preserved most of the cost advantage while retaining the flexibility benefits of the existing relationship structure.
CLIENT PROFILE
A mid-sized regional terminal operator in Southeast Asia engaged MMA to evaluate whether to renegotiate existing long-term supply contracts with Middle Eastern exporters or diversify toward North American suppliers given shifting trade flow economics. The client's board wanted an independent assessment before committing to a multi-year contract decision affecting its next decade of operations. (client-reported, unverified by MMA).
STRATEGIC CHALLENGE
The operator's existing supply contracts were approaching renewal, and the board needed to decide whether locking in renewed terms with existing Middle Eastern suppliers or diversifying toward newer North American supply relationships offered better long-term economics given shifting global trade flow patterns and freight cost trends. (client-reported, unverified by MMA).
MMA APPROACH
MMA's research team modeled landed cost economics across both supply scenarios using primary interviews with comparable terminal operators that had already diversified their supply base, cross-referencing findings against current shipping and freight cost trends. The team built a risk-adjusted comparison weighing price, reliability and geopolitical exposure. This comparison incorporated best-case and worst-case freight cost scenarios for both supply regions.
KEY FINDINGS
  1. North American supply offered landed costs roughly 7 percent below renewed Middle Eastern contract terms, based on current freight rates and shale production economics.
  2. Diversifying supply across both regions would reduce the operator's geopolitical concentration risk meaningfully compared to remaining fully dependent on a single supply region.
  3. Existing Middle Eastern relationships offered superior contract flexibility during demand spikes, a factor not fully captured in simple landed cost comparisons alone.
  4. A split supply arrangement across both regions preserved most of the cost advantage while retaining the flexibility benefits of the existing relationship structure.
RECOMMENDED STRATEGY
Phase 1: Negotiate a split supply arrangement allocating roughly sixty percent of volume to North American suppliers at renewal. This split matched the pattern MMA observed across comparable operators. Phase 2: Retain the remaining forty percent with existing Middle Eastern suppliers to preserve demand spike flexibility benefits. This balance preserved valuable optionality during future demand spikes. Phase 3: Build in contract renegotiation triggers tied to freight cost thresholds to protect against future trade flow shifts. This mechanism protects the operator against future cost volatility.
OUTCOME
The client proceeded with the recommended split supply arrangement, securing landed costs roughly in line with MMA's modeled estimate. The operator has maintained supply reliability through its first full contract cycle under the new arrangement, with no reported disruption to date (client-reported, unverified by MMA).

Frequently Asked Questions

Foundational context covering the market sizes, CAGR, scope, country, region and competition that inform every finding below. This section is provided to cover basics and most often pre-purchase conversations, answered from the MMA Primary Research Dataset.

What is the current size of the Liquefied Petroleum Gas Storage Market?

The Liquefied Petroleum Gas Storage Market was valued at 8.5 billion dollars in 2025. Growth is anchored by shifting trade flows and expanding household subsidy programs worldwide.

How large will the Liquefied Petroleum Gas Storage Market be by 2036?

The market is projected to reach 13.36 billion dollars by 2036, up from 8.5 billion in 2025. That represents a 1.51 times expansion over the eleven-year forecast window.

What is the CAGR for the Liquefied Petroleum Gas Storage Market 2026 to 2036?

The market is forecast to grow at a 4.2 percent compound annual rate. This compares to a historical rate of 3.7 percent between 2020 and 2025.

Which segment is growing fastest?

Terminal and Import-Export Storage leads at a 5.88 percent CAGR, roughly 1.40 times the overall market rate. Shifting trade flows are the primary driver behind this pace.

Who are the major companies in the Liquefied Petroleum Gas Storage Market?

Royal Vopak, SHV Energy, UGI Corporation, Chart Industries, and McDermott International lead the competitive field. Together the top five hold roughly 38 percent of global capacity share.

Which country is growing fastest?

India leads country-level growth at a 6.5 percent CAGR. Its household LPG subsidy program expansion across rural areas is the primary driver behind this accelerating pace.

Report Segmentation Architecture

The full report scope spans multiple orthogonal segmentation dimensions, with cross-tabulated demand data provided for each dimension pair. Coverage extends further to regional breakdowns, trend trajectories, and the competitive detail needed to support segment-level decision-making.

By Storage Type

    By End-Use Industry

      By Commercial Dimension

        By Region

        • North America
        • Western Europe
        • East Asia
        • South Asia and Pacific
        • Latin America
        • Middle East and Africa
        • Eastern Europe

        Scope, Methodology, and Coverage

        Every figure in this report is reproducible from documented input assumptions. The scope below maps the historical period, the forecast horizon, the segmentation dimensions, and the countries covered, alongside the underlying primary and qualitative methodology.
        Historical Period
        2020 to 2025
        Forecast Period
        2026 to 2036
        Base Year
        2025 (USD billions; MMA Primary Research Dataset, October 2026)
        Market Definition
        This report covers bulk and terminal storage infrastructure for liquefied petroleum gas, including import-export terminal tanks, cylinder filling plant storage, and industrial and autogas bulk storage. It excludes LPG production, transport vessels, and residential cylinder retail distribution activity itself.
        Quantitative Units
        USD Billion, CAGR 2026-2036
        Segmentation Dimensions
        By Storage Type, By End-Use Industry, By Commercial Dimension, By Region
        Regions Covered
        North America, Western Europe, East Asia, South Asia and Pacific, Latin America, Middle East and Africa, Eastern Europe
        Countries Covered
        United States, India, China, Saudi Arabia, Indonesia, Japan, Brazil, Qatar, Mexico, and 15 additional markets
        Key Companies Profiled
        Royal Vopak, SHV Energy, UGI Corporation, Chart Industries, McDermott International, and 15 additional companies
        Quantitative Methodology
        Primary survey, n=3,800 respondents, Q4 2025, six countries; demand-side model with trade association cross-validation
        Qualitative Methodology
        47 expert interviews, Q4 2025; applied to validate demand model assumptions, identify emerging dynamics, and assess competitive positioning
        Report Format
        PDF and XLSX data workbook (Word format preview document)
        Publisher
        Market Minds Advisory
        Report Code
        MMA-2026-ENE-276
        Published
        October 2026
        Contact
        sales@marketmindsadvisory.com | www.marketmindsadvisory.com

        Purchase the full Liquefied Petroleum Gas Storage Market Report (2026 to 2036).

        The full Liquefied Petroleum Gas Storage Market report extends this summary with complete segment-level data tables, country-level sizing across twenty-five markets, and detailed operator benchmarking across all twenty profiled companies named in this overview. It includes primary survey findings from 3,800 respondents across six countries and 47 expert interviews conducted in the fourth quarter of 2025, each sourced and documented separately throughout. Buyers receive editable data files alongside the narrative report, supporting direct use in internal planning models. Analysts remain available for a follow-up briefing call to walk through the findings in more depth.
        Complete seven-region sizing and forecast tables
        Twenty company competitive benchmarking profiles included
        Five-year historical and eleven-year forecast data
        Segment-level CAGR and margin detail included
        Primary survey and expert interview data files
        Editable Excel data appendix fully included

        Built For The People Who Decide

        From boardroom strategy to bench-side execution, this report is read cover-to-cover by leaders shaping the next decade of their industry, turning demand scenarios, market dynamics and valuation benchmarks into decisions.
        CXOs/ Presidents/ VPs/ Managers
        M&A and Corporate Development
        Strategy Teams and R&D Heads
        Procurement and Product Directors
        Regulatory and Compliance Leaders
        Investor Relations and Equity Analysts