Market Minds Advisory
Light Electric Vehicle Market

Light Electric Vehicle Market: Two- and Three-Wheel Electrification Through 2036

Urban delivery fleets and last-mile logistics operators are pulling electric two- and three-wheelers into commercial duty faster than lithium-ion cell supply can keep pace, forcing manufacturers to ration battery allocation between consumer and fleet channels.

Lead Analyst

David Horsley

Published

September 2026

Make Smarter Decisions with Customized Research Insights

Request a free sample report and evaluate market opportunities, growth trends, and competitive dynamics relevant to your business needs.

2025 MARKET VALUE$34.5BMarket Size 2025
2036 FORECAST VALUE$96.5BBase Case , 2026 to 2036
CAGR 2026 TO 20369.8 %Bull 11.0% / Bear 8.6%
INCREMENTAL OPPORTUNITY$58.6BNet 10- year value creation
EXPANSION MULTIPLE2.55x2036 value over 2026 base
Strategic Levers
M&A Pipeline
Regional Outlook
Country Rankings
Competitive Intelligence
Segmental Deep-dive
Call-Us : 91 93563 13602

Executive Snapshot and Market Trajectory

Battery allocation, not vehicle demand, now decides who wins share in light electric vehicles. Fleet operators willing to pay premiums for guaranteed lithium iron phosphate cell supply are shipping product on schedule this year while consumer-focused brands still wait for their allocation to clear.
Commercial duty cycles are pulling the category upward: food delivery platforms, postal operators, and e-commerce last-mile fleets now specify electric three-wheelers and mopeds on total cost of ownership rather than sticker price, and increasingly demand battery-swap compatibility as a purchase condition. India and Southeast Asia concentrate the fastest volume growth, while China retains the deepest manufacturing base for cells, motors, and controllers, supplying export markets well beyond its own borders.
Competition sits between diversified Chinese two-wheeler giants scaling on manufacturing cost and smaller software-forward brands selling connected features, over-the-air updates, and subscription services to retail buyers. Tightening lithium iron phosphate cell allocation, inconsistent national safety certification regimes, and rising import tariffs on finished vehicles are reshaping which manufacturers can sustain margin while chasing fleet contracts, pushing several toward local assembly to preserve subsidy eligibility and tariff treatment across every major region this coming year.
Market Definition
The light electric vehicle market covers battery-electric bicycles, scooters, mopeds, low-speed motorcycles, three-wheelers, self-balancing personal transporters, and neighborhood utility vehicles rated below highway motorcycle classification. It excludes electric passenger cars, heavy electric trucks, and shared micromobility operating revenue, which are covered under separate MMA reports.
Base Year Value
$34.5B in 2025 (MMA Primary Research Dataset, August 2026)
Forecast Period
2026 to 2036, eleven discrete annual values
CAGR
9.8% base case. Bull 11.0%. Bear 8.6%.
Fastest Growth Segment
Electric Three-Wheelers: 13.5% CAGR
Fastest Growth Country
India: 15.2% CAGR
Fastest Growth Region
South Asia and Pacific: 11.8% CAGR
Largest Region
East Asia: 29% of 2025 global value
Market Leaders
Yadea Group Holdings, NIU Technologies, Segway-Ninebot Limited, Giant Manufacturing Co. Ltd., Trek Bicycle Corporation. Source: MMA Analysis based on company annual reports.
Primary Survey
n=3,800 procurement and R&D decision-makers, Q4 2025, six countries
Methodology
Demand-side build-up, cross-validated against public data, 47 expert interviews

Light Electric Vehicle Market Forecast Scenarios

light-electric-vehicle-market-trends-size-forecast-scenario-1787554821609
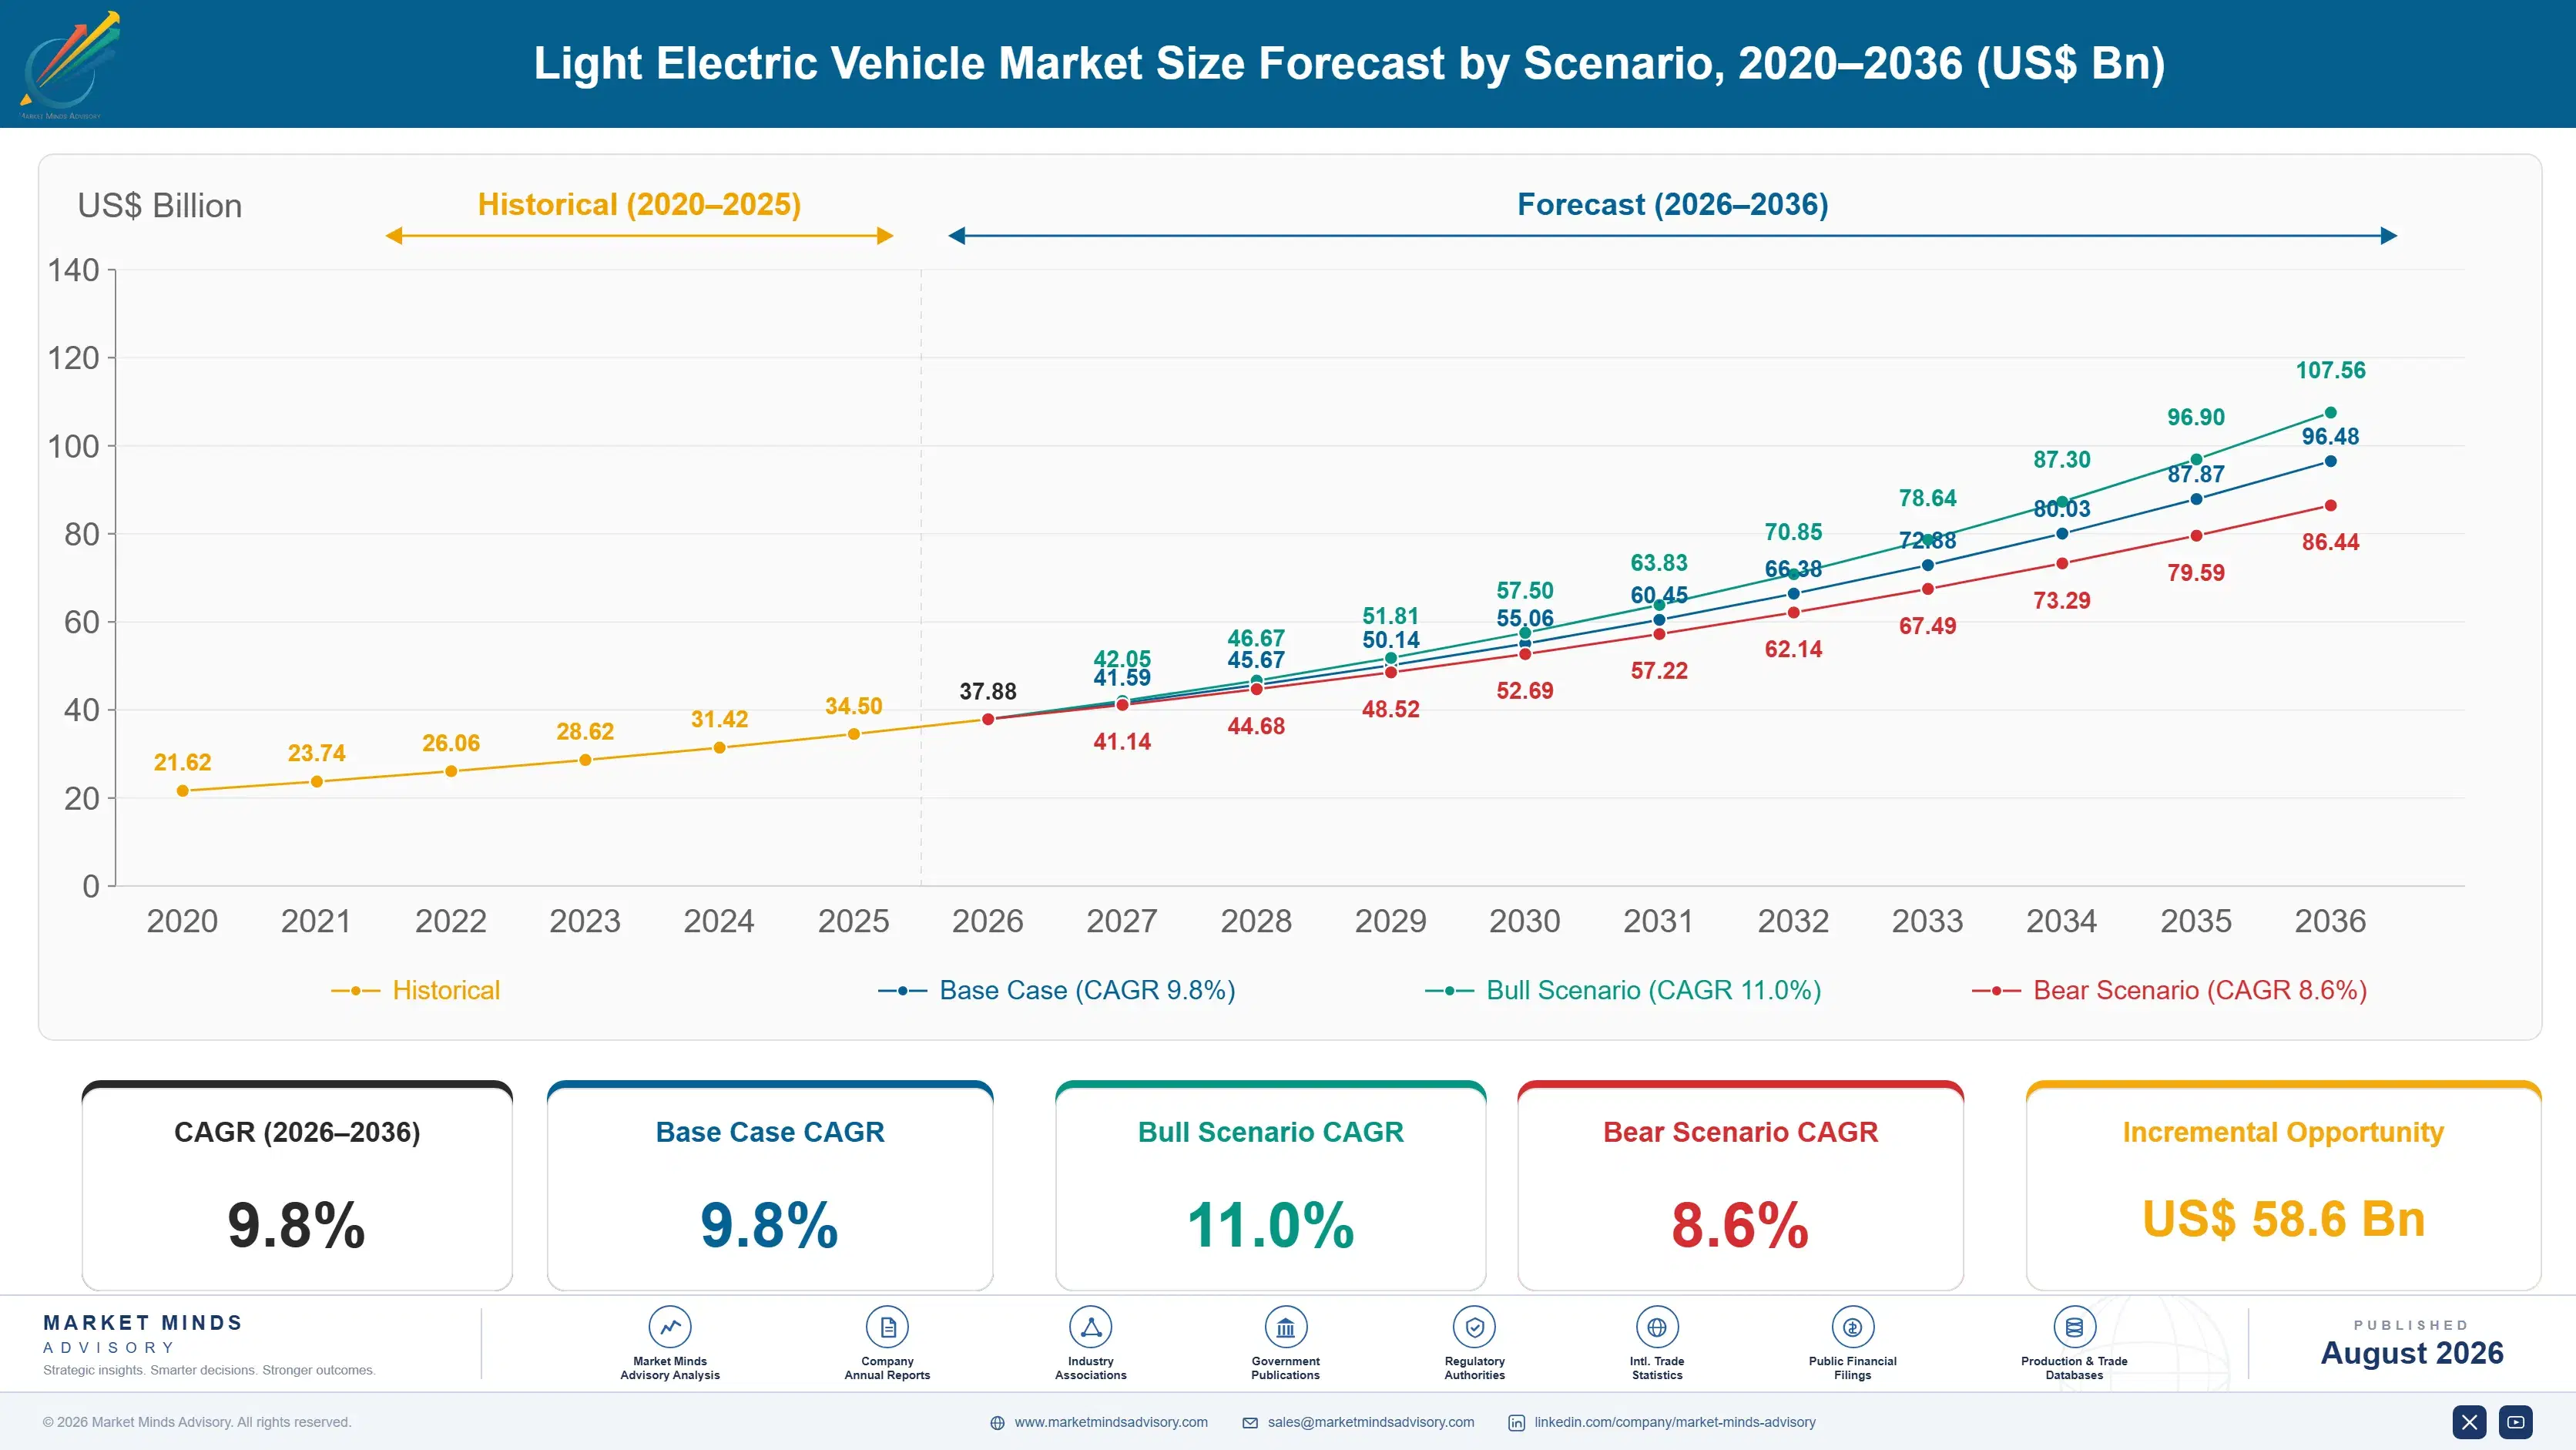
Between 2020 and 2025 the category grew near an 8.8% annual pace, propelled first by pandemic-era bicycle shortages that emptied dealer inventories worldwide, and later by delivery platforms electrifying fleets across South and Southeast Asia as fuel costs climbed. China's domestic e-two-wheeler replacement cycle provided a steady undertone throughout the period, cushioning the category against demand swings seen in newer export markets.
The base case carries the market to a 9.8% CAGR on three mechanisms: continued fleet electrification among food delivery and postal operators seeking lower operating cost, falling lithium iron phosphate cell prices that steadily narrow the gap against internal combustion two-wheelers on total cost of ownership, and expanding national subsidy or tax-credit programmes across India, the European Union, and parts of Latin America that lower effective purchase price for first-time commercial buyers entering the category.
The bull case at 11.0% assumes India's PM E-DRIVE scheme sustains funding beyond its current window and pulls three-wheeler adoption forward faster than currently modelled. The bear case at 8.6% assumes tightening European Union anti-dumping duties on Chinese-built units and renewed lithium carbonate price volatility slow fleet conversion in the near term, particularly among smaller regional assemblers without hedged supply.

Fleet Electrification and the Battery Allocation Squeeze

Three forces converge on this category at once. Delivery platforms need vehicles that survive twelve-hour daily duty cycles, consumers want commuting options priced below a used car, and regulators in multiple regions are actively subsidising the switch away from combustion two-wheelers. None of those buyers wants the same vehicle specification, which is splitting manufacturers into fleet-grade and consumer-grade product lines.
TOP PRODUCER SHAREChina, 61%Share of total global unit production concentrated domestically
AVERAGE SELLING PRICEUSD 640Blended price across bicycle, scooter, and moped formats
LFP CELL COST SHARE34% of COGSBattery pack cost as share of total unit cost
FLEET CHANNEL SHARE29% of unitsVolume sold directly into daily commercial delivery fleets
REPLACEMENT CYCLE3.5 yearsTypical service life before commercial fleet unit retirement
MARKET CONCENTRATIONCR5: 28%Combined share held by five largest manufacturers globally
Commercially, the category behaves like a components business wearing a vehicle badge. Margin now sits with whoever secures guaranteed lithium iron phosphate cell allocation and motor controller supply, not with whoever has the strongest retail brand. Chinese manufacturers hold that position today through vertically integrated cell sourcing, while smaller regional assemblers buy cells on spot markets and absorb price swings directly.
Over the next decade, national safety certification regimes, tightening import tariffs, and localisation requirements tied to subsidy eligibility will decide which brands can scale fleet contracts profitably. Vehicles built to a single global specification are losing ground to models engineered per-market around local battery, charging, and registration rules, a shift that rewards manufacturers with flexible platform architecture over those chasing a single worldwide design across every regional market.
"Everyone talks about this as a vehicle market. It behaves like a cell allocation market wearing handlebars, and the manufacturers who understand that are the ones actually filling fleet orders on time."
Director, Micromobility and Powertrain Practice · MMA Automotive and Micromobility Practice · August 2026

Market Trends

Delivery Platforms Standardise Fleet-Grade Three-Wheeler Specs

Major food delivery and e-commerce logistics operators across India, Indonesia, and China have begun issuing shared technical specifications for fleet-grade electric three-wheelers, covering payload, swap-battery compatibility, and minimum duty-cycle warranties. Zomato, Swiggy, and several regional postal operators have committed to converting large portions of their delivery fleets to electric three-wheelers and mopeds by 2027 under published sustainability targets. This standardisation lets component suppliers build to a common platform rather than bespoke fleet orders, cutting qualification time for new entrants while raising the bar on warranty and swap-battery interoperability that smaller assemblers struggle to meet.
Market Impact: Adds 2.4 million subsidised units
Battery-Swap Networks Expand Beyond China Into South Asia

Battery-swapping infrastructure, pioneered at scale by Chinese operators serving delivery riders, is expanding into India and Indonesia through joint ventures between vehicle makers and energy companies. Gogoro has extended its swap network partnerships into India and mainland China, while Sun Mobility and Battery Smart have each deployed thousands of swap stations across Indian metro areas. Swap access changes purchase economics for commercial riders by removing the battery from the vehicle price entirely, shifting it to a subscription, which lowers the upfront barrier for fleet operators buying in volume and accelerates conversion away from petrol-fuelled two- and three-wheelers.
Market Impact: Pack cost nears USD 78/kWh

Market Opportunities and Growth Drivers

India's PM E-DRIVE Scheme Subsidises Commercial Fleet Conversion

India's PM E-DRIVE scheme, launched in 2024 with an outlay exceeding INR 109 billion, provides direct purchase incentives for electric two-wheelers and three-wheelers alongside charging infrastructure grants, explicitly targeting commercial delivery and passenger three-wheeler fleets. The scheme follows the earlier FAME II programme and narrows eligibility toward domestically manufactured components to build local supply chains for motors and controllers. Early disbursement data shows three-wheeler registrations rising fastest among subsidised categories, since commercial operators recover the incentive value within a single operating year through fuel and maintenance savings alone, well ahead of private consumer buyers claiming the same subsidy tier.
Market Impact: Duties add up to 79%

Falling LFP Cell Prices Narrow Gap With Combustion Two-Wheelers

Lithium iron phosphate cell prices have declined substantially since 2022 as Chinese cathode and cell capacity expanded well beyond near-term demand, pulling pack costs down toward levels that make electric two-wheelers cost-competitive against petrol models on a total-cost-of-ownership basis within two to three years of ownership. That shift matters most in fleet buying, where operators evaluate lifetime fuel and maintenance cost rather than sticker price alone. Manufacturers able to lock multi-year cell supply contracts at current pricing are extending warranty terms and cutting retail prices to capture fleet volume before prices firm again.
Market Impact: Certification adds 6 to 9 months

Market Restraints and Challenges

European Union Anti-Dumping Duties Raise Landed Cost

The European Union has maintained anti-dumping and countervailing duties on Chinese-manufactured electric bicycles since 2019, with rates varying by manufacturer and periodically reviewed by the European Commission. The root cause is a documented finding that subsidised Chinese production undercut European assemblers on price, prompting protective tariffs that now add materially to landed cost for importers without European assembly. The commercial impact falls hardest on smaller Chinese brands lacking local assembly, while larger manufacturers are responding by opening or expanding assembly operations inside Poland, Hungary, and other European Union states to qualify for lower duty treatment.
Market Impact: Fleet orders exceed 4 million units

Inconsistent National Safety Certification Slows Cross-Border Scaling

Electric two- and three-wheeler safety and classification standards differ substantially across major markets: China's GB 17761 standard, the European Union's L-category vehicle framework, and varying American state-level e-bike classification rules each impose distinct speed, power, and battery certification requirements. The root cause is the absence of a harmonised international standard for light electric vehicles, unlike passenger cars under UNECE frameworks. This forces manufacturers to run separate certification programmes per region, raising fixed cost and slowing new-model launches. Larger manufacturers are mitigating this by designing modular platforms that isolate battery and motor certification from body variants shared across markets.
Market Impact: Swap stations surpass 12,000 units
3 additional market trends, 3 additional growth drivers, and 3 additional restraints and challenges are covered in the full report. Contact sales@marketmindsadvisory.com to access the complete intelligence.

Segment CAGR and Growth Architecture

Segmentation follows vehicle format and platform architecture, a single engineering and regulatory logic, since duty cycle, battery configuration, and certification classification vary sharply by format rather than by end buyer or price point. That keeps product engineering, warranty structuring, and go-to-market planning aligned to platform economics rather than brand positioning across the industry as a whole.
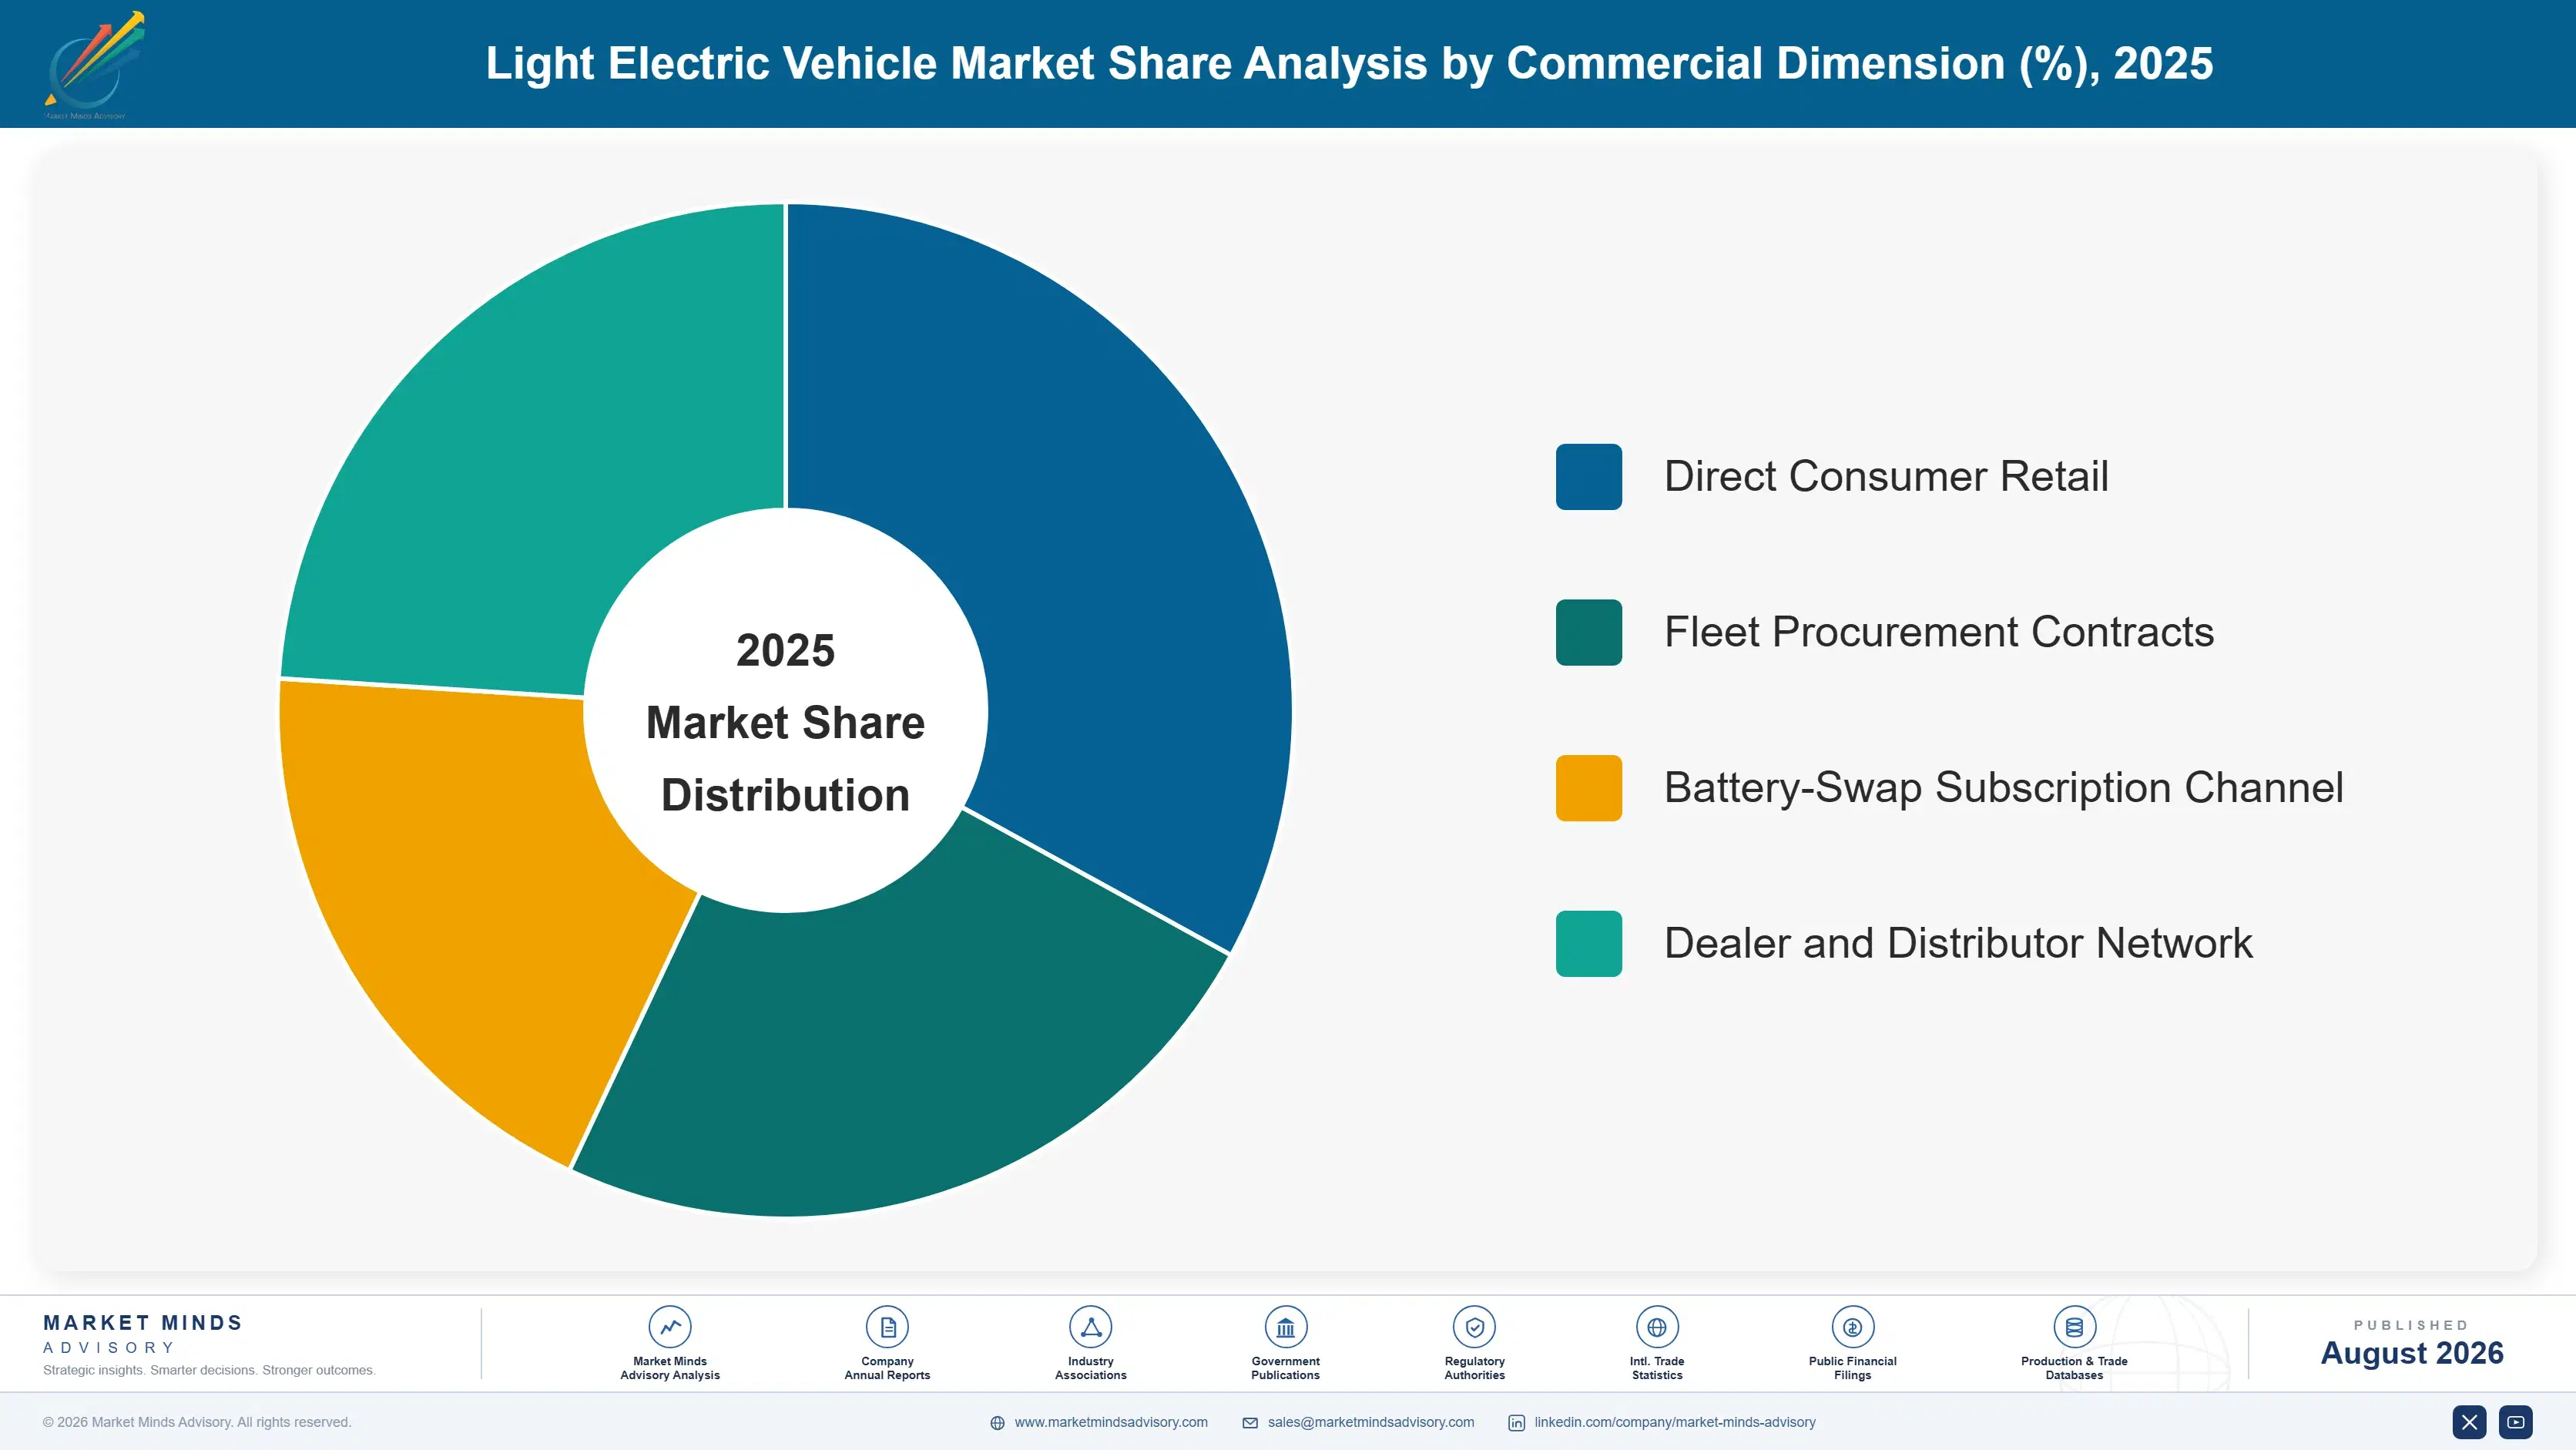
light-electric-vehicle-market-trends-market-share-analysis-1787554822144

Electric Three-Wheelers

Electric three-wheelers grow fastest at 13.5%, about 1.38 times the overall 9.8% rate, driven almost entirely by commercial passenger and cargo fleet conversion across India, Southeast Asia, and parts of Africa. These vehicles carry higher payload and longer duty cycles than two-wheelers, making battery swap compatibility and warranty terms the deciding purchase factors for fleet buyers rather than styling or brand. India's Bajaj Auto, TVS Motor, and Mahindra Last Mile Mobility dominate domestic volume, while regional assemblers across Bangladesh and Nigeria build lower-cost variants for local passenger transport. Growth concentrates in markets where three-wheelers already serve as primary commercial transport, making this a conversion story rather than new category creation.
CAGR 13.5%

Electric Mopeds and Low-Speed Motorcycles

Electric mopeds and low-speed motorcycles grow at 12.0%, the second-fastest format, gaining share as riders in Southeast Asia and Latin America replace petrol scooters used for daily commuting and light delivery work. Gogoro, Yadea, and Honda's electric moped lines lead volume, competing heavily on swap-battery access and total cost of ownership against entrenched petrol incumbents. Unlike three-wheelers, this segment sells substantially to individual consumers rather than fleets, so financing availability and dealer network depth matter as much as vehicle specification. Vietnam and Indonesia post the fastest national adoption as petrol scooter replacement programmes gain regulatory support. Retail financing terms increasingly rival vehicle specification as the deciding factor, since buyers weigh monthly instalments against fuel savings closely.
CAGR 12.0%
Full segment breakdown across 6 segments available in the complete report.

Regional Architecture and Country Demand Map

East Asia anchors both manufacturing and consumption on China's domestic replacement cycle, while South Asia and Pacific posts the fastest growth on fleet electrification, and Western Europe and North America grow more slowly against safety certification and tariff friction. Latin America and Africa remain smaller but expanding pools.

North America

Recreational and commuter e-bike purchases carry most of North America's 22% share, well below East Asia's manufacturing base, since the region imports most of its finished units rather than producing them domestically. Rad Power Bikes and Trek lead branded volume, while state-level e-bike classification rules in California and New York set speed and power thresholds that determine which imported models qualify for bike-lane access rather than motor vehicle registration. Federal e-bike tax credit proposals remain stalled in Congress, leaving state and municipal rebate programmes as the primary purchase incentive available today. Growth of 9.5% tracks commuter adoption in dense metro areas more than any fleet conversion story, since American delivery platforms still favour car-based and bicycle courier models over three-wheelers.
Share: 22% | CAGR: 9.5% (2026 to 2036)

Western Europe

Cargo e-bike adoption for urban delivery and family transport, not scooters or mopeds, drives Western Europe's 22% share, concentrated in the Netherlands, Germany, and France where cycling infrastructure investment has run for decades ahead of electrification elsewhere on the continent. Pon Holdings, through its Accell and Cannondale brands, and Giant Manufacturing hold significant retail share alongside strong independent bicycle dealer networks that differ from Asian direct-to-fleet channels. European Union anti-dumping duties on Chinese-built e-bikes have pushed several manufacturers toward assembly inside Poland and Hungary to qualify for reduced tariff treatment. Growth of 8.3%, the slowest major region, reflects an already mature commuter base rather than weakening underlying demand across the wider bloc.
Share: 22% | CAGR: 8.3% (2026 to 2036)
Regional intelligence for 5 additional markets available in the complete report: East Asia, South Asia and Pacific, Latin America, Middle East and Africa, Eastern Europe. Contact sales@marketmindsadvisory.com.
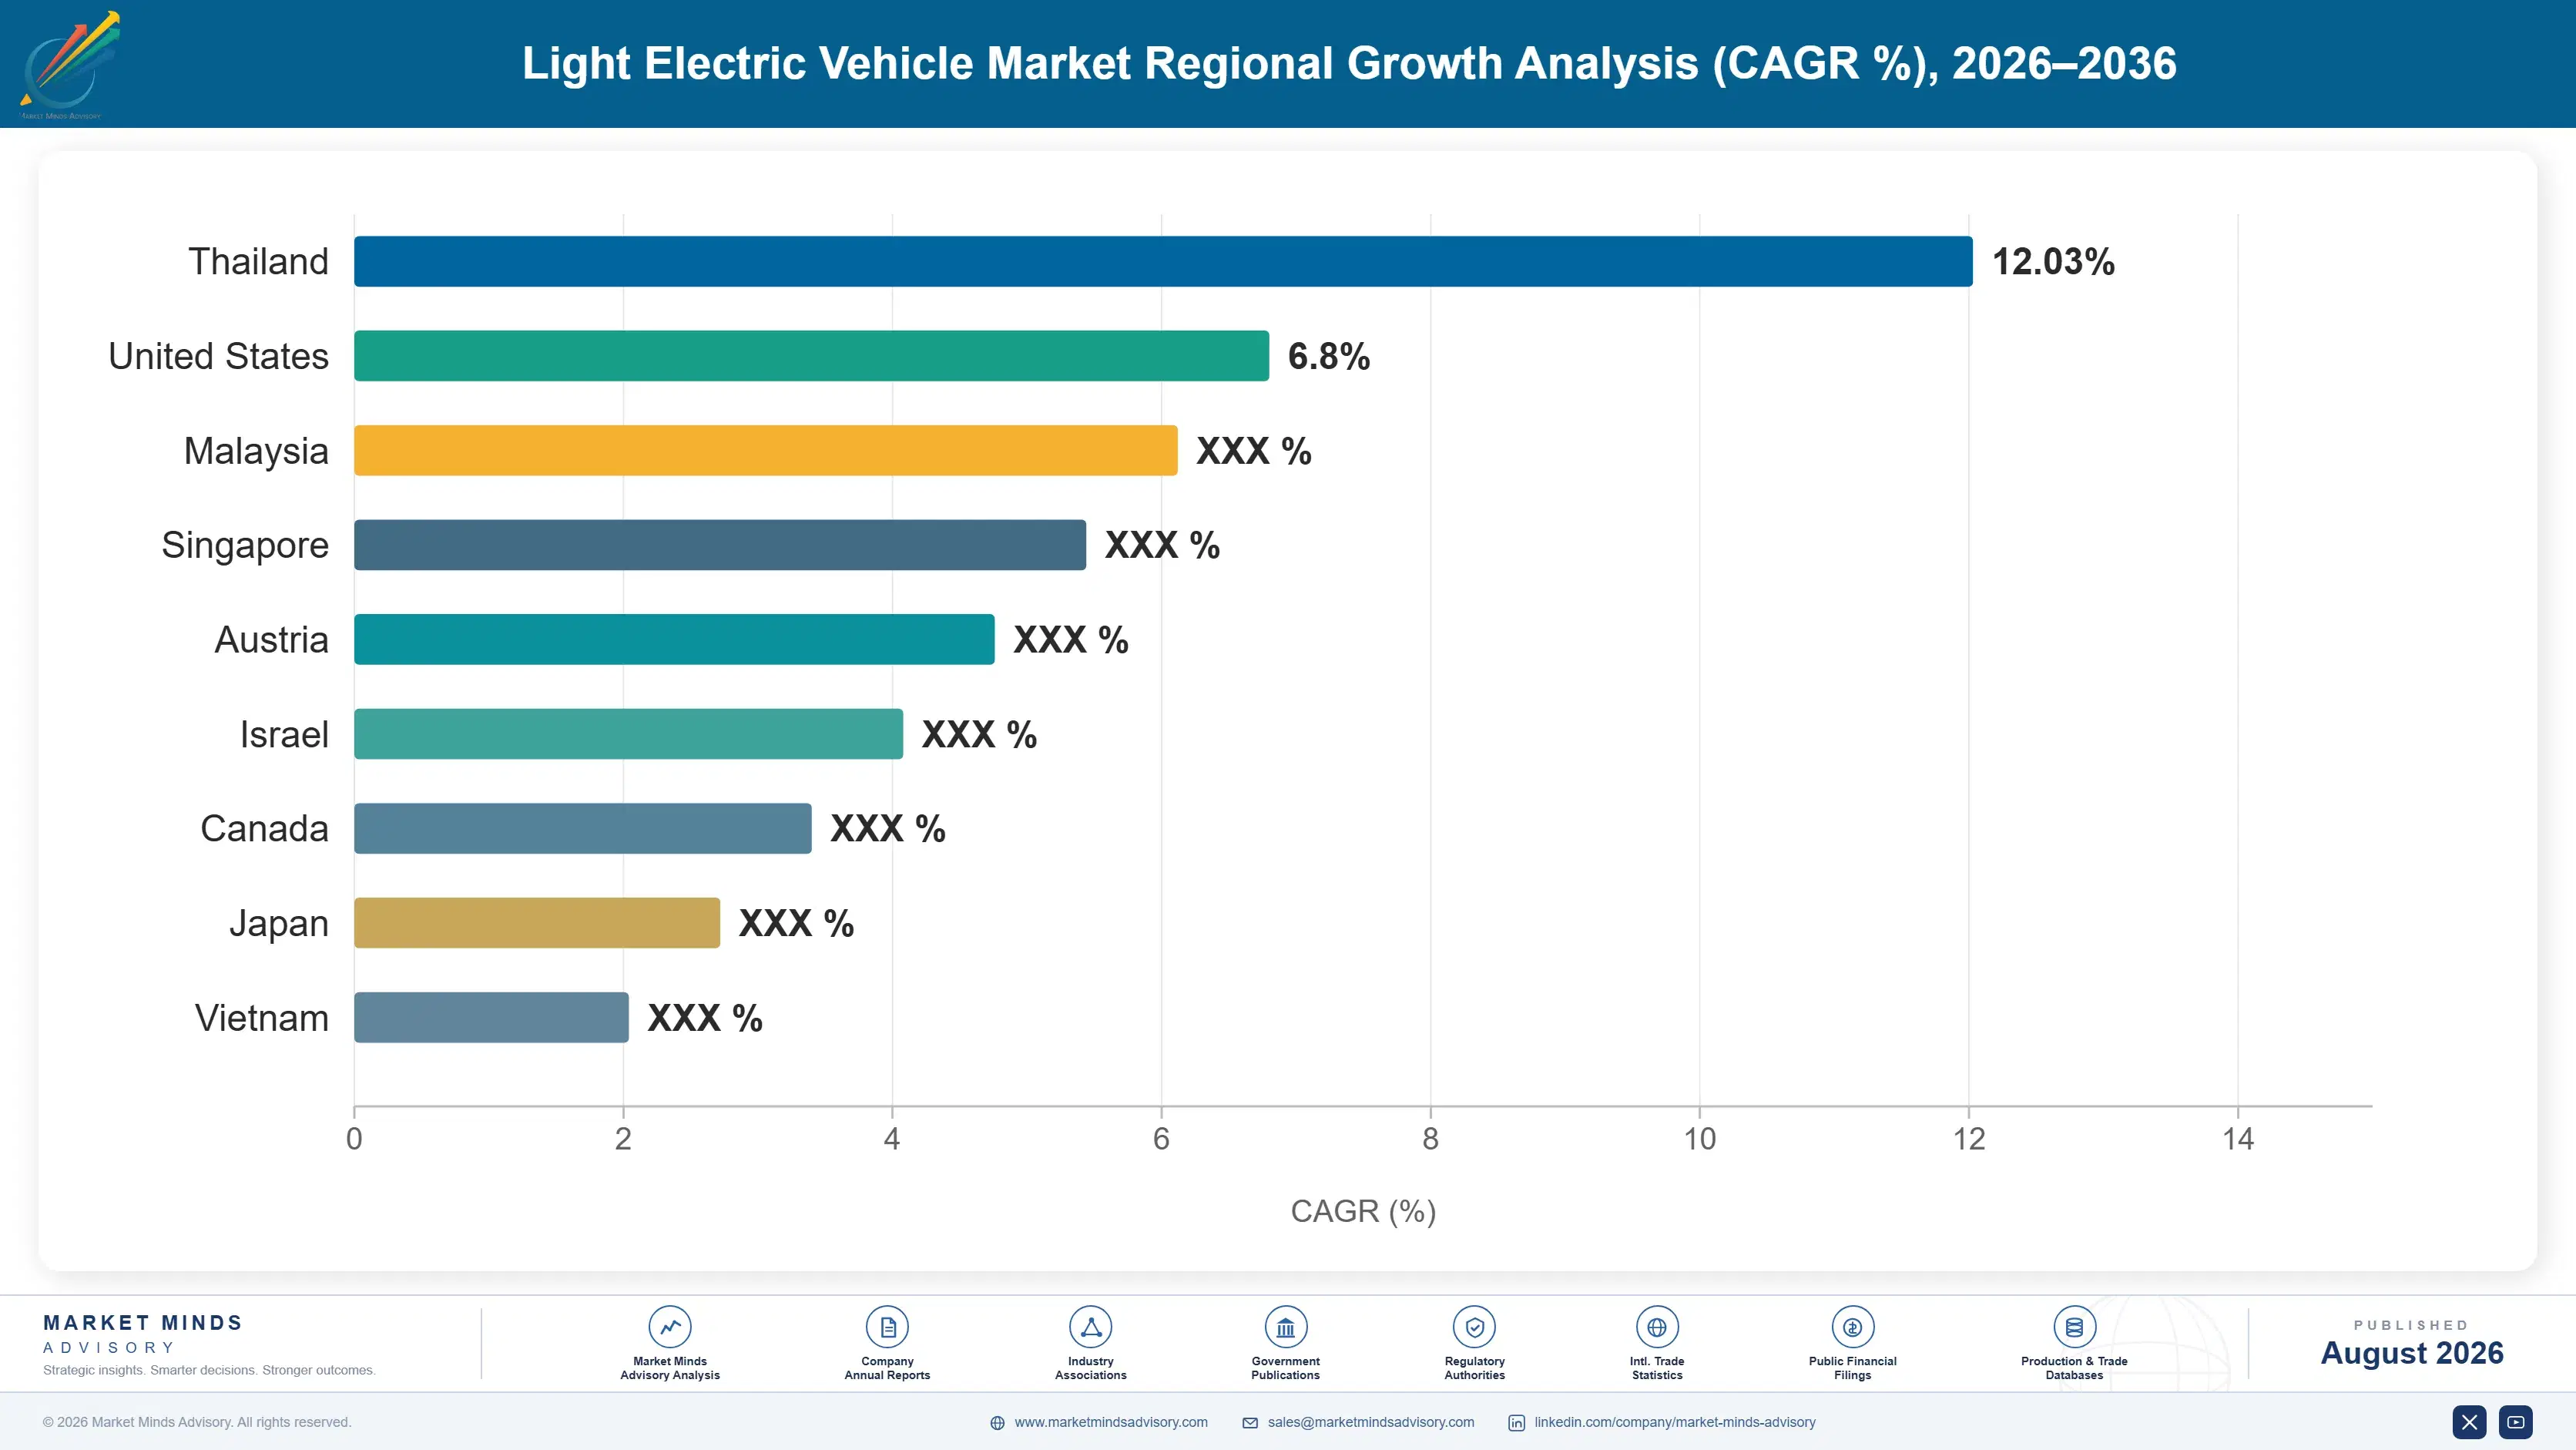
light-electric-vehicle-market-trends-country-cagr-analysis-1787554822652

Where Fleet and Cell Economics Create Margin

Margin in this category increasingly sits upstream of the vehicle badge, in cell allocation, swap-network access, and fleet contract structuring, rather than in retail brand strength or dealer network reach alone. The manufacturers capturing the largest share of that margin are the ones treating batteries and warranty terms as commercial assets, not engineering afterthoughts, across every vehicle format.

Lock Multi-Year LFP Cell Supply Contracts

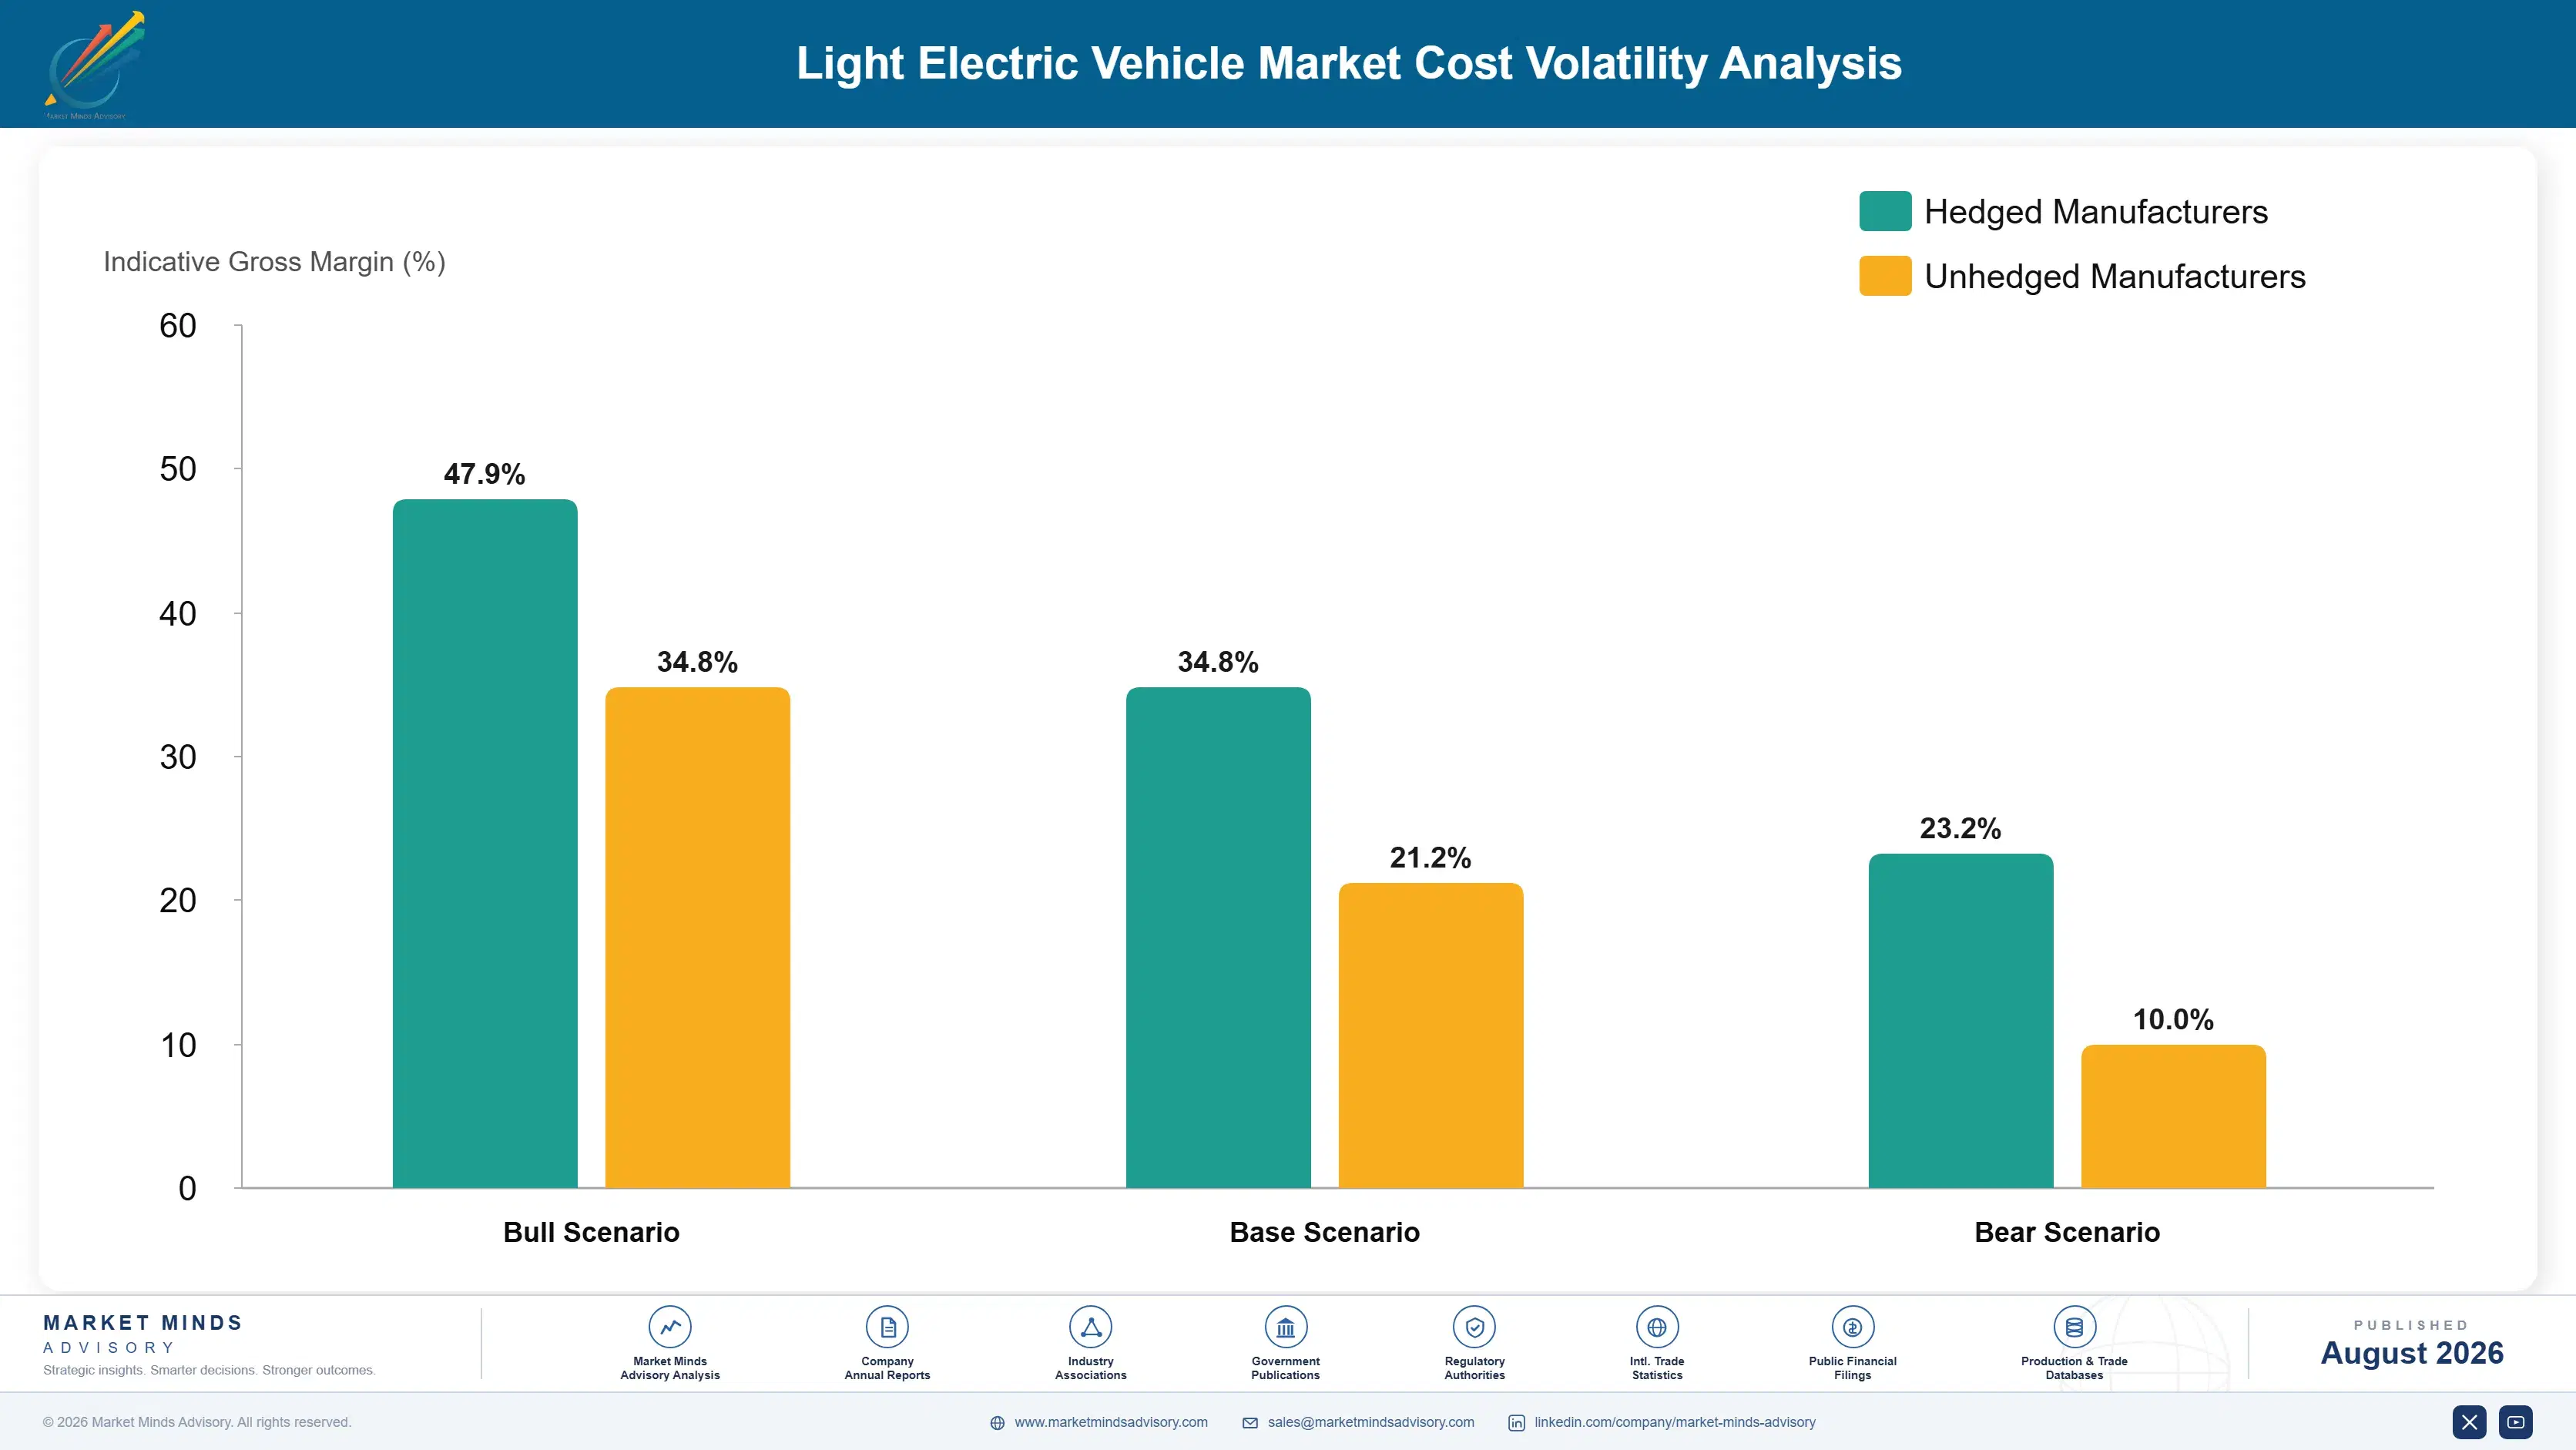
Manufacturers securing multi-year lithium iron phosphate cell allocation at fixed or collared pricing are extending warranty terms and cutting retail prices to capture fleet volume while smaller assemblers still buy on spot markets. Locked contracts have let leading Chinese manufacturers hold pack cost near USD 78 per kWh even as spot prices moved, a gap of roughly 12% to 18% against unhedged competitors. That cost advantage compounds directly into fleet contract wins, since delivery platforms award volume on total cost of ownership rather than brand loyalty. Suppliers without hedged cell access are increasingly forced into lower-margin regional niches.
Market Impact: Hedged buyers save 12% to 18% on cost

Build Battery-Swap Networks as a Standalone Revenue Line

Swap network operators including Gogoro, Sun Mobility, and Battery Smart are converting station infrastructure into a subscription revenue stream independent of vehicle sale, charging commercial riders a per-swap or monthly fee that can exceed vehicle depreciation cost over a multi-year period. This decouples revenue from unit sales cyclicality and creates switching costs that lock riders into a manufacturer's network for years. Sun Mobility has expanded past 4,000 stations across Indian metro areas by pricing swap subscriptions below the fuel cost riders previously paid for petrol equivalents, capturing volume even from competitors' vehicles through open-network partnerships.
Market Impact: Swap subscriptions add 15% to total annual revenue

Certify Fleet-Grade Warranty Tiers Separately From Retail

Manufacturers offering separate, longer warranty tiers specifically engineered for twelve-hour commercial duty cycles are winning delivery platform contracts that generic retail-warranty vehicles cannot qualify for. Fleet-grade certification typically extends battery and motor warranty coverage by 12 to 18 months beyond standard retail terms, in exchange for a price premium of 8% to 14% that fleet operators accept given their total cost of ownership math. Zomato, Swiggy, and several regional postal operators now specify fleet-grade warranty as a procurement requirement, effectively excluding retail-grade suppliers from these contracts regardless of unit price.
Market Impact: Fleet-grade warranty pricing commands an 8% to 14% premium

Localise Assembly to Qualify for Subsidy and Tariff Treatment

Manufacturers assembling inside India under PM E-DRIVE localisation requirements, or inside Poland and Hungary to reduce European Union anti-dumping duty exposure, are capturing subsidy-eligible or lower-tariff sales that fully imported competitors cannot access. Local assembly typically requires 12 to 24 months of investment before qualifying, but the resulting cost advantage against non-localised imports can reach 15% to 25% once duties and subsidy eligibility are combined. Yadea and several Indian joint ventures have already committed capital to domestic assembly specifically to preserve access to fleet subsidy programmes as eligibility rules tighten around import content.
Market Impact: Localisation cuts landed unit cost 15% to 25%

Who Controls the Margin Pool

Concentration sits at a modest CR5 of 28%, reflecting a category still fragmented across regional assemblers despite a handful of scaled leaders. Yadea Group Holdings leads on volume through vertically integrated cell and motor manufacturing, while the gap to mid-tier challengers is one of manufacturing scale rather than product differentiation, since most competitors license similar battery and motor architecture from a small pool of component suppliers concentrated around a handful of Chinese industrial hubs.
All participants are assessed on unit shipment volume, a consistent basis across bicycle, scooter, moped, and three-wheeler formats. Current competitive activity concentrates on three fronts: securing multi-year lithium iron phosphate cell allocation, building or partnering into battery-swap networks, and winning fleet contracts through dedicated warranty tiers rather than retail brand positioning, across India, China, and Southeast Asia simultaneously.

Emerging pressure comes from software-forward brands like NIU Technologies and Ola Electric, which compete on connected features, over-the-air updates, and subscription services rather than pure manufacturing scale. Rankings are likely to shift toward manufacturers who combine cell supply security with swap-network reach, since neither vehicle styling nor retail price alone is deciding fleet contract awards anymore, as delivery platforms consolidate purchasing decisions across categories.
light-electric-vehicle-market-trends-company-positioning-matrix-1787554823174

Competitive Moat and Risk Dimensions

YADEA GROUP HOLDINGS

Moat: Vertically integrated cell manufacturing

Yadea manufactures its own lithium iron phosphate cells and motor controllers at scale inside China, giving it cost and allocation certainty that assemblers buying cells on the open market cannot match. That integration lets it hold retail prices below most competitors while still extending fleet-grade warranty terms, a combination smaller rivals cannot fund without their own cell supply.
YADEA GROUP HOLDINGS

Risk: Exposure to European tariff escalation

A large share of Yadea's export volume into Europe faces anti-dumping duties that periodically tighten under European Commission review, and further increases would erode the cost advantage that its scale currently provides. The company is investing in European assembly to hedge this exposure, but that capacity is not yet large enough to offset tariff risk on its full export volume.
SEGWAY-NINEBOT LIMITED

Moat: Diversified format and brand portfolio

Segway-Ninebot spans self-balancing vehicles, kick scooters, and e-bikes under a single engineering platform, giving it cross-format component leverage and brand recognition that single-format competitors lack. Its shared-micromobility relationships with operators like Lime and Bird also give it demand visibility into fleet retirement cycles ahead of most rivals.
SEGWAY-NINEBOT LIMITED

Risk: Shared-fleet channel concentration risk

A meaningful portion of Segway-Ninebot's scooter volume sells into shared-mobility operator fleets, a channel that has seen repeated operator bankruptcies and consolidation over the past few years. Continued financial distress among shared-scooter operators would remove a significant demand channel faster than consumer retail sales could replace it.

Players Tracked

Prominent Players

Yadea Group Holdings
NIU Technologies
Segway-Ninebot Limited
Giant Manufacturing Co. Ltd.
Trek Bicycle Corporation

Other Key Players

Rad Power Bikes
Lime Inc.
Bird Global
Bajaj Auto Limited
TVS Motor Company
Hero Electric Vehicles
Ather Energy
Gogoro Inc.
Vmoto Limited
Sunra E-Vehicle Group
Aima Technology Group
Merida Industry Co. Ltd.
Specialized Bicycle Components
Pon Holdings B.V.
Piaggio & C. SpA

Recent Developments

MARCH 2025

Gogoro Expands Battery-Swap Joint Venture Into India

Gogoro signed an expanded joint venture agreement with an Indian partner to deploy its battery-swap network across additional metro areas, building on an earlier agreement covering Belagavi and Delhi NCR. The arrangement was structured as a joint venture, not an acquisition, targeting commercial delivery riders as early adopters.
Signal: Joint venture structure, not an outright acquisition, signals a capital-light approach to international swap-network expansion this year.
JUNE 2025

Yadea Announces European Assembly Investment

Yadea announced a capital commitment to expand assembly capacity inside a European Union member state, aiming to qualify more of its sales for reduced anti-dumping duty treatment. The move was an organic capacity expansion, not an acquisition or joint venture, reflecting Yadea's preference for wholly owned manufacturing control.
Signal: Organic capacity build, not an acquisition or joint venture, shows tariff-driven localisation is now a direct cost imperative.
SEPTEMBER 2025

TVS Motor Acquires Minority Stake in Battery Technology Startup

TVS Motor Company acquired a minority equity stake in an Indian battery cell technology startup developing fast-charging lithium iron phosphate chemistry for two- and three-wheeler applications. The transaction was an equity investment, not a full acquisition or merger, giving TVS early access to the technology without integration risk.
Signal: Minority stake structure lets established incumbents hedge emerging battery technology bets without committing full acquisition capital upfront.

Cell Chemistry and Motor Controller Exposure

Lithium iron phosphate battery packs account for roughly 34% of unit cost, sourced overwhelmingly from Chinese cathode and cell manufacturers including CATL and BYD's battery division, with motor and controller electronics adding a further 18% to 22% sourced from a similarly concentrated Chinese supplier base. Frame and body components, largely steel and aluminium, make up most of the remainder.
Lithium carbonate prices spiked sharply through 2022 as electric vehicle demand outran mining and refining capacity, before falling back substantially through 2023 and 2024 as Chinese supply expanded faster than demand. The IEA's Global EV Outlook has repeatedly flagged this volatility as a persistent feature of the battery supply chain rather than a one-time event, and manufacturers without hedged contracts absorbed margin compression directly during the 2022 spike while hedged competitors held pricing steady.

Exposure varies sharply by manufacturer type. Vertically integrated Chinese giants like Yadea, which manufacture their own cells, captured the 2023 to 2024 price decline directly into margin, while smaller regional assemblers buying cells on spot or short-term contracts saw costs lag the broader decline by two to three quarters. That gap leaves non-integrated manufacturers persistently disadvantaged on price during declines.
light-electric-vehicle-market-trends-cost-volatility-analysis-1787554823369

Negotiate multi-year cell supply contracts with price collars

Locking cell pricing within a defined band across multi-year contracts protects against spikes while still capturing most of any broader price decline. This requires forecasting volume commitments further out than most assemblers are accustomed to, but it removes the quarter-to-quarter cost volatility that makes fleet pricing difficult to plan around. Suppliers sharing that forecasting risk typically extend better terms.

Vertically integrate cell or pack assembly where volume justifies it

Manufacturers shipping sufficient volume can justify investing in in-house pack assembly, even without full cell manufacturing, capturing margin currently paid to third-party pack integrators. This also shortens lead times for fleet-grade warranty customisation that generic third-party packs cannot easily support. It also gives manufacturers direct visibility into cell quality and failure rates, information third-party integrators rarely share in useful detail.

Diversify motor controller sourcing beyond single-region suppliers

Qualifying a second motor controller supplier outside the dominant Chinese cluster, even at a modest cost premium, reduces exposure to any single regional disruption. Several manufacturers have begun qualifying Vietnamese and Indian controller suppliers specifically to hedge this concentration risk. That dual-sourcing approach adds a small percentage to unit cost but has already prevented shipment delays during regional logistics disruptions.

Portfolio Architecture for Margin Defence

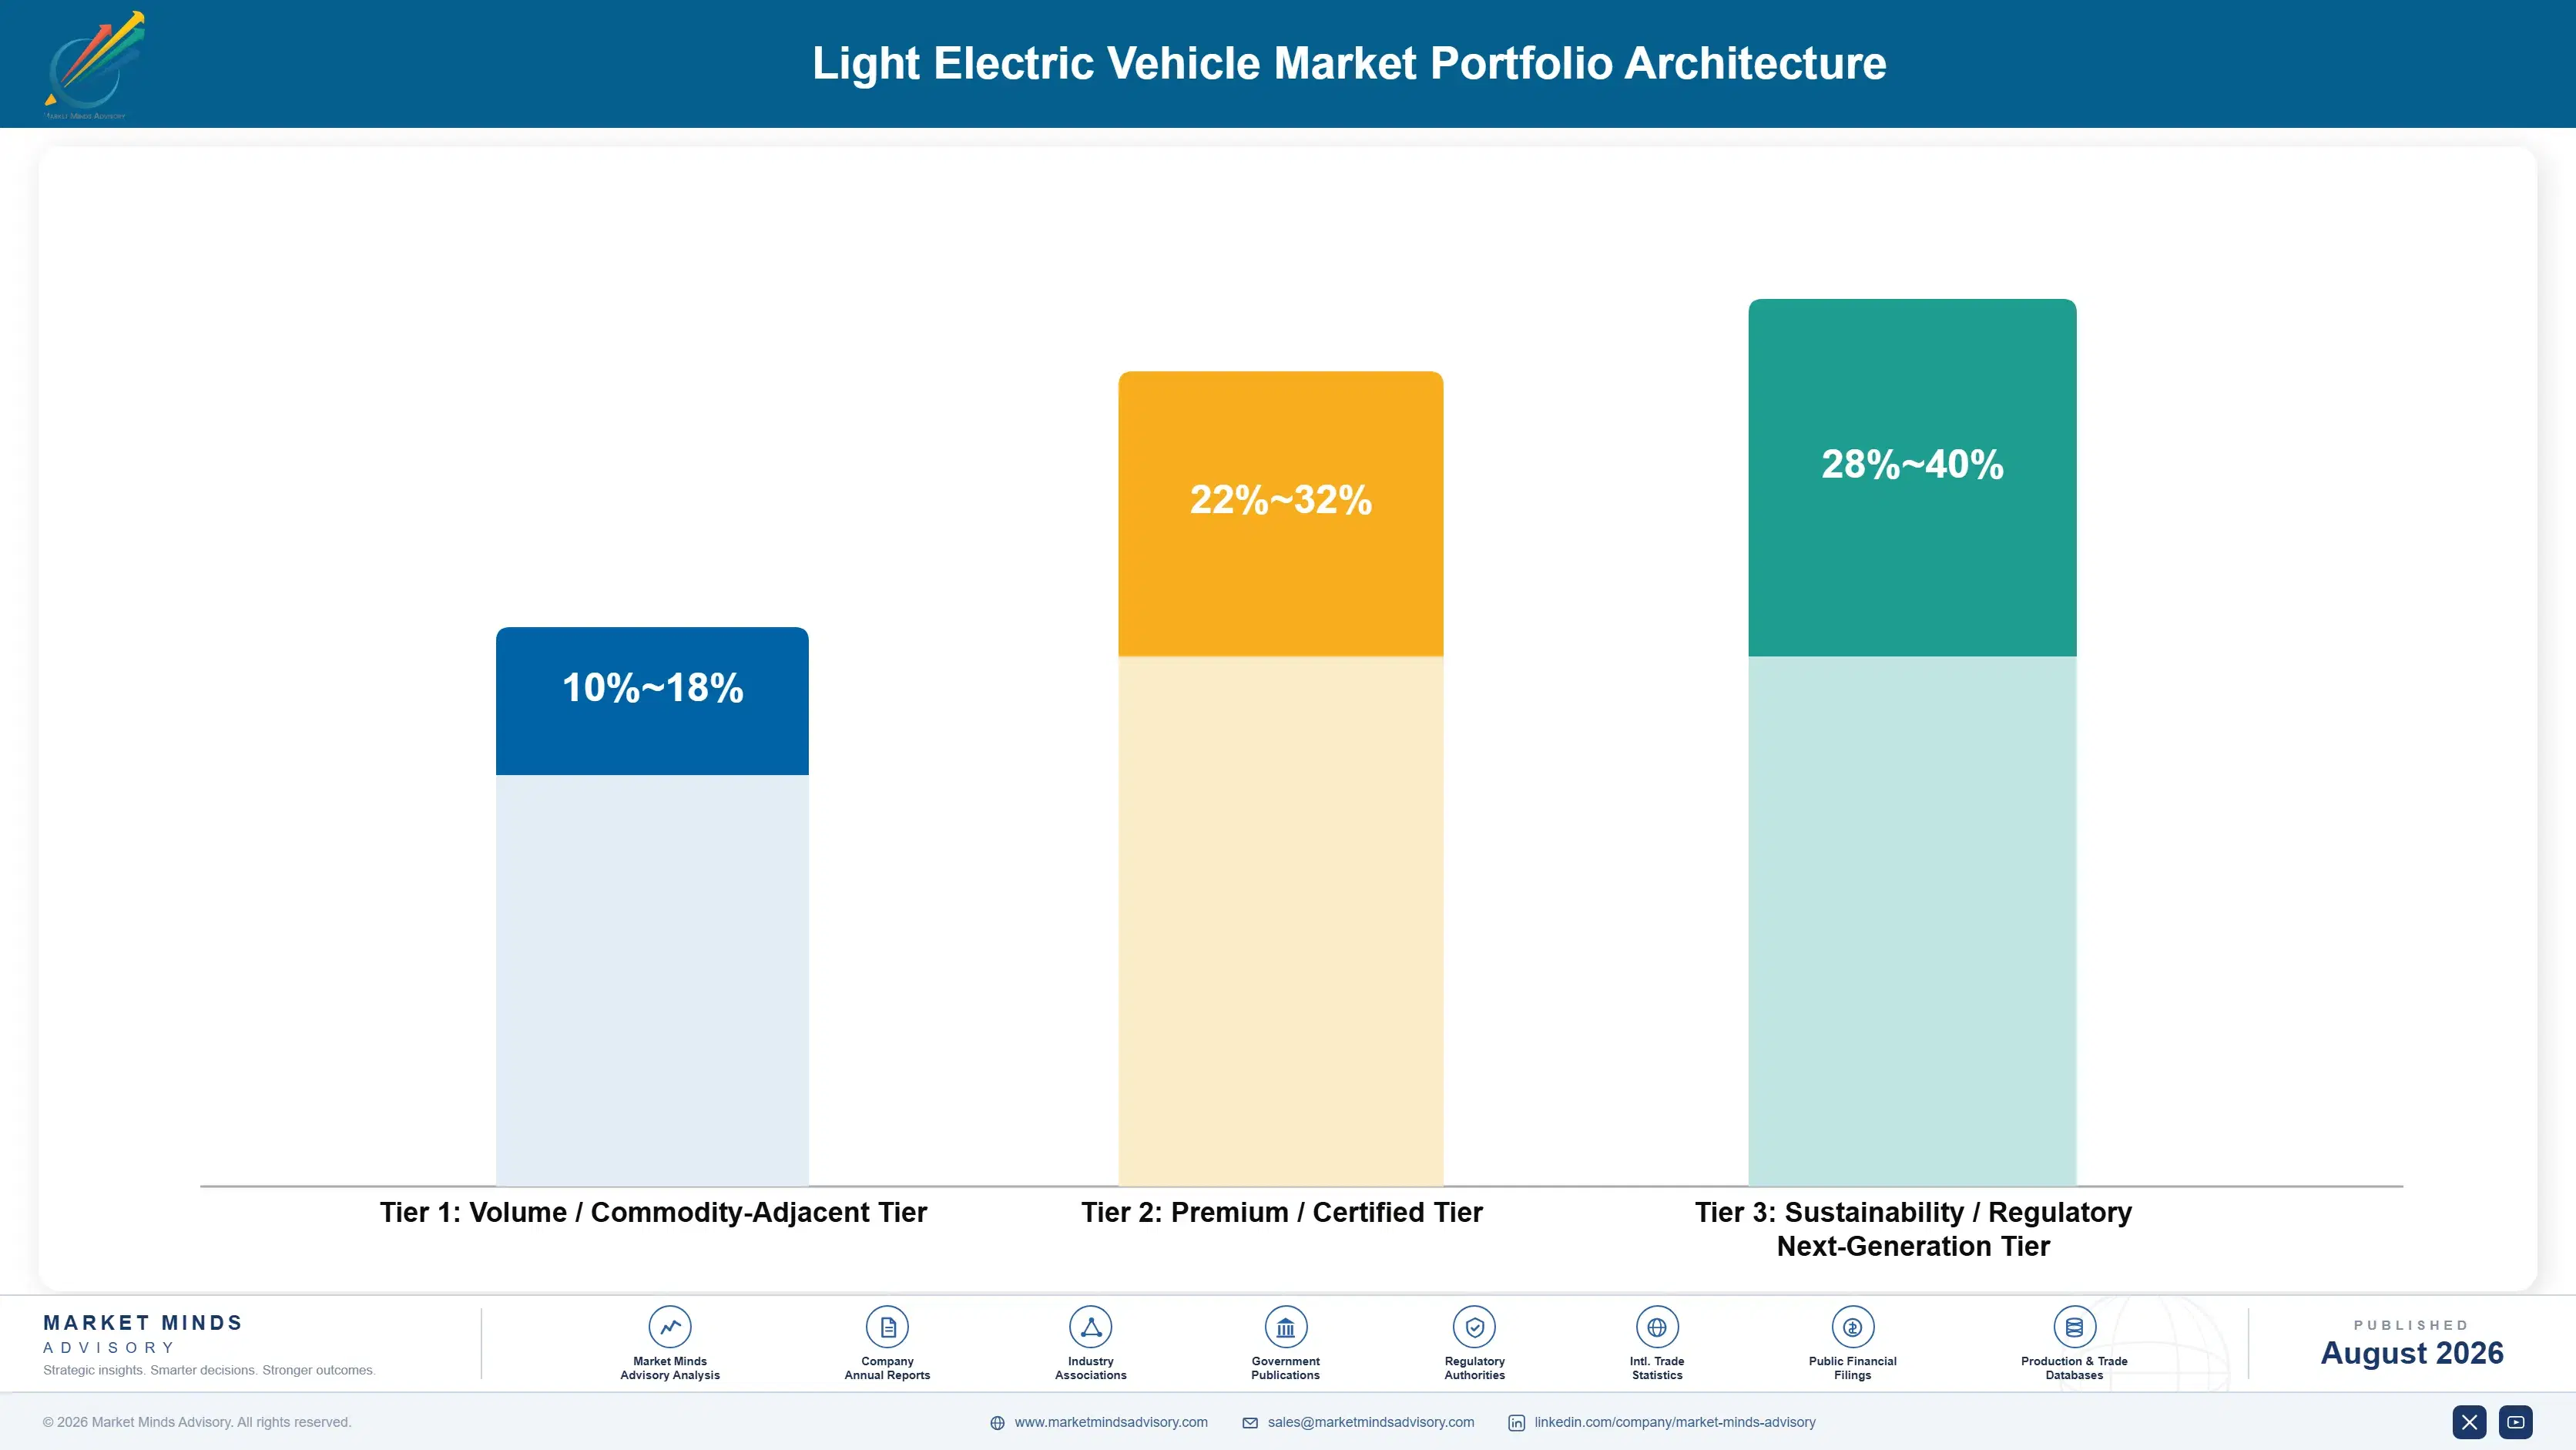
The portfolio splits into three tiers with meaningful margin separation tied directly to cell supply security and channel access. Volume-tier vehicles compete on price against petrol equivalents and earn thin margins, premium-tier vehicles with swap-network integration and fleet-grade warranty earn considerably more, and next-generation connected models carry the highest margin but the smallest current volume, reflecting how early software and subscription revenue still sits in its adoption curve.
The tension between volume and premium reflects buyer type: fleet buyers reward total cost of ownership over features, pulling manufacturers toward cost-focused engineering, while retail consumers increasingly pay for connected features and swap convenience that raise both cost and price. Manufacturers running both product lines simultaneously must manage distinct engineering, warranty, and sales organisations without diluting either positioning. Manufacturers that pick one lane exclusively risk ceding the other to a more focused competitor.

High-value margin pools concentrate in fleet-grade three-wheelers and mopeds carrying swap-network subscriptions, where recurring revenue and warranty premiums combine. The volume core of standard consumer e-bikes and scooters remains necessary for scale and brand reach but contributes comparatively little to blended margin. Manufacturers unable to reach either pool are increasingly squeezed into contract manufacturing arrangements with thinner margins still.

Volume / Commodity-Adjacent Tier

Standard consumer e-bikes and scooters competing directly against petrol two-wheelers and lower-cost regional assemblers on price, with limited feature differentiation and thin brand loyalty, where component cost and manufacturing scale determine who survives on margin alone.
Gross Margin: 10-18%

Premium / Certified Tier

Fleet-grade three-wheelers and mopeds carrying extended warranty and swap-battery compatibility, sold primarily into delivery and postal fleet contracts where total cost of ownership, not sticker price, decides every procurement award.
Gross Margin: 22-32%

Sustainability / Regulatory / Next-Generation Tier

Connected, software-enabled models carrying subscription services and over-the-air updates, plus vehicles engineered specifically for subsidy-linked local content requirements that reward manufacturers investing early in regional assembly capacity ahead of policy deadlines.
Gross Margin: 28-40%
light-electric-vehicle-market-trends-portfolio-architecture-1787554823873

High-value Sub-segments and Strategic Watch-out

Electric Three-Wheelers

High value and the fastest-growing format at 13.5% CAGR, carrying fleet-grade warranty premiums and swap-subscription revenue that recur well beyond the initial vehicle sale. The wide margin range reflects varying swap-network penetration across markets rather than manufacturing cost differences between competing suppliers across the region.
Gross Margin: 22-32%

Connected Electric Mopeds

High value with moderate growth, carrying subscription software revenue alongside the initial vehicle sale rather than replacing it entirely. Margin varies with subscription attach rates, which differ substantially between markets with strong swap-network coverage and those still building out basic charging infrastructure for commercial riders.
Gross Margin: 28-40%

Standard Consumer E-Bikes

The volume core, competing directly on price against petrol scooters and a crowded field of regional assemblers worldwide. Margin stays thin and the range is narrow because component cost, not brand recognition, dominates pricing decisions across this tier almost entirely, leaving little room for premium positioning.
Gross Margin: 10-18%

Shared-Fleet Kick Scooters

The strategic watch-out, dependent almost entirely on shared-mobility operator financial health, which has proven volatile through repeated operator bankruptcies and consolidation in recent years. Margin range is wide because contract terms shift sharply with operator negotiating leverage rather than with underlying vehicle cost or manufacturing quality.
Gross Margin: 8-24%

Duty Cycles and Ownership Transitions

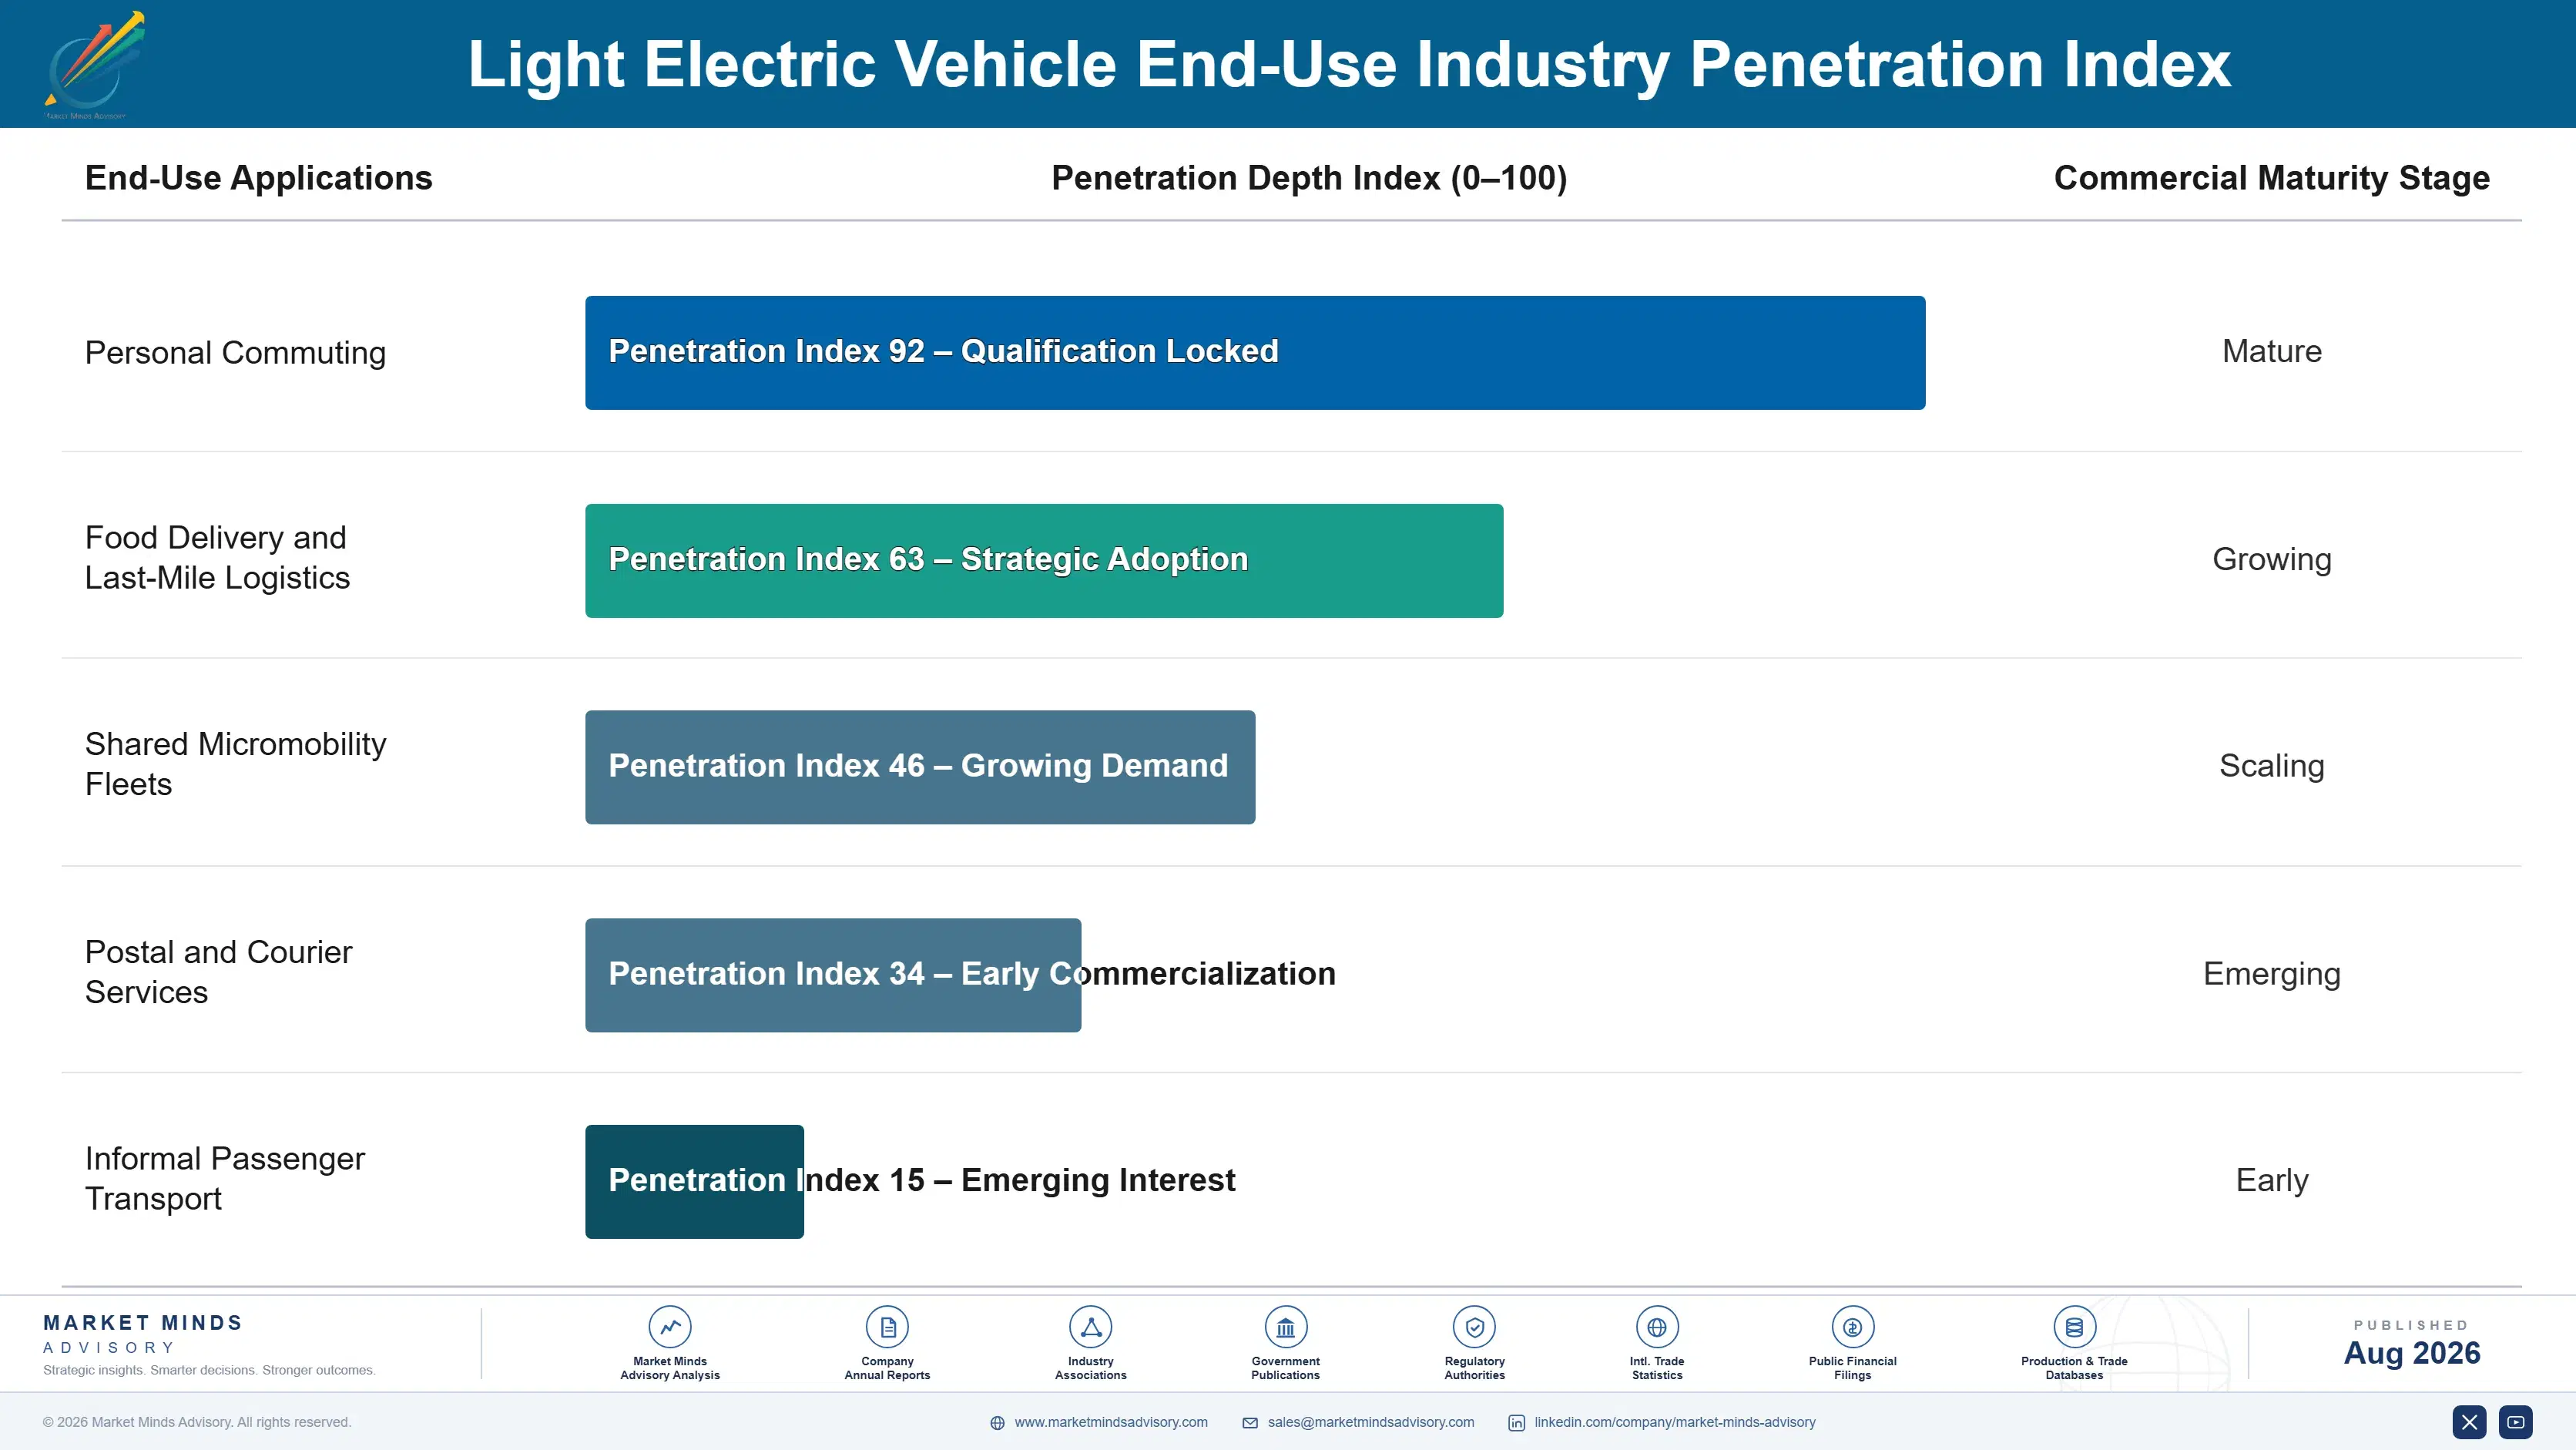
Demand behaves like an annuity for fleet buyers once a vehicle platform is qualified: delivery operators standardise around a single fleet-grade specification for years, repurchasing the same platform as vehicles retire on a three to four year cycle rather than re-evaluating suppliers each time. That repeat-purchase pattern gives incumbent fleet suppliers a durable revenue base once a contract is won. Switching suppliers mid-contract is rare in practice.
Adoption depth varies sharply by vertical. Food delivery and postal fleets have converted deepest, since duty cycles are predictable and total cost of ownership math favours electric decisively. Personal commuting adoption runs shallower and more price-sensitive, while personal three-wheeler ownership for informal passenger transport sits between the two, constrained more by financing access than by vehicle economics. That gap is widening, not narrowing.

Buyer profiles are shifting generationally. Younger fleet operations managers increasingly default to electric specifications without evaluating petrol alternatives at all, treating combustion two-wheelers as a legacy option rather than a genuine comparison. That default is spreading faster among urban logistics operators than among rural or informal transport operators, who still weigh upfront cost most heavily. Older informal-sector operators still evaluate case by case.
light-electric-vehicle-market-trends-end-use-penetration-index-1787554824362

Cell Supply Beats Vehicle Design

These are among the four positions where our research anticipates prominent divergence between winners and laggards over the coming forecast period. Each is grounded in the demand model, the regulatory perimeter, and the announced capacity pipeline.
01 / BATTERY SUPPLY STRATEGY

Manufacturers without hedged LFP cell contracts will lose fleet share by 2028

Fleet buyers award contracts on total cost of ownership, and cell cost is the single largest lever inside that calculation. Manufacturers still buying lithium iron phosphate cells on spot markets cannot match the pricing stability that vertically integrated or contract-hedged competitors offer delivery platforms planning multi-year fleet rollouts. As fleet contracts grow to represent a larger share of total category volume, this gap compounds rather than narrows, pushing unhedged manufacturers toward smaller regional niches where volume does not justify long-term supply negotiation.
02 / SWAP NETWORK POSITIONING

Battery-swap access will decide moped and three-wheeler share more than styling

Swap-network subscriptions remove the battery from the upfront vehicle price entirely, which changes purchase decisions for commercial riders more than any styling or brand consideration could. Operators like Gogoro and Sun Mobility are building switching costs into their networks that lock riders in for years once adopted. Manufacturers without swap-network partnerships or their own infrastructure will find themselves competing purely on upfront price against subsidised, swap-enabled competitors, a contest they are unlikely to win in commercial fleet channels specifically, a dynamic that favours early movers decisively.
03 / REGULATORY LOCALISATION STRATEGY

Local assembly will become mandatory for subsidy-eligible fleet sales

India's PM E-DRIVE localisation requirements and the European Union's anti-dumping duty structure both reward domestic or regional assembly over pure imports, and neither policy shows signs of loosening. Manufacturers that have already committed capital to local assembly, including Yadea's European investment and several Indian joint ventures, will hold a durable cost and eligibility advantage over import-only competitors within the next several years. Waiting to localise risks losing subsidy-eligible fleet contracts entirely to earlier movers, since capital committed today compounds into an advantage competitors cannot quickly replicate.
04 / SOFTWARE FEATURE DIFFERENTIATION

Connected features will separate premium brands from commodity assemblers

As cell and motor hardware commoditises across the industry, connected features, over-the-air updates, and subscription services are becoming the primary differentiator for consumer-facing brands like NIU Technologies and Ola Electric. This shift mirrors what happened earlier in passenger electric vehicles, where software capability increasingly determines brand positioning independent of underlying hardware similarity. Manufacturers without software development capability will find themselves competing purely on price within the volume tier, unable to access the margin premium software-forward competitors command, a gap that will only widen as buyers grow more selective.

Engagement Snapshot From the Field

A live engagement with an industry participant carrying material or product regulatory and market exposure ahead of a defining policy shift, showing how our research translates into a defensible multi-year portfolio strategy.
MARKET MINDS ADVISORY · CLIENT ENGAGEMENT SUMMARY
Light Electric Vehicle Producer Strategic Portfolio Review and Transition Roadmap 2026·Investment Scenario on Light Electric Vehicle Exposure Evaluation 2025-26
CLIENT PROFILE
A regional food delivery platform operating across three Southeast Asian countries approached MMA while evaluating a full conversion of its rider fleet from petrol scooters to electric mopeds and three-wheelers. The client reported over 80,000 active delivery riders and annual fuel and maintenance expenditure exceeding USD 140 million across its combined rider network (client-reported, unverified by MMA).
STRATEGIC CHALLENGE
Management believed electrification would cut operating cost but had not quantified battery-swap infrastructure investment against outright vehicle ownership, nor evaluated how rider retention would be affected by requiring riders to adopt unfamiliar vehicle types. The finance team wanted rapid payback; the operations team worried about rider attrition during any transition period.
MMA APPROACH
MMA modelled total cost of ownership under three infrastructure scenarios: owned vehicles with no swap network, owned vehicles with third-party swap partnership, and a rider-financed lease-to-own model. We benchmarked rider attrition risk against comparable electrification rollouts in India's delivery sector and assessed swap-network partner options including Gogoro and two regional operators.
KEY FINDINGS
  1. A rider-financed lease-to-own model with third-party swap access reduced client capital outlay by roughly 70% against fully owned fleet electrification (client-reported, unverified by MMA).
  2. Rider attrition risk was concentrated in the first ninety days after conversion, driven mainly by unfamiliarity with swap station locations rather than vehicle performance concerns.
  3. Breakeven against continued petrol scooter operation arrived within fourteen months under the swap-partnership scenario, versus over three years for fully owned vehicles without swap access.
  4. Two of three evaluated swap-network partners lacked sufficient station density in the client's secondary cities, requiring a phased rollout starting in primary metro markets only.
CLIENT PROFILE
A regional food delivery platform operating across three Southeast Asian countries approached MMA while evaluating a full conversion of its rider fleet from petrol scooters to electric mopeds and three-wheelers. The client reported over 80,000 active delivery riders and annual fuel and maintenance expenditure exceeding USD 140 million across its combined rider network (client-reported, unverified by MMA).
STRATEGIC CHALLENGE
Management believed electrification would cut operating cost but had not quantified battery-swap infrastructure investment against outright vehicle ownership, nor evaluated how rider retention would be affected by requiring riders to adopt unfamiliar vehicle types. The finance team wanted rapid payback; the operations team worried about rider attrition during any transition period.
MMA APPROACH
MMA modelled total cost of ownership under three infrastructure scenarios: owned vehicles with no swap network, owned vehicles with third-party swap partnership, and a rider-financed lease-to-own model. We benchmarked rider attrition risk against comparable electrification rollouts in India's delivery sector and assessed swap-network partner options including Gogoro and two regional operators.
KEY FINDINGS
  1. A rider-financed lease-to-own model with third-party swap access reduced client capital outlay by roughly 70% against fully owned fleet electrification (client-reported, unverified by MMA).
  2. Rider attrition risk was concentrated in the first ninety days after conversion, driven mainly by unfamiliarity with swap station locations rather than vehicle performance concerns.
  3. Breakeven against continued petrol scooter operation arrived within fourteen months under the swap-partnership scenario, versus over three years for fully owned vehicles without swap access.
  4. Two of three evaluated swap-network partners lacked sufficient station density in the client's secondary cities, requiring a phased rollout starting in primary metro markets only.
RECOMMENDED STRATEGY
Phase 1: Phase 1 (0 to 4 months): Pilot rider-financed lease-to-own conversion with swap partnership in the single primary metro market with adequate station density. Phase 2: Phase 2 (4 to 12 months): Expand to secondary cities only after swap partner commits to station density targets, tracking rider attrition weekly. Phase 3: Phase 3 (12 to 24 months): Scale to full fleet conversion across all three countries, renegotiating swap partnership terms based on Phase 1 and 2 volume data.
OUTCOME
The client proceeded with the phased lease-to-own approach, converting its primary metro market fleet within the recommended timeline. Rider attrition stayed below the modelled worst case, and the client reported fuel and maintenance savings reaching roughly USD 38 million annualised across the converted fleet segment within eighteen months (client-reported, unverified by MMA).

Frequently Asked Questions

Foundational context covering the market sizes, CAGR, scope, country, region and competition that inform every finding below. This section is provided to cover basics and most often pre-purchase conversations, answered from the MMA Primary Research Dataset.

What is the current size of the Light Electric Vehicle Market?

The Light Electric Vehicle Market stood at USD 34.5 billion in 2025, based on MMA Primary Research Dataset estimates. Fleet electrification among delivery and postal operators is the primary near-term demand driver.

How large will the Light Electric Vehicle Market be by 2036?

MMA projects the market reaching USD 96.48 billion by 2036 under the base case scenario. That represents a 2.55 times expansion over the 2026 base value.

What is the CAGR for the Light Electric Vehicle Market 2026 to 2036?

The base case CAGR is 9.8% annually. The bull case reaches 11.0% and the bear case falls to 8.6%, depending on subsidy continuity and cell price trends.

Which segment is growing fastest?

Electric three-wheelers grow fastest at 13.5% CAGR, about 1.38 times the overall market rate. Commercial passenger and cargo fleet conversion across India and Southeast Asia drives that growth.

Who are the major companies in the Light Electric Vehicle Market?

Yadea Group Holdings, NIU Technologies, Segway-Ninebot Limited, Giant Manufacturing, and Trek Bicycle Corporation lead the category. Combined, the top five hold a CR5 of 28%.

Which country is growing fastest?

India grows fastest at 15.2% CAGR, driven by the PM E-DRIVE subsidy scheme and rapid electric three-wheeler fleet conversion. Battery-swap network expansion is reinforcing that adoption pace.

Report Segmentation Architecture

The full report scope spans multiple orthogonal segmentation dimensions, with cross-tabulated demand data provided for each dimension pair. Coverage extends further to regional breakdowns, trend trajectories, and the competitive detail needed to support segment-level decision-making.

By Vehicle Format

  • Electric Bicycles
  • Electric Scooters
  • Electric Mopeds and Low-Speed Motorcycles
  • Electric Three-Wheelers
  • Self-Balancing Personal Transporters
  • Neighborhood and Utility Electric Vehicles

By End-Use Industry

  • Personal Commuting
  • Food Delivery and Last-Mile Logistics
  • Shared Micromobility Fleets
  • Postal and Courier Services
  • Informal Passenger Transport

By Commercial Dimension

  • Direct Consumer Retail
  • Fleet Procurement Contracts
  • Battery-Swap Subscription Channel
  • Dealer and Distributor Network

By Region

  • North America
  • Western Europe
  • East Asia
  • South Asia and Pacific
  • Latin America
  • Middle East and Africa
  • Eastern Europe

Scope, Methodology, and Coverage

Every figure in this report is reproducible from documented input assumptions. The scope below maps the historical period, the forecast horizon, the segmentation dimensions, and the countries covered, alongside the underlying primary and qualitative methodology.
Historical Period
2020 to 2025
Forecast Period
2026 to 2036
Base Year
2025 (USD billions; MMA Primary Research Dataset, August 2026)
Market Definition
The light electric vehicle market comprises battery-electric bicycles, scooters, mopeds, low-speed motorcycles, three-wheelers, self-balancing personal transporters, and neighborhood utility vehicles rated below highway motorcycle classification, including associated battery-swap subscription revenue. Electric passenger cars, heavy electric trucks, and shared micromobility operating revenue are excluded.
Quantitative Units
USD billions (current prices); unit shipments in millions where applicable
Segmentation Dimensions
By Vehicle Format; By End-Use Industry; By Commercial Dimension; By Region
Regions Covered
North America, Western Europe, East Asia, South Asia and Pacific, Latin America, Middle East and Africa, Eastern Europe
Countries Covered
USA, China, Germany, France, UK, Japan, South Korea, India, Australia, Canada, Brazil, Mexico, Indonesia, Vietnam, Thailand, Malaysia, UAE, Saudi Arabia, South Africa, Nigeria, Turkey, Poland, Netherlands, Italy, Spain, Sweden, Switzerland, Argentina, Colombia, Singapore, and additional markets relevant to this sector
Key Companies Profiled
Yadea Group Holdings, NIU Technologies, Segway-Ninebot Limited, Giant Manufacturing Co. Ltd., Trek Bicycle Corporation, Rad Power Bikes, Lime Inc., Bird Global, Bajaj Auto Limited, TVS Motor Company, Hero Electric Vehicles, Ather Energy, Gogoro Inc., Vmoto Limited, Sunra E-Vehicle Group, Aima Technology Group, Merida Industry Co. Ltd., Specialized Bicycle Components, Pon Holdings B.V., Piaggio & C. SpA
Quantitative Methodology
Primary survey, n=3,800 respondents, Q4 2025, six countries; demand-side model with trade association cross-validation
Qualitative Methodology
47 expert interviews, Q4 2025; applied to validate demand model assumptions, identify emerging dynamics, and assess competitive positioning
Report Format
PDF and XLSX data workbook (Word format preview document)
Publisher
Market Minds Advisory
Report Code
MMA-2026-AUT-118
Published
August 2026
Contact
sales@marketmindsadvisory.com | www.marketmindsadvisory.com

Purchase the full Light Electric Vehicle Market Report (2026 to 2036).

The full MMA Light Electric Vehicle report sizes the market across six vehicle formats, five end-use industries, four commercial channels, and seven regions through 2036. It profiles 20 manufacturers on a consistent unit shipment volume basis, scoring each on cell supply security, swap-network access, and fleet contract exposure. Scenario models quantify how subsidy continuity, cell price movements, and tariff escalation shift both volume and realised price across formats. The report also includes delivered-cost modelling by format, a fleet contract exposure screen, and battery-swap network coverage analysis built for manufacturer strategy, investment, and fleet procurement teams.
Six-format segmentation with cross-tabulated regional demand
Twenty-company competitive benchmarking on shipment volume
Battery-swap network coverage and subscription economics
Fleet contract exposure and warranty tier analysis
Cell price scenario modelling through 2036
Country-level subsidy and tariff policy tracking

Built For The People Who Decide

From boardroom strategy to bench-side execution, this report is read cover-to-cover by leaders shaping the next decade of their industry, turning demand scenarios, market dynamics and valuation benchmarks into decisions.
CXOs/ Presidents/ VPs/ Managers
M&A and Corporate Development
Strategy Teams and R&D Heads
Procurement and Product Directors
Regulatory and Compliance Leaders
Investor Relations and Equity Analysts