Market Minds Advisory
Leukemia Therapeutics Treatment Market

Leukemia Therapeutics Treatment Market: Curative-Intent Therapy Reshapes Treatment Economics

CAR-T cell therapy expansion and next-generation bispecific T-cell engagers are reshaping leukemia treatment beyond conventional chemotherapy and tyrosine kinase inhibitors, while manufacturing capacity constraints and payer reimbursement complexity limit these curative-intent therapies from reaching patients.

Lead Analyst

Alice Ballenger

Published

September 2026

Make Smarter Decisions with Customized Research Insights

Request a free sample report and evaluate market opportunities, growth trends, and competitive dynamics relevant to your business needs.

2025 MARKET VALUE$18.5BMarket Size 2025
2036 FORECAST VALUE$49.8BBase Case , 2026 to 2036
CAGR 2026 TO 20369.4 %Bull 10.7% / Bear 8.1%
INCREMENTAL OPPORTUNITY$29.5BNet 10- year value creation
EXPANSION MULTIPLE2.46x2036 value over 2026 base
Strategic Levers
M&A Pipeline
Regional Outlook
Country Rankings
Competitive Intelligence
Segmental Deep-dive
Call-Us : 91 93563 13602

Executive Snapshot and Market Trajectory

Leukemia treatment is shifting from lifelong chemotherapy and tyrosine kinase inhibitor maintenance toward curative-intent cellular and bispecific immunotherapies, as durable remission data increasingly changes physician treatment sequencing decisions away from indefinite drug therapy toward one-time or finite-course interventions for eligible patients across most developed healthcare systems today.
Demand concentrates in North America, where oncology drug pricing and reimbursement infrastructure support the highest per-patient treatment spending globally alongside the largest concentration of CAR-T manufacturing and administration centers. CAR-T cell therapies are growing fastest as approvals expand into earlier treatment lines, while tyrosine kinase inhibitors remain the largest segment by revenue given their entrenched position in chronic myeloid leukemia maintenance therapy. Manufacturers increasingly pursue combination trials to extend patent-protected revenue.
Competition centers on durable remission data and manufacturing capacity rather than incremental efficacy claims, since novel mechanisms already demonstrate meaningful survival benefit over legacy chemotherapy. Novartis, Gilead, and Bristol Myers Squibb each operate proprietary CAR-T manufacturing networks, creating capacity bottlenecks during periods of surging patient demand. Smaller biotechnology developers compete on differentiated mechanism and faster manufacturing turnaround for patients facing rapidly progressing disease across most major treatment centers today, a gap payers increasingly scrutinize closely.
Market Definition
The Leukemia Therapeutics Treatment Market covers pharmaceutical and cell-based therapies used to treat acute and chronic leukemia subtypes, including tyrosine kinase inhibitors, monoclonal antibodies, CAR-T cell therapies, BCL-2 inhibitors, chemotherapy regimens, and bispecific T-cell engagers. It excludes diagnostic testing, stem cell transplantation procedures, and supportive care medications not directly targeting leukemic disease.
Base Year Value
$18.5B in 2025 (MMA Primary Research Dataset, August 2026)
Forecast Period
2026 to 2036, eleven discrete annual values
CAGR
9.4% base case. Bull 10.7%. Bear 8.1%.
Fastest Growth Segment
CAR-T Cell Therapies: 16.8% CAGR
Fastest Growth Country
China: 13.6% CAGR
Fastest Growth Region
South Asia and Pacific: 11.4% CAGR
Largest Region
North America: 36% of 2025 global value
Market Leaders
Novartis AG, Bristol Myers Squibb Company, AbbVie Inc., Amgen Inc., and Gilead Sciences Inc. Source: MMA Analysis based on company annual reports.
Primary Survey
n=3,800 procurement and R&D decision-makers, Q4 2025, six countries
Methodology
Demand-side build-up, cross-validated against public data, 47 expert interviews

Leukemia Therapeutics Treatment Market Forecast Scenarios

leukemia-therapeutics-treatment-market-size-forecast-scenario-1787305436053
Leukemia therapeutics revenue grew rapidly between 2020 and 2025 at roughly 8.4 percent annually, as CAR-T cell therapy approvals expanded into additional leukemia subtypes and bispecific T-cell engager launches accelerated from 2022 onward. Pandemic-related treatment delays in 2020 gave way to catch-up diagnosis and treatment initiation volume through 2021 and 2022 across most developed healthcare systems.
The base case assumes 9.4 percent annual growth through 2036, anchored on three mechanisms: continued CAR-T cell therapy approval expansion into earlier treatment lines and additional leukemia subtypes, rising bispecific T-cell engager adoption offering off-the-shelf alternatives to personalized cell therapy manufacturing delays, and sustained tyrosine kinase inhibitor revenue from chronic myeloid leukemia maintenance therapy despite generic competition. Manufacturers are also expanding combination regimen trials pairing targeted therapies with immunotherapy to extend clinical differentiation and patent-protected revenue duration.
A bull scenario, at 10.7 percent, assumes faster CAR-T manufacturing capacity expansion and broader payer reimbursement acceptance accelerate adoption beyond current projections. A bear scenario, at 8.1 percent, assumes generic and biosimilar competition for established tyrosine kinase inhibitors erodes revenue faster than novel therapy adoption offsets. Manufacturing capacity constraints for personalized cell therapies could also limit near-term volume growth regardless of demand.

Curative-Intent Therapy Reshapes Treatment Economics

Leukemia therapeutics sits at the intersection of rapid scientific innovation, extraordinarily high per-patient treatment cost, and a genuine shift toward curative-intent interventions that fundamentally differ from the chronic maintenance therapy model that dominated the category for decades. This combination gives the category unusually dynamic competitive positioning relative to many other oncology segments still anchored primarily around incremental efficacy improvements within established t
MARKET CONCENTRATION (CR5)52%Five manufacturers hold substantial combined category revenue leadership
AVERAGE CAR-T TREATMENT COST$450KCell therapy carries substantial one-time per-patient treatment cost
TOP TREATING COUNTRY SHARE27%The United States dominates global leukemia therapeutics revenue spend
FIVE-YEAR SURVIVAL RATE IMPROVEMENT22%Novel therapies have meaningfully extended patient survival outcomes recently
CAR-T MANUFACTURING TURNAROUND TIME18 daysPersonalized cell therapy production remains a meaningful bottleneck currently
PATENT EXCLUSIVITY REMAINING6 yrsLeading branded therapies retain meaningful remaining exclusivity protection today
Commercially, the market splits between established pharmaceutical manufacturers selling tyrosine kinase inhibitors and monoclonal antibodies through traditional specialty pharmacy channels, and a newer tier of cell therapy and bispecific developers building direct hospital treatment center relationships required for complex administration protocols. Distribution runs through both specialty pharmacy networks for oral and infused therapies and direct manufacturer relationships with certified treatment centers for cell therapy administration.
Manufacturing capacity and durable remission data will define competitive position over the next decade more than incremental efficacy claims, which have converged less than in other oncology categories given genuinely differentiated mechanisms across leukemia subtypes. Vendors able to scale cell therapy manufacturing capacity and demonstrate long-term remission durability are positioned to capture disproportionate share of oncology treatment budgets industry-wide over time.
"We used to measure success in leukemia by how long a patient stayed on a drug. Now the goal is getting them off it entirely."
Director, Oncology Therapeutics Practice · MMA Oncology Therapeutics Practice

Market Trends

CAR-T Approvals Expand Into Earlier Treatment Lines

CAR-T cell therapies, initially approved only for patients who had exhausted multiple prior treatment lines, are increasingly gaining regulatory approval for use earlier in the treatment sequence as long-term durability data accumulates from initial approval cohorts. Novartis and Gilead have both expanded label indications since 2023, moving CAR-T therapies from third-line and later use toward second-line treatment for select leukemia subtypes with poor prognosis under standard chemotherapy. This earlier-line expansion substantially increases the eligible patient population for cell therapy, since far more patients qualify at diagnosis or first relapse than after multiple failed treatment attempts. Earlier-line CAR-T use captured an estimated 24 percent of new cell therapy starts in 2025.
Market Impact: Expands manufacturing capacity 35%

Bispecific T-Cell Engagers Offer Off-The-Shelf Alternative

Bispecific T-cell engagers, which redirect a patient's own immune cells against leukemic cells without requiring individualized cell collection and manufacturing, are gaining adoption as an off-the-shelf alternative for patients whose disease progresses too quickly for CAR-T manufacturing timelines. Amgen and AbbVie have both expanded bispecific pipeline investment meaningfully since 2023, targeting patients underserved by personalized cell therapy manufacturing constraints and treatment center capacity limitations. Physicians report growing preference for bispecific therapies specifically for rapidly progressing disease presentations where CAR-T's multi-week manufacturing timeline poses genuine clinical risk. Bispecific therapies captured an estimated 16 percent of new advanced-line treatment starts in 2025.
Market Impact: Lifts elderly diagnosis volume by 1

Market Opportunities and Growth Drivers

Expanding CAR-T Manufacturing Capacity Investment Now

Manufacturers are investing heavily in expanding CAR-T cell therapy manufacturing capacity, building additional production facilities and streamlining cell collection and processing logistics to address the capacity bottleneck that has historically limited how many eligible patients can access treatment within clinically appropriate timelines. This capacity expansion directly increases the number of patients who can be treated, creating demand growth independent of any change in underlying leukemia incidence. Novartis and Gilead have both announced significant manufacturing facility expansion investments over the past several years specifically to address wait times delaying treatment for eligible patients. This dynamic is expected to gradually ease capacity constraints throughout the forecast period as new facilities come online.
Market Impact: Limits access where treatment excee

Rising Leukemia Incidence Among Aging Populations

Aging populations across most developed and increasingly emerging markets are driving rising leukemia incidence, particularly for chronic lymphocytic leukemia and acute myeloid leukemia subtypes disproportionately diagnosed in older patients with weaker treatment tolerance for intensive chemotherapy regimens. Broader cancer screening and improved diagnostic capability are also identifying leukemia cases earlier in disease progression, increasing the population of patients eligible for treatment at a stage where curative-intent therapy remains clinically viable. Health systems managing larger aging patient populations report particularly strong growth in chronic leukemia subtype diagnosis tied to demographic trends. This dynamic is expected to sustain steady demand growth throughout the forecast period as populations age.
Market Impact: Delays treatment up to 18 days

Market Restraints and Challenges

Extraordinary Treatment Cost Limits Patient Access

CAR-T cell therapy and other novel leukemia treatments carry per-patient treatment costs often exceeding several hundred thousand dollars, creating meaningful access barriers even in developed healthcare systems with comprehensive insurance coverage infrastructure. The root cause is that personalized cell therapy manufacturing involves genuinely complex individualized biological processing that cannot benefit from the manufacturing economies of scale available to conventional small-molecule pharmaceutical production. This cost structure disproportionately limits access in markets with less developed reimbursement infrastructure, effectively excluding patient populations from curative-intent treatment options available in wealthier systems. Manufacturers are mitigating the gap through outcomes-based pricing agreements and expanded patient assistance programs.
Market Impact: Captures 24% of new therapy starts

Manufacturing Capacity Constraints Delay Treatment Access

Personalized CAR-T cell therapy manufacturing capacity remains constrained relative to eligible patient demand, creating treatment wait times that can prove clinically significant for patients with rapidly progressing disease unable to safely wait for manufacturing slot availability. The root cause is that individualized cell collection, genetic modification, and expansion processes require specialized manufacturing facilities and trained personnel that cannot scale as quickly as conventional pharmaceutical production capacity. This bottleneck disproportionately affects patients at smaller or more remote treatment centers with less established manufacturing facility relationships and lower prioritization within capacity allocation systems overall. Manufacturers are mitigating the constraint by expanding manufacturing facility footprint and developing faster processing protocols.
Market Impact: Captures 16% of advanced-line treat
3 additional market trends, 2 additional growth drivers, and 4 additional restraints and challenges are covered in the full report. Contact sales@marketmindsadvisory.com to access the complete intelligence.

Segment CAGR and Growth Architecture

Segmentation follows drug class and treatment mechanism, the classification oncologists and treatment centers use when sequencing therapy across leukemia subtypes and disease stages. Six segments span the full mechanism range from established tyrosine kinase inhibitors through emerging CAR-T and bispecific engager therapies, keeping each category mutually exclusive by underlying pharmacological or cellular mechanism of action.
leukemia-therapeutics-treatment-market-market-share-analysis-1787305436589

CAR-T Cell Therapies

CAR-T cell therapies genetically modify a patient's own T-cells to recognize and attack leukemic cells, delivering durable remission in a meaningful share of patients who had exhausted conventional treatment options, including chemotherapy and targeted small-molecule therapy. Growth is accelerating fastest of any segment as regulatory approvals expand into earlier treatment lines and additional leukemia subtypes, substantially increasing the eligible patient population beyond the heavily pretreated patients who qualified under initial approvals. Novartis and Gilead dominate this segment given their first-mover manufacturing infrastructure and accumulated long-term durability data built through years of clinical follow-up. Adoption remains constrained by manufacturing capacity, though ongoing expansion is gradually easing wait times that have historically limited broader patient access.
CAGR 16.8%

Bispecific T-Cell Engagers

Bispecific T-cell engagers redirect a patient's existing immune cells against leukemic cells through dual-binding antibody constructs, offering an off-the-shelf treatment alternative that avoids the individualized manufacturing timeline required for CAR-T cell therapy. Growth is accelerating as physicians increasingly favor bispecific therapies for patients with rapidly progressing disease who cannot safely wait for personalized cell therapy manufacturing, alongside patients in markets lacking CAR-T treatment center infrastructure. Amgen and AbbVie lead this segment given their established bispecific antibody manufacturing expertise and broad oncology commercial infrastructure built across multiple therapeutic areas beyond leukemia alone. This segment benefits from meaningfully faster treatment initiation timelines compared to cell therapy, a genuine clinical advantage for time-sensitive disease presentations.
CAGR 14.2%
Full segment breakdown across 6 segments available in the complete report.

Regional Architecture and Country Demand Map

Leukemia therapeutics demand concentrates where oncology drug pricing infrastructure and treatment center density run highest. North America's dominant reimbursement infrastructure, alongside Western Europe's established oncology treatment networks and East Asia's expanding manufacturing capacity, together account for the large majority of global therapeutics revenue worldwide today.

North America

The United States accounts for the overwhelming majority of North American demand, reflecting the country's uniquely high oncology drug pricing structure and comprehensive private and public insurance reimbursement infrastructure supporting extraordinarily expensive cell therapy and targeted drug treatment. Major academic medical centers and certified CAR-T treatment centers concentrate substantial manufacturing and administration capacity, giving the region the world's deepest cell therapy treatment infrastructure. Canada's smaller but steady demand tracks similar treatment patterns, though public healthcare budget structures constrain per-capita access to the most expensive novel therapies relative to United States levels. Out-of-band note: North America's share sits above the standard band because United States oncology drug pricing and reimbursement infrastructure concentration here are genuinely unmatched elsewhere globally.
Share: 36% | CAGR: 9.9% (2026 to 2036)

Western Europe

Germany, France, and the United Kingdom drive most Western European demand, each maintaining well-developed national health system oncology networks with established but comparatively slower novel therapy reimbursement approval processes than the United States. Public healthcare system health technology assessment processes across the region favor demonstrated cost-effectiveness evidence over rapid access, meaningfully slowing time to broad patient access following initial regulatory approval. Nordic countries maintain particularly efficient oncology treatment referral pathways relative to their population size, sustaining steady novel therapy adoption despite comparatively modest overall population scale across the wider region. Currency and national health technology assessment pricing negotiations periodically constrain novel therapy launch pricing across smaller public healthcare systems and budgets within the region overall.
Share: 24% | CAGR: 7.8% (2026 to 2036)
Regional intelligence for 5 additional markets available in the complete report: East Asia, South Asia and Pacific, Latin America, Middle East and Africa, Eastern Europe. Contact sales@marketmindsadvisory.com.
leukemia-therapeutics-treatment-market-country-cagr-analysis-1787305437171

Where Manufacturers Can Extend Revenue Duration

Manufacturers face a market where manufacturing capacity and treatment durability increasingly determine competitive position as much as raw efficacy data, making capacity expansion and combination therapy development central to sustained revenue growth and margin. Four levers stand out: manufacturing capacity expansion, combination regimen development, earlier treatment line label expansion, and outcomes-based pricing agreements with payers.

Expand CAR-T Manufacturing Capacity Very Aggressively

Manufacturers investing heavily in expanding CAR-T cell therapy manufacturing capacity, even at substantial upfront capital cost, are positioned to capture disproportionate share of the eligible patient population as demand continues outpacing current global manufacturing capability across the industry. This capacity expansion directly translates into treatment volume growth, since manufacturing capacity rather than patient demand currently constrains how many eligible patients receive treatment within clinically appropriate timelines before disease progression forecloses treatment options. Novartis and Gilead have both announced significant manufacturing facility expansion investments specifically to address wait times that have historically delayed treatment access. Manufacturing capacity has expanded an estimated 35 percent since 2023, though demand still outpaces available slots.
Market Impact: Expands treatment capacity by rough

Develop Combination Regimens With Immunotherapy Now

Manufacturers developing combination regimens pairing targeted small-molecule therapies with immunotherapy or cell therapy are extending clinical differentiation and patent-protected revenue duration beyond what either therapy achieves independently, while potentially improving patient outcomes through complementary mechanisms of action. This approach addresses the genuine clinical challenge of disease resistance that eventually develops against single-mechanism therapies, offering physicians a rationale for combination prescribing that extends manufacturer revenue capture across a patient's full treatment journey. Several leading manufacturers have expanded combination regimen clinical trial investment meaningfully since 2023, targeting regulatory approval for combination indications that command premium pricing over monotherapy alternatives. Combination regimens now represent an estimated 28 percent of new leukemia treatment starts.
Market Impact: Represents roughly 28% of new treat

Pursue Earlier Treatment Line Label Expansion

Manufacturers pursuing regulatory approval for earlier treatment line use, rather than remaining confined to later-line indications for heavily pretreated patients, are substantially expanding the eligible patient population and total addressable revenue for their approved therapies without requiring entirely new drug development. Earlier-line approval typically requires additional clinical trial investment and longer-term durability follow-up data, but delivers meaningfully larger commercial opportunity given the substantially larger patient population eligible at diagnosis or first relapse. Novartis and Gilead have both prioritized earlier-line label expansion trials as a primary commercial growth strategy for their established CAR-T platforms. Earlier-line approvals now drive an estimated 24 percent of total cell therapy revenue.
Market Impact: Drives roughly 24% of total cell th

Negotiate Outcomes-Based Pricing With Payers Directly

Manufacturers negotiating outcomes-based pricing agreements, which tie payment to demonstrated treatment durability rather than a fixed upfront price regardless of outcome, are addressing payer concerns about the extraordinary cost of curative-intent therapies with uncertain long-term durability data. These agreements typically require manufacturers to refund a portion of treatment cost if a patient relapses within a defined timeframe, transferring some financial risk back to the manufacturer in exchange for broader payer coverage and formulary access. This approach has proven particularly effective in securing coverage from more cost-conscious public healthcare payers who would otherwise restrict access to the most expensive novel therapies. Outcomes-based agreements now cover an estimated 19 percent of CAR-T therapy reimbursement volume.
Market Impact: Covers roughly 19% of CAR-T reimbur

Who Controls the Margin Pool

Five companies, Novartis, Bristol Myers Squibb, AbbVie, Amgen, and Gilead, hold an estimated 52 percent of global revenue on a company-revenue basis, reflecting a moderately concentrated market anchored by proprietary cell therapy manufacturing capability and entrenched targeted therapy franchises. Novartis leads by a meaningful margin over the next closest challenger, reflecting its first-mover CAR-T manufacturing position and deep accumulated long-term durability data built over years.
Current competitive activity centers on three dimensions: manufacturing capacity expansion to capture demand currently constrained by production bottlenecks, earlier treatment line label expansion trials, and combination regimen development pairing targeted therapies with immunotherapy. Established manufacturers are also defending tyrosine kinase inhibitor franchise revenue against generic and biosimilar competition through patent life-cycle management strategies nationwide.

Emerging pressure comes primarily from smaller biotechnology developers advancing differentiated bispecific and next-generation cell therapy mechanisms, competing for treatment center relationships and payer formulary position against established manufacturers with deeper commercial infrastructure. If emerging developers continue demonstrating comparable durability data at faster manufacturing turnaround, competitive rankings for time-sensitive disease presentations could shift meaningfully within the next several years as treatment center capacity constraints ease.
leukemia-therapeutics-treatment-market-company-positioning-matrix-1787305437706

Competitive Moat and Risk Dimensions

NOVARTIS AG

Moat: First-Mover CAR-T Manufacturing Position

Novartis holds the deepest accumulated long-term CAR-T durability data and first-mover manufacturing infrastructure in the category, giving it a decisive advantage when treatment centers and payers evaluate competing cell therapy platforms against established evidence standards built over nearly a decade of continuous clinical follow-up across multiple leukemia subtypes.
NOVARTIS AG

Risk: Manufacturing Capacity Bottleneck Exposure

Novartis's CAR-T manufacturing capacity remains genuinely constrained relative to eligible patient demand, exposing the company to reputational and competitive risk if faster-manufacturing bispecific alternatives capture treatment share from patients unable to safely wait for cell therapy manufacturing slot availability during periods of peak demand nationwide.
GILEAD SCIENCES INC.

Moat: Broad Oncology Commercial Infrastructure

Gilead benefits from its Kite Pharma cell therapy platform combined with broader oncology commercial infrastructure built across multiple therapeutic areas, giving it privileged access to treatment centers already standardized on Gilead relationships for other oncology and specialty therapy categories beyond leukemia treatment alone across most markets.
GILEAD SCIENCES INC.

Risk: Narrower Combination Therapy Pipeline

Gilead's combination regimen pipeline remains comparatively narrower than larger diversified pharmaceutical competitors with broader targeted therapy portfolios, potentially limiting its ability to extend patent-protected revenue duration through combination strategies as aggressively as competitors with more extensive existing drug portfolios and pipelines.

Players Tracked

Prominent Players

Novartis AG
Bristol Myers Squibb Company
AbbVie Inc.
Amgen Inc.
Gilead Sciences Inc.

Other Key Players

Johnson & Johnson (Janssen)
Pfizer Inc.
AstraZeneca plc
Takeda Pharmaceutical Company Limited
Merck & Co. Inc.
Sanofi S.A.
Roche Holding AG (Genentech)
Incyte Corporation
Jazz Pharmaceuticals plc
BeOne Medicines Ltd
Autolus Therapeutics plc
Legend Biotech Corporation
Allogene Therapeutics Inc.
Adaptimmune Therapeutics plc
CARsgen Therapeutics Holdings Limited

Recent Developments

MAY 2025

Novartis Expands CAR-T Manufacturing Facility Capacity

Novartis completed an organic capacity expansion of its CAR-T cell therapy manufacturing facility network, not an acquisition, adding production capacity specifically designed to reduce patient wait times and address manufacturing bottlenecks that have historically delayed treatment access for eligible leukemia patients nationwide across its facility network.
Signal: Established cell therapy manufacturers are
OCTOBER 2024

Gilead Acquires Bispecific Antibody Technology Developer

Gilead completed the acquisition of a specialty bispecific antibody technology developer, adding differentiated mechanism capability rather than continuing to rely solely on its existing CAR-T cell therapy platform for its leukemia treatment product lines going forward across its broader portfolio.
Signal: Established cell therapy manufacturers are
FEBRUARY 2025

AbbVie Signs Treatment Center Network Supply Agreement

AbbVie signed a multi-year supply and clinical support agreement, not an acquisition or joint venture, with a large multi-state academic treatment center network to provide targeted therapy access under a standardized outcomes-based pricing structure covering the network's full patient population and facilities.
Signal: Manufacturers are increasingly formalizing

Biological Manufacturing Input Cost Exposure

Viral vector production, specialized cell culture media, and genetic modification reagents together represent roughly 46 percent of cost of goods sold for a typical CAR-T cell therapy manufacturing process, with the remainder split across quality control, cold chain logistics, and facility overhead. Most viral vector production originates from a small number of qualified biotechnology manufacturers in the United States and Europe.
The 2021 viral vector manufacturing capacity shortage, driven by surging global demand across gene and cell therapy programs competing for the same limited specialized manufacturing capacity, delayed CAR-T production timelines industry-wide, with several manufacturers reporting extended patient wait times through much of 2022. Novartis's 2022 annual report cited viral vector supply availability as a specific factor limiting manufacturing throughput that year, a constraint that eased gradually through 2023 as dedicated vector manufacturing capacity expanded across the industry.

Established manufacturers with long-standing viral vector supplier relationships and larger purchase volumes secured priority allocation more easily than smaller cell therapy developers during the shortage period, widening the manufacturing reliability gap between established and emerging developers. Developers without long-term vector supply agreements, concentrated among smaller biotechnology companies, faced longer manufacturing delays and lost some competitive momentum during the broader capacity recovery period.
leukemia-therapeutics-treatment-market-cost-volatility-analysis-1787305437901

Diversify Viral Vector Supplier Qualification

Manufacturers are qualifying multiple viral vector and specialized reagent suppliers across the United States and Europe, reducing dependency on any single source following the 2021 shortage experience. Dual-sourcing adds modest qualification cost but has proven worthwhile given the manufacturing delays single-source developers experienced when vector availability tightened unexpectedly across the broader biotechnology supply chain.

Build In-House Viral Vector Production Capacity

The largest manufacturers are building captive viral vector production facilities, insulating their cell therapy manufacturing pipeline from third-party vector pricing and availability pressure entirely across their broader supply chains and networks. This approach requires significant capital investment but has delivered meaningfully more predictable manufacturing schedules for companies that have pursued it consistently.

Expand Manufacturing Facility Geographic Footprint

Several manufacturers have expanded manufacturing facility footprint across multiple geographic regions, reducing single-facility dependency and improving patient proximity to treatment manufacturing capacity for time-sensitive disease presentations nationwide. This distributed approach has proven valuable for reducing overall patient wait times and is increasingly standard practice among the largest cell therapy manufacturers globally.

Portfolio Architecture for Margin Defence

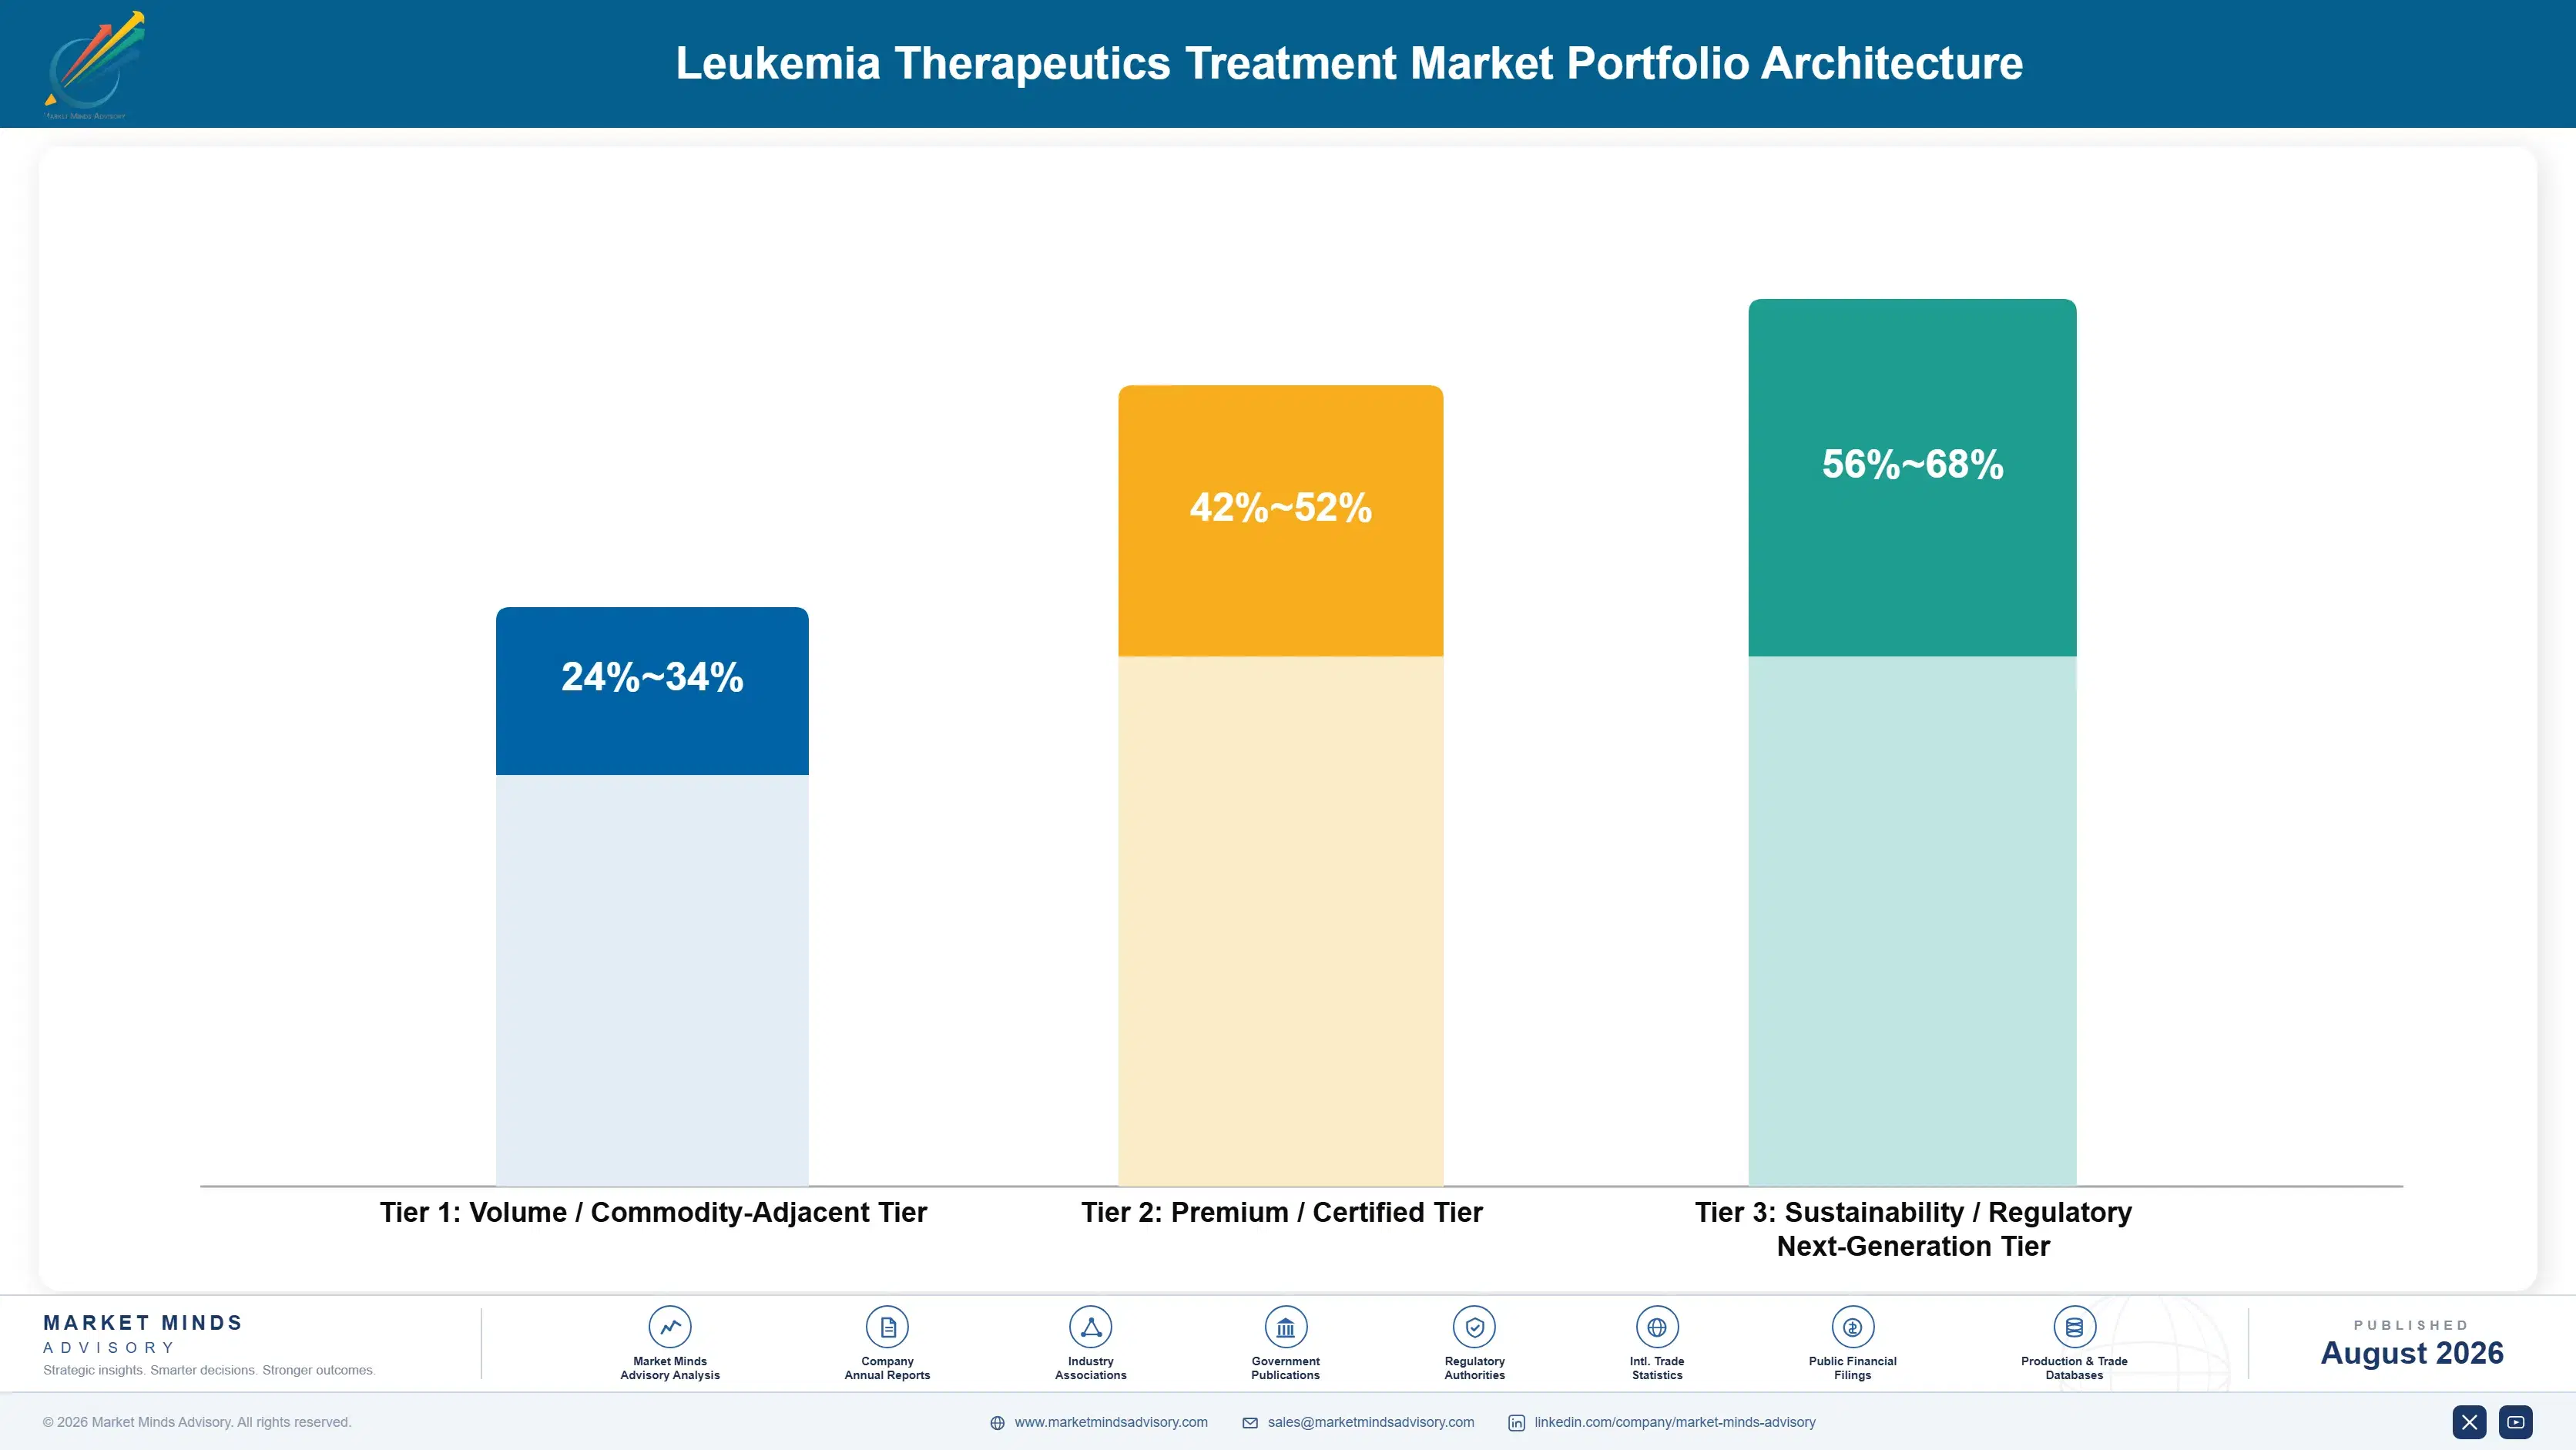
The market organizes into three margin tiers running from established generic and biosimilar-exposed tyrosine kinase inhibitors through branded monoclonal antibody and bispecific therapies to next-generation CAR-T cell therapy platforms. Gross margins widen substantially moving up this ladder, reflecting both manufacturing complexity and the curative-intent value premium payers and patients accept at the top tier consistently across most developed healthcare markets and systems.
Volume sits meaningfully in the mid-tier monoclonal antibody and bispecific segment by patient count, but profitability concentrates in premium CAR-T platforms and next-generation combination regimen programs where manufacturers capture meaningfully more value per treated patient. This volume-versus-margin tension shapes product development priorities across nearly every major manufacturer's roadmap and capital allocation decisions for the years immediately ahead and beyond.

High-value pools concentrate specifically around CAR-T cell therapy and combination regimen programs pairing targeted therapy with immunotherapy, both growing considerably faster than the broader leukemia therapeutics category overall. Manufacturers positioned early in these pools are capturing disproportionate profit growth relative to their patient volume share of the overall market today, a gap likely to widen further as manufacturing capacity expands steadily worldwide.

Volume / Commodity-Adjacent Tier

Established tyrosine kinase inhibitors facing generic and biosimilar competition, sold largely on price and clinical track record across most treatment centers and specialty pharmacy networks worldwide, with modest remaining brand loyalty.
Gross Margin: 24-34%

Premium / Certified Tier

Branded monoclonal antibody and bispecific engager therapies with established clinical evidence and treatment guideline recognition, commanding meaningful premiums tied to differentiated mechanism and treatment center relationships nationwide.
Gross Margin: 42-52%

Sustainability / Regulatory / Next-Generation Tier

CAR-T cell therapy platforms with durable remission data and curative-intent positioning, carrying the category's highest margins given manufacturing complexity and the value delivered to eligible patients consistently.
Gross Margin: 56-68%
leukemia-therapeutics-treatment-market-portfolio-architecture-1787305438405

Curative-Intent Treatment Economics Shift

Leukemia therapeutics demand functions less like a chronic maintenance drug market and more like a one-time high-value treatment event for an increasing share of eligible patients, since curative-intent cell and bispecific therapies fundamentally differ from the indefinite prescription refill model that historically dominated the category's commercial economics. This dynamic reshapes manufacturer revenue models toward earlier, larger, more concentrated treatment episodes rather than distributed
Adoption depth varies considerably by treatment center type: major academic medical centers with certified cell therapy administration capability have adopted CAR-T and bispecific protocols almost universally for eligible patients, while smaller community oncology practices still rely primarily on referral to specialized centers for advanced therapy access. Reimbursement-rich developed markets sit well ahead of cost-constrained systems in overall novel therapy adoption depth.

A generational shift in oncology buyer and prescriber profiles is underway as younger oncologists, trained during the cell therapy and immunotherapy era rather than the chemotherapy-dominant period, increasingly default to novel mechanism therapy sequencing as standard practice rather than a specialized late-line option. This expectation is accelerating novel therapy adoption even in treatment settings not yet facing direct competitive pressure to change.
leukemia-therapeutics-treatment-market-end-use-penetration-index-1787305438911

Where MMA Sees The Opportunity

These are among the four positions where our research anticipates prominent divergence between winners and laggards over the coming forecast period. Each is grounded in the demand model, the regulatory perimeter, and the announced capacity pipeline.
01 / MANUFACTURING CAPACITY STRATEGY

Expand cell therapy manufacturing capacity ahead of demand growth

Manufacturing capacity, not patient demand, currently constrains how many eligible leukemia patients receive CAR-T treatment within clinically appropriate timelines before disease progression forecloses treatment options entirely. Manufacturers investing aggressively in manufacturing capacity expansion now are positioned to capture disproportionate share of a patient population that continues growing faster than global manufacturing capability across the industry. MMA views manufacturing capacity growth as the single clearest predictor of which cell therapy manufacturers sustain durable revenue growth over the next decade of category expansion and increasing competitive pressure.
02 / COMBINATION THERAPY DEVELOPMENT

Build combination regimens to extend patent-protected revenue duration

Disease resistance eventually develops against nearly every single-mechanism leukemia therapy, creating a persistent commercial and clinical need for combination regimens that extend both patient outcomes and manufacturer revenue capture beyond any single drug class. Manufacturers investing early in combination regimen clinical development are positioned to capture premium pricing for combination indications before competitors establish similar combination evidence and regulatory approval. MMA expects combination therapy revenue to become an increasingly important growth driver as monotherapy indications face mounting generic and biosimilar competitive pressure across the category.
03 / EARLIER LINE EXPANSION

Pursue earlier treatment line approval to expand addressable population

The eligible patient population for advanced leukemia therapies expands substantially when regulatory approval moves from later treatment lines toward use at diagnosis or first relapse, meaningfully increasing total addressable revenue without requiring entirely new drug development investment. Manufacturers prioritizing earlier-line label expansion trials now are capturing this larger commercial opportunity before competitors complete comparable durability follow-up studies required for regulatory approval. MMA views earlier-line expansion as a durable strategic opening for manufacturers with strong existing durability data and established regulatory relationships already in place.
04 / OUTCOMES-BASED PRICING ADOPTION

Formalize outcomes-based pricing before payers demand it unilaterally

Payers are increasingly resistant to fixed upfront pricing for extraordinarily expensive curative-intent therapies with uncertain long-term durability data, favoring manufacturers willing to share financial risk through outcomes-based reimbursement structures. Manufacturers slow to formalize outcomes-based pricing agreements risk losing preferred formulary status to competitors already offering this model in competitive payer contract negotiations across major markets. MMA expects outcomes-based pricing to become the dominant reimbursement structure for the most expensive novel therapies well before the end of the current ten-year forecast period.

Engagement Snapshot From the Field

A live engagement with an industry participant carrying material or product regulatory and market exposure ahead of a defining policy shift, showing how our research translates into a defensible multi-year portfolio strategy.
MARKET MINDS ADVISORY · CLIENT ENGAGEMENT SUMMARY
Leukemia Therapeutics Treatment Producer Strategic Portfolio Review and Transition Roadmap 2026·Investment Scenario on Leukemia Therapeutics Treatment Exposure Evaluation 2025-26
CLIENT PROFILE
The client is a regional academic medical center operating a growing oncology program, historically referring eligible CAR-T candidates to a distant certified treatment center lacking in-house cell therapy administration capability (client-reported, unverified by MMA). Leadership sought to build in-house CAR-T certification and reduce patient travel burden for complex advanced leukemia cases requiring urgent treatment across its service area.
STRATEGIC CHALLENGE
Leadership needed to select cell therapy manufacturing partners and complete treatment center certification within a compressed timeline set by growing patient volume commitments, while managing the substantial staff training requirements associated with cell therapy administration and controlling capital expenditure across an oncology department balancing multiple simultaneous service line priorities and staffing constraints.
MMA APPROACH
MMA benchmarked candidate manufacturer partnerships against certification support depth, manufacturing turnaround reliability, and total cost of ownership including outcomes-based pricing terms, modeled expected certification timeline under three distinct manufacturer scenarios, and recommended a manufacturer selection and phased program rollout sequence for the department to follow.
KEY FINDINGS
  1. Manufacturer certification support programs varied considerably in depth, with the most comprehensive program reducing estimated staff training time by roughly 35 percent compared to self-directed certification pathways.
  2. Referral volume analysis showed the center could capture an estimated 55 percent of previously outsourced CAR-T eligible cases within the first eighteen months of program launch.
  3. Manufacturing turnaround reliability differed meaningfully between candidate manufacturers, with wait time variability identified as a significant patient safety consideration during the full evaluation process.
  4. Outcomes-based pricing terms varied between manufacturers, with more favorable terms available from manufacturers seeking to expand treatment center network relationships in the region.
CLIENT PROFILE
The client is a regional academic medical center operating a growing oncology program, historically referring eligible CAR-T candidates to a distant certified treatment center lacking in-house cell therapy administration capability (client-reported, unverified by MMA). Leadership sought to build in-house CAR-T certification and reduce patient travel burden for complex advanced leukemia cases requiring urgent treatment across its service area.
STRATEGIC CHALLENGE
Leadership needed to select cell therapy manufacturing partners and complete treatment center certification within a compressed timeline set by growing patient volume commitments, while managing the substantial staff training requirements associated with cell therapy administration and controlling capital expenditure across an oncology department balancing multiple simultaneous service line priorities and staffing constraints.
MMA APPROACH
MMA benchmarked candidate manufacturer partnerships against certification support depth, manufacturing turnaround reliability, and total cost of ownership including outcomes-based pricing terms, modeled expected certification timeline under three distinct manufacturer scenarios, and recommended a manufacturer selection and phased program rollout sequence for the department to follow.
KEY FINDINGS
  1. Manufacturer certification support programs varied considerably in depth, with the most comprehensive program reducing estimated staff training time by roughly 35 percent compared to self-directed certification pathways.
  2. Referral volume analysis showed the center could capture an estimated 55 percent of previously outsourced CAR-T eligible cases within the first eighteen months of program launch.
  3. Manufacturing turnaround reliability differed meaningfully between candidate manufacturers, with wait time variability identified as a significant patient safety consideration during the full evaluation process.
  4. Outcomes-based pricing terms varied between manufacturers, with more favorable terms available from manufacturers seeking to expand treatment center network relationships in the region.
RECOMMENDED STRATEGY
Phase 1: Phase 1 (Months 1-4): Complete manufacturer partnership selection and finalize certification training program agreements for the lead staff. Phase 2: Phase 2 (Months 5-12): Complete structured cell therapy certification training and begin supervised treatment administration under manufacturer support closely. Phase 3: Phase 3 (Months 13-18): Achieve full independent certification and expand referral capacity to capture regional case volume steadily.
OUTCOME
Eighteen months into the engagement, the center reported successful cell therapy program launch achieving full independent certification and capturing a meaningful share of previously outsourced referral volume across the region (client-reported, unverified by MMA), validating MMA's manufacturer selection and phased certification recommendation fully.

Frequently Asked Questions

Foundational context covering the market sizes, CAGR, scope, country, region and competition that inform every finding below. This section is provided to cover basics and most often pre-purchase conversations, answered from the MMA Primary Research Dataset.

What is the current size of the Leukemia Therapeutics Treatment Market?

The global Leukemia Therapeutics Treatment Market was valued at approximately $18.5 billion in 2025. Growth is driven by CAR-T cell therapy expansion and rising leukemia incidence among aging populations.

How large will the Leukemia Therapeutics Treatment Market be by 2036?

The market is projected to reach approximately $49.75 billion by 2036, roughly 2.46 times its 2026 value. Growth is led by curative-intent cell and bispecific therapy adoption.

What is the CAGR for the Leukemia Therapeutics Treatment Market 2026 to 2036?

The market is forecast to grow at a 9.4 percent CAGR between 2026 and 2036. Bull and bear scenarios range from 10.7 percent to 8.1 percent.

Which segment is growing fastest?

CAR-T cell therapies are growing fastest at a 16.8 percent CAGR, roughly 1.79 times the overall market rate, driven by earlier treatment line approval expansion.

Who are the major companies in the Leukemia Therapeutics Treatment Market?

Novartis, Bristol Myers Squibb, AbbVie, Amgen, and Gilead lead the market, together holding roughly 52 percent of category revenue on a company-revenue basis.

Which country is growing fastest?

China is growing fastest among major markets at an estimated 13.6 percent CAGR, driven by rapidly expanding domestic CAR-T manufacturing capacity and treatment infrastructure.

Report Segmentation Architecture

The full report scope spans multiple orthogonal segmentation dimensions, with cross-tabulated demand data provided for each dimension pair. Coverage extends further to regional breakdowns, trend trajectories, and the competitive detail needed to support segment-level decision-making.

By Drug Class and Treatment Mechanism

  • Tyrosine Kinase Inhibitors
  • Monoclonal Antibodies
  • CAR-T Cell Therapies
  • BCL-2 Inhibitors
  • Chemotherapy Combination Regimens
  • Bispecific T-Cell Engagers

By Leukemia Subtype

  • Chronic Myeloid Leukemia
  • Chronic Lymphocytic Leukemia
  • Acute Myeloid Leukemia
  • Acute Lymphoblastic Leukemia

By Commercial Dimension

  • Specialty Pharmacy Distribution
  • Direct Treatment Center Contracts
  • Outcomes-Based Pricing Agreements
  • Combination Regimen Licensing

By Region

  • North America
  • Western Europe
  • East Asia
  • South Asia and Pacific
  • Latin America
  • Middle East and Africa
  • Eastern Europe

Scope, Methodology, and Coverage

Every figure in this report is reproducible from documented input assumptions. The scope below maps the historical period, the forecast horizon, the segmentation dimensions, and the countries covered, alongside the underlying primary and qualitative methodology.
Historical Period
2020 to 2025
Forecast Period
2026 to 2036
Base Year
2025 (USD billions; MMA Primary Research Dataset, August 2026)
Market Definition
The Leukemia Therapeutics Treatment Market covers pharmaceutical and cell-based therapies used to treat acute and chronic leukemia subtypes, including tyrosine kinase inhibitors, monoclonal antibodies, CAR-T cell therapies, BCL-2 inhibitors, chemotherapy regimens, and bispecific T-cell engagers. It excludes diagnostic testing, stem cell transplantation procedures, and supportive care medications not directly targeting leukemic disease.
Quantitative Units
USD billions (current prices); treated patient volume where applicable
Segmentation Dimensions
By Drug Class and Treatment Mechanism; By Leukemia Subtype; By Commercial Dimension; By Region
Regions Covered
North America, Western Europe, East Asia, South Asia and Pacific, Latin America, Middle East and Africa, Eastern Europe
Countries Covered
USA, China, Germany, France, UK, Japan, South Korea, India, Australia, Canada, Brazil, Mexico, Indonesia, Vietnam, Thailand, Malaysia, UAE, Saudi Arabia, South Africa, Nigeria, Turkey, Poland, Netherlands, Italy, Spain, Sweden, Switzerland, Argentina, Colombia, Singapore, and additional markets relevant to this sector
Key Companies Profiled
Novartis AG, Bristol Myers Squibb Company, AbbVie Inc., Amgen Inc., Gilead Sciences Inc., Johnson & Johnson (Janssen), Pfizer Inc., AstraZeneca plc, Takeda Pharmaceutical Company Limited, Merck & Co. Inc., Sanofi S.A., Roche Holding AG (Genentech), Incyte Corporation, Jazz Pharmaceuticals plc, BeOne Medicines Ltd, Autolus Therapeutics plc, Legend Biotech Corporation, Allogene Therapeutics Inc., Adaptimmune Therapeutics plc, CARsgen Therapeutics Holdings Limited
Quantitative Methodology
Primary survey, n=3,800 respondents, Q4 2025, six countries; demand-side model with trade association cross-validation
Qualitative Methodology
47 expert interviews, Q4 2025; applied to validate demand model assumptions, identify emerging dynamics, and assess competitive positioning
Report Format
PDF and XLSX data workbook (Word format preview document)
Publisher
Market Minds Advisory
Report Code
MMA-2026-HLT-221
Published
August 2026
Contact
sales@marketmindsadvisory.com | www.marketmindsadvisory.com

Purchase the full Leukemia Therapeutics Treatment Market Report (2026 to 2036).

The full Leukemia Therapeutics Treatment Market report provides detailed 2026 to 2036 forecasts across all six drug class segments and seven global regions, alongside company-level competitive profiles for the twenty manufacturers covered in this summary. It includes primary survey data from 3,800 oncology treatment center and payer respondents across six countries, supplemented by 47 expert interviews with manufacturers, treating oncologists, and reimbursement specialists. The report addresses manufacturing capacity economics, combination regimen trends, and outcomes-based pricing adoption in depth. Segment-level margin analysis and manufacturer selection frameworks support treatment center and payer strategy decisions across the value chain.
Segment-level 2026-2036 forecasts across all six drug classes
Full competitive profiles for twenty manufacturers profiled
Regional deep-dive analysis across all seven regions covered
Primary survey data from 3,800 treatment center respondents
47 expert interviews with manufacturers and treating oncologists
Manufacturer selection and total cost of ownership frameworks included

Built For The People Who Decide

From boardroom strategy to bench-side execution, this report is read cover-to-cover by leaders shaping the next decade of their industry, turning demand scenarios, market dynamics and valuation benchmarks into decisions.
CXOs/ Presidents/ VPs/ Managers
M&A and Corporate Development
Strategy Teams and R&D Heads
Procurement and Product Directors
Regulatory and Compliance Leaders
Investor Relations and Equity Analysts