Market Minds Advisory
Leisure Boats Market

Leisure Boats Market: Inventory correction, propulsion value transfer and berth-constrained demand to 2036

Two years of pandemic demand pulled a decade of boat purchases forward, dealers ordered against it, and the industry has spent three years clearing the inventory that arrived after everybody stopped buying.

Lead Analyst

David Horsley

Published

September 2026

Make Smarter Decisions with Customized Research Insights

Request a free sample report and evaluate market opportunities, growth trends, and competitive dynamics relevant to your business needs.

2025 MARKET VALUE$32.4BMarket Size 2025
2036 FORECAST VALUE$56.6BBase Case , 2026 to 2036
CAGR 2026 TO 20365.2 %Bull 6.4% / Bear 4.0%
INCREMENTAL OPPORTUNITY$22.5BNet 10- year value creation
EXPANSION MULTIPLE1.66x2036 value over 2026 base
Strategic Levers
M&A Pipeline
Regional Outlook
Country Rankings
Competitive Intelligence
Segmental Deep-dive
Call-Us : 91 93563 13602

Executive Snapshot and Market Trajectory

Dealer stock cover reached around nine months against a normal four or five, and clearing it has governed every commercial decision in this industry since 2023. Discounting, production cuts and cancelled model launches all follow from one number nobody wanted to publish. That number has finally started coming down.
Inflatable and rigid inflatable boats grow at 7.8%, half again the market rate of 5.2%, because they store easily, tow behind smaller vehicles and cost a fraction of a comparable rigid hull. North America holds 28% of value, Western Europe 25% and East Asia 24%, which is far closer than most people in this industry assume. Sterndrive powerboats grow at under 2% and are effectively finished.
Five builders hold 33% of new boat revenue and the fragmentation is genuine, since a boat is built close to the water it will be used on and hundreds of yards serve regional markets nobody consolidates. The commercially decisive shift was propulsion: 81% of new powerboats below twelve metres now use outboards, which moved a large share of the value from the boat builder to the engine manufacturer. Very few builders resisted it.
Market Definition
This report covers recreational watercraft sold new to private and charter owners, spanning outboard powerboats, personal watercraft, inflatable and rigid inflatable boats, sailing yachts and dinghies, motor yachts and superyachts, and inboard and sterndrive powerboats. Value is measured at builder level including factory-fitted propulsion. Excluded are commercial fishing and workboats, government and rescue craft, boat trailers, marina infrastructure, and engines sold separately into the aftermarket.
Base Year Value
$32.4B in 2025 (MMA Primary Research Dataset, August 2026)
Forecast Period
2026 to 2036, eleven discrete annual values
CAGR
5.2% base case. Bull 6.4%. Bear 4.0%.
Fastest Growth Segment
Inflatable and Rigid Inflatable Boats: 7.8% CAGR
Fastest Growth Country
India: 8.2% CAGR
Fastest Growth Region
South Asia and Pacific: 7.4% CAGR
Largest Region
North America: 28% of 2025 global value
Market Leaders
Brunswick Corporation, Groupe Beneteau, Yamaha Motor, Malibu Boats and Ferretti Group lead the market. Source: MMA Primary Research Dataset, July 2026.
Primary Survey
n=3,800 procurement and R&D decision-makers, Q4 2025, six countries
Methodology
Demand-side build-up, cross-validated against public data, 47 expert interviews

Leisure Boats Market Forecast Scenarios

leisure-boats-market-size-forecast-scenario-1787555228347
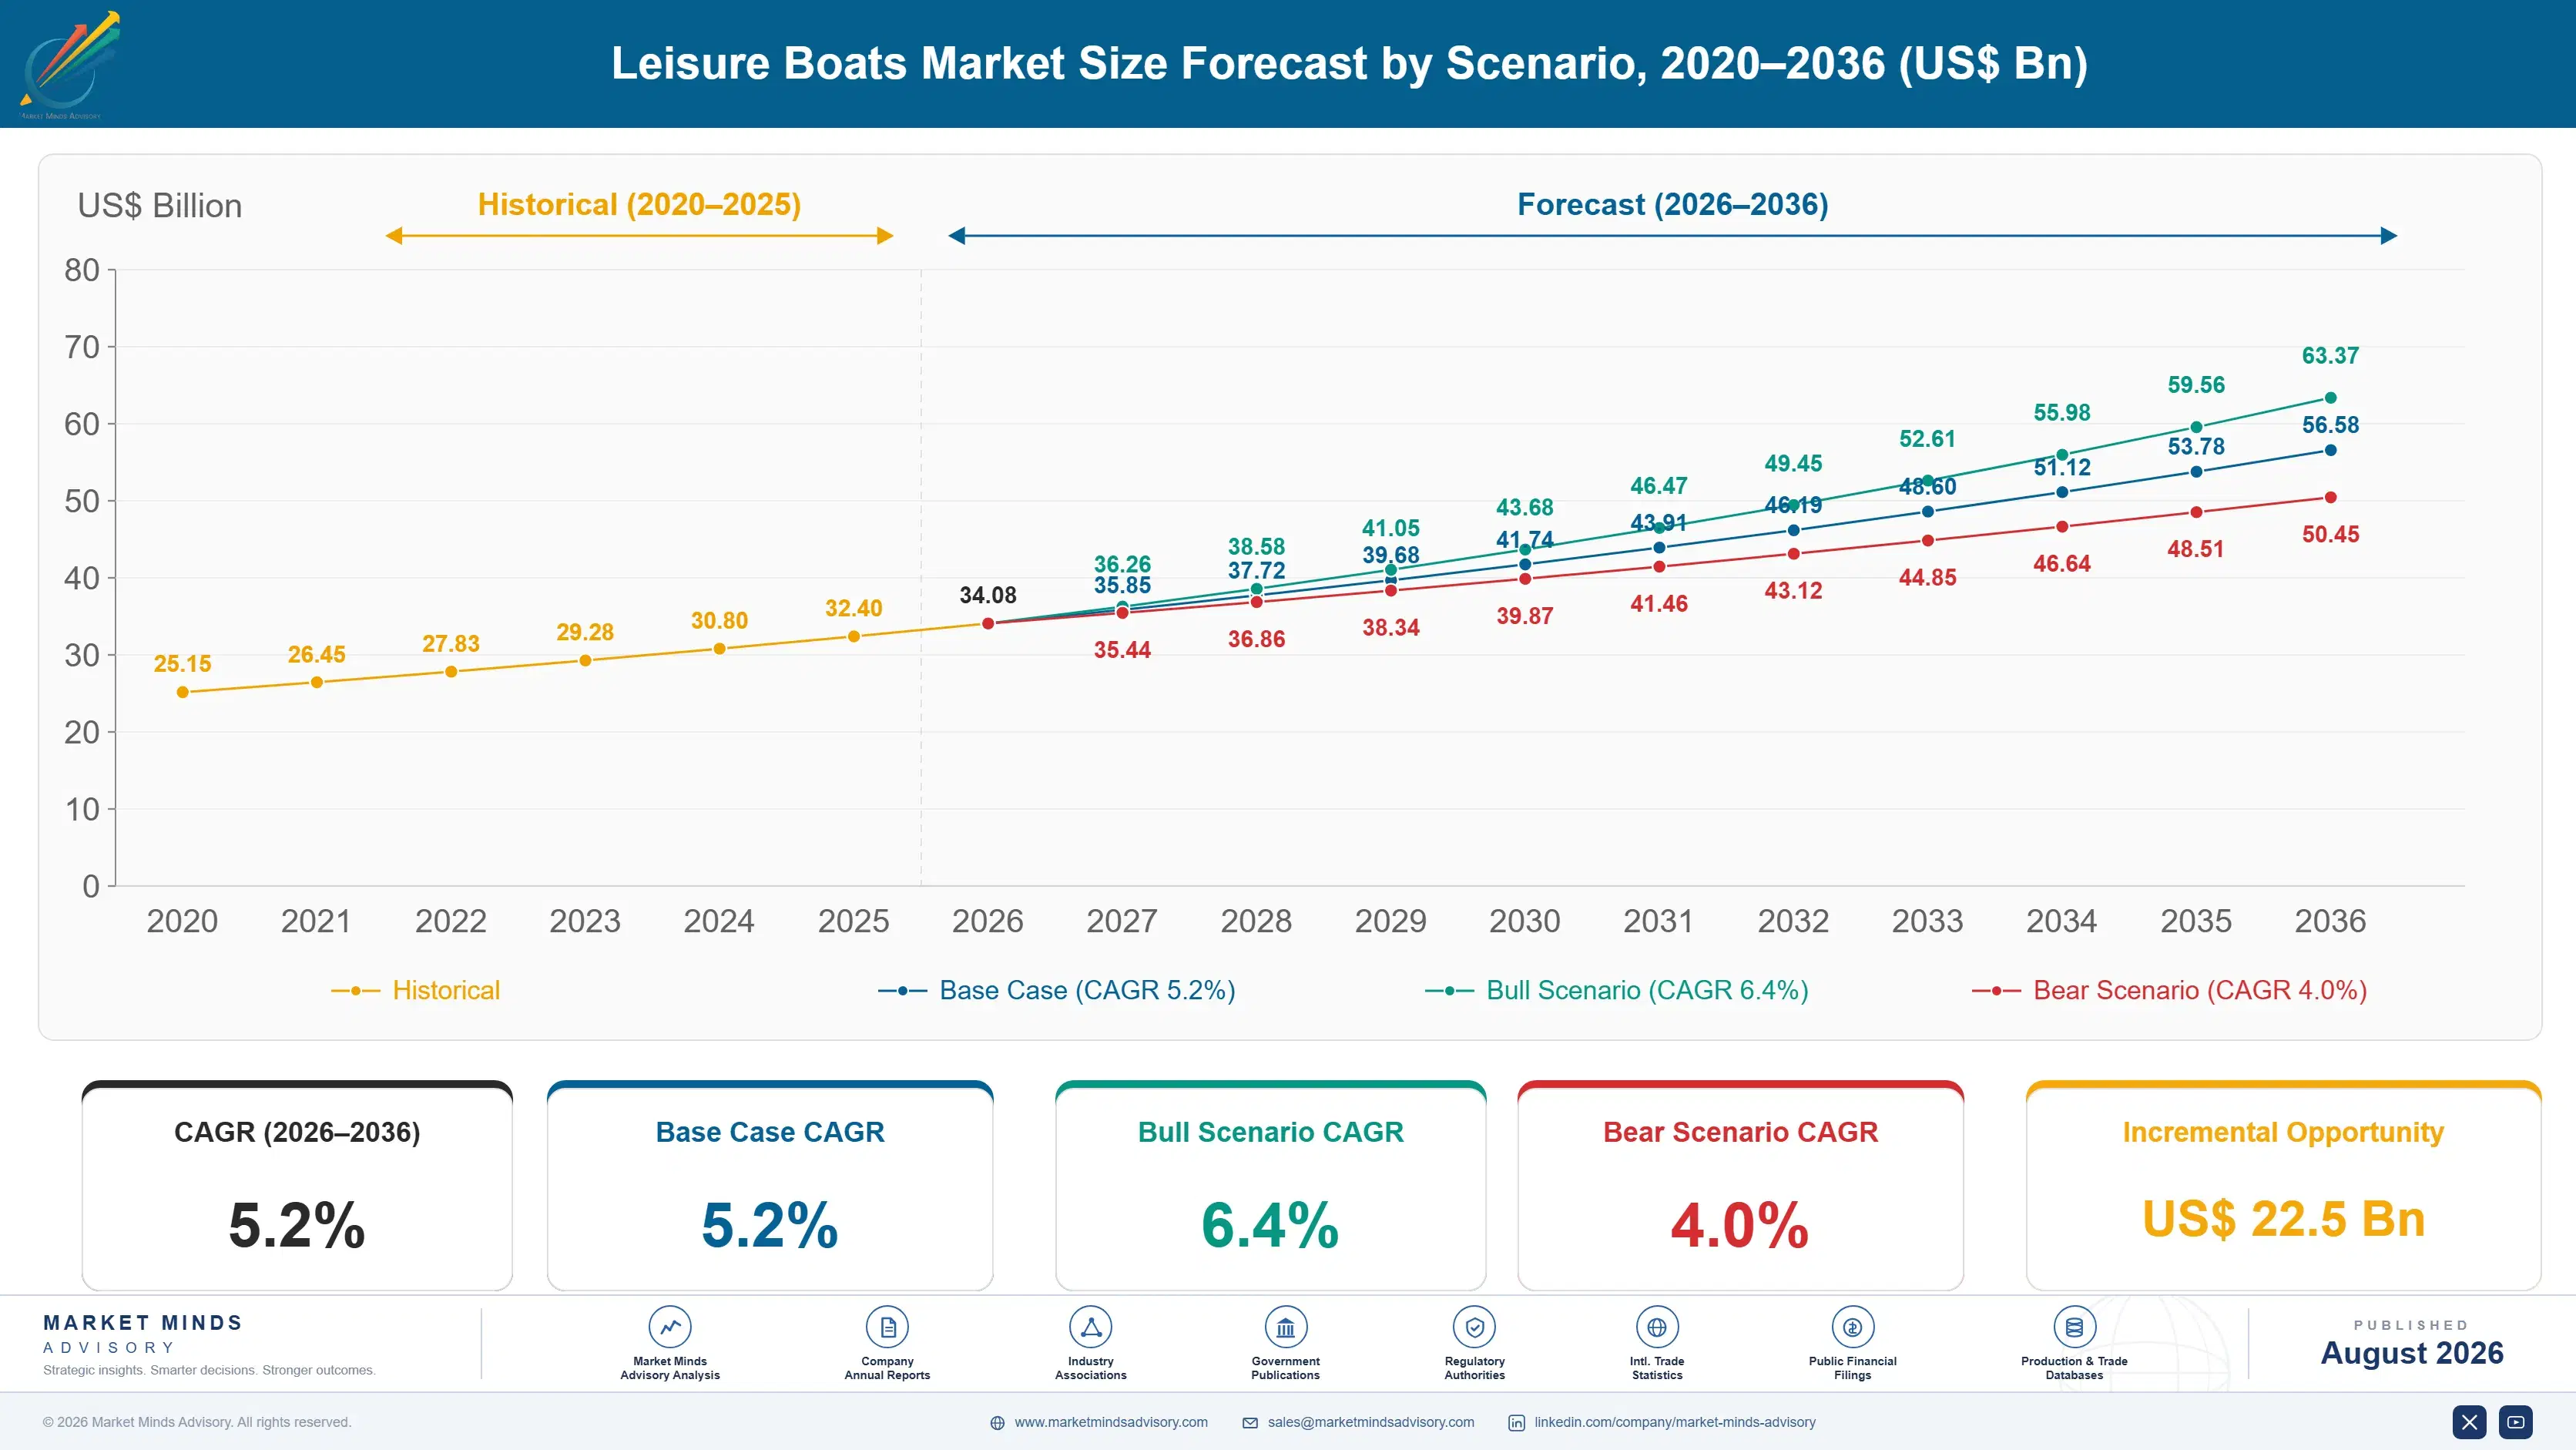
Growth ran at 4.2% between 2020 and 2025 and the average hides a boom and a hangover. Demand surged through 2020 and 2021 as households bought outdoor recreation with money they could not spend on travel, and dealers ordered against forecasts that assumed it continued. It did not. The correction from 2023 onward has been inventory clearance rather than demand failure.
The 5.2% base case rests on three mechanisms. Inventory normalisation completes across the next two years and returns production to underlying demand, which never actually collapsed. Inflatable and rigid inflatable formats keep taking buyers priced out of rigid hulls at 7.8%, and they store and tow in ways a conventional boat cannot. And Asian and Middle Eastern marine leisure infrastructure keeps expanding, which converts latent interest into ownership in markets that previously had nowhere to keep a boat.
The 6.4% bull case is electric propulsion reaching credible range on hydrofoil platforms, which would open buyers currently deterred by fuel cost and noise. The 4.0% bear case is berth availability: marina capacity has not grown with boat ownership anywhere, and a buyer with nowhere to keep a boat does not buy one regardless of what the showroom offers.

What The Correction Actually Changed

The pandemic did something to this industry that nobody has fully absorbed. Two years of extraordinary demand pulled forward purchases that would otherwise have spread across a decade, dealers ordered against forecasts assuming it continued, and stock cover reached around nine months against a normal four or five. Everything since has been clearance. Production cuts, discounting and cancelled model programmes all trace to that single number, and it has only recently started coming down.
TOP-FIVE CONCENTRATION33%Combined position across new leisure boat supply held by leaders
OUTBOARD PROPULSION SHARE81%Portion of new powerboats below twelve metres using outboards
DEALER INVENTORY MONTHS9 monthsTypical stock cover held across dealer networks after the correction
ELECTRIC PROPULSION ATTACH RATE4%New boats delivered with battery-electric rather than combustion propulsion
COMPOSITE HULL COST SHARE38%Portion of builder cost attributable to laminate and moulding
AVERAGE OWNERSHIP DURATION7 yearsTypical period an owner keeps a boat before selling
Underneath the cycle, propulsion changed permanently. Around 81% of new powerboats below twelve metres now use outboard engines, against roughly half twenty years ago, and sterndrive installation has effectively stopped. That transfer moved a substantial share of boat value from the builder, who moulds a hull and fits an interior, to the engine manufacturer, who sells a complex machine at a price the buyer sees separately. Builders have spent twenty years accommodating a shift that reduced what they own.
Electric propulsion sits at around 4% of new deliveries and the constraint is energy density rather than willingness. Hydrofoil platforms change that arithmetic genuinely, since lifting a hull clear of the water cuts energy demand enough to make a usable battery range possible at last.
"The industry keeps describing the last three years as a demand problem and it was an ordering problem. Underlying participation never fell much at all, and the builders who cut production early are the ones with clean balance sheets now."
Principal, Marine Leisure and Recreational Products Practice · MMA Automotive Practice · August 2026

Market Trends

Inflatable formats take buyers priced out of rigid hulls

A rigid inflatable delivers most of the capability of a comparable rigid hull at a fraction of the price, stores in a garage rather than a berth, and tows behind a vehicle most families already own. Those three things together answer the objections that stop people buying boats. Growth at 7.8% reflects buyers entering the market rather than existing owners trading across, which makes it genuinely additional demand. Build quality across the segment has improved considerably and the tube materials now last long enough that the durability argument against them has largely gone away.
Market Impact: Reaches 81% of new powerboats

Hydrofoil platforms make electric propulsion arithmetic finally work

An electric boat fails on range because pushing a displacement or planing hull through water consumes energy that no practical battery carries. Lifting the hull clear on foils cuts drag enough to change the calculation entirely, which is why the credible electric leisure boats now on the water are foiling ones. Electric propulsion sits at around 4% of new deliveries and almost all of that is small craft and tenders. Hydrofoil platforms cost considerably more and deliver range a buyer can actually plan a day around, which is the only version of this argument that has ever worked commercially.
Market Impact: Adds 15% of global value

Market Opportunities and Growth Drivers

Outboard propulsion completed its displacement of sterndrive systems

Around 81% of new powerboats below twelve metres now leave the factory with outboard engines, against roughly half twenty years ago, and the reasons are straightforward. An outboard tilts clear of the water, frees the interior volume a sterndrive consumes, and gets serviced or replaced without touching the hull. Modern four-stroke outboards removed the noise and emissions objections that once favoured inboards. The commercial consequence is that boat builders now assemble around an engine somebody else designs and prices, which changed the value split permanently and not in the builder's favour.
Market Impact: Reached 9 months stock cover

Marine leisure infrastructure expands across Asia and the Gulf

Boat ownership requires somewhere to keep a boat, and across most of Asia and the Middle East that infrastructure simply did not exist until recently. Marina development in Thailand, Vietnam, the United Arab Emirates and Saudi Arabia is creating berth capacity where latent interest had nowhere to go. That converts income growth into ownership rather than into aspiration, which is a different mechanism from the one driving developed markets. Growth in these regions runs well ahead of the global average and depends on construction programmes rather than on anything a boat builder does or decides.
Market Impact: Caps growth across 30 years

Market Restraints and Challenges

Dealer inventory overhang suppressed production for three years

Stock cover across dealer networks reached around nine months against a normal four or five, and a boat sitting on a dealer floor costs money every month it stays there. The root cause was ordering against pandemic demand that everybody knew was temporary and nobody wanted to be short of. Commercially this forced production cuts, discounting that damaged residual values and cancelled model programmes across the industry. Builders have responded by moving toward build-to-order and by holding dealer allocations tighter, which costs some volume and prevents a repeat of the same mistake.
Market Impact: Segment growing at 7.8% annually

Berth availability caps ownership growth in every developed market

A boat above trailer size requires a berth, and marina capacity across the Mediterranean, Northern Europe and the North American coasts has barely grown in thirty years. The root cause is that waterfront land is scarce, planning consent is difficult and marina development competes with residential property that pays considerably better. Commercially this caps ownership growth regardless of income or interest, and it pushes buyers toward trailerable and inflatable formats that need no berth at all. Dry stack storage addresses part of it and the boats that fit are limited by size and weight.
Market Impact: Sits at 4% attach rate
3 additional market trends, 4 additional growth drivers, and 2 additional restraints and challenges are covered in the full report. Contact sales@marketmindsadvisory.com to access the complete intelligence.

Segment CAGR and Growth Architecture

Boats are classified here by hull and propulsion configuration, since that determines who buys one, where it can be kept and what it costs to own. Length band, material and sales channel are handled separately in the framework, because a single configuration spans several sizes and reaches buyers through the same dealer network regardless.
leisure-boats-market-market-share-analysis-1787555228878

Inflatable and Rigid Inflatable Boats

Growing at 7.8%, half again the market rate, this is where new owners enter the market rather than where existing ones trade up. A rigid inflatable delivers most of the capability of a comparable rigid hull for a fraction of the price, stores in a garage instead of a berth and tows behind a vehicle a family already owns, which between them answer the three objections that stop people buying boats. Tube materials and construction quality have improved enough that the durability argument has effectively disappeared. Superyacht tender demand adds a high-value layer at the top of the segment that most volume builders never see. That top layer is worth studying carefully.
CAGR 7.8%

Motor Yachts and Superyachts

The large yacht business behaves nothing like the rest of this market and it is where European builders hold positions nobody threatens. Italian and Dutch yards dominate above thirty metres on craftsmanship and reputation built across generations, and the order books there proved almost entirely immune to the inventory correction that convulsed volume boating. Growth at 6.4% tracks wealth concentration rather than participation, which makes it more stable and considerably less related to anything happening in dealer networks. Build slots run years ahead, buyers specify individually, and the commercial model is closer to bespoke construction than to manufacturing. Charter demand adds a further layer that keeps older hulls in productive use.
CAGR 6.4%
Full segment breakdown across 6 segments available in the complete report.

Regional Architecture and Country Demand Map

North America holds 28% of value, Western Europe 25% and East Asia 24%, which is considerably closer than most people in this industry assume. Europe leads on large yacht value and East Asia on volume manufacture. Where boats are built explains most of it. Where they get used explains less.

North America

The largest participation base anywhere sustains this region, with recreational boat registrations in the United States running into the millions and a dealer network dense enough to serve them across every inland lake and coastline. Pontoon boats, bowriders and bass boats are essentially American categories built at volumes nothing elsewhere approaches. The inventory correction hit hardest here because the pandemic surge was largest here, and dealer stock cover reached around nine months before clearance began. Outboard propulsion penetration is near total. Growth at 4.8% reflects a mature participation base recovering from an ordering mistake rather than any change in how many people want to go boating. Participation itself barely moved throughout.
Share: 28% | CAGR: 4.8% (2026 to 2036)

Western Europe

Large yacht construction is what puts this region close to the top on value despite modest unit volumes, since Italian and Dutch yards build vessels whose individual prices exceed a hundred production boats. Ferretti, Azimut-Benetti, Sanlorenzo and the Dutch custom yards hold positions built across generations that nobody has successfully challenged. French and Polish production boat manufacture adds volume at the other end entirely, with Poland now among the largest unit producers in Europe. Berth scarcity across the Mediterranean caps ownership growth firmly. Growth at 3.6% is the weakest of the seven regions and understates how much of the world's yacht value originates in a handful of Italian and Dutch towns.
Share: 25% | CAGR: 3.6% (2026 to 2036)
Regional intelligence for 5 additional markets available in the complete report: East Asia, South Asia and Pacific, Latin America, Middle East and Africa, Eastern Europe. Contact sales@marketmindsadvisory.com.
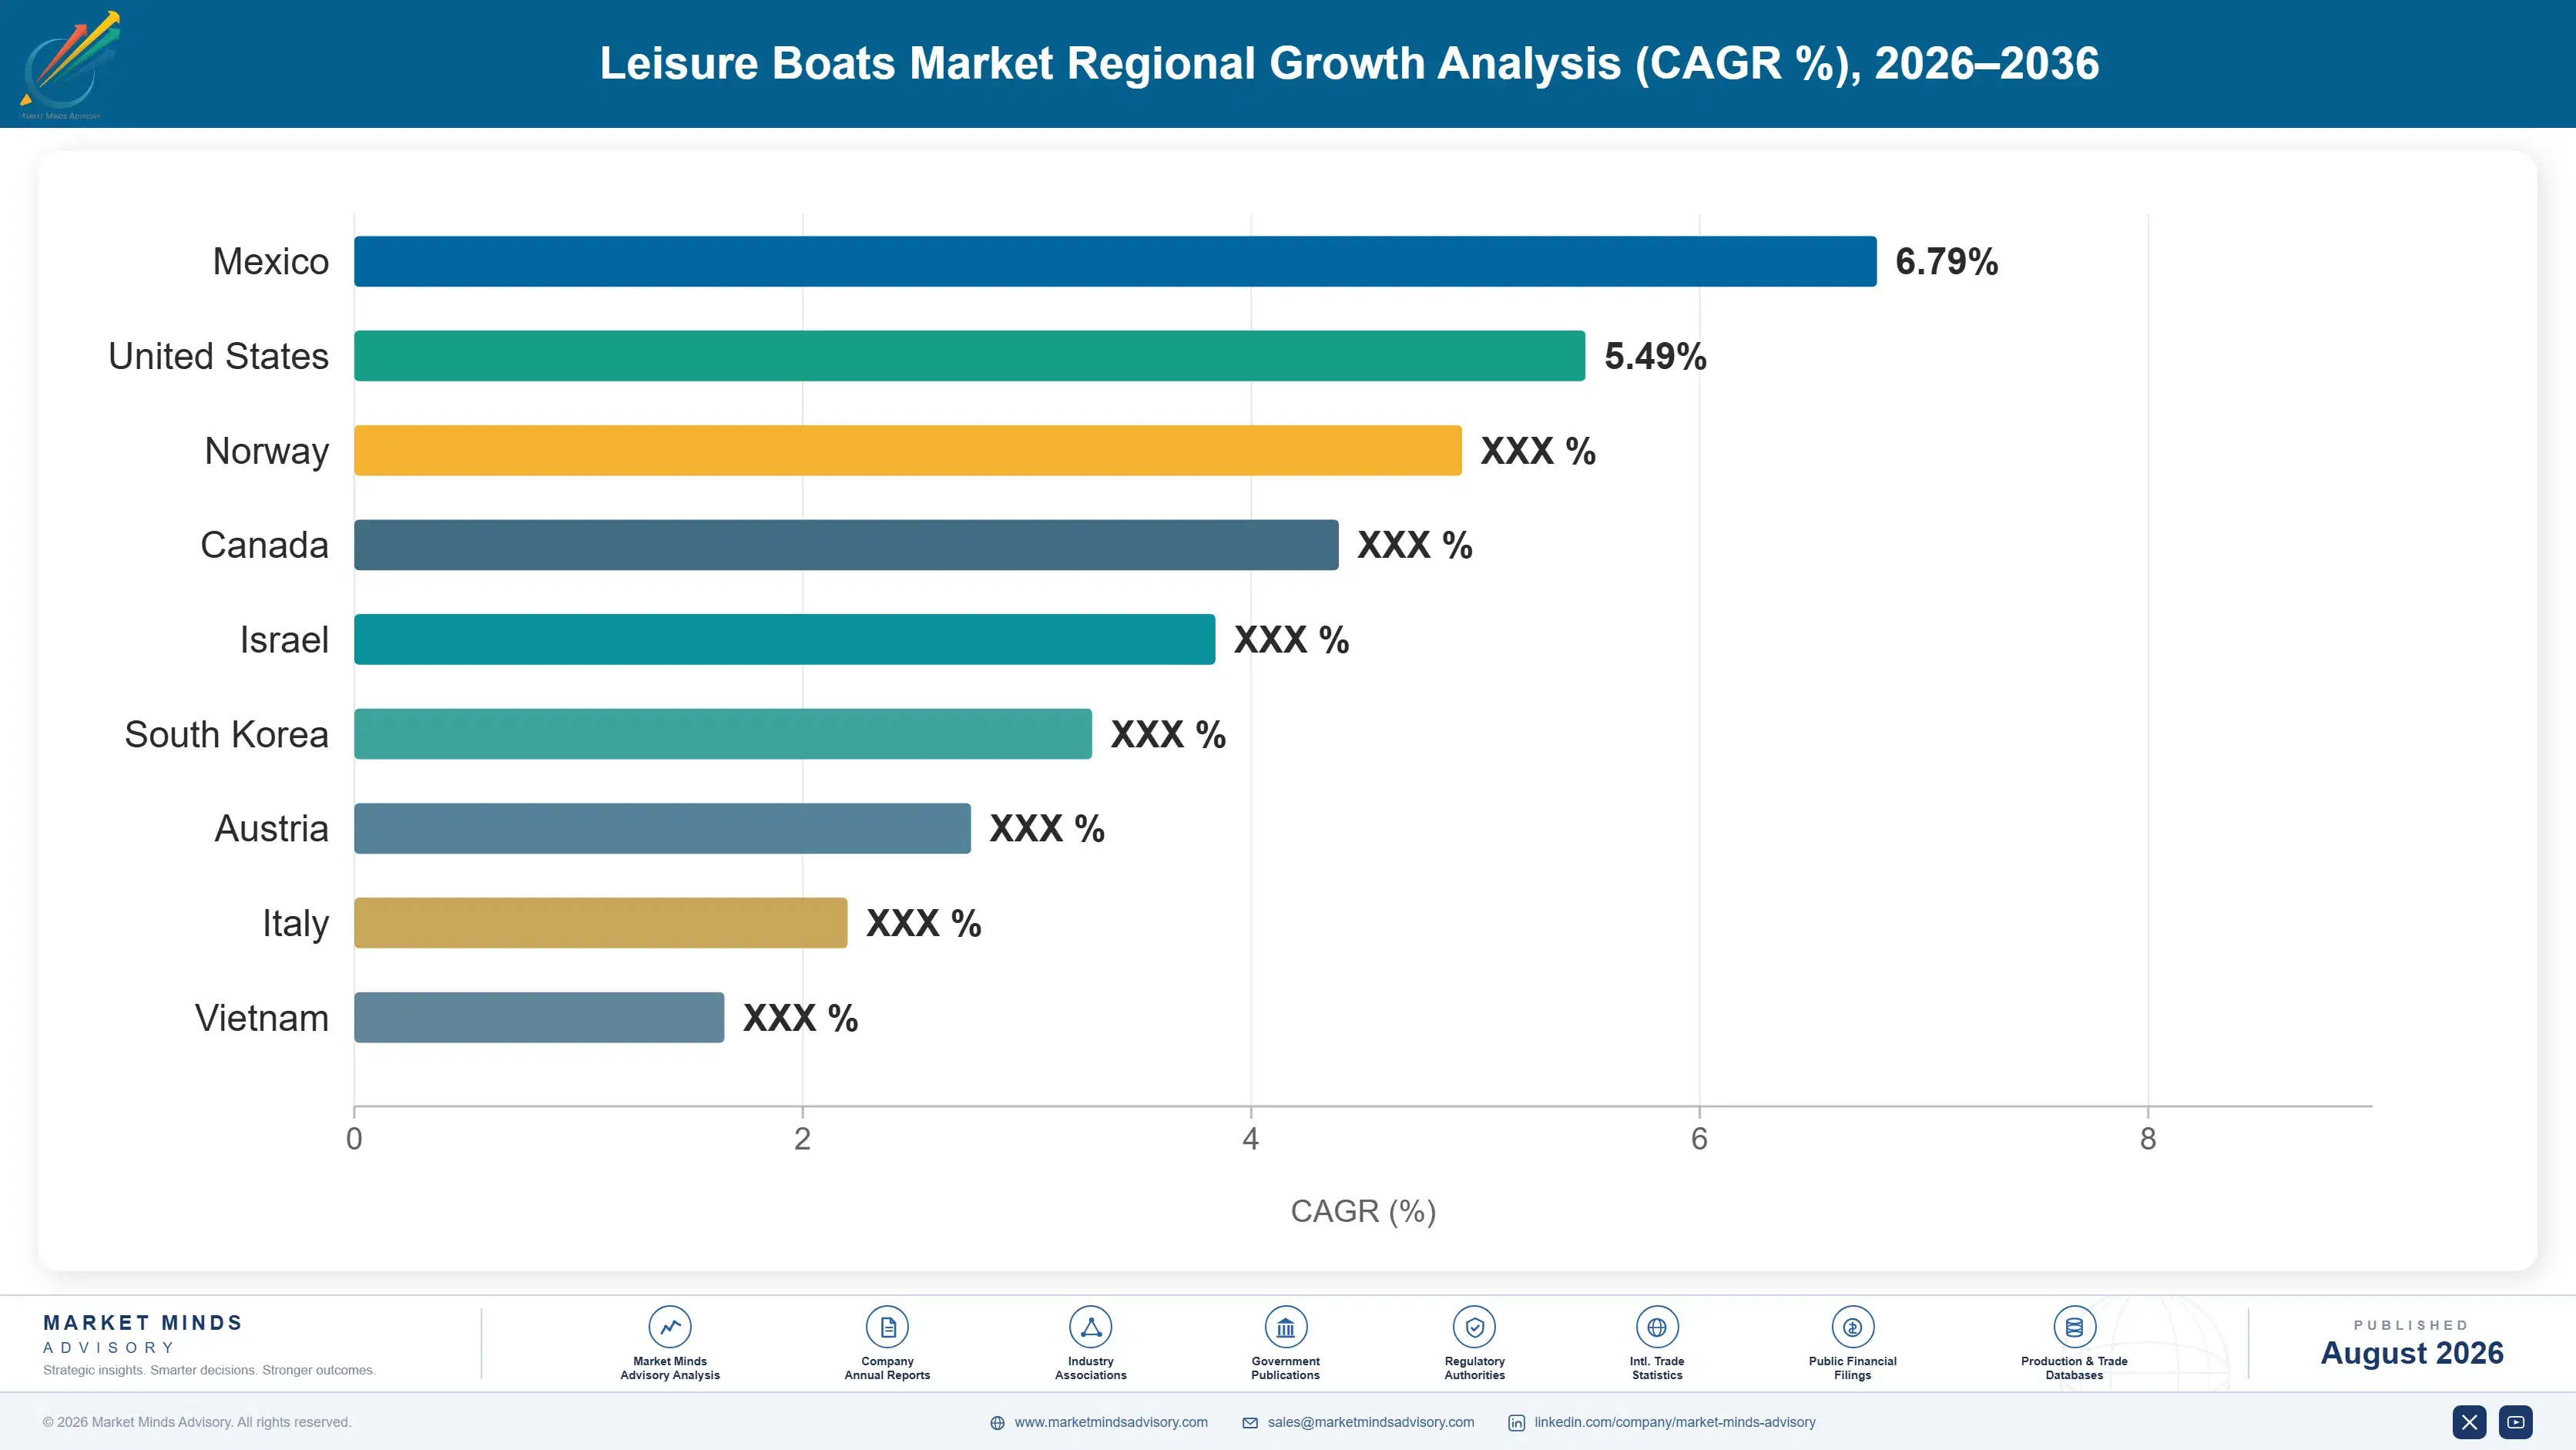
leisure-boats-market-country-cagr-analysis-1787555229402

Where Boat Margin Actually Sits

Four moves matter for a builder that has just spent three years clearing somebody else's ordering mistake. Two are about the value that propulsion took away and how to get some of it back, and two are about the buyers who never bought because there was nowhere to keep a boat. Discounting is not among them.

Build to order and hold dealer allocations tight

Dealer stock cover reaching around nine months against a normal four or five cost this industry three years of production cuts, discounting and damaged residual values, and it happened because builders shipped against orders everybody knew were speculative. Build-to-order production costs volume in a strong market and prevents the same loss in a weak one, which on a full cycle is comfortably the better arrangement. The builders who cut production earliest in 2022 have the cleanest balance sheets now and the ones who kept shipping do not. That comparison is available to anybody who wants to look at it.
Market Impact: Avoids repeating a 9 month dealer inventory overhang

Take back value the outboard transfer removed

Around 81% of new powerboats below twelve metres now use outboards, which moved a large share of what a buyer pays from the builder to an engine manufacturer whose price the customer sees separately. Builders cannot reverse that and can compete for value elsewhere: integrated electronics, seating and layout systems, and factory-fitted equipment packages that a dealer would otherwise source. Every one of those is content a builder controls and prices. Builders treating themselves as hull moulders wrapped around somebody else's engine have accepted a diminished position they did not have to accept.
Market Impact: Recovers value lost behind 81% outboard engine penetration

Design for buyers who have no berth

Marina capacity has barely grown in thirty years across every developed market while interest in boating has not fallen, which leaves a large group of people who would buy a boat and have nowhere to keep one. Trailerable and inflatable formats answer that directly, which is why inflatables grow at 7.8% while berth-dependent categories do not. Designing explicitly for trailer transport, garage storage and single-handed launching reaches buyers the industry has been ignoring for decades. It also removes the berth waiting list from the purchase decision entirely, which is the thing that actually stops the sale.
Market Impact: Reaches a growing segment expanding at 7.8% annually

Follow marina construction into new ownership markets

Berth capacity creates boat ownership rather than following it, which is the opposite sequence from developed markets and it is happening now across the Gulf and Southeast Asia. Marina programmes in Thailand, Vietnam, the United Arab Emirates and Saudi Arabia are building capacity as part of tourism and property development, and every berth is a boat somebody will eventually buy. Builders present at the marina planning stage secure dealer appointments and brand presence before any competitor arrives. Growth in those regions runs well ahead of the 5.2% market average and depends on construction timetables anybody can read.
Market Impact: Enters new markets growing above the 5.2% average

Who Controls the Margin Pool

Five builders hold 33% of new leisure boat revenue, measured at builder level including factory-fitted propulsion, the basis used throughout this section. That fragmentation is real and follows from geography: boats are built close to the water they will be used on, and hundreds of yards serve regional markets nobody consolidates. The gap between the leaders and everybody else is dealer network reach rather than any manufacturing advantage.
Competition runs on three dimensions. Dealer network density, which decides who a buyer can actually see and test before purchasing. Brand and residual value, since a boat is a large discretionary purchase and buyers care what it will be worth in seven years. And propulsion partnership, because the engine is a large share of what the customer pays and the relationship with the engine maker matters commercially. Manufacturing cost competes least.

Rankings shift on balance sheet strength rather than on product, since the correction damaged builders who kept shipping and rewarded those who cut early. Several smaller yards did not survive it and their dealer slots have been taken. Large yacht positions in Italy and the Netherlands were essentially untouched, because that business never depended on dealer inventory in the first place.
leisure-boats-market-company-positioning-matrix-1787555229929

Competitive Moat and Risk Dimensions

BRUNSWICK CORPORATION

Moat: Propulsion and boat integration

Brunswick builds boats and owns Mercury Marine, which means it captures the engine value that every other builder hands to a supplier. That vertical position is unique at this scale and it matters more each year as outboard content rises as a share of what a buyer pays. Competitors negotiate with an engine maker and Brunswick simply decides.
BRUNSWICK CORPORATION

Risk: Cyclical exposure across everything

Owning boats and engines means both halves of the business move together through a cycle, which amplifies rather than diversifies. The inventory correction hit the boat brands and the engine business simultaneously with nothing to offset it. Competitors selling engines to the whole industry ride the cycle at industry level rather than at their own brand level.
GROUPE BENETEAU

Moat: Sailing and motor breadth

Beneteau builds across sailing and motor categories and across price points that few competitors span, which lets a dealer carry one supplier and serve almost any customer walking in. Sailing yacht capability in particular is a genuinely narrow field, since the design and rigging knowledge does not transfer from powerboat construction and takes decades to build properly.
GROUPE BENETEAU

Risk: Sailing segment decline exposure

Sailing yachts and dinghies grow at around 3% and the participation base is ageing faster than it is replacing itself in most markets. Capability that competitors cannot match is worth less when the category it serves contracts. Charter fleet demand supports volumes and it buys differently and at lower margin than private owners do.

Players Tracked

Prominent Players

Brunswick Corporation
Groupe Beneteau
Yamaha Motor
Malibu Boats
Ferretti Group

Other Key Players

Azimut-Benetti
Sanlorenzo
Bavaria Yachts
Sunseeker International
Marine Products Corporation
MasterCraft Boat Holdings
Correct Craft
Polaris
White River Marine Group
Zodiac Nautic
Hanse Yachts
Dufour Yachts
Fountaine Pajot
Grand Banks Yachts
Feadship

Recent Developments

MARCH 2025

Brunswick Corporation reduced production capacity across several boat brands

Brunswick Corporation cut production capacity and consolidated manufacturing across several boat brands, responding to dealer inventory levels that clearance had not fully resolved. The decision was an internal restructuring rather than any transaction, and it reflects a builder choosing balance sheet discipline over volume through the correction.
Signal: Capacity is being taken out rather than filled, which suggests builders expect underlying demand below pandemic-era assumptions
AUGUST 2025

A Swedish builder expanded hydrofoil electric boat production

A Swedish builder increased production capacity for hydrofoiling electric leisure boats, targeting buyers for whom conventional electric range has never been sufficient. The expansion was organic and internally funded rather than any partnership, and it addresses the energy arithmetic that has constrained electric propulsion at around 4% of deliveries.
Signal: Foiling rather than bigger batteries is how electric propulsion becomes credible, and the industry took a decade to notice
JANUARY 2026

A Gulf developer opened marina capacity ahead of any boat demand

A Gulf development programme brought substantial new marina berth capacity into service as part of a wider tourism and property scheme rather than in response to existing boat ownership. This was infrastructure investment rather than any marine industry transaction, and berth availability now precedes demand in the region.
Signal: Berths creating ownership rather than following it reverses the sequence every developed market experienced, and builders should be present

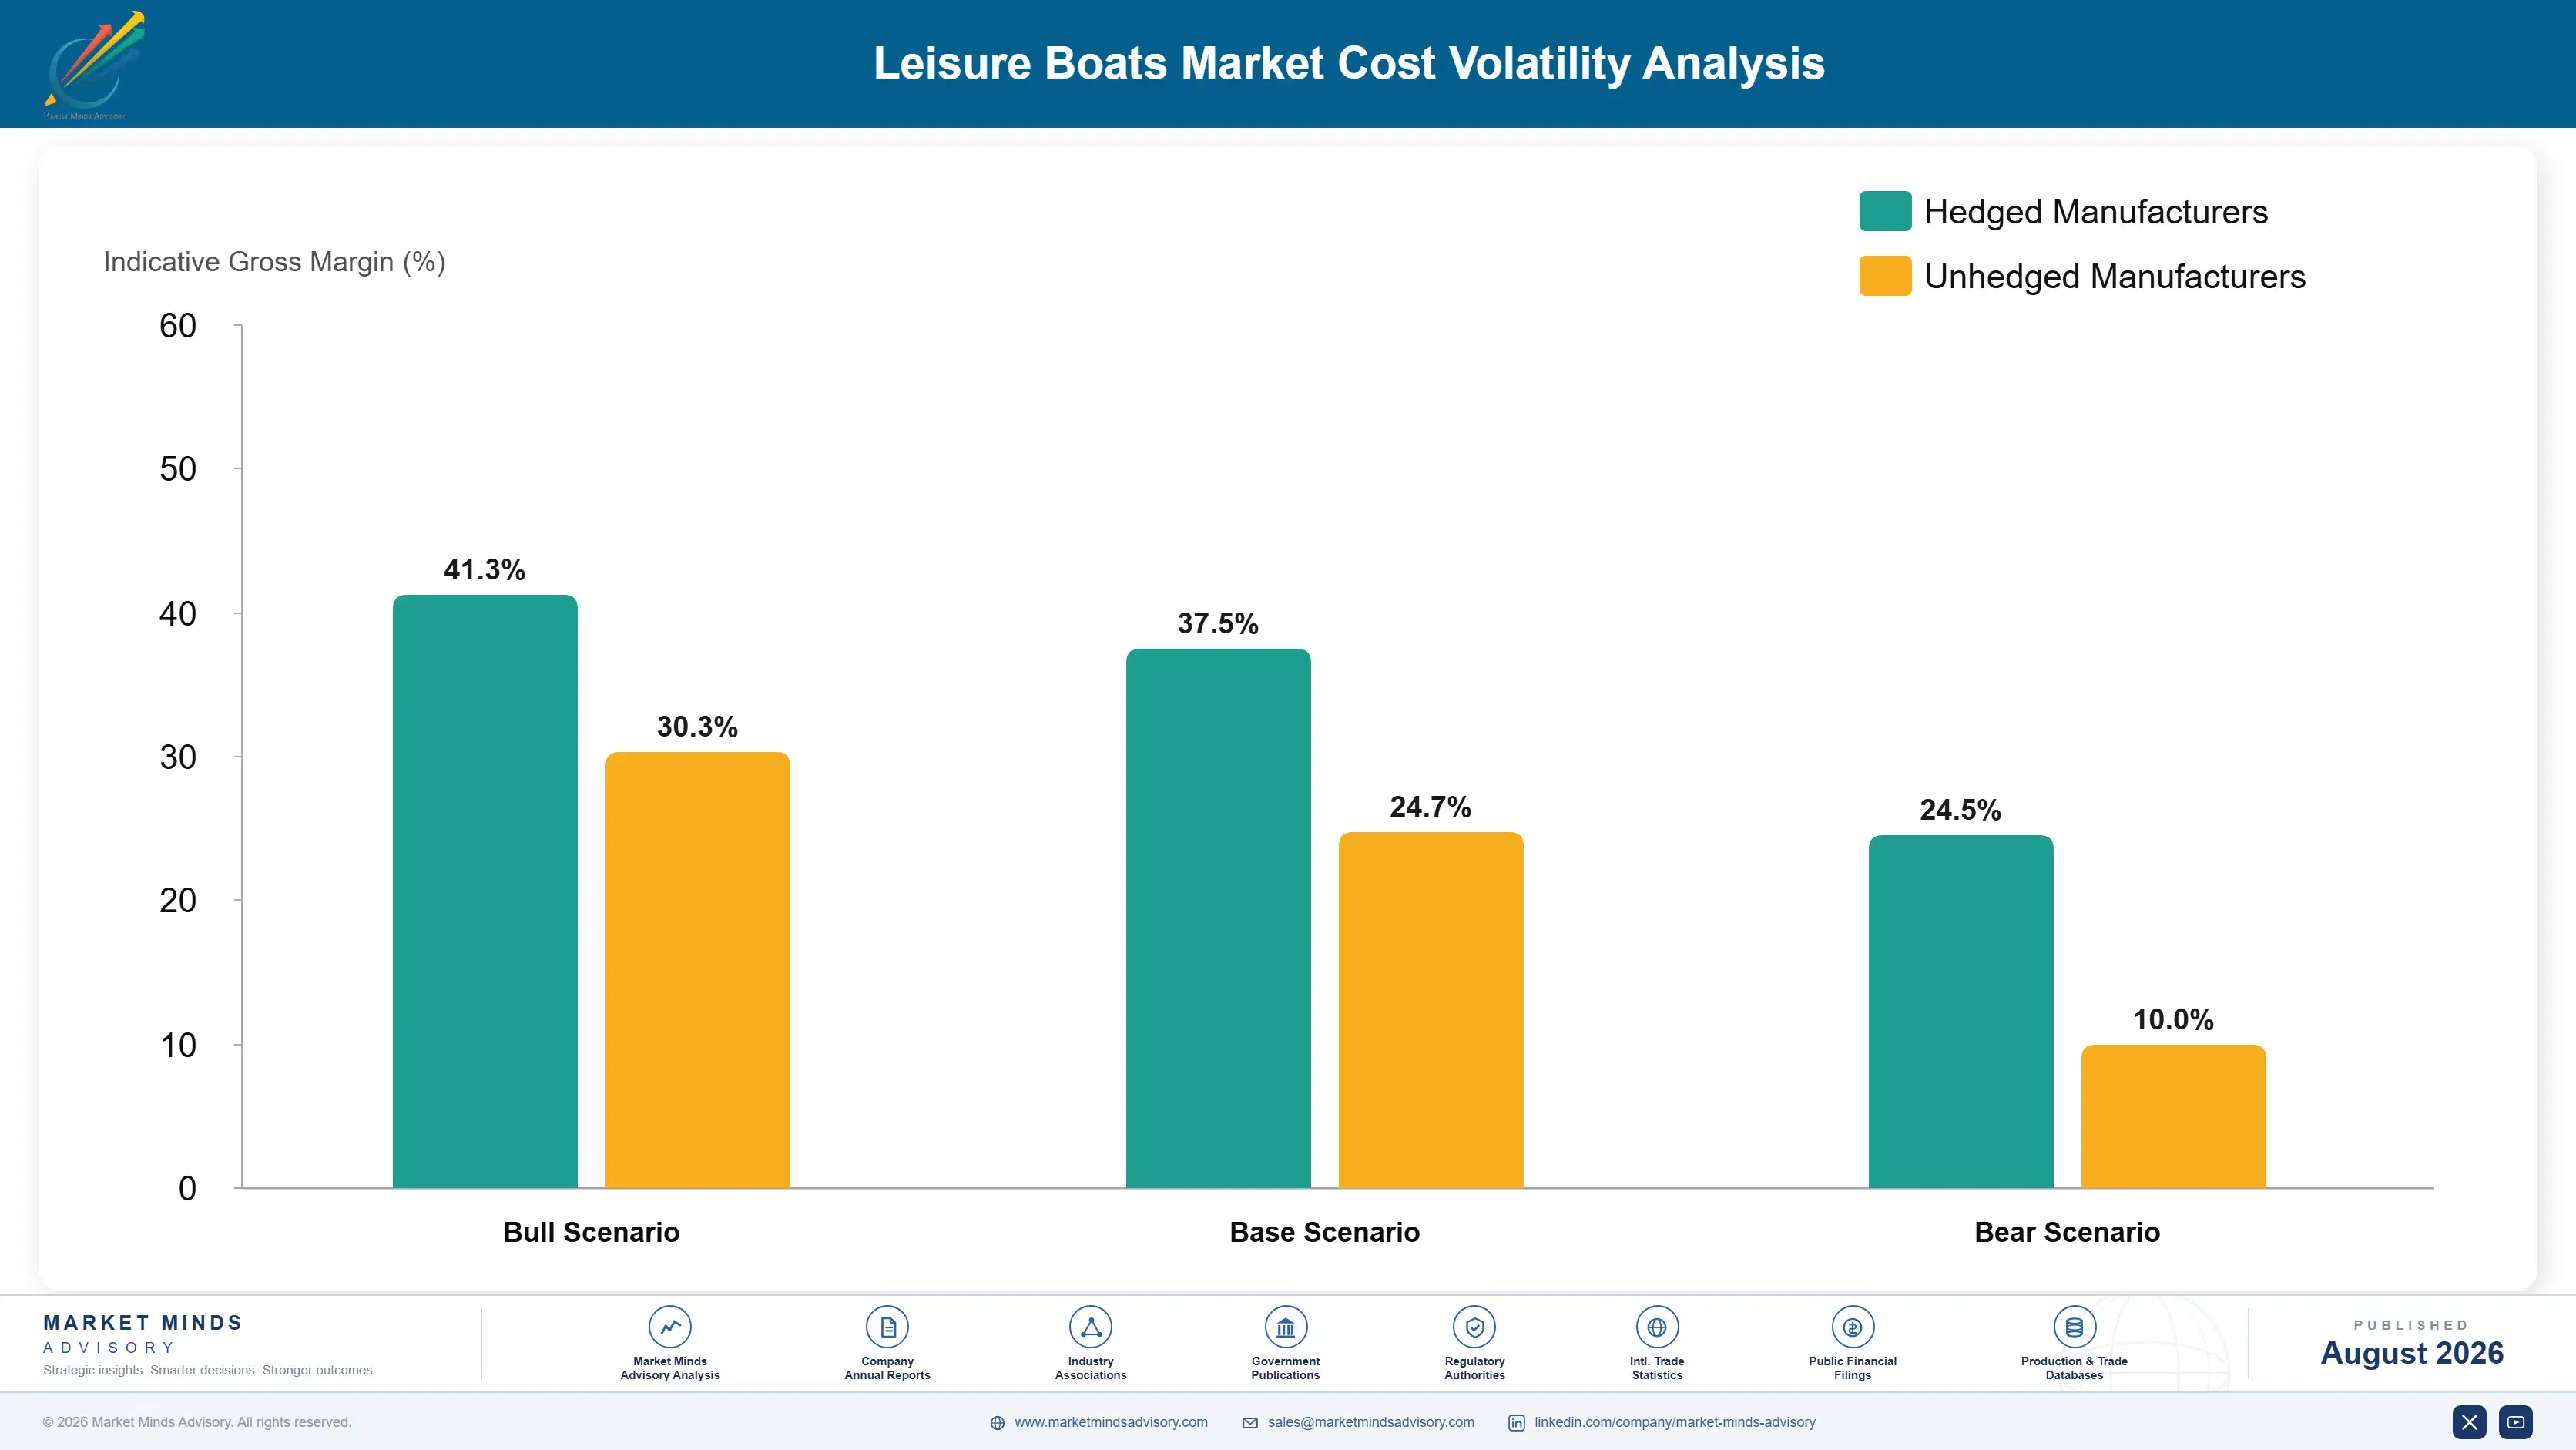
What Moves Builder Cost

Composite laminate and moulding account for around 38% of builder cost, with the propulsion package, fitted equipment, interior joinery and assembly labour making up the balance. Glass fibre and resin come from regional suppliers on annual contracts. Outboard engines are bought in by every builder except one. Skilled laminating and joinery labour is scarce in every market.
Resin and glass fibre prices moved sharply through 2021 and 2022 as petrochemical feedstock and European energy costs rose together, and IEA data show European industrial gas well above American levels then. Brunswick recorded input cost pressure across its boat and propulsion operations in its Annual Report 2022. Builders on published model year pricing absorbed most of the movement, because a boat price is set before the season.

Model year pricing is what makes this exposure awkward. A builder sets prices before a season and delivers through it against a cost base that may move, with no mechanism to reprice a boat a dealer has already sold. Large yacht builders face none of this, since a custom vessel is priced individually and contracted with escalation. Builders with captive propulsion carry different exposure from merchant buyers.
leisure-boats-market-cost-volatility-analysis-1787555230127

Index model year pricing to published resin benchmarks

Setting a season price before knowing the resin cost transfers petrochemical volatility to the builder across months nobody forecasts. Indexing to published polyester and glass fibre benchmarks with a mid-season adjustment removes the exposure, and dealers accept it once they understand the alternative is a padded model year price. Resistance comes from marketing rather than from anybody commercial.

Move to closed-mould infusion where volume justifies it

Open moulding wastes resin, releases styrene that regulators keep tightening on, and produces weight variation that costs performance. Closed-mould infusion uses less material, meets emissions requirements without extraction investment and produces consistent laminate weight. The capital required is real and the payback is in resin cost and compliance together. Builders still open moulding are paying twice for the same decision.

Contract propulsion supply on multi-year terms

The engine is a large share of what a buyer pays and every builder except one purchases it from a supplier who also sells to competitors. Multi-year supply agreements secure both allocation and pricing that a season-by-season purchase never achieves. Engine makers prefer the visibility as much as builders do, which makes this an easier negotiation than most builders assume.

Portfolio Architecture for Margin Defence

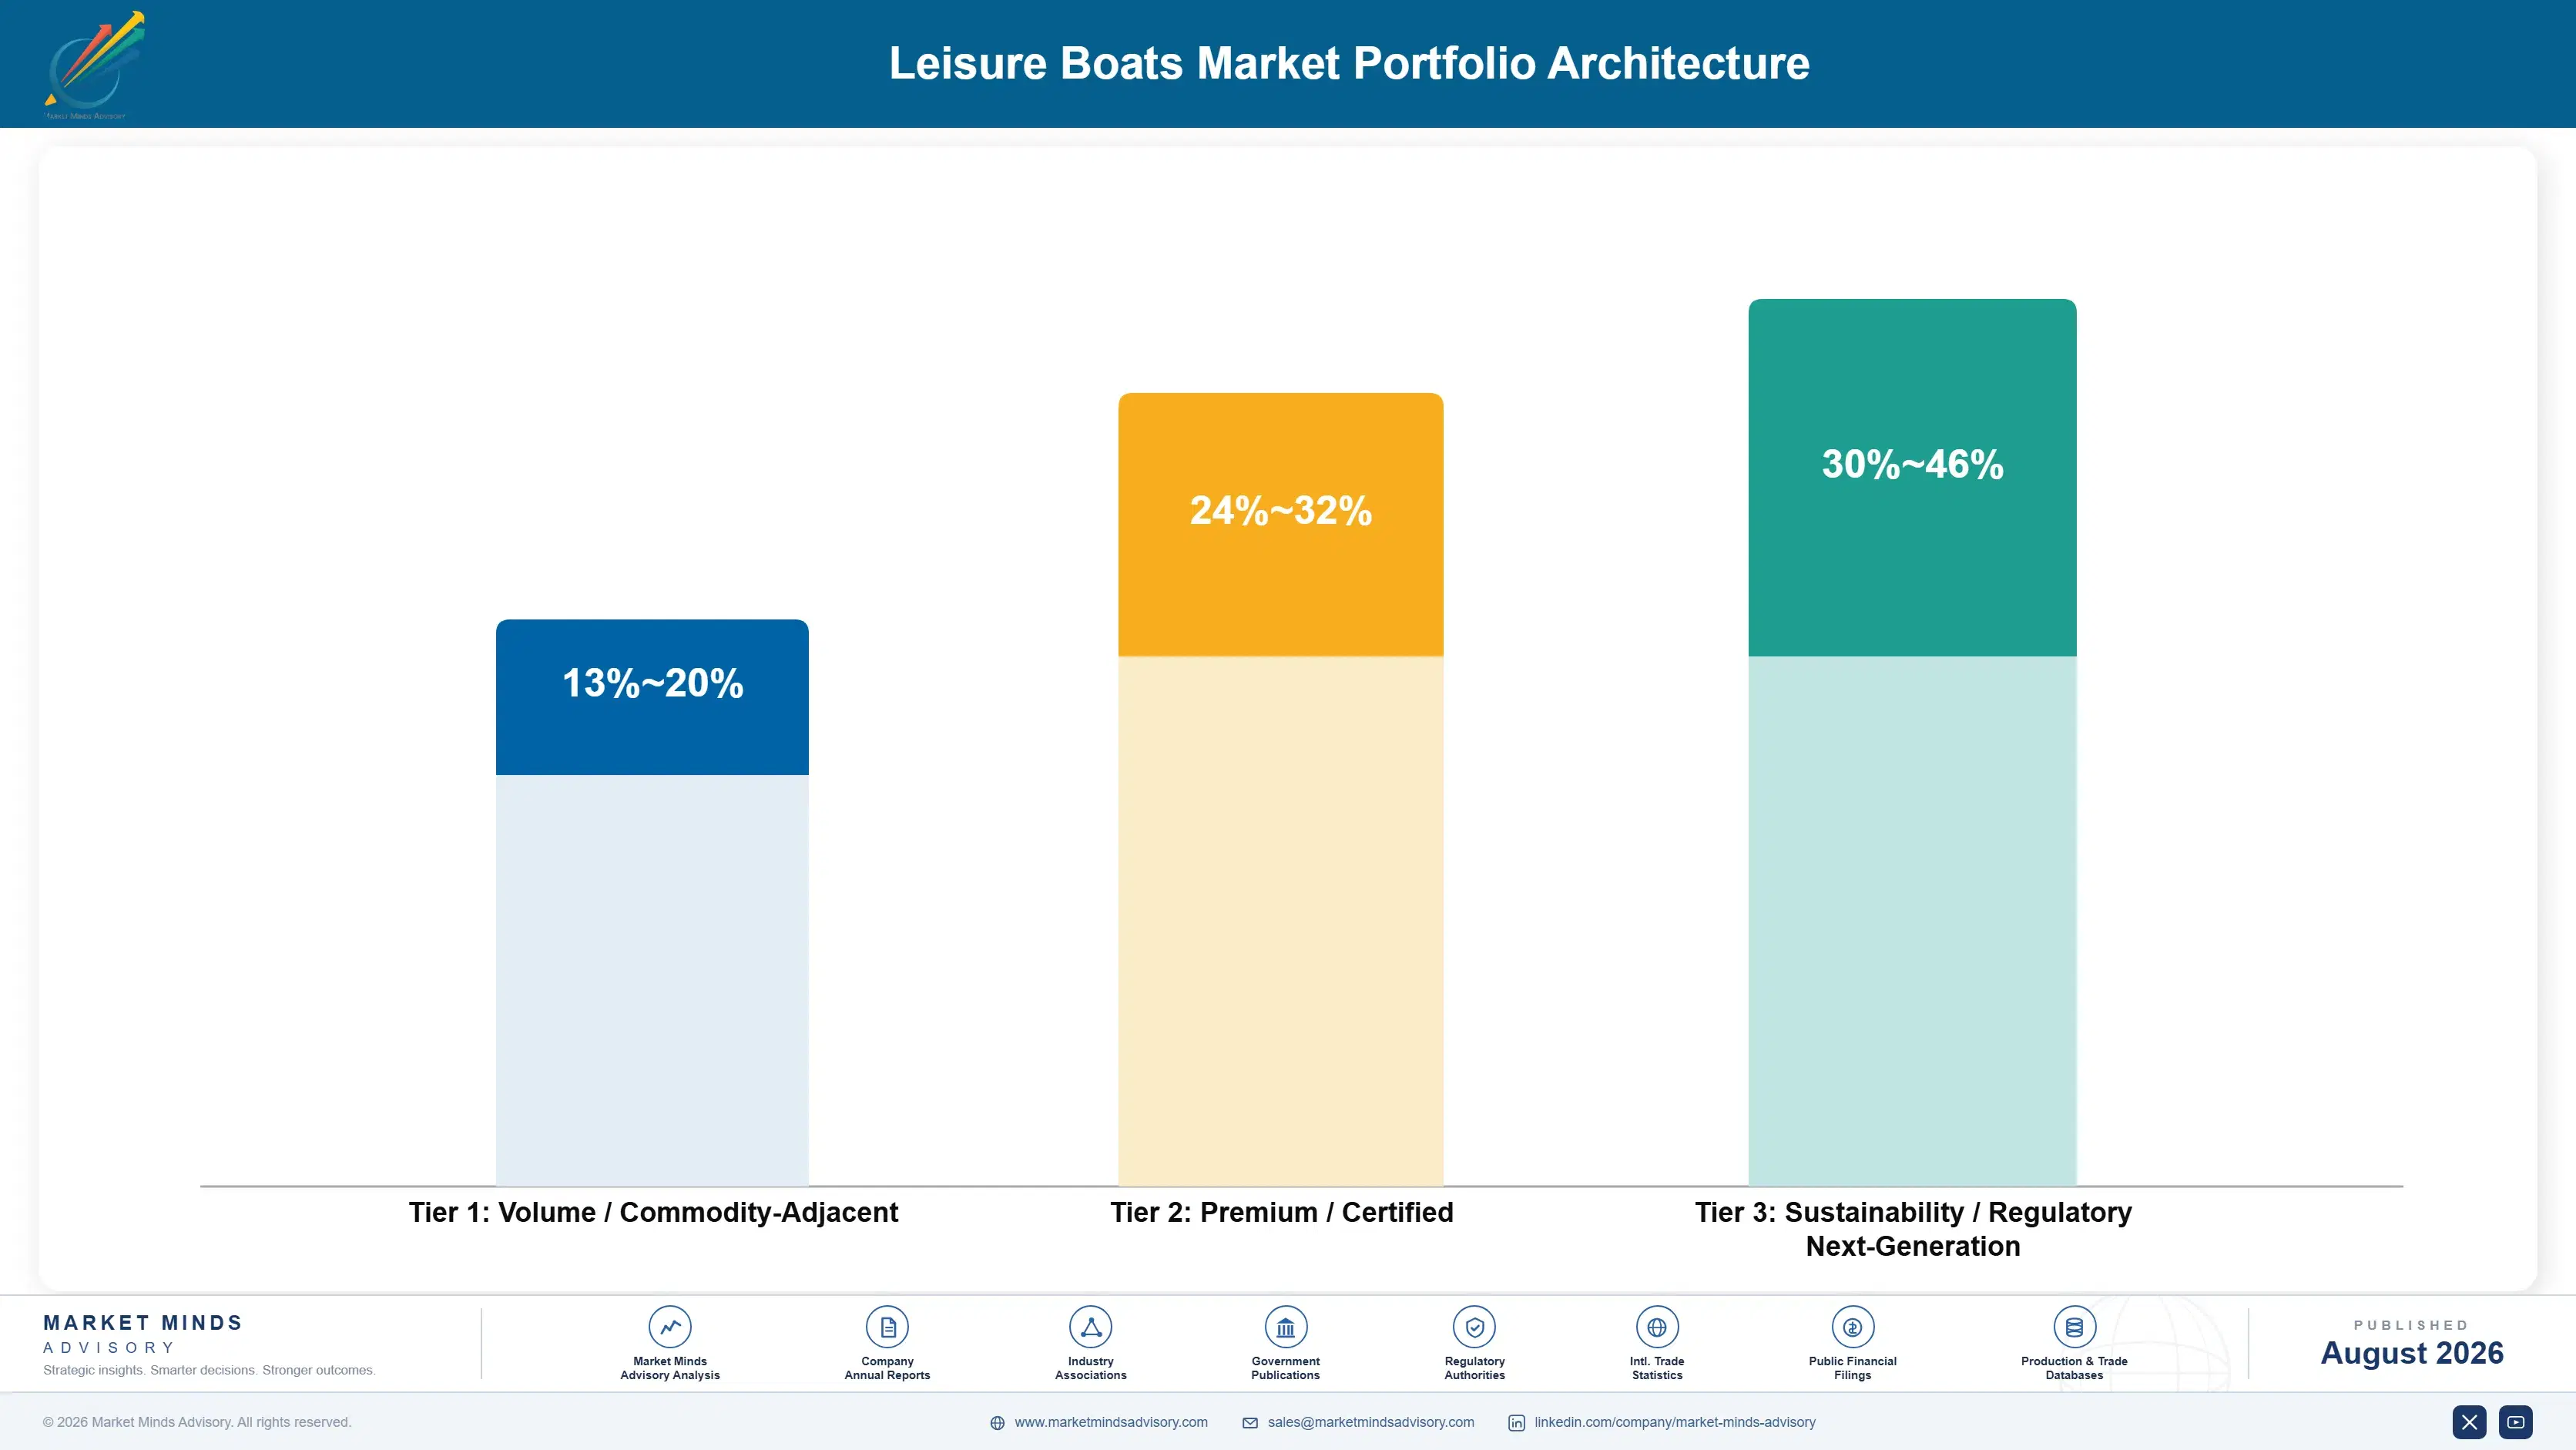
Margin in boat building tracks brand and category rather than manufacturing efficiency, since moulding a hull is not difficult and many yards do it adequately. Volume outboard powerboats and personal watercraft run at gross margins in the mid teens, competing against every builder a dealer could carry. Premium wake and performance boats run considerably higher on brand and specification. Large motor yachts run higher again, because a bespoke build is priced individually and the customer is not comparing quotations.
The tension is that volume categories fill the moulding shops and premium categories earn the returns, and the two need different labour and different dealer relationships. A yard tooled for high-volume production handles bespoke specification badly, and the craftsmen who do bespoke work will not do production. Builders running both from one site have generally found the volume schedule consuming the skilled labour that premium work required, which shows up as delivery delays on the boats that matter most.

High-value pools sit in large yacht construction, premium performance categories and any content a builder controls rather than buys. None of the three is where the unit volume is. Moulding capacity by itself defends nothing at all in this industry.

Volume / Commodity-Adjacent

Volume outboard powerboats, personal watercraft and entry inflatables sold through dealer networks against every comparable builder a dealer could stock instead. The seven-point range separates builders with captive propulsion or closed-mould production from those buying engines and open moulding at volume.
Gross Margin: 13%-20%

Premium / Certified

Premium wake, performance and cruising boats where brand, specification and residual value carry the purchase rather than price comparison. The eight-point spread reflects brand strength, which takes decades to build and shows in what a boat is worth seven years later.
Gross Margin: 24%-32%

Sustainability / Regulatory / Next-Generation

Large motor yachts and superyachts, hydrofoil electric platforms and recyclable-hull construction. The sixteen-point range is genuinely wide because a bespoke yacht is priced individually and an electric foiling platform is priced against scarcity rather than against anything comparable.
Gross Margin: 30%-46%
leisure-boats-market-portfolio-architecture-1787555230624

High-value Sub-segments and Strategic Watch-out

Rigid Inflatable Formats

Growing at 7.8% and bringing new owners into the market rather than moving existing ones around, because it needs no berth and tows behind a vehicle a family already owns. Superyacht tender demand adds a high-value layer most volume builders never see at all. That layer is worth studying.
Gross Margin: 22%-32%

Large Yacht Construction

Growing at 6.4% on wealth concentration rather than participation, which made it almost immune to the inventory correction that convulsed volume boating. Italian and Dutch yards hold generational positions nobody has challenged successfully. Build slots run years ahead of demand. That business behaves entirely differently.
Gross Margin: 30%-46%

Volume Outboard Powerboats

The category that fills moulding shops and dealer floors, recovering from a correction that reached nine months of stock cover. Every builder a dealer could carry competes for the same buyer. Manage it for utilisation and residual value rather than for margin. Residual value is the real asset.
Gross Margin: 13%-20%

Hydrofoil Electric Platforms

Electric propulsion sits at 4% of deliveries and fails on range for every hull that stays in the water. Foiling changes the energy arithmetic enough to make a usable range possible, which is the only version of this that has worked commercially anywhere. Very few builders can do it.
Gross Margin: 32%-46%

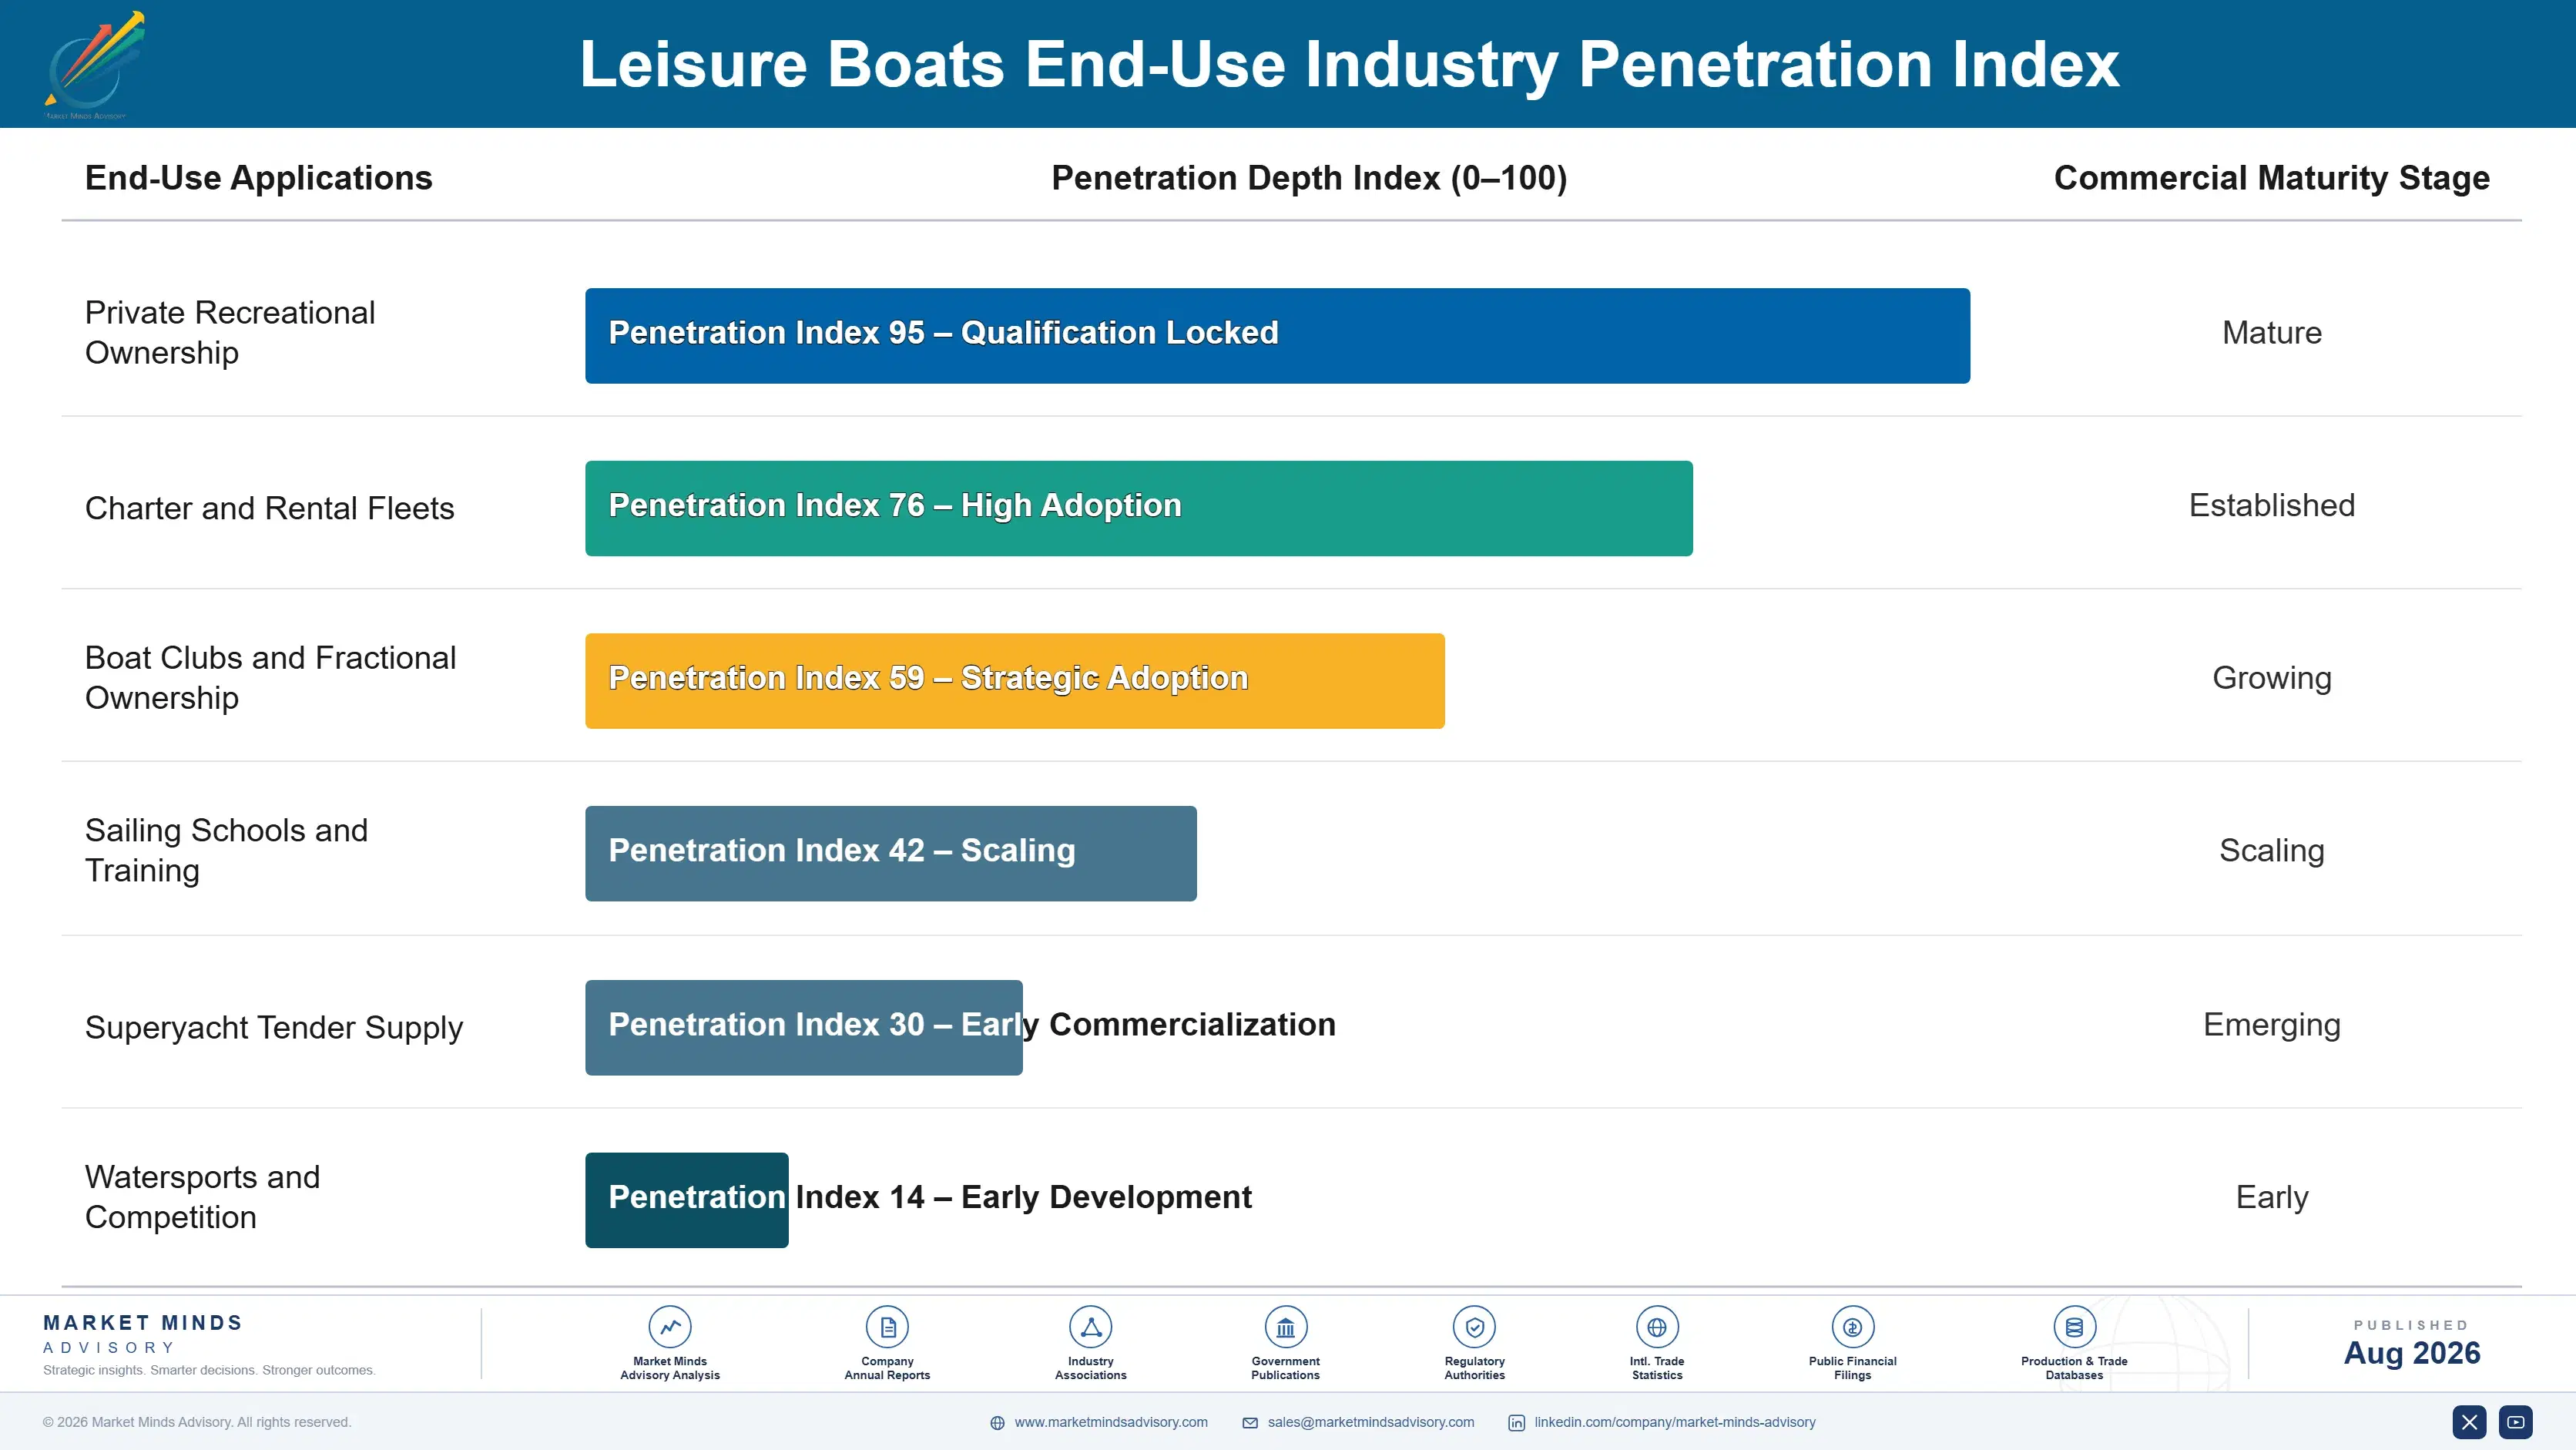
How Boat Demand Renews

Boat demand renews on an ownership cycle averaging around seven years. An owner trading up generally stays within a brand family if the experience was good and leaves permanently if it was not. Underneath that sits participation, which grows slowly with population and access and fell far less through the correction than unit sales did. The gap between the two is what the inventory overhang actually was.
Stickiness runs through the dealer as much as the brand. A buyer returns to the dealer who serviced the last boat properly and will change brand to stay with them, which makes the dealer relationship the asset a builder rents rather than owns. Large yacht buyers behave completely differently, returning to a yard on the strength of the first build. Charter operators buy on fleet economics and change supplier readily.

The buyer has changed less than the industry pretends. Boat purchase still sits with a household making a discretionary decision about leisure time and money, comparing a boat against a caravan and a holiday rather than against another boat. What has changed is the storage question, which now arrives earlier in the conversation than it used to.
leisure-boats-market-end-use-penetration-index-1787555231111

Where To Place The Bet

These are among the four positions where our research anticipates prominent divergence between winners and laggards over the coming forecast period. Each is grounded in the demand model, the regulatory perimeter, and the announced capacity pipeline.
01 / PRODUCTION DISCIPLINE PRIORITY

Build to order rather than to forecast

Dealer stock cover reaching around nine months against a normal four or five cost this industry three years of production cuts, discounting and permanently damaged residual values across several brands. It happened because builders shipped against dealer orders that everybody involved understood were speculative and nobody wanted to be caught short of. Build-to-order costs volume in a strong market and prevents that loss entirely in a weak one, which across a full cycle is comfortably the better arrangement to hold onto.
02 / CONTENT VALUE RECOVERY

Own more of what the buyer pays for

Around 81% of new powerboats below twelve metres now leave the factory with outboard engines, which moved a substantial share of what a buyer pays from the builder to a supplier whose price the customer sees separately. That cannot be reversed and it can be answered, because integrated electronics, seating and layout systems and factory-fitted equipment packages are all content a builder controls and prices itself. Builders behaving as hull moulders wrapped around somebody else's engine have accepted a diminished position they never had to accept.
03 / BERTH-FREE DESIGN FOCUS

Design for buyers who have nowhere to moor

Marina capacity has barely grown in thirty years across every developed market while interest in boating has not measurably fallen, which leaves a large group who would buy a boat and have no realistic place to keep one. Trailerable and inflatable formats answer that objection directly, which is exactly why inflatables compound at 7.8% while berth-dependent categories simply do not. Designing explicitly for trailer transport, garage storage and single-handed launching removes the waiting list from the purchase decision entirely and permanently.
04 / MARINA-LED MARKET ENTRY

Follow the berths into new ownership markets

Across the Gulf and Southeast Asia, marina berth capacity is being created as part of tourism and property development rather than in response to any existing boat demand, which reverses the sequence every developed market experienced. Every berth built is a boat somebody will eventually buy, and growth across those regions runs well ahead of the 5.2% market average on construction timetables that anybody can read. Builders present at the marina planning stage secure dealer appointments before a competitor has noticed the market exists.

Engagement Snapshot From the Field

A live engagement with an industry participant carrying material or product regulatory and market exposure ahead of a defining policy shift, showing how our research translates into a defensible multi-year portfolio strategy.
MARKET MINDS ADVISORY · CLIENT ENGAGEMENT SUMMARY
Leisure Boats Producer Strategic Portfolio Review and Transition Roadmap 2026·Investment Scenario on Leisure Boats Exposure Evaluation 2025-26
CLIENT PROFILE
A European production boat builder with annual revenue around EUR 420 million (client-reported, unverified by MMA), producing outboard powerboats and cruising motor yachts across two yards. Distribution ran through independent dealers in eighteen markets. Outboard engines were purchased season by season from two suppliers. The business had shipped heavily into dealer inventory through 2021 and 2022 without any allocation discipline.
STRATEGIC CHALLENGE
Dealer stock cover across the network stood at roughly eleven months in early 2024 (client-reported, unverified by MMA) and clearance discounting had damaged residual values on two model ranges. Production had been cut twice. Management proposed a third cut and a price reduction. Nobody had examined whether the problem was demand or the ordering system that had created the position.
MMA APPROACH
MMA separated the client's volume decline into underlying participation change and inventory correction using registration data across the served markets rather than accepting dealer order patterns as demand. Residual value damage was quantified by model range against comparable competitors. Dealer allocation practice was benchmarked through the expert interview programme, and the case for build-to-order was modelled across a full cycle rather than a single season.
KEY FINDINGS
  1. Underlying registrations across the served markets had fallen only modestly, which meant the volume decline was almost entirely an inventory correction rather than any loss of demand.
  2. A third production cut would have deepened the residual value damage without clearing stock faster, since the discounting rather than the volume was what buyers had noticed.
  3. Two of the eighteen dealer markets held over half the excess inventory, which had never been visible because allocation was managed at group level rather than by market.
  4. Season-by-season engine purchasing had cost the client both allocation priority and pricing against competitors holding multi-year agreements with the same two suppliers.
CLIENT PROFILE
A European production boat builder with annual revenue around EUR 420 million (client-reported, unverified by MMA), producing outboard powerboats and cruising motor yachts across two yards. Distribution ran through independent dealers in eighteen markets. Outboard engines were purchased season by season from two suppliers. The business had shipped heavily into dealer inventory through 2021 and 2022 without any allocation discipline.
STRATEGIC CHALLENGE
Dealer stock cover across the network stood at roughly eleven months in early 2024 (client-reported, unverified by MMA) and clearance discounting had damaged residual values on two model ranges. Production had been cut twice. Management proposed a third cut and a price reduction. Nobody had examined whether the problem was demand or the ordering system that had created the position.
MMA APPROACH
MMA separated the client's volume decline into underlying participation change and inventory correction using registration data across the served markets rather than accepting dealer order patterns as demand. Residual value damage was quantified by model range against comparable competitors. Dealer allocation practice was benchmarked through the expert interview programme, and the case for build-to-order was modelled across a full cycle rather than a single season.
KEY FINDINGS
  1. Underlying registrations across the served markets had fallen only modestly, which meant the volume decline was almost entirely an inventory correction rather than any loss of demand.
  2. A third production cut would have deepened the residual value damage without clearing stock faster, since the discounting rather than the volume was what buyers had noticed.
  3. Two of the eighteen dealer markets held over half the excess inventory, which had never been visible because allocation was managed at group level rather than by market.
  4. Season-by-season engine purchasing had cost the client both allocation priority and pricing against competitors holding multi-year agreements with the same two suppliers.
RECOMMENDED STRATEGY
Phase 1: Phase one: cancel the third production cut and the price reduction, and clear the two problem markets through targeted dealer support rather than list price. Phase 2: Phase two: move to build-to-order with market-level allocation caps, accepting lost volume in strong seasons to prevent a repeat of this position. Phase 3: Phase three: negotiate multi-year engine supply agreements with volume commitment, which addresses both the allocation and the pricing disadvantage at once.
OUTCOME
The third cut and the price reduction were both cancelled and the two problem markets cleared through dealer support instead. Build-to-order with market-level caps operates from the 2026 model year. A multi-year engine agreement is signed with one supplier, and the client reports residual values on both affected ranges stabilising (client-reported, unverified by MMA).

Frequently Asked Questions

Foundational context covering the market sizes, CAGR, scope, country, region and competition that inform every finding below. This section is provided to cover basics and most often pre-purchase conversations, answered from the MMA Primary Research Dataset.

What is the current size of the Leisure Boats Market?

The market was valued at USD 32.4 billion in 2025, rising to an estimated USD 34.08 billion in 2026. North America holds the largest regional share at 28% of value.

How large will the Leisure Boats Market be by 2036?

MMA forecasts USD 56.59 billion by 2036 under the base case, an expansion multiple of 1.66 times the 2026 value. That represents USD 22.51 billion of incremental value.

What is the CAGR for the Leisure Boats Market 2026 to 2036?

The base case runs at 5.2% compound annual growth between 2026 and 2036, with a bull case at 6.4% and a bear case at 4.0%. Historical growth from 2020 to 2025 was 4.2%.

Which segment is growing fastest?

Inflatable and rigid inflatable boats lead at 7.8%, half again the market rate, because they need no berth and tow behind an ordinary vehicle. Motor yachts follow at 6.4%.

Who are the major companies in the Leisure Boats Market?

Brunswick Corporation, Groupe Beneteau, Yamaha Motor, Malibu Boats and Ferretti Group hold 33% between them. Dealer network reach rather than manufacturing scale sustains those positions.

Which country is growing fastest?

India leads at 8.2%, driven by coastal and backwater tourism and a domestic building industry around Goa and Kerala. The base remains genuinely small for now.

Report Segmentation Architecture

The full report scope spans multiple orthogonal segmentation dimensions, with cross-tabulated demand data provided for each dimension pair. Coverage extends further to regional breakdowns, trend trajectories, and the competitive detail needed to support segment-level decision-making.

By Hull and Propulsion Configuration

  • Outboard Powerboats
  • Personal Watercraft
  • Inflatable and Rigid Inflatable Boats
  • Sailing Yachts and Dinghies
  • Motor Yachts and Superyachts
  • Inboard and Sterndrive Powerboats

By End-Use Industry

  • Private Recreational Ownership
  • Charter and Rental Fleets
  • Boat Clubs and Fractional Ownership
  • Sailing Schools and Training
  • Superyacht Tender Supply
  • Watersports and Competition

By Sales Channel

  • Independent Dealer Network
  • Factory Direct Sale
  • Boat Show Order
  • Brokerage and Trade-In
  • Charter Fleet Supply

By Region

  • North America
  • Western Europe
  • East Asia
  • South Asia and Pacific
  • Latin America
  • Middle East and Africa
  • Eastern Europe

Scope, Methodology, and Coverage

Every figure in this report is reproducible from documented input assumptions. The scope below maps the historical period, the forecast horizon, the segmentation dimensions, and the countries covered, alongside the underlying primary and qualitative methodology.
Historical Period
2020 to 2025
Forecast Period
2026 to 2036
Base Year
2025 (USD billions; MMA Primary Research Dataset, August 2026)
Market Definition
The market comprises recreational watercraft sold new to private, club and charter owners, covering outboard powerboats, personal watercraft, inflatable and rigid inflatable boats, sailing yachts and dinghies, motor yachts and superyachts, and inboard and sterndrive powerboats. Value is measured at builder level including factory-fitted propulsion and equipment. Commercial fishing and workboats, government patrol and rescue craft, boat trailers, marina and dry stack infrastructure, engines sold separately into the aftermarket, and brokerage of used vessels fall outside scope.
Quantitative Units
USD billions (current prices); thousand new boats delivered annually; USD per unit by hull and propulsion configuration
Segmentation Dimensions
By Hull and Propulsion Configuration; By End-Use Industry; By Sales Channel; By Region
Regions Covered
North America, Western Europe, East Asia, South Asia and Pacific, Latin America, Middle East and Africa, Eastern Europe
Countries Covered
United States, Canada, Mexico, Brazil, Argentina, Chile, Italy, Netherlands, France, United Kingdom, Germany, Spain, Sweden, Norway, Finland, Poland, Croatia, Czechia, Turkey, Japan, South Korea, China, Taiwan, India, Thailand, Vietnam, Australia, New Zealand, United Arab Emirates, South Africa
Key Companies Profiled
Brunswick Corporation, Groupe Beneteau, Yamaha Motor, Malibu Boats, Ferretti Group, Azimut-Benetti, Sanlorenzo, Bavaria Yachts, Sunseeker International, Marine Products Corporation, MasterCraft Boat Holdings, Correct Craft, Polaris, White River Marine Group, Zodiac Nautic, Hanse Yachts, Dufour Yachts, Fountaine Pajot, Grand Banks Yachts, Feadship
Quantitative Methodology
Primary survey, n=3,800 respondents, Q4 2025, six countries; demand-side model with trade association cross-validation
Qualitative Methodology
47 expert interviews, Q4 2025; applied to validate demand model assumptions, identify emerging dynamics, and assess competitive positioning
Report Format
PDF and XLSX data workbook (Word format preview document)
Publisher
Market Minds Advisory
Report Code
MMA-2026-AUT-312
Published
August 2026
Contact
sales@marketmindsadvisory.com | www.marketmindsadvisory.com

Purchase the full Leisure Boats Market Report (2026 to 2036).

The full report sizes the global leisure boat market to 2036 across six hull and propulsion configurations and seven regions, measured at builder level including factory-fitted propulsion. It separates the inventory correction from underlying participation throughout, which is the distinction most industry commentary has failed to make since 2023. Competitive analysis covers 20 participants evaluated on new boat revenue, with moat and risk assessment for the two leaders. The outboard propulsion transfer is quantified against builder value capture, and berth availability is modelled as the binding constraint on developed market ownership. Four quantified revenue levers close the analysis.
Six-configuration segment sizing with segment-level growth rates
Seven-region share and growth breakdown to 2036
Twenty-participant competitive map on one revenue basis
Inventory correction separated from underlying participation change
Input cost exposure traced to resin and propulsion supply
Four quantified revenue levers with commercial impact ranges

Built For The People Who Decide

From boardroom strategy to bench-side execution, this report is read cover-to-cover by leaders shaping the next decade of their industry, turning demand scenarios, market dynamics and valuation benchmarks into decisions.
CXOs/ Presidents/ VPs/ Managers
M&A and Corporate Development
Strategy Teams and R&D Heads
Procurement and Product Directors
Regulatory and Compliance Leaders
Investor Relations and Equity Analysts