Market Minds Advisory
Lead Scoring Software Market

Lead Scoring Software Market: Lead Scoring Software Market: Model Decay, Sales Trust and Why Most Deployments Get Ignored 2026 to 2036

A scoring model is only worth what sales teams act on, and most are ignored within a year. The commercial problem is trust and model decay rather than prediction accuracy.

Lead Analyst

Published

September 2026

Make Smarter Decisions with Customized Research Insights

Request a free sample report and evaluate market opportunities, growth trends, and competitive dynamics relevant to your business needs.

2025 MARKET VALUE$3.4BMarket Size 2025
2036 FORECAST VALUE$14.7BBase Case , 2026 to 2036
CAGR 2026 TO 203614.2 %Bull 15.5% / Bear 12.9%
INCREMENTAL OPPORTUNITY$10.8BNet 10- year value creation
EXPANSION MULTIPLE3.77x2036 value over 2026 base
Strategic Levers
M&A Pipeline
Regional Outlook
Country Rankings
Competitive Intelligence
Segmental Deep-dive
Call-Us : 91 93563 13602

Executive Snapshot and Market Trajectory.

A scoring model is worth exactly what sales teams act on, and most get quietly ignored within a year of deployment. The commercial problem here is trust and model decay rather than prediction accuracy, which almost nobody sells against. Only around 41% of deployments reach real sales use at all.
The market reaches USD 3.9 billion in 2026 and USD 14.7 billion by 2036, a 3.77 times expansion at 14.2% annually. Intent and behavioural signal scoring grows at 21.3%, half again the market rate of 14.2%, because buying behaviour changed faster than the firmographic data most models still rely on. East Asia holds 24% of spending and India compounds fastest at 22.7%. Both rest on subscription revenue.
Five vendors hold 38% of spending, low for an application category, because scoring ships inside marketing automation, sales platforms and standalone tools that compete on different terms. Salesforce, HubSpot, Adobe, Microsoft and ZoomInfo lead. Sales adoption rather than model performance decides renewals almost everywhere. Models decay materially within about 9 months without retraining, and roughly 68% of buyers now require visible reasoning behind individual scores before they will trust any ranking.
Market Definition
This report covers lead scoring software: predictive scoring engines, intent and behavioural signal scoring, firmographic and demographic fit scoring, account scoring for account-based selling, scoring data enrichment services, and the model management tooling that maintains them. It excludes broader marketing automation platforms, customer relationship management systems, sales engagement tooling, contact database subscriptions sold without scoring, and professional services delivered outside product subscriptions.
Base Year Value
$3.4B in 2025 (MMA Primary Research Dataset, September 2026)
Forecast Period
2026 to 2036, eleven discrete annual values
CAGR
14.2% base case. Bull 15.5%. Bear 12.9%.
Fastest Growth Segment
Intent And Behavioural Signal Scoring: 21.3% CAGR
Fastest Growth Country
India: 22.7% CAGR
Fastest Growth Region
South Asia and Pacific: 16.5% CAGR
Largest Region
East Asia: 24% of 2025 global value
Market Leaders
Salesforce, HubSpot, Adobe, Microsoft and ZoomInfo lead on lead scoring software subscription revenue. Source: MMA Analysis.
Primary Survey
n=3,800 procurement and R&D decision-makers, Q4 2025, six countries
Methodology
Demand-side build-up, cross-validated against public data, 47 expert interviews

Lead Scoring Software Market Forecast Scenarios

lead-scoring-software-market-size-forecast-scenario-1789997498164
The category compounded at 12.9% between 2020 and 2025, and adoption ran well ahead of use. Plenty of organisations bought scoring and then watched sales teams work their own lists anyway, because the model ranked leads nobody recognised and nobody explained why. That failure was rarely technical. It was a trust problem dressed up as a data problem.
The base case holds 14.2% on three mechanisms. Buying behaviour moved online far enough that intent signals now carry more predictive weight than firmographic fit ever did. Sales teams under quota pressure will use ranking that demonstrably works and abandon ranking that does not, which rewards vendors who prove it. And privacy regulation keeps reshaping which signals are available, forcing model rebuilds on a cycle rather than once. Each of those three mechanisms runs largely independently of the other two.
The bull case at 15.5% assumes scoring becomes embedded in how sales teams work rather than sitting alongside it, since adoption rather than capability caps this market. The bear case at 12.9% is consolidation into platform bundles, where scoring stops being purchased separately and standalone vendors lose the pricing power that independence currently gives them.

Trust Beats Model Accuracy

Prediction accuracy is not what fails in this category. Only around 41% of deployments reach a state where sales teams actually work the ranked list, and the ones that fail usually fail because nobody could explain why a lead scored the way it did. Roughly 68% of buyers now require visible reasoning behind individual scores, which is a demand for trust rather than for performance and accuracy metrics answer a different question.
TOP FIVE CONCENTRATION38%Low for an application category, reflecting bundled and standalone competition
SALES ADOPTION RATE41%Share of deployments where teams actually work the ranked list
MODEL DECAY WINDOW9 monthsBefore predictive performance degrades materially without any retraining
INTENT SIGNAL WEIGHTING57%Predictive weight now carried by behavioural rather than firmographic inputs
ANNUAL CONTRACT CHURN23%Subscriptions not renewed, concentrated where sales adoption stayed low
EXPLAINABILITY REQUIREMENT68%Buyers requiring visible reasoning behind any individual lead score
Models decay faster than most buyers expect. Predictive performance degrades materially within about 9 months without retraining, because the behaviours that predicted buying last year stop predicting it this year. Annual contract churn runs near 23% and concentrates almost entirely among deployments where sales adoption never took hold. A model nobody maintains and nobody trusts produces exactly the outcome you would expect at renewal.
Signal weighting moved and the products did not all move with it. Behavioural and intent inputs now carry around 57% of predictive weight against firmographic fit, because buying research happens online in ways it did not a decade ago. Intent and behavioural signal scoring grows at 21.3% against 14.2% for the market. Privacy regulation keeps changing which of those signals remain available.
"Nobody in this category loses on model accuracy. They lose because a rep looked at the top-ranked account, did not recognise it, could not see why it ranked, and went back to their own list. That is a product problem and almost every vendor treats it as a training problem."
Director, Revenue Technology and Commercial Analytics Practice · MMA Technology Practice · September 2026

Market Trends

Explainability Requirements Outrank Predictive Accuracy Claims

Roughly 68% of buyers now require visible reasoning behind any individual lead score, because a rep who cannot see why an account ranked will go back to working their own list instead. Only around 41% of deployments reach a state where sales teams actually work the ranked output. Vendors selling accuracy metrics into that conversation are answering a question nobody asked, and the ones winning are those making the reasoning legible to somebody with a quota. Annual churn near 23% concentrates almost entirely in the deployments where that never happened.
Market Impact: Only 41% reach sales adoption
Behavioural Signals Displaced Firmographic Fit Scoring

Behavioural and intent inputs now carry around 57% of predictive weight against firmographic fit, because buying research moved online in ways it had not a decade ago and company size stopped predicting much on its own. Intent and behavioural signal scoring grows at 21.3% against 14.2% for the market as a result. Vendors whose models still weight firmographics heavily are ranking against a buying process that no longer resembles the one they were trained on. Privacy regulation keeps removing signals from that mix too, which forces rebuilds rather than adjustments repeatedly.
Market Impact: Models decay within 9 months

Market Opportunities and Growth Drivers

Quota Pressure Rewards Ranking That Demonstrably Works

Sales teams under quota pressure will use a ranked list that produces meetings and abandon one that does not, which makes adoption a measurable outcome rather than a change management exercise. Only around 41% of deployments reach that state today, so the opportunity for vendors who prove impact within a quarter is considerable. India compounds at 22.7% partly because sales organisations there are growing fast enough to need ranking rather than relying on individual account knowledge. Proof inside a single quarter is worth more than any benchmark comparison. Benchmarks persuade nobody carrying a quota.
Market Impact: Churn runs near 23% annually

Privacy Regulation Forces Model Rebuilds On A Cycle

Changing rules on tracking and data use keep removing signals that models depended on, which forces rebuilds rather than adjustments and does so repeatedly rather than once. Models already decay within about 9 months without retraining, and regulatory change compresses that further in affected markets. Vendors with model management tooling built in handle it as routine maintenance. Those without treat every regulatory change as a project, and customers notice the difference at renewal. Western European buyers face this most sharply, and they buy management tooling accordingly rather than treating it as optional.
Market Impact: Top five hold just 38% today

Market Restraints and Challenges

Sales Teams Ignore What They Cannot Explain

Only around 41% of deployments reach a state where sales teams actually work the ranked list, and annual churn near 23% concentrates almost entirely in the rest. The root cause is that a rep who cannot see why an account ranked will not risk their quarter on it, whatever the model reports. Commercially this destroys renewals. Mitigation runs through visible score reasoning, through pilot deployments that prove impact within a quarter, and through ranking presented inside tools reps already use. None of those improves the model; they only make its output usable by somebody with a quota.
Market Impact: Some 68% require visible reasoning

Platform Bundling Erodes Standalone Pricing Power

Scoring increasingly ships inside marketing automation and sales platforms as an included capability rather than as a separate purchase, which caps what standalone vendors can charge. The root cause is that platform vendors need scoring to complete their own workflow and will price it at zero to win the larger subscription. Commercially this compresses standalone pricing. Mitigation runs through depth bundled scoring cannot match, through model management tooling, and through independence from any single data source. Buyers who already failed once with a bundled tool are the ones who pay separately.
Market Impact: Intent signals carry 57% weight
4 additional market trends, 3 additional growth drivers, and 2 additional restraints and challenges are covered in the full report. Contact sales@marketmindsadvisory.com to access the complete intelligence.

Segment CAGR and Growth Architecture

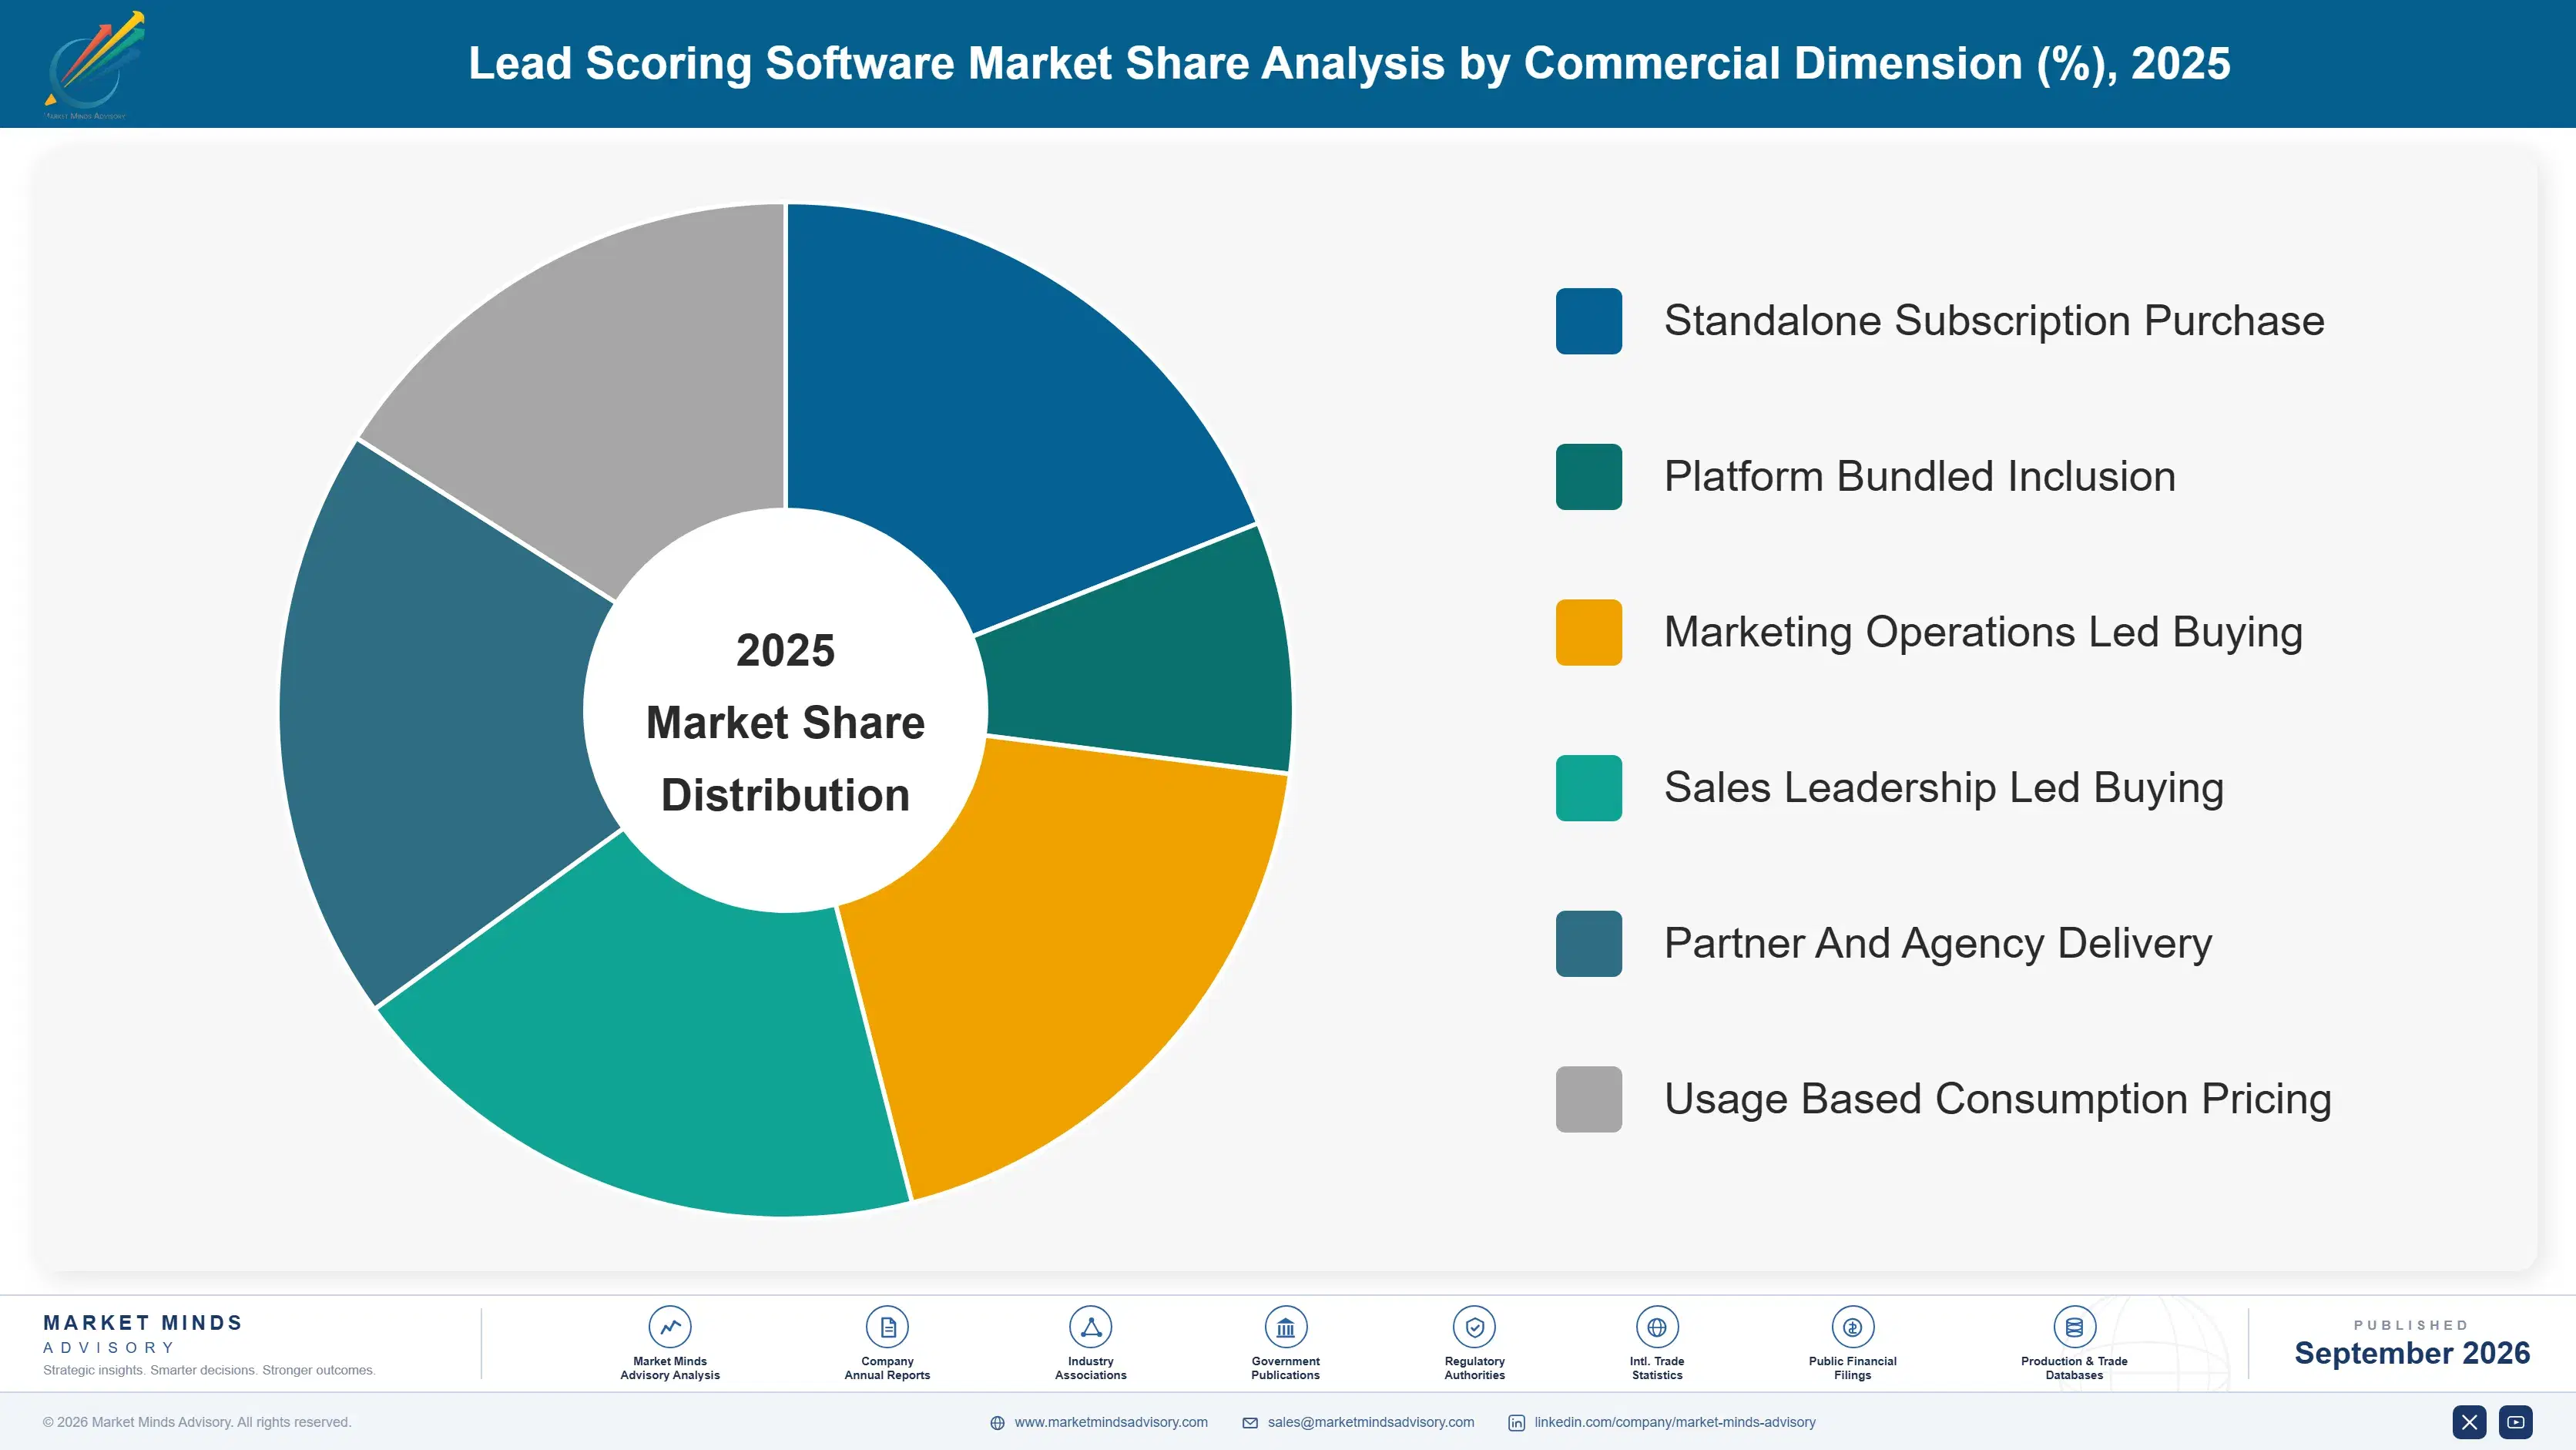
Segmentation follows scoring approach, since each carries different data dependencies, different decay characteristics and quite different exposure to platform bundling. Six approaches cover the market: intent and behavioural scoring, predictive scoring engines, account scoring, firmographic fit scoring, enrichment services, and model management tooling. Deployment route and buyer size are separate dimensions. Both are handled separately below.
lead-scoring-software-market-market-share-analysis-1789997498699

Intent And Behavioural Signal Scoring

Intent and behavioural signal scoring grows at 21.3%, half again the market rate of 14.2%, because buying research moved online far enough that behavioural inputs now carry around 57% of predictive weight against firmographic fit. Company size and industry stopped predicting much on their own, and models still weighting them heavily are ranking against a buying process that no longer resembles the one they learned. This approach also decays fastest, which makes model management tooling a necessary companion rather than an optional extra, and vendors selling one without the other tend to lose the renewal. Signal supply is what separates the credible vendors here. Licensed data bought from shared providers offers very little defensible position at all.
CAGR 21.3%

Model Management And Retraining Tooling

Model management and retraining tooling compounds at 17.8% because predictive performance degrades materially within about 9 months without intervention, and privacy regulation keeps removing signals that force rebuilds rather than adjustments. Buyers who learned that lesson once will not repeat it, which makes this the segment where second-time purchasers concentrate. Vendors treating retraining as a professional services engagement rather than as product capability are pricing themselves out of exactly the accounts that know what maintenance actually costs over a full contract term. This is also the segment least exposed to platform bundling, because scoring included to complete a workflow rarely carries retraining capability that anybody would pay for separately. Second-time buyers concentrate here.
CAGR 17.8%
Full segment breakdown across 6 segments available in the complete report.

Regional Architecture and Country Demand Map

East Asia holds 24% of spending, the largest regional share, because sales organisations there are scaling faster than individual account knowledge can cover and digital buying behaviour is unusually well instrumented. North America follows at 23%. India compounds fastest at 22.7% on rapid sales organisation growth.

East Asia

East Asia takes 24% of spending, the largest regional share, because sales organisations here are scaling faster than individual account knowledge can cover and digital buying behaviour is unusually well instrumented. Chinese and South Korean commerce platforms generate behavioural signal density that models elsewhere cannot match, which favours intent scoring over firmographic approaches directly. Japanese adoption is slower and weighted toward account scoring for established relationships. Growth at 15.3% runs above the global rate on sales organisation expansion rather than on any replacement of existing tools. Explainability requirements here match the global picture closely, and vendors ignoring them lose adoption exactly as they do elsewhere. Standalone vendors compete more evenly against bundles here.
Share: 24% | CAGR: 15.3% (2026 to 2036)

North America

North America accounts for 23% of spending, where the market is mature enough that most buyers are on their second or third scoring deployment rather than their first. Those buyers know what model decay costs and buy management tooling alongside scoring rather than after it fails. Salesforce, HubSpot, Adobe, Microsoft and ZoomInfo all operate from here. Platform bundling pressure on standalone pricing is strongest in this region. Growth at 14.6% sits above the global rate on replacement rather than new adoption. Second-time buyers here know what unmanaged model decay costs across a contract term, which makes them considerably harder to sell to on benchmarks alone. Model management tooling sells well as a result.
Share: 23% | CAGR: 14.6% (2026 to 2036)
Regional intelligence for 5 additional markets available in the complete report: Western Europe, South Asia and Pacific, Latin America, Middle East and Africa, Eastern Europe. Contact sales@marketmindsadvisory.com.
lead-scoring-software-market-country-cagr-analysis-1789997499227

Where Scoring Deals Are Won

Sales adoption rather than model accuracy decides renewals, models decay within months rather than years, and platform bundling caps what standalone products can charge. The four levers below follow those conditions rather than any argument about predictive performance, which is where most vendor positioning effort currently goes. Each addresses a commercial condition rather than a technical one.

Make Score Reasoning Visible To Every Rep

Roughly 68% of buyers now require visible reasoning behind individual scores, and only around 41% of deployments reach a state where teams actually work the ranked list. A rep who cannot see why an account ranked will not risk their quarter on it regardless of what the model reports. Vendors making reasoning legible to somebody carrying a quota win adoption that accuracy claims never reach, and adoption is what renewal actually turns on. Annual churn near 23% concentrates almost entirely where that adoption never happened at all. Reasoning is the product feature that fixes it.
Market Impact: Fully 68% of buyers now require visible reasoning

Ship Model Management As Product Not Services

Predictive performance degrades materially within about 9 months without retraining, and privacy change forces rebuilds rather than adjustments repeatedly. Vendors treating retraining as a professional services engagement price themselves out of the second-time buyers who already know what maintenance costs across a contract term. Building management tooling into the product converts a recurring services cost into a differentiator that bundled scoring inside larger platforms almost never matches at all. Roughly 26% of vendor cost sits in model maintenance, which automation converts into product rather than headcount. Bundled scoring almost never includes it.
Market Impact: Models now decay within just 9 short months

Prove Impact Inside A Single Sales Quarter

Annual churn near 23% concentrates almost entirely in deployments where sales adoption never took hold, and that outcome is usually visible within the first quarter. Vendors running pilots that demonstrate meeting rates against a control list convert the argument from a technical one into an observable one. Sales leaders who see the difference in one quarter fund the expansion themselves, which is a considerably faster route than any procurement-led evaluation. A pilot of 2 sales teams settles the argument faster than any procurement evaluation. Sales leaders fund what they can see working.
Market Impact: Churn now runs near 23% every single year

Compete On Depth Bundled Scoring Cannot Reach

Platform vendors price scoring at zero to win the larger subscription, which caps standalone pricing and explains why the top five hold only 38%. Competing on presence loses that argument immediately. Competing on intent signal breadth, model management depth and independence from any single data source reaches buyers whose scoring matters enough to pay for separately, and those buyers are usually the ones who already failed once with a bundled tool. Signal supply takes years to build and cannot be assembled quickly. Independence from any single provider is worth paying for.
Market Impact: Top five now hold just 38% of spending

Who Controls the Margin Pool

Five vendors hold 38% of lead scoring software spending, low for an application category because scoring ships inside marketing automation platforms, sales suites and standalone tools that compete on quite different terms. Salesforce, HubSpot, Adobe, Microsoft and ZoomInfo lead. All participants are assessed on lead scoring subscription revenue rather than on broader platform businesses they also operate. Concentration is low and has stayed low, which reflects how differently bundled and standalone products reach buyers.
Competition runs on sales adoption and explainability far more than on model performance, since only around 41% of deployments reach a state where teams work the ranked list. The second dimension is model management depth, because performance degrades within about 9 months without retraining and buyers on their second deployment know precisely what that costs them.

Pressure is emerging from platform vendors pricing scoring at zero to win larger subscriptions, which removes the purchase rather than competing for it. Rankings shift where sales organisations scale faster than account knowledge and where privacy change forces rebuilds, particularly across India, East Asia and Western Europe. Vendors organised entirely around model benchmarks are selling to the constituency with the least renewal influence remaining.
lead-scoring-software-market-company-positioning-matrix-1789997499755

Competitive Moat and Risk Dimensions

SALESFORCE

Moat: Workflow Proximity Advantage

Salesforce delivers scoring inside the system reps already work in, which addresses adoption more directly than any standalone product can. Since only around 41% of deployments reach real sales use, ranking appearing where the work happens starts from a considerable advantage. Standalone vendors must earn attention that platform-delivered scoring receives by default.
SALESFORCE

Risk: Bundled Depth Ceiling

Scoring included to complete a platform workflow rarely carries the intent signal breadth or model management depth that buyers on their second deployment demand. Those buyers already learned what 9 month model decay costs them. Workflow proximity wins the first purchase and loses the demanding one, which is where standalone vendors retain a defensible position.
ZOOMINFO

Moat: Signal Data Breadth

ZoomInfo holds intent and firmographic data breadth that scoring models depend on, which matters as behavioural inputs move toward 57% of predictive weight. Vendors without their own signal supply are dependent on partners who can reprice or withdraw. That independence supports both the scoring product and the enrichment services that sit alongside it commercially.
ZOOMINFO

Risk: Privacy Signal Erosion

Changing rules on tracking and data use keep removing signals that models and enrichment services both depend on, and the exposure is largest for participants whose position rests on data breadth. Rebuilds are forced rather than optional in affected markets. Data advantage narrows every time a signal category becomes unavailable, and regulation has moved in one direction consistently.

Players Tracked

Prominent Players

Salesforce
HubSpot
Adobe
Microsoft
ZoomInfo

Other Key Players

6sense
Demandbase
Clearbit
Leadspace
Bombora
Terminus
Zoho Corporation
Freshworks
Pipedrive
Apollo.io
Lusha
Cognism
MadKudu
Breadcrumbs
Infer

Recent Developments

APRIL 2025

Buyers Require Visible Reasoning Behind Individual Lead Scores

Enterprise buyers increasingly specified visible score reasoning in scoring software evaluations, a procurement requirement development rather than any corporate transaction. Roughly 68% now require it, because a representative who cannot see why an account ranked will work their own list regardless of what the model actually reports.
Signal: Adoption rather than accuracy decides renewals here, and reasoning is what converts a score into action.
OCTOBER 2024

Platform Vendors Bundle Scoring Into Larger Subscriptions

Major platform vendors expanded included scoring capability within marketing and sales subscriptions, a packaging development rather than any acquisition or merger. Pricing scoring at zero to win the larger subscription caps what standalone vendors can charge and explains why the top five hold only 38% of spending.
Signal: Bundling removes the purchase entirely rather than competing for it on any product merit at all.
JULY 2025

Privacy Changes Force Scoring Model Rebuilds Across Markets

Regulatory changes on tracking and data use removed signal categories that scoring models depended on, forcing rebuilds rather than adjustments across affected markets. Models already degrade materially within about 9 months without retraining, and regulatory change compresses that maintenance cycle considerably further in the markets involved.
Signal: Model management tooling turns a recurring crisis into routine maintenance that customers eventually stop noticing entirely.

What Scoring Costs To Run

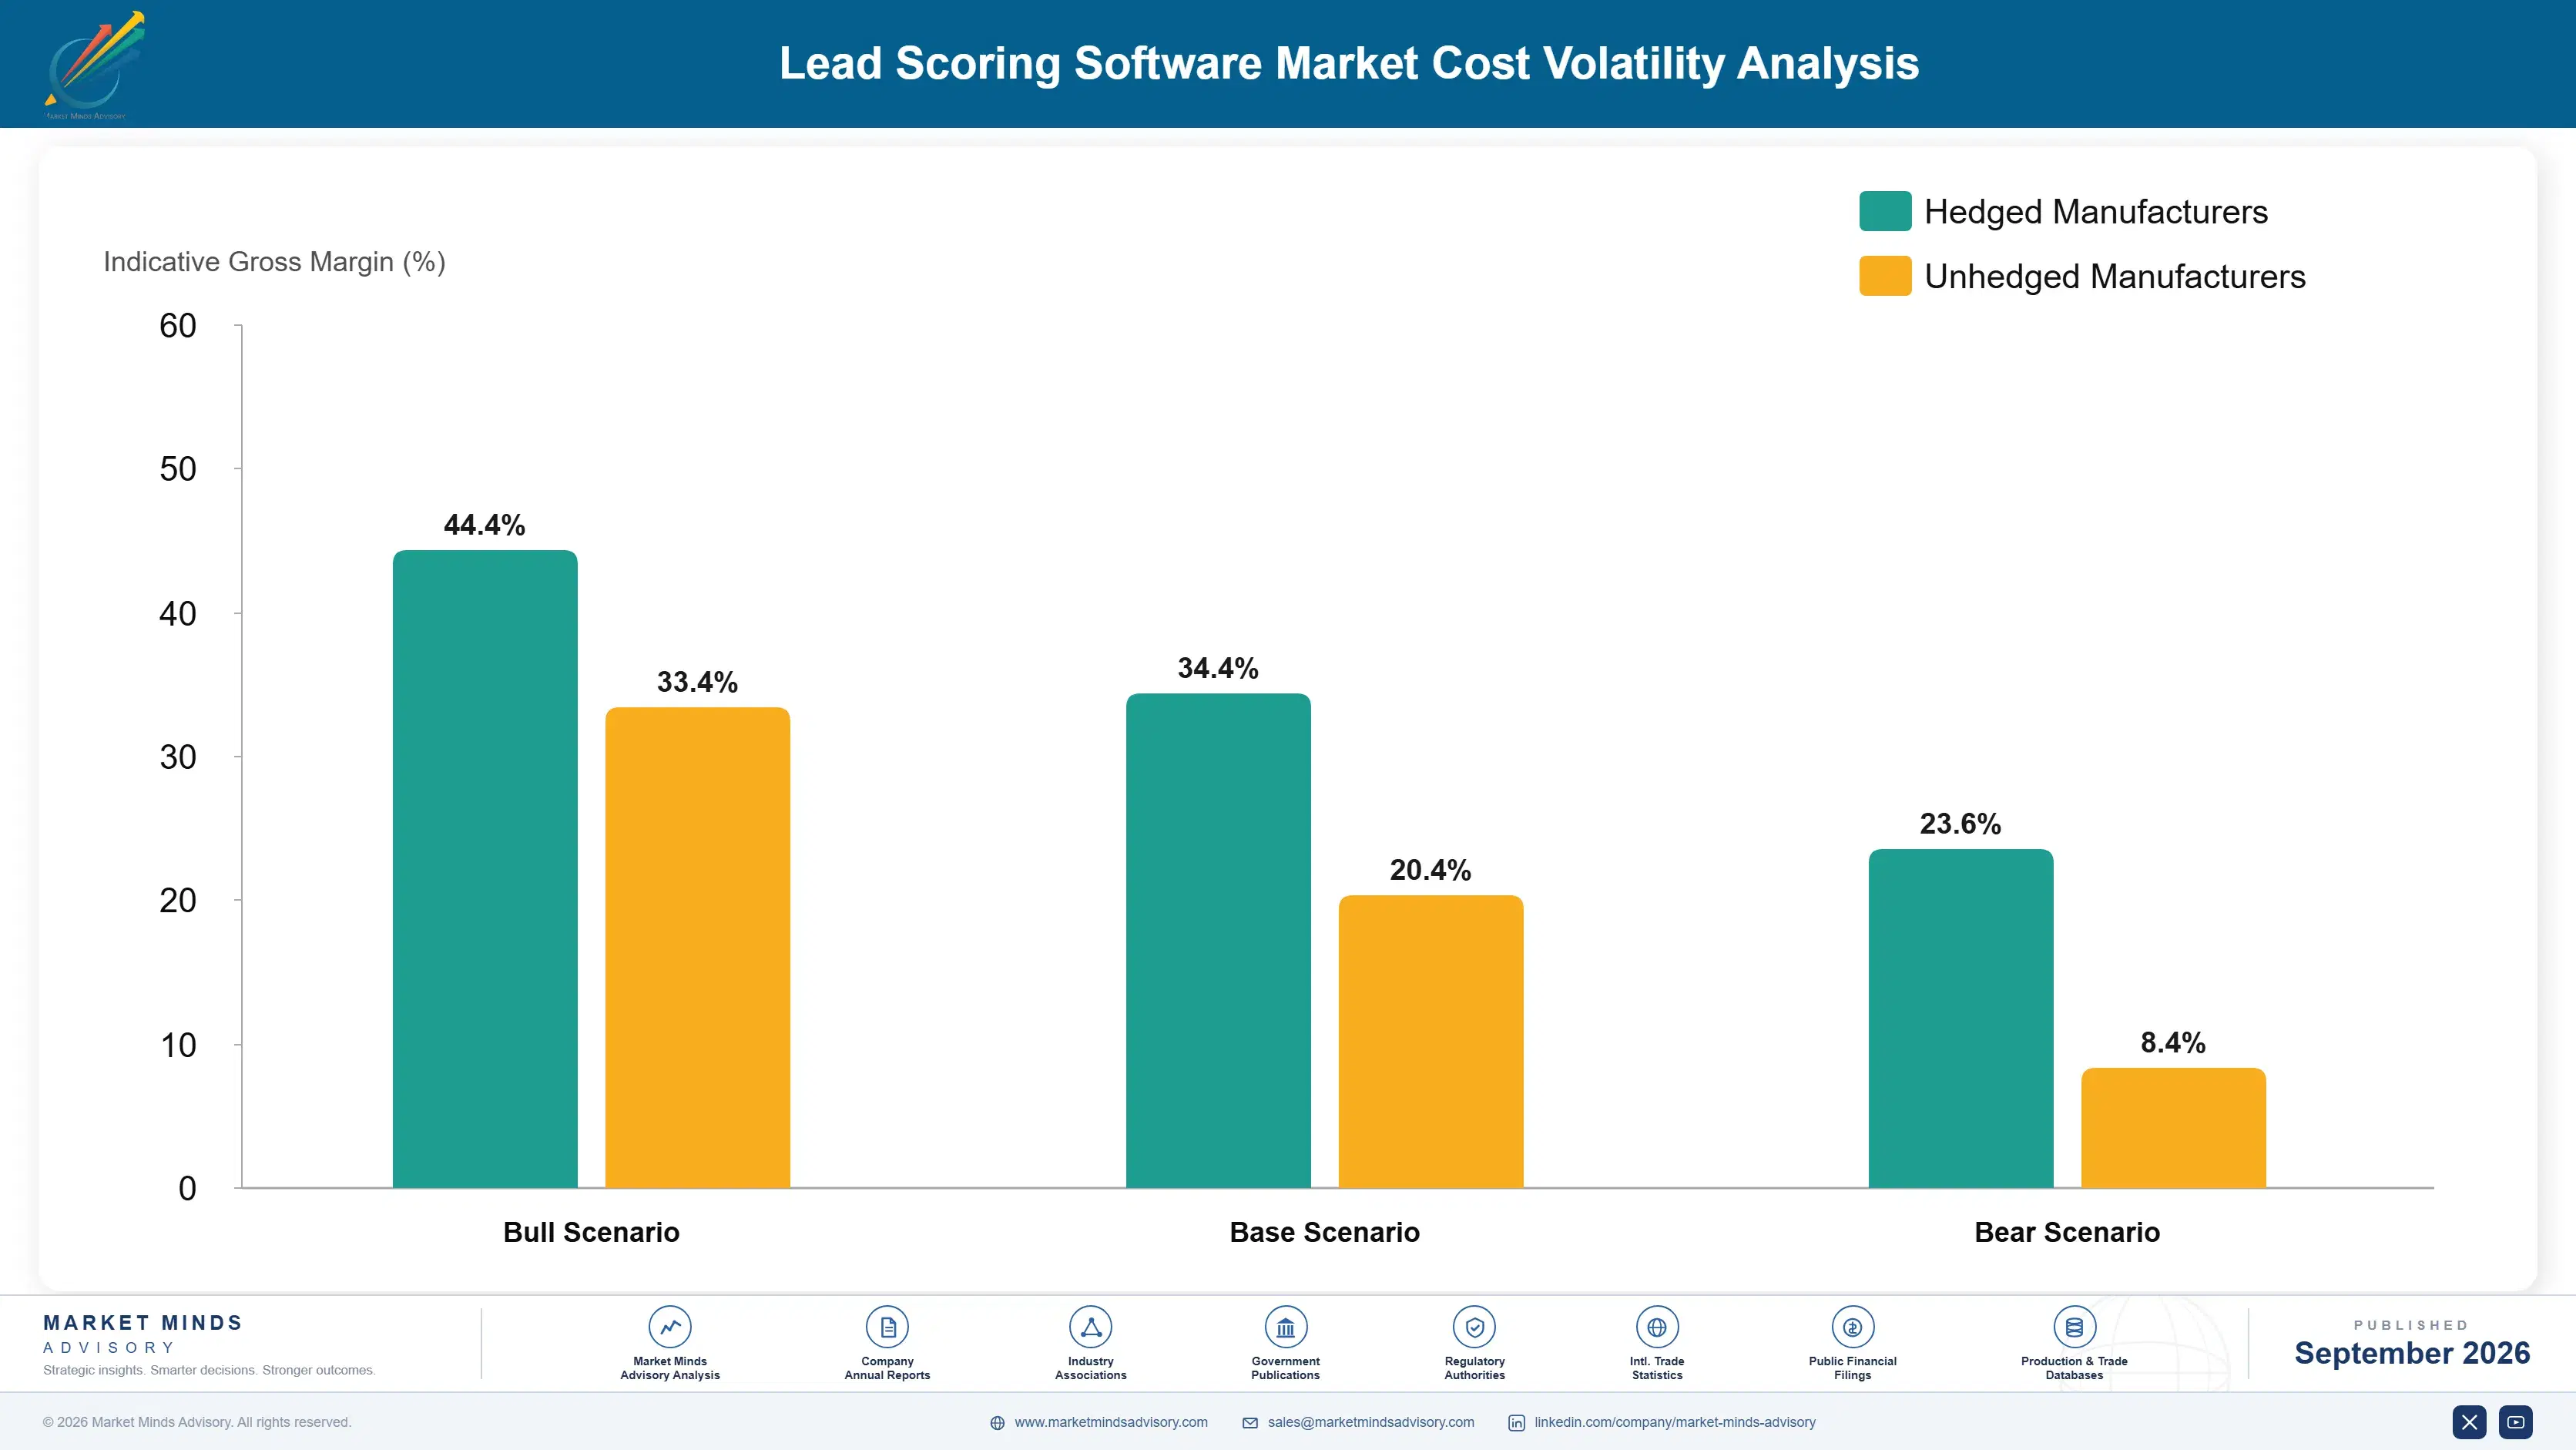
Signal and enrichment data licensing absorbs roughly 33% of vendor cost in this category, sourced from intent data providers and contact database suppliers who reprice regularly. Machine learning engineering and model maintenance take around 26%. Customer acquisition absorbs about 24% in a category where deals are small relative to the sales effort required, and infrastructure takes most of the remainder.
Intent data licensing costs rose through 2023 and 2024 as providers consolidated and repriced against demand from scoring and account-based selling vendors simultaneously. ZoomInfo Annual Report 2024 and Salesforce Annual Report 2024 both record data acquisition and platform infrastructure cost among principal operating variables. Vendors owning their own signal supply were materially insulated from repricing that dependent competitors absorbed directly. Repricing hit standalone vendors considerably harder than platform competitors.

The competitive disadvantage mechanism is data dependency rather than engineering cost. A vendor licensing signals from providers who also serve competitors has no cost advantage and no protection against repricing or withdrawal. Exposure concentrates among standalone vendors without proprietary signal supply, since platform competitors bundle scoring at zero and data owners hold the input those standalone products cannot function without.
lead-scoring-software-market-cost-volatility-analysis-1789997499953

Build Or Acquire Proprietary Signal Supply

Signal and enrichment data licensing absorbs roughly 33% of vendor cost, and providers serving competitors simultaneously offer no advantage to anybody buying from them. Owning some proportion of signal supply protects against repricing and creates differentiation that licensed data cannot. The investment is substantial and slow, which is exactly why it holds value once established rather than being copied quickly.

Automate Retraining Instead Of Staffing It

Machine learning engineering and model maintenance absorb around 26% of vendor cost, and much of that repeats every time a model decays or a signal category disappears. Automating retraining converts engineering headcount into product capability customers will pay for directly. Vendors staffing maintenance manually carry cost that scales with customer count rather than staying flat across the base.

Reduce Acquisition Cost Through Land And Expand

Customer acquisition absorbs about 24% of cost in a category where individual deals are small relative to the selling effort required to close them. Pilots that prove meeting rate improvement in a single quarter let sales leaders fund expansion themselves rather than requiring a full procurement cycle. That route converts an expensive enterprise sale into a considerably cheaper departmental one.

Portfolio Architecture for Margin Defence

Margin architecture separates on data dependency rather than on engineering difficulty. Enrichment services and firmographic fit scoring earn least, since both rest on licensed data that competitors buy from the same providers. Predictive scoring engines and account scoring sit above on modelling depth. Intent and behavioural scoring and model management tooling earn most, because each pairs genuine differentiation with recurring necessity.
The volume versus premium tension runs between bundled platform delivery and standalone depth, which reward opposite investment entirely. Volume requires scoring good enough to complete a workflow and priced at zero inside a larger subscription. Premium requires signal breadth and management depth that justify a separate purchase. Vendors pursuing both usually build something too shallow to sell alone and too costly to give away.

High-value pools concentrate in intent scoring and in model management tooling, and neither is reached through general application development capability. Intent scoring requires signal supply that takes years to build or considerable money to acquire. Model management requires machine learning operations depth that most application vendors have not developed. Both are where second-time buyers spend, which is the segment that knows what it is buying.

Volume / Commodity-Adjacent

Enrichment services and firmographic fit scoring, where the underlying data is licensed from providers that competitors buy from equally and differentiation is consequently thin. The twelve point spread separates vendors owning some signal supply from those licensing everything they use from third parties.
Gross Margin: 52% to 64%

Premium / Certified

Predictive scoring engines and account scoring for account-based selling, where modelling depth and explainability determine selection rather than data breadth alone. The ten point spread tracks how much retraining each vendor automates against how much still requires engineering attention per customer.
Gross Margin: 68% to 78%

Sustainability / Regulatory / Next-Generation

Intent and behavioural signal scoring and model management tooling, each pairing genuine differentiation with recurring necessity that buyers cannot avoid. The nine point spread reflects proprietary signal supply, which is the single largest determinant of margin position anywhere in this category.
Gross Margin: 80% to 89%
lead-scoring-software-market-portfolio-architecture-1789997500460

High-value Sub-segments and Strategic Watch-out

Intent And Behavioural Signal Scoring

Grows at 21.3% as behavioural inputs reach around 57% of predictive weight against firmographic fit. The nine point spread reflects proprietary signal supply. Privacy change keeps removing inputs, which makes management tooling a necessary companion rather than optional. Buying research moved online permanently. Firmographics predict little now.
Gross Margin: 80% to 89%

Model Management And Retraining Tooling

Grows at 17.8% because performance degrades materially within about 9 months without any intervention at all. The nine point spread reflects automation depth. Second-time buyers concentrate here, having learned once what unmanaged decay actually costs. Platform bundles rarely include anything comparable. Automation depth decides margin here.
Gross Margin: 80% to 89%

Predictive Scoring Engines

Grows at 13.6% and remains the category most exposed to platform bundling pressure from larger subscriptions. The ten point spread reflects explainability depth. Roughly 68% of buyers now require visible reasoning behind every individual score produced. Accuracy claims do not answer that demand. Explainability is the differentiator.
Gross Margin: 68% to 78%

Enrichment And Firmographic Fit Services

Grows at 6.4%, slowest of the six approaches, as firmographic inputs lose predictive weight to behavioural signals steadily. The twelve point spread reflects data ownership. Licensed data bought from shared providers offers very little defensible position. Competitors buy from the same providers. Differentiation is consequently thin.
Gross Margin: 52% to 64%

Why Adoption Decides Renewal

The annuity here rests entirely on whether reps use the output. A subscription renews because a sales team works the ranked list and sees results, and only around 41% of deployments reach that state. Annual churn near 23% concentrates almost entirely in the rest. No amount of model performance rescues a deployment that reps quietly abandoned in the first quarter.
Depth varies by how far scoring reached into daily work. A team whose ranking appears inside the tools they already use, with visible reasoning attached, builds a habit that survives personnel changes and territory reorganisations. A team receiving a scored list in a separate system builds nothing that outlasts the champion who bought it. Roughly 68% of buyers now require that reasoning precisely because they have seen the difference themselves.

The buyer has changed more than the technology has. A marketing operations function evaluated model accuracy and data coverage against a technical checklist. A sales leader evaluates whether meeting rates improved in one quarter against a control list. A second-time buyer evaluates what retraining costs across the contract term. Vendors organised around the first buyer are selling to the constituency with the least renewal influence.
lead-scoring-software-market-end-use-penetration-index-1789997500952

What Wins Scoring Deals

These are among the four positions where our research anticipates prominent divergence between winners and laggards over the coming forecast period. Each is grounded in the demand model, the regulatory perimeter, and the announced capacity pipeline.
01 / SCORE EXPLAINABILITY DISCIPLINE

Show The Reasoning To Every Rep

Roughly 68% of buyers now require visible reasoning behind individual scores, and only around 41% of deployments reach a state where sales teams genuinely work the ranked output at all. A representative who cannot see why an account ranked will not risk their quarter on it whatever the model reports internally. Vendors making that reasoning legible to somebody carrying a quota win the adoption that accuracy claims have never once reached, and adoption is what renewal actually turns on at renewal time.
02 / MAINTENANCE PRODUCT INVESTMENT

Build Retraining In, Do Not Sell It

Predictive performance degrades materially within about 9 months without retraining, and privacy change forces rebuilds rather than adjustments repeatedly across affected markets. Vendors treating retraining as a professional services engagement price themselves out of the second-time buyers who already know what maintenance costs. Building management tooling into the product converts a recurring cost into differentiation that bundled platform scoring almost never matches at all, which is where standalone vendors keep a genuinely defensible position against platform competitors competing on presence alone.
03 / QUARTER ONE PROOF

Demonstrate Meetings, Not Model Metrics

Annual churn near 23% concentrates almost entirely in deployments where sales adoption never took hold, and that outcome is visible within the first quarter to anybody who looks for it. Pilots demonstrating meeting rates against a control list convert a technical argument into an observable one that needs no interpretation. Sales leaders who see that difference fund expansion themselves rather than waiting on any procurement cycle, which is a considerably faster route into an account than a full procurement cycle.
04 / BUNDLE RESISTANCE POSITIONING

Sell Depth Platforms Cannot Include

Platform vendors price scoring at zero to win the larger subscription, which caps standalone pricing and explains why the top five hold only 38% of category spending between them. Competing on presence loses that argument before it starts properly. Competing on intent signal breadth, model management depth and data independence reaches buyers whose scoring matters enough to pay for it separately, and those buyers are usually the ones who already failed once with something bundled and now know exactly what they are buying.

Engagement Snapshot From the Field

A live engagement with an industry participant carrying material or product regulatory and market exposure ahead of a defining policy shift, showing how our research translates into a defensible multi-year portfolio strategy.
MARKET MINDS ADVISORY · CLIENT ENGAGEMENT SUMMARY
Lead Scoring Software Producer Strategic Portfolio Review and Transition Roadmap 2026·Investment Scenario on Lead Scoring Software Exposure Evaluation 2025-26
CLIENT PROFILE
A standalone lead scoring vendor with strong model benchmarks and annual churn running well above its category, losing accounts that had renewed once and then left at the second renewal. Leadership attributed the losses to platform bundling and had approved price reductions to compete, without establishing what happened inside those accounts first. Nobody had asked whether reps used the product.
STRATEGIC CHALLENGE
Product wanted further model accuracy investment to widen the benchmark gap. Sales wanted price reductions to match bundled alternatives. Nobody had measured whether reps in churned accounts had ever worked the ranked list, and a large renewal cohort was arriving across the following three quarters. Both proposals assumed the problem sat outside the accounts themselves.
MMA APPROACH
MMA interviewed churned and retained accounts to establish what differed, focusing on whether sales teams used the output rather than on model or price comparisons. We measured rep engagement with ranked lists and how visible score reasoning had been in each deployment. Work drew on 47 expert interviews conducted in Q4 2025 alongside the vendor's own product usage records.
KEY FINDINGS
  1. Around 78% of churned accounts showed rep engagement with ranked lists falling below a quarter of licensed users inside the first 2 quarters.
  2. Retained accounts had visible score reasoning enabled, while most churned accounts had either deployed without it or had switched it off early.
  3. Price was raised as a reason at exit by fewer than a third of the churned accounts interviewed (client-reported, unverified by MMA).
  4. Model accuracy benchmarks were substantially better than competing products in every churned account examined, which changed nothing at all about the outcome.
CLIENT PROFILE
A standalone lead scoring vendor with strong model benchmarks and annual churn running well above its category, losing accounts that had renewed once and then left at the second renewal. Leadership attributed the losses to platform bundling and had approved price reductions to compete, without establishing what happened inside those accounts first. Nobody had asked whether reps used the product.
STRATEGIC CHALLENGE
Product wanted further model accuracy investment to widen the benchmark gap. Sales wanted price reductions to match bundled alternatives. Nobody had measured whether reps in churned accounts had ever worked the ranked list, and a large renewal cohort was arriving across the following three quarters. Both proposals assumed the problem sat outside the accounts themselves.
MMA APPROACH
MMA interviewed churned and retained accounts to establish what differed, focusing on whether sales teams used the output rather than on model or price comparisons. We measured rep engagement with ranked lists and how visible score reasoning had been in each deployment. Work drew on 47 expert interviews conducted in Q4 2025 alongside the vendor's own product usage records.
KEY FINDINGS
  1. Around 78% of churned accounts showed rep engagement with ranked lists falling below a quarter of licensed users inside the first 2 quarters.
  2. Retained accounts had visible score reasoning enabled, while most churned accounts had either deployed without it or had switched it off early.
  3. Price was raised as a reason at exit by fewer than a third of the churned accounts interviewed (client-reported, unverified by MMA).
  4. Model accuracy benchmarks were substantially better than competing products in every churned account examined, which changed nothing at all about the outcome.
RECOMMENDED STRATEGY
Phase 1: Phase one: stop price reductions, since fewer than a third of churned accounts had raised price as a reason for leaving. Phase 2: Phase two: make score reasoning visible by default rather than optional, and measure rep engagement as the primary account health metric. Phase 3: Phase three: redirect the accuracy investment into adoption instrumentation, and escalate every account where rep engagement falls well before renewal arrives.
OUTCOME
The vendor made score reasoning visible by default and adopted rep engagement as its account health metric (client-reported, unverified by MMA). Churn fell materially across the following cohort once low-engagement accounts were caught early. Engagement is now reviewed monthly rather than at renewal, which is the change that outlasted the engagement itself.

Frequently Asked Questions

Foundational context covering the market sizes, CAGR, scope, country, region and competition that inform every finding below. This section is provided to cover basics and most often pre-purchase conversations, answered from the MMA Primary Research Dataset.

What is the current size of the Lead Scoring Software Market?

Global value reaches USD 3.9 billion in 2026, measured as lead scoring subscription revenue across six scoring approaches. The 2025 base was USD 3.4 billion.

How large will the Lead Scoring Software Market be by 2036?

The market reaches USD 14.7 billion by 2036, an increase of USD 10.8 billion across the forecast period. That represents 3.77 times expansion from the 2026 base.

What is the CAGR for the Lead Scoring Software Market 2026 to 2036?

The base case runs at 14.2% annually, with a bull case at 15.5% if scoring becomes embedded in daily sales work and a bear case at 12.9% if platform bundling accelerates.

Which segment is growing fastest?

Intent and behavioural signal scoring grows at 21.3%, half again the market rate of 14.2%. Behavioural inputs now carry around 57% of predictive weight against firmographic fit.

Who are the major companies in the Lead Scoring Software Market?

Salesforce, HubSpot, Adobe, Microsoft and ZoomInfo lead on scoring subscription revenue, holding 38% between them. 6sense and Demandbase hold smaller standalone positions in the category.

Which country is growing fastest?

India leads at 22.7%, on sales organisations growing faster than any individual can hold account knowledge for. Indonesia and Brazil follow some way behind it.

Report Segmentation Architecture

The full report scope spans multiple orthogonal segmentation dimensions, with cross-tabulated demand data provided for each dimension pair. Coverage extends further to regional breakdowns, trend trajectories, and the competitive detail needed to support segment-level decision-making.

By Scoring Approach

  • Intent And Behavioural Signal Scoring
  • Model Management And Retraining Tooling
  • Predictive Scoring Engines
  • Account Scoring For Account-Based Selling
  • Firmographic And Demographic Fit Scoring
  • Scoring Data Enrichment Services

By End-Use Industry

  • Technology And Software Vendors
  • Financial Services And Insurance
  • Business And Professional Services
  • Manufacturing And Industrial Suppliers
  • Healthcare And Life Sciences
  • Media And Telecommunications

By Commercial Dimension

  • Standalone Subscription Purchase
  • Platform Bundled Inclusion
  • Marketing Operations Led Buying
  • Sales Leadership Led Buying
  • Partner And Agency Delivery
  • Usage Based Consumption Pricing

By Region

  • North America
  • Western Europe
  • East Asia
  • South Asia and Pacific
  • Latin America
  • Middle East and Africa
  • Eastern Europe

Scope, Methodology, and Coverage

Every figure in this report is reproducible from documented input assumptions. The scope below maps the historical period, the forecast horizon, the segmentation dimensions, and the countries covered, alongside the underlying primary and qualitative methodology.
Historical Period
2020 to 2025
Forecast Period
2026 to 2036
Base Year
2025 (USD billions; MMA Primary Research Dataset, September 2026)
Market Definition
This report covers lead scoring software: predictive scoring engines, intent and behavioural signal scoring, firmographic and demographic fit scoring, account scoring for account-based selling, scoring data enrichment services, and model management tooling. It excludes broader marketing automation platforms, customer relationship management systems, sales engagement tooling, contact databases sold without scoring, and professional services delivered outside product subscriptions.
Quantitative Units
USD millions, scoring subscription revenue basis; deployed customer accounts; sales adoption rates as a percentage of deployments; model decay windows in months; annual contract churn rates; behavioural share of predictive weight.
Segmentation Dimensions
Scoring approach; end-use industry; commercial buying route; geography across seven regions.
Regions Covered
North America, Western Europe, East Asia, South Asia and Pacific, Latin America, Middle East and Africa, Eastern Europe
Countries Covered
United States, Canada, United Kingdom, Germany, France, Netherlands, Spain, Sweden, Poland, Czechia, China, Japan, South Korea, India, Australia, Singapore, Indonesia, Brazil, Mexico, United Arab Emirates.
Key Companies Profiled
Salesforce, HubSpot, Adobe, Microsoft, ZoomInfo, 6sense, Demandbase, Clearbit, Leadspace, Bombora, Terminus, Zoho Corporation, Freshworks, Cognism, MadKudu.
Quantitative Methodology
Primary survey, n=3,800 respondents, Q4 2025, six countries; demand-side model with trade association cross-validation
Qualitative Methodology
47 expert interviews, Q4 2025; applied to validate demand model assumptions, identify emerging dynamics, and assess competitive positioning
Report Format
PDF and XLSX data workbook (Word format preview document)
Publisher
Market Minds Advisory
Report Code
MMA-2026-TEC-931
Published
September 2026
Contact
sales@marketmindsadvisory.com | www.marketmindsadvisory.com

Purchase the full Lead Scoring Software Market Report (2026 to 2036).

This report sizes the global lead scoring software market from 2026 to 2036 across six scoring approaches, six industries and seven regions. It explains why only around 41% of deployments reach a state where sales teams actually work the ranked list, and why explainability rather than accuracy decides that outcome. Model decay within about 9 months is analysed as the reason management tooling has become a purchase in its own right. Platform bundling pressure on standalone pricing is examined across the competitive set. Regional analysis explains why East Asia holds 24% of spending.
Six scoring approaches sized through to 2036
Sales adoption rates quantified across deployment outcomes
Model decay windows analysed against retraining practice
Twenty named vendors assessed on subscription revenue
Four revenue levers with quantified commercial impact
Anonymised vendor churn reduction engagement documented in full

Built For The People Who Decide

From boardroom strategy to bench-side execution, this report is read cover-to-cover by leaders shaping the next decade of their industry, turning demand scenarios, market dynamics and valuation benchmarks into decisions.
CXOs/ Presidents/ VPs/ Managers
M&A and Corporate Development
Strategy Teams and R&D Heads
Procurement and Product Directors
Regulatory and Compliance Leaders
Investor Relations and Equity Analysts