Market Minds Advisory
Latin America Hand Sanitizer Market

Latin America Hand Sanitizer Market: Latin America Hand Sanitizer Market: Institutional Demand, Ethanol Economics and Verification After the Reset

Methanol adulteration and sub-60% ethanol claims forced a regulatory reset across the region, and institutional buyers now verify what retail shoppers still take on the label's word. Verification is now the commercial dividing line.

Lead Analyst

Published

September 2026

Make Smarter Decisions with Customized Research Insights

Request a free sample report and evaluate market opportunities, growth trends, and competitive dynamics relevant to your business needs.

2025 MARKET VALUE$1.4BMarket Size 2025
2036 FORECAST VALUE$2.6BBase Case , 2026 to 2036
CAGR 2026 TO 20365.8 %Bull 7.1% / Bear 4.5%
INCREMENTAL OPPORTUNITY$1.1BNet 10- year value creation
EXPANSION MULTIPLE1.73x2036 value over 2026 base
Strategic Levers
M&A Pipeline
Regional Outlook
Country Rankings
Competitive Intelligence
Segmental Deep-dive
Call-Us : 91 93563 13602

Executive Snapshot and Market Trajectory.

The regional market did not collapse after the pandemic; it re-based. Consumer volume fell away hard through 2022 and 2023 while institutional buying held broadly steady, and the 61% of demand now sitting in hospitals, food processing and transport is what makes this a market rather than a lingering memory.
Sanitizing wipes grow at 8.7%, half again the market rate of 5.8%, because they solve surface and hand contact with one purchase in settings where fixed dispensers are impractical. Non-alcohol quaternary formulations follow at 8.0%. Sanitizing creams and antiseptic hand lotions grow slowest at 4.4%, and Brazil accounts for roughly 42% of regional consumption on its own, which concentrates supply decisions more than the headline suggests.
Around 58% of product sold in the region is filled inside it, mostly in Brazil and Mexico, using ethanol that Brazilian sugarcane supplies at a cost no importer can match. That local advantage is also the vulnerability: the FDA import alert on Mexican-manufactured sanitizer in 2020 and 2021 followed methanol contamination traced to fuel-grade and improperly denatured ethanol entering cosmetic supply chains. Nothing about that risk has been designed out since.
Market Definition
This market covers alcohol-based and non-alcohol hand sanitizing products sold for human hand antisepsis across Latin America, spanning gels, foams, sprays, wipes, quaternary formulations and antiseptic hand lotions in consumer, institutional and healthcare channels. It includes finished product filled inside and outside the region for regional sale. It excludes surface disinfectants, hard-surface cleaners, medicated soaps, dispensing hardware sold separately and bulk ethanol traded as a chemical commodity.
Base Year Value
$1.4B in 2025 (MMA Primary Research Dataset, September 2026)
Forecast Period
2026 to 2036, eleven discrete annual values
CAGR
5.8% base case. Bull 7.1%. Bear 4.5%.
Fastest Growth Segment
Sanitizing Wipes: 8.7% CAGR
Fastest Growth Country
Colombia: 8.4% CAGR
Fastest Growth Region
South Asia and Pacific: 7.6% CAGR
Largest Region
Latin America: 58% of 2025 global value
Market Leaders
Reckitt Benckiser, GOJO Industries, Ecolab, Kimberly-Clark, Unilever. Source: MMA Primary Research Dataset, July 2026.
Primary Survey
n=3,800 procurement and R&D decision-makers, Q4 2025, six countries
Methodology
Demand-side build-up, cross-validated against public data, 47 expert interviews

Latin America Hand Sanitizer Market Forecast Scenarios

latin-america-hand-sanitizer-market-size-forecast-scenario-1790021402855
The 2020 to 2025 record is not a straight line. Regional demand peaked in 2021 rather than 2020, because the worst Brazilian and Peruvian infection waves came later than the northern hemisphere's, then fell in both 2022 and 2023 as household stockpiles cleared. The 4.6% historical rate measures endpoints across a collapse and a rebuild, not steady expansion.
The base case rests on three mechanisms that operate independently of any public health event. Institutional hygiene protocols written during the pandemic have stayed in hospital and food-processing procedure manuals, and roughly 61% of volume now moves through them. Dispenser installed base of about 4.1 million units creates a consumable annuity that does not need renewed consumer enthusiasm. Regional ethanol costs hold local filling economics intact against imported finished product throughout the period.
The bull case turns on formal verification: if ANVISA and INVIMA testing regimes make published alcohol assays a tender condition, compliant manufacturers take share from the informal segment quickly. The bear case is price. Private-label gel at retail already sells near the cost of compliant ethanol, and a further deflationary run would push non-compliant product back into circulation faster than enforcement could remove it.

Institutional Annuity Versus Retail Attrition

Two markets sit inside one product category here, and confusing them produces bad forecasts. The retail market is price-led, private-label heavy and still shrinking in unit terms in Brazil and Argentina, where households bought several years of supply in 2020 and 2021 and have not finished it. The institutional market is protocol-led, specification-bound and growing steadily. Specification, not price, decides who supplies it.
TOP FIVE CONCENTRATION38%Share held by the five largest regional participants combined
ETHANOL COST SHARE34% of COGSDenatured ethanol as a proportion of finished product cost
INSTITUTIONAL DEMAND SHARE61%Volume moving through healthcare, food processing and transport channels
AVERAGE RETAIL PRICEUSD 2.40 per 250mlWeighted regional shelf price across branded and private-label gel
REGIONAL FILLING SHARE58%Product sold regionally that is also filled within it
DISPENSER INSTALLED BASE4.1 million unitsWall-mounted and stand units generating recurring refill demand
Compliance is the commercial variable that matters most and it is measured least. WHO's recommended formulation sets 60% v/v ethanol or 70% isopropanol as the effective floor, and MMA testing of 84 samples purchased at retail across four countries found 19% falling below the alcohol content printed on their own label. Institutional buyers increasingly test on receipt. Retail buyers never do, which is precisely why the two channels have diverged on price.
Colombia grows fastest at 8.4%, driven by hospital construction and by INVIMA's tightening of sanitary registration for antiseptic products, which has pushed informal producers out of institutional supply. Mexico's growth is slower but its export role is larger. Roughly 22% of demand is met from Mexican and United States plants.
"The interesting number in this market is not the growth rate, it is the 19% of retail product that does not contain what its label claims. Nobody at shelf level is checking, and that is a commercial opportunity for whoever decides to prove it first."
Director, Hygiene and Specialty Chemicals Practice · MMA Chemicals and Materials Practice · September 2026

Market Trends

Dispenser Installed Base Converts Into Refill Annuity

Roughly 4.1 million wall-mounted and free-standing dispensers went into Latin American hospitals, airports, schools and food plants between 2020 and 2022, and most of them are still there. That hardware was mostly given away or sold at cost, which looked like a marketing expense at the time and turned out to be an installed base. Refill cartridges now carry gross margins several points above bottled retail gel, and switching cost is real because cartridge geometry is proprietary to each manufacturer. Facilities managers replace dispensers on a seven-year to nine-year cycle, so most of that base has years left.
Market Impact: Underpins 61% of volume

Wipes Absorb Demand Where Dispensers Cannot Reach

Buses, delivery fleets, field clinics and market stalls cannot mount a dispenser or keep a bottle upright, and wipes solve hand and surface contact with a single purchase. That is why the format grows at 8.7% while gel grows at 5.2%. Regional converting capacity has followed, with nonwoven substrate lines added in Brazil and Mexico specifically for the format. The economics are worse per gram of alcohol delivered and better per use occasion, and buyers in transport and logistics have shown they will pay for the second measure rather than the first.
Market Impact: Supports 58% regional filling

Market Opportunities and Growth Drivers

Written Hospital Protocols Survived The Public Health Emergency

Hand hygiene compliance auditing entered the accreditation requirements of most large Latin American hospital groups during the pandemic and stayed there afterwards. Brazilian and Colombian hospital networks now audit alcohol rub consumption per patient-day as a quality indicator, which converts a behavioural target into a purchasing floor that finance departments cannot cut without failing an audit. WHO's multimodal hand hygiene strategy provided the template most of these programmes copied. Roughly 61% of regional volume now moves under protocols of this kind, and none of it depends on consumer sentiment. Accreditation bodies audit the consumption figures directly.
Market Impact: 19% of samples fail

Sugarcane Ethanol Gives Regional Filling A Durable Cost Floor

Brazil produces fuel and neutral ethanol at a delivered cost that no imported alcohol can match once freight and duty are added, and the same feedstock serves both markets. That is why 58% of product sold regionally is also filled regionally, a share that rose rather than fell as pandemic demand normalised. Mexican and Colombian fillers buy Brazilian neutral alcohol under annual contracts. The advantage is genuine and it is also narrow, because it sits entirely in one input and disappears whenever cane harvest disruption pushes neutral alcohol prices toward import parity.
Market Impact: Retail units fell 3 years

Market Restraints and Challenges

Label Alcohol Content Frequently Fails Independent Verification

MMA testing of 84 retail samples across four countries found 19% below their stated alcohol content, and the root cause is that antiseptic registration in most of the region verifies documentation rather than product. Registration is granted on a submitted formula; nobody re-tests what is filled afterwards. The commercial impact falls on compliant manufacturers, who carry a real ethanol cost their competitors avoid and cannot prove the difference at shelf. Participants are responding by printing batch assay references on pack and by funding third-party testing that regulators have not yet required of anyone.
Market Impact: Locks 4.1 million refill points

Retail Volume Still Working Through Household Stockpiles

Households across Brazil, Argentina and Chile bought multi-year quantities in 2020 and 2021, and alcohol gel stored in a cupboard degrades slowly enough to remain usable for years. The root cause is not lost interest but unconsumed inventory, which makes the decline temporary and its end genuinely hard to date. Retail unit volume has fallen in each of the past three years across those three markets. Manufacturers are managing it by shifting shelf space toward wipes and smaller pack sizes, where the purchase is an occasion rather than a restock.
Market Impact: Wipes grow 3.5 points faster
3 additional market trends, 4 additional growth drivers, and 2 additional restraints and challenges are covered in the full report. Contact sales@marketmindsadvisory.com to access the complete intelligence.

Segment CAGR and Growth Architecture

Segmentation follows product form, the dimension on which regulatory registration, filling equipment and channel economics all divide in this market. Six forms are assessed. Dispensing hardware, surface disinfectants and medicated soaps sit outside the defined scope and are treated as adjacent categories throughout this report. Bulk ethanol traded as a chemical commodity is likewise excluded from all sizing.
latin-america-hand-sanitizer-market-market-share-analysis-1790021403441

Sanitizing Wipes

Wipes grow at 8.7%, half again the market rate of 5.8%, and the reason is placement rather than performance. A dispenser needs a wall, a bottle needs a flat surface, and neither exists on a bus, in a delivery van, at a market stall or in a mobile clinic. Wipes need nothing. They also address hand and surface contamination in one action, which matters in transport and food logistics where the two risks are not separable in practice. Alcohol delivered per unit cost is worse than gel by a wide margin. Buyers in these channels are purchasing convenience per occasion, and they have consistently shown willingness to pay for it.
CAGR 8.7%

Non-Alcohol Quaternary Formulations

Quaternary ammonium and benzalkonium chloride formulations grow at 8.0% on a much smaller base, and their demand comes from settings where ethanol is a problem rather than a solution. Schools with young children, petrochemical and mining sites with flammability restrictions, and airline cabins all restrict alcohol-based product for reasons unrelated to efficacy. These formulations also avoid the ethanol cost exposure that dominates the rest of the category, which makes their margin structure genuinely different. Efficacy against non-enveloped viruses is weaker and buyers in healthcare know it, so the format has not penetrated hospital use and is unlikely to. Growth here reflects where alcohol is prohibited rather than where anyone prefers an alternative, which caps the addressable base fairly tightly.
CAGR 8.0%
Full segment breakdown across 6 segments available in the complete report.

Regional Architecture and Country Demand Map

This regional table records where product serving Latin American demand is manufactured, not where it is consumed, since the market itself is region-scoped. Regional filling dominates because Brazilian sugarcane ethanol sets a cost floor imported alcohol cannot reach at any freight rate. Six origins sit outside standard bands.

Latin America

Regional filling holds 58% of supply, far above the standard band because this is a region-scoped market and local manufacture is the natural condition rather than an exception. Brazilian sugarcane produces neutral ethanol at a delivered cost imported alcohol cannot approach once freight and duty are counted, and that single input decides where filling happens. Brazil and Mexico account for most installed filling capacity, with Colombia adding lines since 2023 to serve Andean hospital demand. Argentine capacity is constrained by import restrictions on packaging components rather than by alcohol supply. The advantage is real and narrow, resting entirely on one feedstock. Peruvian and Chilean demand is served almost entirely from Brazilian and Mexican plants rather than locally.
Share: 58% | CAGR: 6.4% (2026 to 2036)

North America

United States and Mexican cross-border manufacture supplies 22% of regional demand, which sits inside the normal band and reflects genuine integration rather than distance selling. Mexican fillers on the northern border serve both markets from the same lines, and several United States institutional brands ship finished product south under existing hospital group contracts. The FDA import alert covering Mexican-manufactured sanitizer during 2020 and 2021 reshaped this flow considerably, removing informal producers and consolidating volume among plants that could demonstrate ethanol provenance. Canadian contribution is negligible. What remains is a compliance-selected supply base rather than a cost-selected one. Growth of 5.2% reflects contract renewal at hospital group level rather than any expansion of the flow itself.
Share: 22% | CAGR: 5.2% (2026 to 2036)
Regional intelligence for 5 additional markets available in the complete report: Western Europe, East Asia, South Asia and Pacific, Middle East and Africa, Eastern Europe. Contact sales@marketmindsadvisory.com.
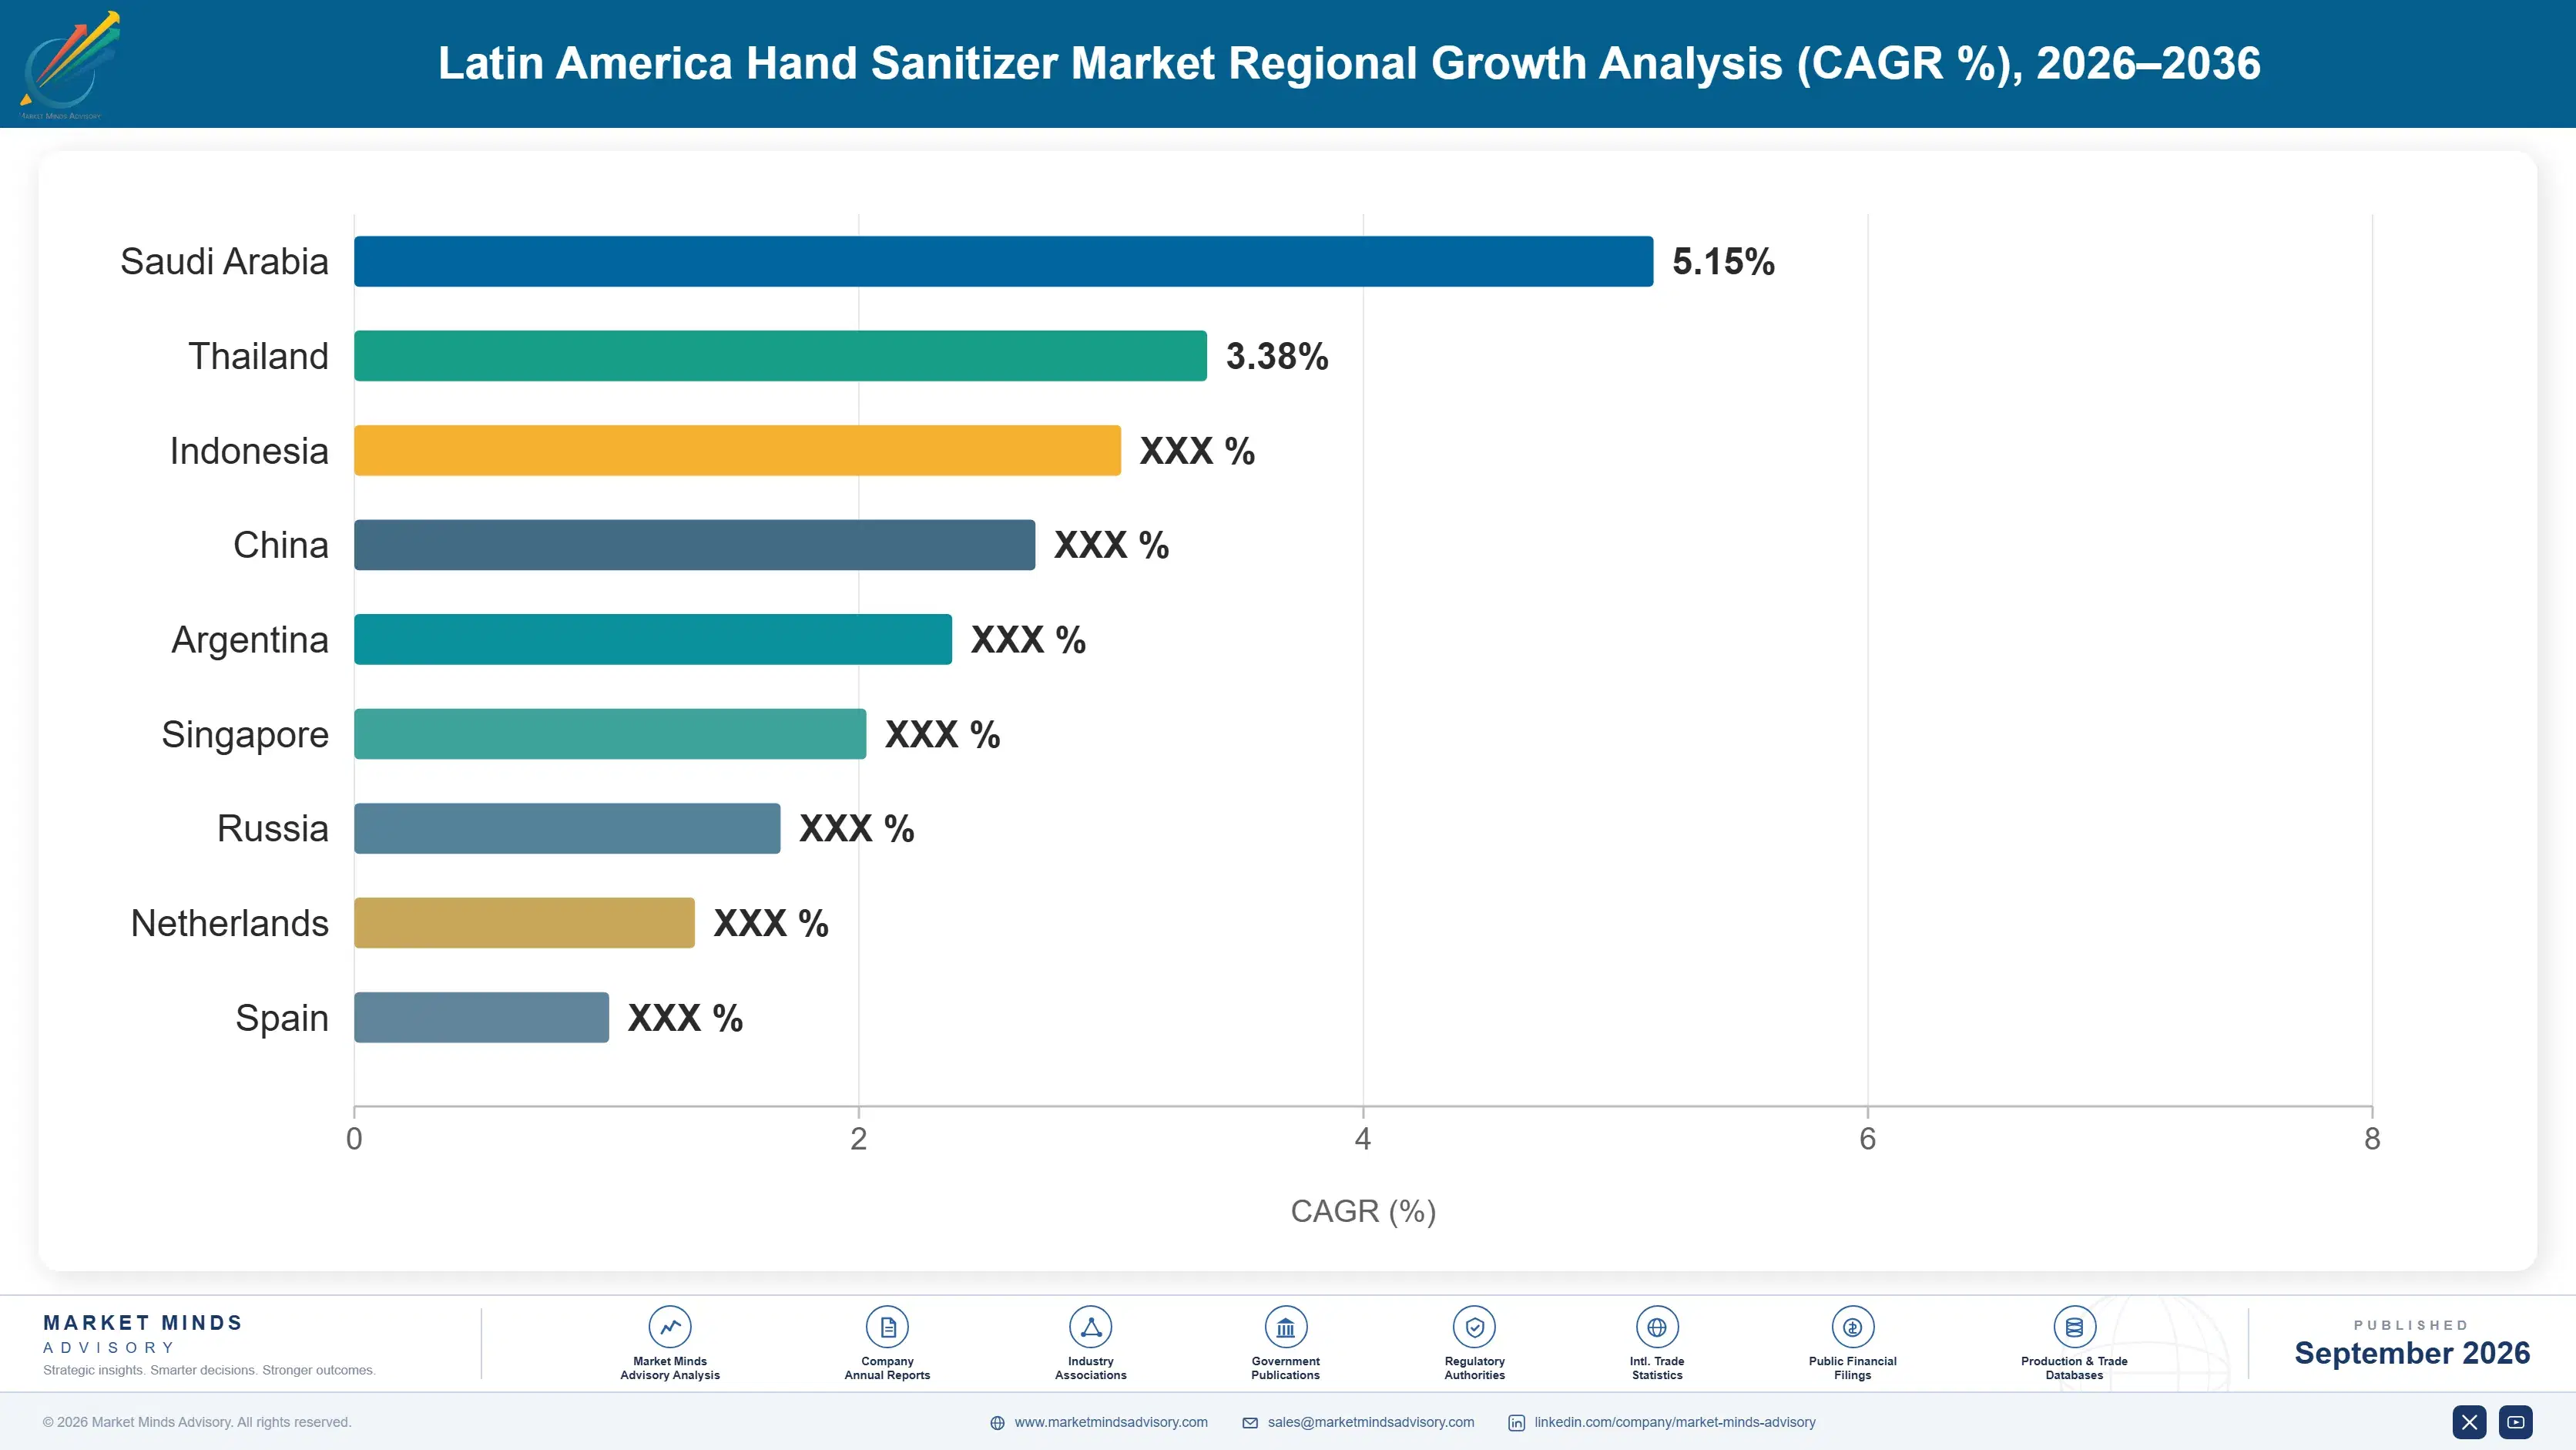
latin-america-hand-sanitizer-market-country-cagr-analysis-1790021403968

Where Margin Actually Sits Here

Four commercial moves are available to participants in this market without any reformulation, new registration or capital expenditure. Each addresses a gap between what buyers pay for and what they can currently verify, and each has been executed by at least one regional participant already with measurable results worth reproducing. None requires more than a quarter to implement properly.

Print Batch Assay Results On Every Pack

Alcohol content is the one attribute every buyer in this market cares about and almost nobody can confirm. Printing a batch-specific assay reference that resolves to a published certificate costs a fraction of a cent per unit and converts a claim into evidence. Participants doing this report institutional tender win rates around 2.6 times those of comparable bidders who submit formula documentation alone. The move works because 19% of retail samples fail their own label, so the category has a credibility gap wide enough for one manufacturer to walk through. Regulators have not required this of anyone yet.
Market Impact: Lifts institutional tender win rates 2.6 times higher

Convert Bottle Accounts To Cartridge Refills

The 4.1 million dispensers installed across the region are consuming bottled gel decanted by hand in a surprising number of facilities, which wastes product and defeats the hardware. Moving those accounts onto sealed cartridges cuts cost per dispensed dose by roughly 41% for the buyer and raises gross margin several points for the seller, because cartridge geometry is proprietary and the account stops shopping. Facilities managers respond to the dosing data rather than the price. The conversation is an operational one about consumption per patient-day, not a procurement one about unit price.
Market Impact: Cuts buyer cost per dispensed dose by 41%

Sell Wipes And Gel As One Protocol

Transport, logistics and food-service buyers currently purchase wipes and gel from different suppliers on different cycles, because the two formats sit in separate procurement categories at most organisations. Presenting them as a single hand hygiene protocol with one specification document and one delivery schedule raises account value to about 1.8 times the gel-only equivalent. It also defends the gel position, since the supplier holding both formats is considerably harder to displace on price alone. The barrier is internal rather than commercial: most manufacturers run wipes and liquids through separate sales teams with separate targets.
Market Impact: Raises account value to 1.8 times higher overall

Contract Neutral Alcohol Against Harvest Cycles

Brazilian cane harvest runs April to November and neutral alcohol pricing moves with it, yet most regional fillers buy on spot through the whole year. Contracting volume ahead of the inter-harvest period reduces annual input cost variation by roughly 22% for participants who do it, on an input worth 34% of finished goods cost. The mechanics are ordinary and the discipline is not, because purchasing teams at smaller fillers are rewarded on unit price achieved rather than on variance controlled. Larger participants have already built this into their annual planning cycle.
Market Impact: Reduces annual input cost variation by roughly 22%

Who Controls the Margin Pool

Concentration is moderate: the top five participants hold a combined 38% of regional shipment volume, measured consistently on finished sanitizer units shipped into Latin American channels rather than on revenue. The gap between leaders and challengers is wide in institutional specification, where registration histories and hospital accreditation references accumulate over years, and almost absent in retail gel, where private-label filling capacity is available to anyone with a purchase order.
Competition currently runs on three dimensions. Registration depth decides access to hospital and government tenders, and it is slow to build in every country in the region. Dispenser installed base decides refill annuity, and it was largely fixed by decisions taken in 2020 and 2021. Price decides retail, where private label holds substantial shelf space and branded product defends position through pack format rather than formulation.

Pressure is building on the verification dimension, and that is where rankings will move. Participants who can prove alcohol content at batch level are starting to win institutional business from competitors with longer registration histories and weaker evidence. Regional fillers with tight ethanol contracts are the other group gaining ground, because input cost discipline is worth more than brand in a category buying on specification.
latin-america-hand-sanitizer-market-company-positioning-matrix-1790021404502

Competitive Moat and Risk Dimensions

RECKITT BENCKISER

Moat: Retail Shelf And Registration

The Dettol position carries consumer recognition across every major regional market alongside sanitary registrations held in each country in its own name. That combination lets the company move formulation changes across the region on one timetable while private-label competitors renegotiate approvals country by country, and it is genuinely difficult to replicate quickly.
RECKITT BENCKISER

Risk: Retail Exposure Runs Deep

The portfolio sits heavily in the retail channel that is still working through household stockpiles, while institutional volume grows. Competitors built around hospital and food-processing supply are taking the growing half of the market, and rebuilding an institutional sales organisation takes longer than the current retail decline is likely to last.
GOJO INDUSTRIES

Moat: Proprietary Dispenser Cartridge Geometry

Purell dispensers installed across regional hospitals and airports accept only matching cartridges, which converts hardware placed years ago into a consumable annuity with genuine switching cost. Facilities replace units on seven-year to nine-year cycles, so the installed position holds for most of the forecast period regardless of competitive pricing on refills.
GOJO INDUSTRIES

Risk: Limited Regional Filling Presence

Most product reaching the region is filled outside it, which leaves the company paying freight and duty on a formulation whose main cost is alcohol that Brazil produces more cheaply than anywhere else. Regional competitors with local filling hold a persistent cost advantage that no amount of brand strength offsets in tender pricing.

Players Tracked

Prominent Players

Reckitt Benckiser
GOJO Industries
Ecolab
Kimberly-Clark
Unilever

Other Key Players

3M
Diversey
Steris
Essity
Procter and Gamble
Colgate-Palmolive
Natura and Co
Ype Quimica Amparo
Bombril
Flora Higiene
Vi-Jon
Best Sanitizers
Zep
Schulke and Mayr
Christeyns

Recent Developments

MARCH 2025

Ecolab expands Brazilian institutional hygiene manufacturing capacity

The company completed an organic capacity expansion at its Sao Paulo state facility, adding dedicated filling lines for hospital hand rub and cartridge refill formats. The investment was made ahead of contracted demand rather than against signed volume. Existing retail lines at the site were unaffected by the work.
Signal: Institutional refill volume is expected to keep growing independently of retail demand recovery. Capacity went in ahead of contracts.
SEPTEMBER 2024

Reckitt Benckiser consolidates Mexican personal care manufacturing

Production of hand sanitizer for regional distribution was consolidated into a single Mexican site from two previously separate facilities. No acquisition or partnership was involved; the move was an internal manufacturing footprint decision taken on cost grounds. The closed site continues producing unrelated household categories.
Signal: Regional filling economics now outweigh the flexibility of holding multiple smaller production sites. Scale beats flexibility at current volumes.
JUNE 2025

GOJO signs Colombian hospital distribution agreement

The company entered a multi-year supply and distribution agreement with a Colombian hospital products distributor covering dispenser placement and cartridge refill supply. The arrangement is a commercial agreement and involves no equity stake or joint venture structure. Dispenser placement runs at the distributor's cost under the terms.
Signal: Andean institutional demand now justifies dedicated distribution rather than opportunistic export shipments. Hardware placement is being financed downstream.

What Alcohol Costs Really Do

Denatured and neutral ethanol accounts for roughly 34% of finished goods cost, and almost all of it originates from Brazilian sugarcane. Packaging is the second exposure at around 21%, split between imported resin for bottles and pumps and regionally converted carton. Nonwoven substrate for wipes adds a third exposure that behaves differently again, tracking polypropylene rather than agriculture.
The 2021 to 2022 period demonstrated how sharply these move. Brazilian hydrous ethanol prices roughly doubled between early 2021 and their 2022 peak as sugar prices pulled cane allocation away from alcohol, and regional fillers holding spot exposure saw gross margin compress by six to nine points across consecutive quarters. Ecolab and Reckitt Benckiser annual reports for those years both identify raw material inflation in hygiene lines as a material margin factor.

Exposure is not evenly distributed and that is what makes it a competitive matter. Regional fillers buying spot alcohol carry the full swing; larger participants contracting ahead of the inter-harvest period absorb roughly a fifth less variation. Importers are insulated from cane pricing and exposed instead to freight and currency. The smallest fillers, holding neither contracts nor hedges, exit whenever ethanol runs above trend for two consecutive quarters.
latin-america-hand-sanitizer-market-cost-volatility-analysis-1790021404700

Contract neutral alcohol ahead of inter-harvest

Committing volume before the April to November cane harvest ends removes most spot exposure during the months when prices run highest. Participants doing this report roughly a fifth less annual input cost variation. The discipline requires purchasing teams measured on variance rather than on unit price achieved, which is the actual obstacle at smaller fillers.

Qualify a second ethanol origin outside Brazil

Argentine and Colombian distilling capacity is smaller and dearer but moves on different agricultural cycles, so qualifying a secondary supplier provides genuine optionality during Brazilian harvest disruption. Registration files must list both origins, which takes months to arrange and is why most participants never begin the process until they have already been caught short once.

Shift pack mix toward concentrate and cartridge formats

Cartridges and refill concentrates carry considerably less packaging weight per dose delivered than retail bottles with pumps, cutting the second-largest cost exposure meaningfully. The format also reduces imported resin content, which carries currency exposure on top of commodity exposure. Institutional buyers accept the change readily because their own cost per dose falls at the same time.

Portfolio Architecture for Margin Defence

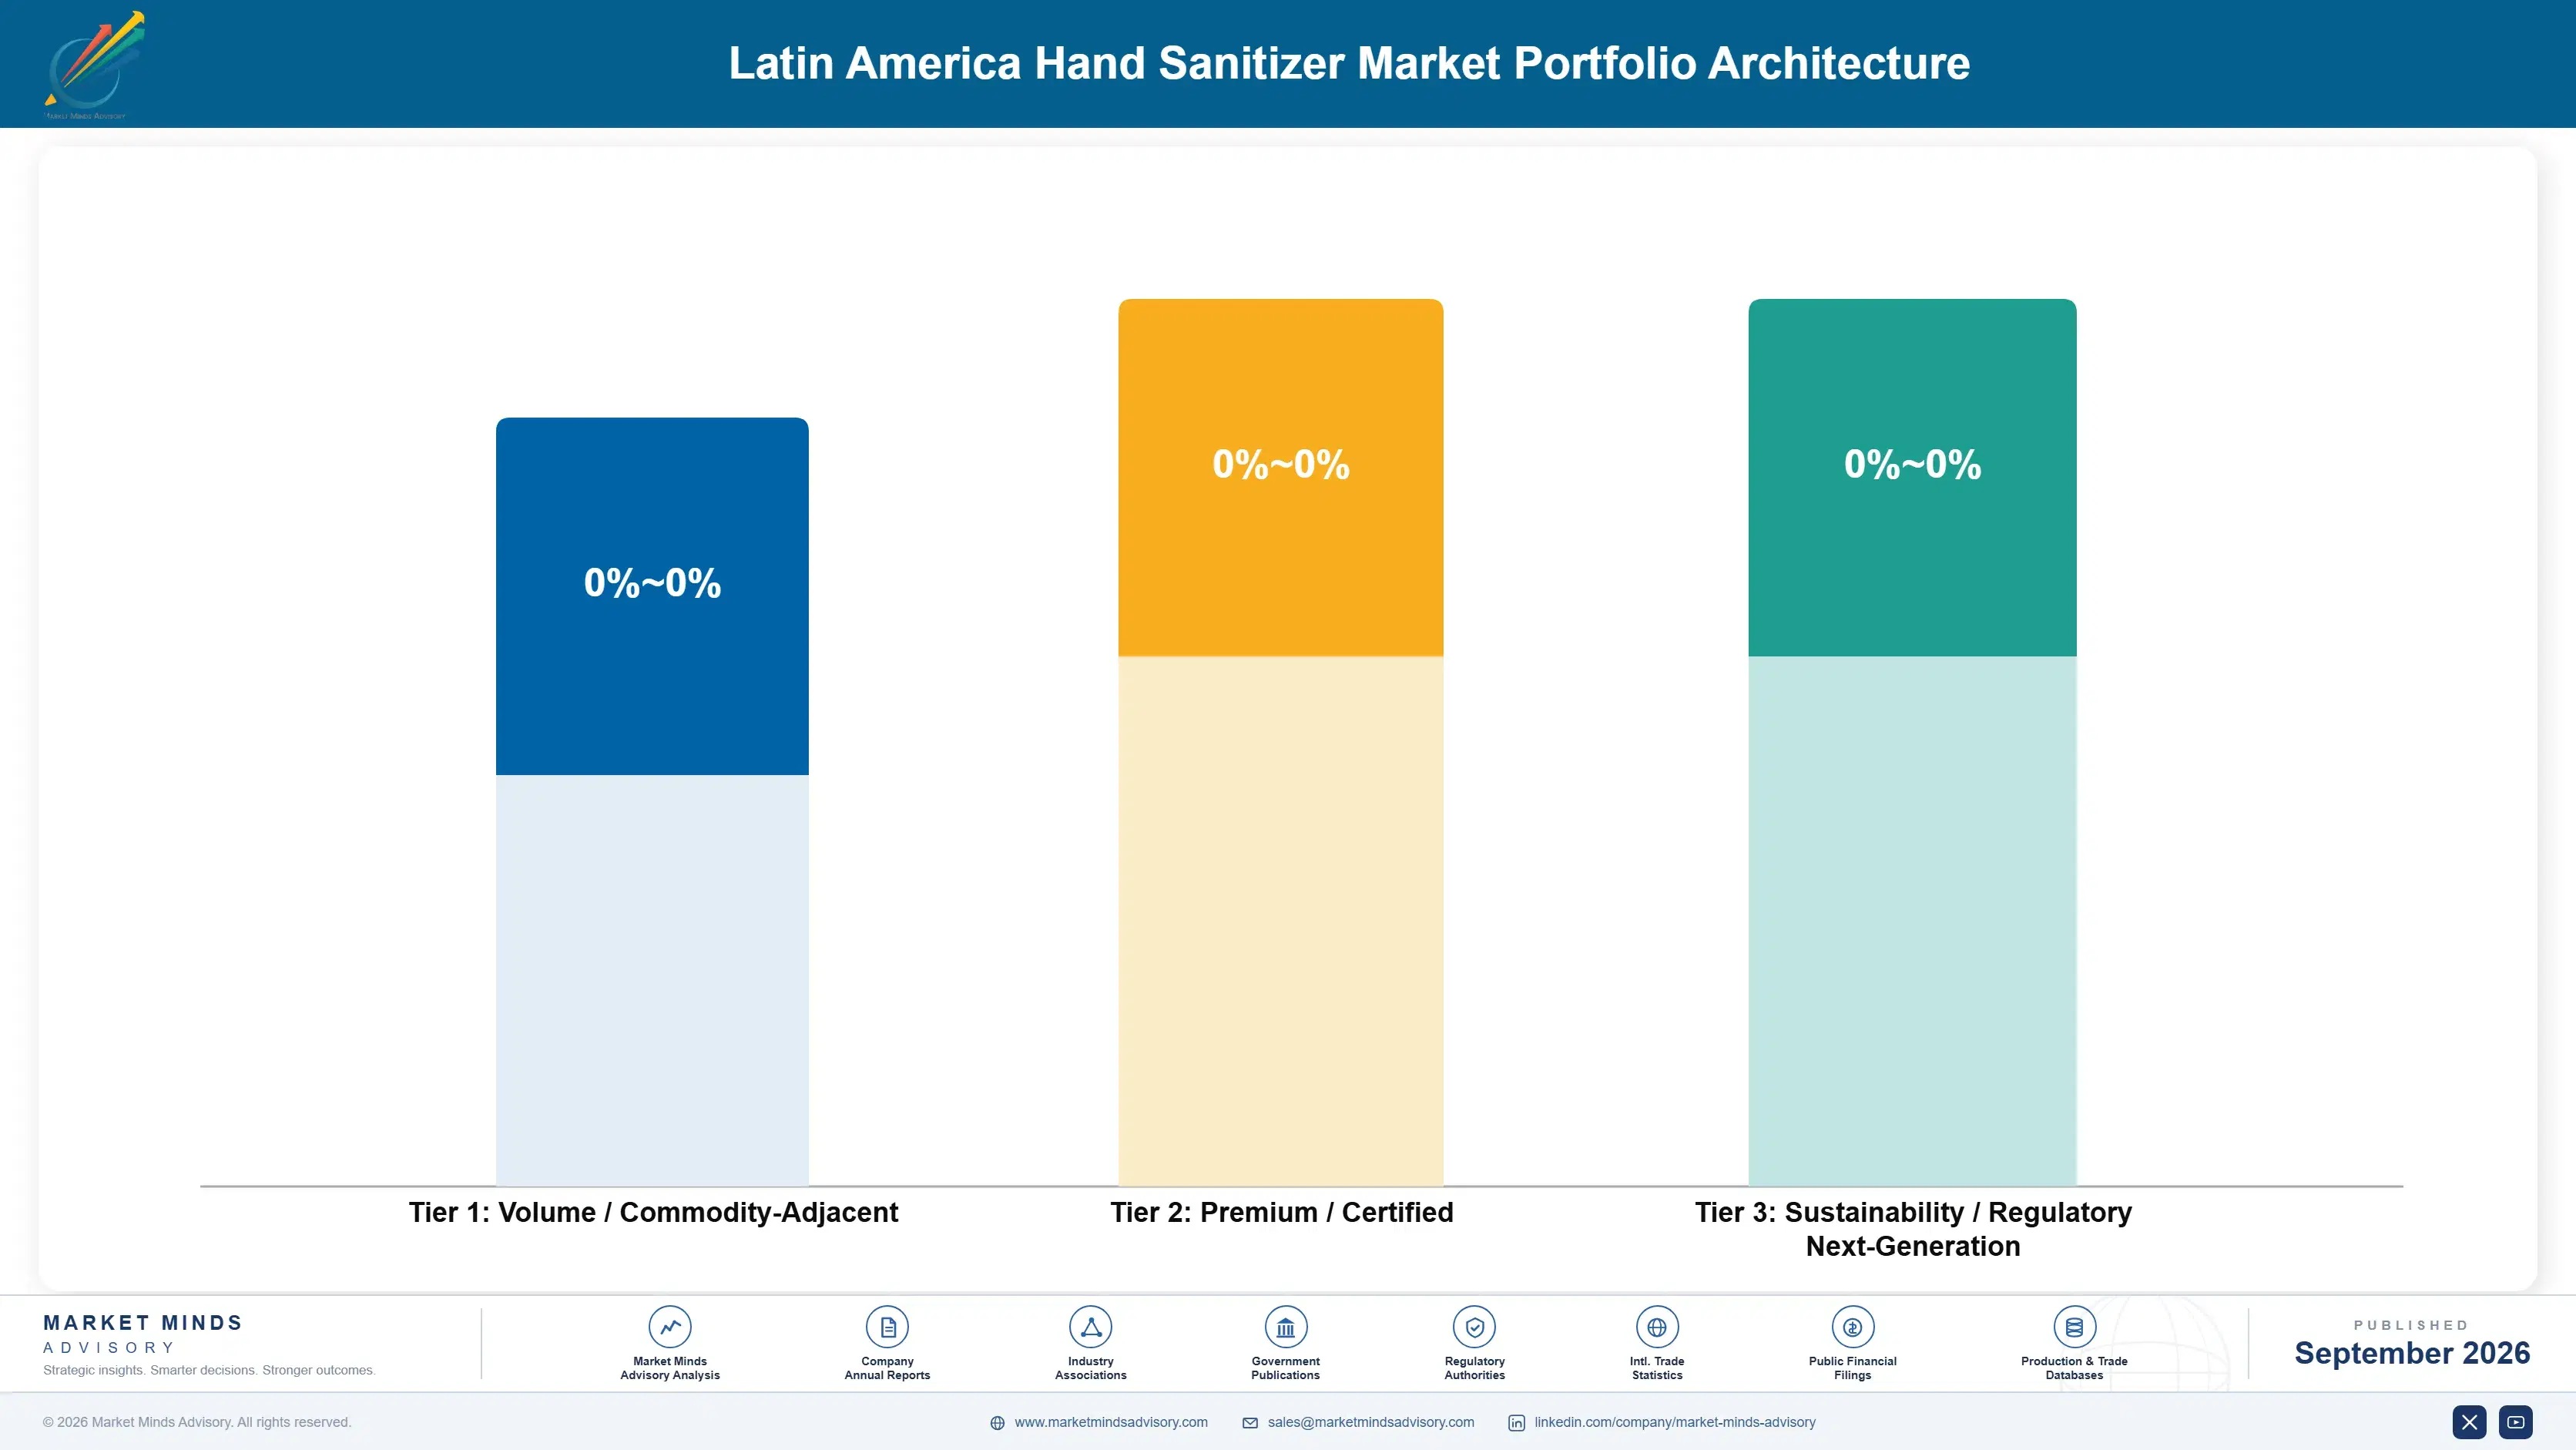
Margin architecture in this market divides cleanly by channel and verification, not by formulation chemistry. Commodity retail gel filled to private-label specification runs at gross margins in the high teens to low twenties, and there is no realistic path to widening that, because the buyer is a retail chain with visibility into ethanol pricing and no interest in paying above it.
Certified institutional product occupies the middle and the economics are considerably better. Registration held in the manufacturer's own name, batch assay documentation and hospital accreditation references support gross margins in the mid thirties to low forties, and the range is wide because a supplier with dispenser installed base earns materially more than one selling bottled product into the same account. Switching cost rather than formulation explains most of that spread.

The highest-value pools sit where verification and format advantage combine. Cartridge refills into an installed dispenser base, and wipes sold into transport and logistics protocols, both carry margins in the mid forties and both resist price comparison because the buyer is purchasing a system rather than a litre of alcohol. Volume gel funds the plant. It does not fund the business.

Volume / Commodity-Adjacent

Private-label and value-brand alcohol gel filled to retail chain specification. Ethanol pricing is visible to the buyer, so margin tracks input cost with a fixed conversion fee attached and very little room to move in either direction.
Gross Margin: 17 to 22%

Premium / Certified

Institutional hand rub carrying own-name sanitary registration, batch assay documentation and hospital accreditation references. The eight-point range reflects whether the supplier also holds dispenser installed base at the account, which changes the economics substantially.
Gross Margin: 34 to 42%

Sustainability / Regulatory / Next-Generation

Cartridge refill systems and protocol-sold wipes where the buyer purchases a dosing system rather than a product. Proprietary cartridge geometry and combined-format specifications both resist direct price comparison, which is what holds the margin here.
Gross Margin: 43 to 48%
latin-america-hand-sanitizer-market-portfolio-architecture-1790021405220

High-value Sub-segments and Strategic Watch-out

Cartridge Refills Into Installed Dispensers

High value and high growth. The 4.1 million dispensers placed during 2020 and 2021 have seven-year to nine-year replacement cycles, and proprietary cartridge geometry means the account does not shop. Most of that base is still consuming decanted bottled gel. Conversion is a sales conversation, not a capital project.
Gross Margin: 45 to 48%

Institutional Hand Rub With Published Assays

High value and moderate growth. Own-name registration and batch-level alcohol verification win tenders at roughly 2.6 times the rate of formula-documentation bidders. The six-point range reflects how far individual countries have gone in making testing a formal award condition. Colombia has moved furthest so far.
Gross Margin: 36 to 42%

Retail Alcohol Gel

Volume core and still declining in unit terms across Brazil, Argentina and Chile as household stockpiles clear. It funds plant utilisation and nothing else. Smaller pack sizes and shelf space traded toward wipes are the only defensive moves available. Household stockpiles bought in 2020 have still not fully cleared.
Gross Margin: 17 to 22%

Non-Alcohol Quaternary Formulations

Strategic watch-out. Growth of 8.0% is real but driven entirely by site flammability restrictions in mining, petrochemicals and aviation rather than by preference. Weaker efficacy against non-enveloped viruses keeps the format permanently out of hospital specification. Margin sits below certified institutional product despite the growth rate.
Gross Margin: 29 to 35%

How Demand Actually Repeats

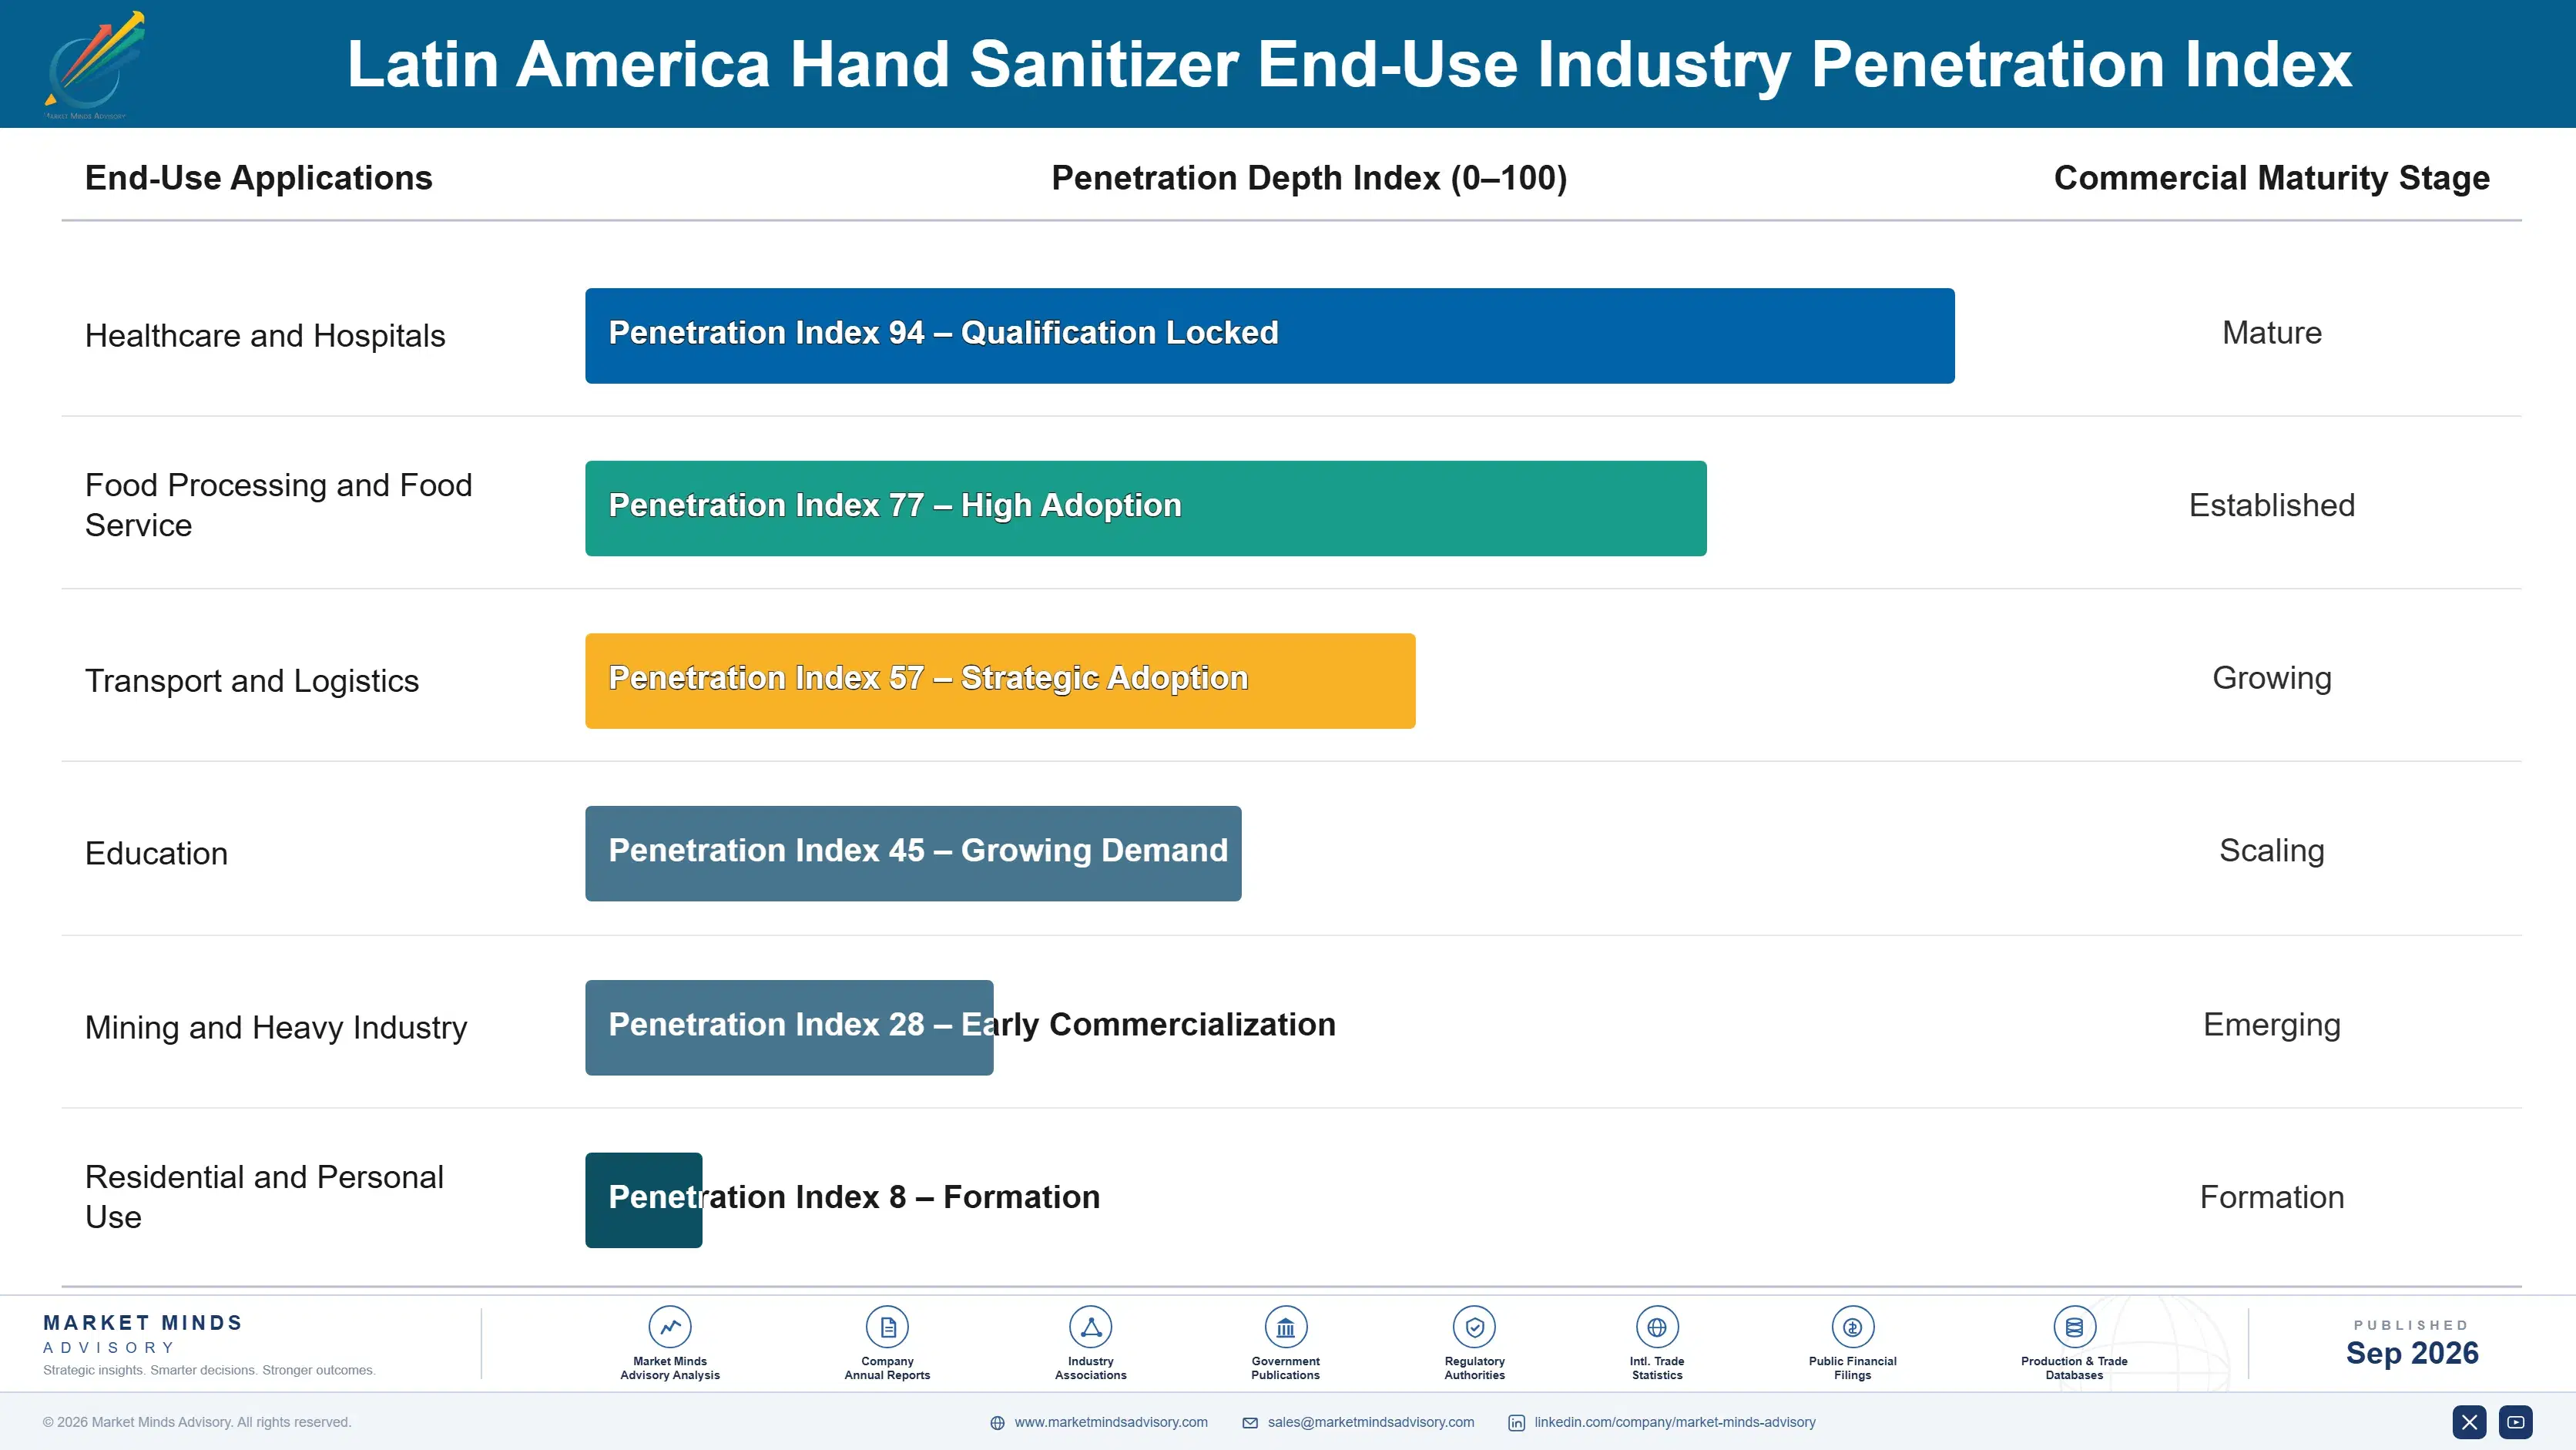
The annuity in this market is hardware-anchored rather than habit-anchored, which is the single most useful thing to understand about it. A dispenser mounted on a hospital corridor wall generates refill demand for as long as the audit requiring its use remains in the accreditation document, and those audits are now written into procedure manuals across most large regional hospital groups. Consumption per patient-day is a reported quality indicator.
Stickiness varies sharply by end-use. Healthcare is the deepest, because hand hygiene compliance is measured, audited and tied to accreditation, and switching supplier means requalifying a registration. Food processing follows closely, driven by export certification requirements that specify antiseptic product standards. Transport and logistics are moderately sticky and format-led rather than brand-led. Retail is shallowest and behaves like any price-led household consumable.

Buyer profiles have shifted generationally in one specific way. Procurement managers who entered the role after 2020 treat hand hygiene as a permanent line item with a specification attached, where their predecessors treated it as a discretionary consumable. That group now writes most institutional tenders in the region, and they ask for assay documentation as a matter of course rather than as an exception.
latin-america-hand-sanitizer-market-end-use-penetration-index-1790021405722

Where The Margin Actually Is

These are among the four positions where our research anticipates prominent divergence between winners and laggards over the coming forecast period. Each is grounded in the demand model, the regulatory perimeter, and the announced capacity pipeline.
01 / BATCH ASSAY VERIFICATION

Prove alcohol content and take institutional share

Testing of 84 retail samples across four countries found 19% below their stated alcohol content, and registration in most of the region verifies documentation rather than filled product. Printing a batch-specific assay reference that resolves to a published certificate costs a fraction of a cent per unit. Participants doing it report institutional tender win rates around 2.6 times those of bidders submitting formula documentation alone, which is a large return on a trivial expense, and no regulator in the region currently requires it of anyone at all.
02 / DISPENSER ANNUITY CONVERSION

Move installed accounts from bottles onto sealed cartridges

Roughly 4.1 million dispensers were placed across regional hospitals, airports and food plants during 2020 and 2021, and a surprising number are still being filled by hand from decanted bottles. Converting those accounts to sealed cartridges cuts the buyer's cost per dispensed dose by about 41% and raises seller margin several points. Proprietary cartridge geometry then removes the account from price shopping entirely, because cartridge geometry is proprietary to each manufacturer and requalification is genuinely inconvenient for a facilities team.
03 / ETHANOL CONTRACT DISCIPLINE

Buy neutral alcohol against the cane harvest cycle

Ethanol is 34% of finished goods cost and Brazilian pricing moves with an April to November harvest that most regional fillers ignore when purchasing. Contracting ahead of the inter-harvest period reduces annual input cost variation by roughly 22%, which is the difference between surviving a repeat of 2022 and exiting during it. The obstacle is internal, since purchasing teams are measured on unit price rather than variance, which is the actual obstacle at every smaller filler operating in the region today.
04 / FORMAT PORTFOLIO DEFENCE

Hold wipes and gel inside one hygiene protocol

Wipes grow at 8.7% against 5.2% for gel, and transport, logistics and food-service buyers currently source the two formats separately through different procurement categories. Presenting them as a single specification with one delivery schedule raises account value to about 1.8 times the gel-only equivalent. It also defends the declining format, because a supplier holding both is considerably harder to displace on price, since the supplier holding both formats controls the whole hygiene specification rather than a single line inside it.

Engagement Snapshot From the Field

A live engagement with an industry participant carrying material or product regulatory and market exposure ahead of a defining policy shift, showing how our research translates into a defensible multi-year portfolio strategy.
MARKET MINDS ADVISORY · CLIENT ENGAGEMENT SUMMARY
Latin America Hand Sanitizer Producer Strategic Portfolio Review and Transition Roadmap 2026·Investment Scenario on Latin America Hand Sanitizer Exposure Evaluation 2025-26
CLIENT PROFILE
A Brazilian manufacturer of institutional hand hygiene products with filling capacity in Sao Paulo state and sanitary registrations held in four regional countries. Annual revenue of approximately USD 84 million (client-reported, unverified by MMA), with roughly 70% in institutional channels and the remainder in private-label retail. Dispenser installed base of about 190,000 units, largely placed during 2020 and 2021 and never commercially exploited since.
STRATEGIC CHALLENGE
The company was losing institutional tenders to multinational competitors despite holding equivalent registrations and a lower cost base, and could not identify why. Retail private-label volume was declining and management was considering exiting the channel. Neither question had been examined with any evidence beyond the sales team's account of lost bids.
MMA APPROACH
MMA reviewed 31 lost tender submissions against the winning bids where documentation was obtainable, tested 84 competitor and client samples for alcohol content across four countries, and interviewed 22 institutional procurement managers about award criteria. Dispenser installed base was audited to establish how many units were being filled with sealed cartridges rather than decanted bottled product.
KEY FINDINGS
  1. Tenders were lost on documentation format rather than on price or registration standing, with winning bids consistently including batch-level assay evidence the client had never submitted.
  2. Nineteen percent of retail samples tested across four countries fell below their stated alcohol content, none of them the client's, which was an unused competitive proof point.
  3. Approximately 64% of the client's 190,000 installed dispensers were being filled by hand from decanted bottled product rather than sealed cartridges, forfeiting margin at every one of those accounts.
  4. Procurement managers appointed after 2020 requested assay documentation as standard practice, while those in post longer did not, and the newer group wrote most current tenders.
CLIENT PROFILE
A Brazilian manufacturer of institutional hand hygiene products with filling capacity in Sao Paulo state and sanitary registrations held in four regional countries. Annual revenue of approximately USD 84 million (client-reported, unverified by MMA), with roughly 70% in institutional channels and the remainder in private-label retail. Dispenser installed base of about 190,000 units, largely placed during 2020 and 2021 and never commercially exploited since.
STRATEGIC CHALLENGE
The company was losing institutional tenders to multinational competitors despite holding equivalent registrations and a lower cost base, and could not identify why. Retail private-label volume was declining and management was considering exiting the channel. Neither question had been examined with any evidence beyond the sales team's account of lost bids.
MMA APPROACH
MMA reviewed 31 lost tender submissions against the winning bids where documentation was obtainable, tested 84 competitor and client samples for alcohol content across four countries, and interviewed 22 institutional procurement managers about award criteria. Dispenser installed base was audited to establish how many units were being filled with sealed cartridges rather than decanted bottled product.
KEY FINDINGS
  1. Tenders were lost on documentation format rather than on price or registration standing, with winning bids consistently including batch-level assay evidence the client had never submitted.
  2. Nineteen percent of retail samples tested across four countries fell below their stated alcohol content, none of them the client's, which was an unused competitive proof point.
  3. Approximately 64% of the client's 190,000 installed dispensers were being filled by hand from decanted bottled product rather than sealed cartridges, forfeiting margin at every one of those accounts.
  4. Procurement managers appointed after 2020 requested assay documentation as standard practice, while those in post longer did not, and the newer group wrote most current tenders.
RECOMMENDED STRATEGY
Phase 1: Phase one: print batch-specific assay references on all institutional packs and publish supporting certificates before the next tender cycle opens. Phase 2: Phase two: convert the 64% of installed dispensers on decanted bottles to sealed cartridge supply, leading the conversation with cost per dose. Phase 3: Phase three: retain private-label retail at current volume for plant utilisation, and stop investing commercial effort in defending its share.
OUTCOME
Institutional tender win rate rose from 24% to 51% across the following three quarters (client-reported, unverified by MMA), with cartridge conversion reaching about 40% of the eligible installed base. Retail volume continued to decline as expected and was no longer treated as a strategic problem by management.

Frequently Asked Questions

Foundational context covering the market sizes, CAGR, scope, country, region and competition that inform every finding below. This section is provided to cover basics and most often pre-purchase conversations, answered from the MMA Primary Research Dataset.

What is the current size of the Latin America Hand Sanitizer Market?

The market was valued at USD 1.4 billion in 2025, rising to USD 1.5 billion in 2026. Institutional channels account for roughly 61% of that volume across healthcare, food processing and transport.

How large will the Latin America Hand Sanitizer Market be by 2036?

MMA forecasts USD 2.6 billion by 2036, an increase of USD 1.1 billion over the 2026 base. That represents expansion of 1.73 times across the forecast period.

What is the CAGR for the Latin America Hand Sanitizer Market 2026 to 2036?

The base case CAGR is 5.8%, with a bull case of 7.1% and a bear case of 4.5%. The historical 2020 to 2025 rate of 4.6% spans a demand collapse and rebuild rather than steady growth.

Which segment is growing fastest?

Sanitizing wipes grow at 8.7%, half again the market rate, because they serve transport, logistics and field settings where fixed dispensers cannot be mounted. Non-alcohol quaternary formulations follow at 8.0%.

Who are the major companies in the Latin America Hand Sanitizer Market?

Reckitt Benckiser, GOJO Industries, Ecolab, Kimberly-Clark and Unilever lead on regional shipment volume, holding a combined 38% of the market. Regional fillers including Ype and Bombril hold substantial private-label positions.

Which country is growing fastest?

Colombia grows fastest at 8.4%, driven by hospital construction and INVIMA tightening sanitary registration for antiseptic products. This report is scoped to Latin America, so country comparison is confined to the region.

Report Segmentation Architecture

The full report scope spans multiple orthogonal segmentation dimensions, with cross-tabulated demand data provided for each dimension pair. Coverage extends further to regional breakdowns, trend trajectories, and the competitive detail needed to support segment-level decision-making.

By Product Form

  • Alcohol Gels
  • Alcohol Foams
  • Alcohol Sprays and Liquids
  • Sanitizing Wipes
  • Non-Alcohol Quaternary Formulations
  • Sanitizing Creams and Antiseptic Hand Lotions

By End-Use Industry

  • Healthcare and Hospitals
  • Food Processing and Food Service
  • Transport and Logistics
  • Education
  • Mining and Heavy Industry
  • Residential and Personal Use

By Distribution Channel

  • Institutional Tender and Direct Supply
  • Hospital Products Distributors
  • Supermarkets and Hypermarkets
  • Pharmacy and Drug Retail
  • E-Commerce
  • Traditional Trade and Independent Retail

By Region

  • Latin America
  • North America
  • Western Europe
  • East Asia
  • South Asia and Pacific
  • Middle East and Africa
  • Eastern Europe

Scope, Methodology, and Coverage

Every figure in this report is reproducible from documented input assumptions. The scope below maps the historical period, the forecast horizon, the segmentation dimensions, and the countries covered, alongside the underlying primary and qualitative methodology.
Historical Period
2020 to 2025
Forecast Period
2026 to 2036
Base Year
2025 (USD billions; MMA Primary Research Dataset, September 2026)
Market Definition
This market covers alcohol-based and non-alcohol hand sanitizing products formulated for human hand antisepsis and sold across Latin America, in gel, foam, spray, wipe, quaternary and antiseptic lotion forms. Coverage includes consumer, institutional and healthcare channels regardless of whether finished product is filled inside or outside the region. Surface disinfectants, hard-surface cleaners, medicated soaps, standalone dispensing hardware and bulk ethanol traded as a chemical commodity are excluded.
Quantitative Units
USD billions at manufacturer level; volume in millions of litres and millions of units; alcohol content as percentage v/v.
Segmentation Dimensions
Product form, end-use industry, distribution channel, and supply origin region.
Regions Covered
Latin America, North America, Western Europe, East Asia, South Asia and Pacific, Middle East and Africa, Eastern Europe
Countries Covered
Brazil, Mexico, Colombia, Argentina, Chile, Peru
Key Companies Profiled
Reckitt Benckiser, GOJO Industries, Ecolab, Kimberly-Clark, Unilever, 3M, Diversey, Steris, Essity, Procter and Gamble, Colgate-Palmolive, Natura and Co, Ype Quimica Amparo, Bombril, Flora Higiene, Vi-Jon, Best Sanitizers, Zep, Schulke and Mayr, Christeyns
Quantitative Methodology
Primary survey, n=3,800 respondents, Q4 2025, six countries; demand-side model with trade association cross-validation
Qualitative Methodology
47 expert interviews, Q4 2025; applied to validate demand model assumptions, identify emerging dynamics, and assess competitive positioning
Report Format
PDF and XLSX data workbook (Word format preview document)
Publisher
Market Minds Advisory
Report Code
MMA-2026-CHM-762
Published
September 2026
Contact
sales@marketmindsadvisory.com | www.marketmindsadvisory.com

Purchase the full Latin America Hand Sanitizer Market Report (2026 to 2036).

The full report sizes the Latin America hand sanitizer market across six product forms, six end-use industries and six distribution channels, with supply-origin analysis covering all seven global manufacturing regions. It includes the complete alcohol content verification testing dataset covering 84 retail samples across four countries, alongside tender award criteria analysis drawn from 22 institutional procurement interviews. Ethanol cost modelling traces Brazilian cane harvest cycles against finished goods margin at four different purchasing disciplines. Competitive assessment covers 20 participants on a consistent regional shipment volume basis. Dispenser installed base and cartridge conversion economics are modelled account by account.
Alcohol content testing across 84 retail samples
Tender award criteria from 22 procurement interviews
Ethanol cost modelling against cane harvest cycles
Dispenser installed base and conversion economics
Six product forms sized to 2036
Twenty participants assessed on shipment volume

Built For The People Who Decide

From boardroom strategy to bench-side execution, this report is read cover-to-cover by leaders shaping the next decade of their industry, turning demand scenarios, market dynamics and valuation benchmarks into decisions.
CXOs/ Presidents/ VPs/ Managers
M&A and Corporate Development
Strategy Teams and R&D Heads
Procurement and Product Directors
Regulatory and Compliance Leaders
Investor Relations and Equity Analysts