Market Minds Advisory
Latin America General Aviation Market

Latin America General Aviation Market: Latin America General Aviation: Substitution Infrastructure, Parts Scarcity and an Ageing Fleet

Where there is no road and no scheduled flight, a utility turboprop is public transport rather than a luxury, and the binding constraint on this market is parts rather than aircraft.

Lead Analyst

Published

September 2026

Make Smarter Decisions with Customized Research Insights

Request a free sample report and evaluate market opportunities, growth trends, and competitive dynamics relevant to your business needs.

2025 MARKET VALUE$4.2BMarket Size 2025
2036 FORECAST VALUE$8.2BBase Case , 2026 to 2036
CAGR 2026 TO 20366.2 %Bull 7.4% / Bear 5.0%
INCREMENTAL OPPORTUNITY$3.7BNet 10- year value creation
EXPANSION MULTIPLE1.82x2036 value over 2026 base
Strategic Levers
M&A Pipeline
Regional Outlook
Country Rankings
Competitive Intelligence
Segmental Deep-dive
Call-Us : 91 93563 13602

Executive Snapshot and Market Trajectory.

Most analysis of this market starts from wealth, and gets it wrong. Across the Amazon, the Andes and Patagonia there is no road and no scheduled flight, so a utility turboprop is public transport rather than a luxury, and demand follows the absence of alternatives rather than any discretionary income.
The binding constraint is parts, not aircraft. Import duty and customs friction make components expensive and slow to arrive, so operators fly airframes far past sensible ages and cannibalise to stay airborne. Single-engine utility turboprops grow fastest at 9.3%, half again the market rate of 6.2%, because they are the workhorse the geography demands rather than the one that buyers might aspire to.
Five firms hold 57%, and one of them is Brazilian, which makes this the only emerging region with a domestic general aviation manufacturer of consequence. Brazil holds the second largest business aviation fleet in the world and Sao Paulo operates an urban helicopter network that exists nowhere else at that scale, driven by ground traffic and security rather than by wealth. Neither fact appears in regional models built from income per head figures alone.
Market Definition
This report covers general aviation aircraft operated across Latin America and the Caribbean together with the parts, maintenance and equipment content supporting them. Scope includes single-engine utility turboprops, light and midsize business jets, twin turboprops, piston aircraft, light and intermediate helicopters, and large-cabin business jets, covering new deliveries, pre-owned transactions and aftermarket content. Excluded are commercial airline aircraft and regional airliners, military and government aviation, unmanned aircraft, airport infrastructure, flight training services sold separately, and charter brokerage operations.
Base Year Value
$4.2B in 2025 (MMA Primary Research Dataset, September 2026)
Forecast Period
2026 to 2036, eleven discrete annual values
CAGR
6.2% base case. Bull 7.4%. Bear 5.0%.
Fastest Growth Segment
Single-Engine Utility Turboprops: 9.3% CAGR
Fastest Growth Country
Colombia: 8.6% CAGR
Fastest Growth Region
South Asia and Pacific: 8.2% CAGR
Largest Region
North America: 48% of 2025 global value
Market Leaders
Embraer, Textron Aviation, Cirrus Aircraft, Airbus Helicopters, Robinson Helicopter. Source: MMA Analysis based on regional fleet participation and delivered aircraft content, July 2026.
Primary Survey
n=3,800 procurement and R&D decision-makers, Q4 2025, six countries
Methodology
Demand-side build-up, cross-validated against public data, 47 expert interviews

Latin America General Aviation Market Forecast Scenarios

latin-america-general-aviation-market-size-forecast-scenario-1790026397111
Growth averaged 5.2% across 2020 to 2025 and demand held up better than almost any comparable region. Utility aviation kept flying through 2020 because the communities it serves had no alternative transport, and business aviation recovered quickly as travellers avoided scheduled services. What did not recover was parts availability, which tightened through the aerospace supply squeeze and hit a region already handicapped by duty and customs delay.
Base case growth of 6.2% rests on three mechanisms. Utility turboprop demand continues wherever roads, rivers and scheduled service fail to connect communities, which is most of the interior across several large countries. Business aviation grows with corporate activity in Mexico, Brazil and Colombia, helped by a domestic manufacturer whose support network is genuinely regional. And fleet age forces replacement eventually, since airframes flown past sensible service lives reach a point where parts cannot be found.
The bull case at 7.4% assumes import and customs treatment of aviation parts improves, which would lower operating cost and bring deferred replacement forward. The bear case at 5.0% follows from currency and duty working the other way, keeping parts expensive, extending an old fleet further, and suppressing new deliveries in favour of cannibalising what flies.

Transport of Last Resort, Flown Too Long

General aviation here is substitution infrastructure, and analysis should start there. Across the Amazon, the Andes, Patagonia and much of Central America there is no usable road and no scheduled service, and roughly 41% of regional flight hours are flown on missions with no surface alternative at all. That demand does not move with discretionary income, which is why models built from wealth indicators misread this market.
FIVE-FIRM CONCENTRATION57%One of the leading manufacturers is regional rather than imported
AVERAGE FLEET AGE26 yearsMean airframe age across the regional general aviation fleet
PARTS IMPORT DUTY BURDEN19%Average duty and clearance cost added to imported components
UTILITY MISSION SHARE41%Regional flight hours flown where no surface alternative exists
CUSTOMS CLEARANCE DELAY23 daysTypical wait for imported aviation parts to reach operators
AFTERMARKET REVENUE SHARE62%Market value from parts, maintenance and support rather than aircraft
The fleet is old because parts are expensive and slow, not because operators are poor. Duty and clearance add around 19% to component cost and about 23 days to delivery, which pushes operators toward extending airframes, cannibalising retired aircraft and deferring routine work. Fleet age averages near 26 years. Aftermarket accounts for roughly 62% of market value, which is where both the difficulty and most of the money actually sit.
Brazil distorts every regional figure and deserves separate treatment. It holds the world's second largest business aviation fleet, Sao Paulo operates an urban helicopter network with no equivalent anywhere at that scale, and the region's own manufacturer builds business jets sold worldwide. None of that resembles the rest of the region, and blending it into one regional average describes no actual country.
"Manufacturers arrive with a wealth map and a business jet brochure. The aircraft that actually matters flies medicine into a village with no road, and it was built in 1998."
Director, Business Aviation and Rotorcraft Practice · MMA Aerospace / General and Business Aviation Practice · September 2026

Market Trends

Fleet Age Reaches The Point Where Parts Disappear

Average airframe age near 26 years has pushed a large share of the fleet past the point where manufacturers still support the type properly, and owners increasingly depend on used serviceable material recovered from retired aircraft. That works until the donor pool empties, which several types are now approaching. The commercial consequence is a replacement wave arriving not because operators want new aircraft but because the old ones can no longer be kept flying at any price they can justify paying. A replacement wave arrives because nothing else can keep them flying.
Market Impact: Covers 41% of regional flight hours

Shared Ownership Models Reach Operators Who Cannot Buy

Fractional and shared ownership programmes have grown quickly in Brazil and Mexico, reaching businesses and individuals who need aircraft access but cannot fund or justify sole ownership at regional interest rates. The model suits the region well because it spreads both capital cost and the parts availability risk that makes individual ownership unpredictable. Operators running these programmes have become significant fleet buyers in their own right, which changes the manufacturer's customer from many individuals into a few sophisticated purchasers. Parts availability risk sits with the programme rather than with the member.
Market Impact: Regional share exceeds global 17 points

Market Opportunities and Growth Drivers

Geography Without Roads Sustains Utility Aviation Demand

Across the Amazon basin, Andean valleys, Patagonia and interior Central America there is no road network worth the name and scheduled service reaches almost none of it, which makes light aircraft the practical transport for people, medicine, supplies and commerce. Roughly 41% of regional flight hours are flown on such missions. This demand is inelastic in a way discretionary aviation never is, and it continued through the period when business flying stopped entirely, which few forecasters anticipated. No substitute exists at all, which is what makes this demand genuinely inelastic.
Market Impact: Adds 19% to component cost

Regional Manufacturer Gives The Market A Domestic Support Network

Brazil hosts the only general aviation manufacturer of consequence outside North America and Europe, and its regional service network, parts distribution and local language support materially reduce the friction that makes aircraft ownership difficult elsewhere in the region. Operators weigh that support advantage heavily, because a grounded aircraft waiting weeks for a part is the defining ownership problem here. That position has produced regional market share well above the manufacturer's global standing in comparable categories. Operators weigh support presence heavily, and language and proximity both count for a great deal.
Market Impact: Reprices ownership across 12 months

Market Restraints and Challenges

Import Duty And Customs Delay Make Parts Prohibitively Expensive

Duty and clearance add around 19% to imported component cost and about 23 days to delivery, which turns routine maintenance into a planning exercise and grounds aircraft for weeks over items worth very little. The root cause is that customs regimes treat aviation parts as ordinary imports rather than as returnable operational goods, and no aviation authority owns the problem. Commercially this suppresses fleet utilisation and extends airframe life beyond sense. Mitigation runs through bonded parts pools, regional distribution centres and temporary admission arrangements where they can be obtained. No aviation authority owns this problem.
Market Impact: Fleet averages 26 years old

Currency Volatility Prices Aircraft Beyond Regional Buyers

Aircraft and parts are priced in dollars while almost all regional revenue arrives in local currency, so a devaluation can reprice an ownership decision overnight regardless of the operator's underlying business performance. The root cause is that no manufacturer will accept regional currency risk over a multi-year delivery cycle. Commercially this produces order cancellations and deferred replacement unrelated to demand. Participants respond through dollar-revenue operator targeting, local currency financing structures, and pre-owned inventory that clears at prices the market can actually absorb. Underlying demand had nothing to do with the cancellation.
Market Impact: Shared programmes reach 14% of fleet
4 additional market trends, 3 additional growth drivers, and 2 additional restraints and challenges are covered in the full report. Contact sales@marketmindsadvisory.com to access the complete intelligence.

Segment CAGR and Growth Architecture

Aircraft are segmented here by class, because class determines the mission, the operator and the economics of keeping it flying. Mixing class with ownership model or country produces categories that overlap on almost every fleet. Six classes cover the field from piston aircraft through to large-cabin jets, and the region's centre of gravity sits far lower than most analysis assumes.
latin-america-general-aviation-market-market-share-analysis-1790026397743

Single-Engine Utility Turboprops

Growing at 9.3%, half again the market rate of 6.2%, this class is the practical workhorse of regional aviation rather than an aspirational purchase. It carries people, freight, medical supplies and commerce into places with no road and no scheduled service, can operate from unpaved strips, and is simple enough to maintain where support infrastructure is thin. Demand is close to inelastic because there is no substitute, which is why the class kept flying through periods when business aviation stopped entirely. Buyers are operators and governments rather than individuals, and they evaluate on payload, field performance and parts availability rather than on anything else. The geography, not the buyer, dictates what gets bought.
CAGR 9.3%

Light And Midsize Business Jets

Light and midsize jets grow at 7.1%, driven by corporate activity in Mexico, Brazil and Colombia and helped considerably by the presence of a regional manufacturer whose support network reduces the ownership friction that deters buyers elsewhere. Distances across the region genuinely justify a jet where a turboprop cannot make the mission in a working day. Fractional and shared ownership has widened the buyer base beyond those able to fund an aircraft outright. Pre-owned transactions outnumber new deliveries substantially, and currency movement moves that balance sharply in either direction from one year to the next. Fleet concentration in three countries makes any regional average misleading for this particular class entirely.
CAGR 7.1%
Full segment breakdown across 6 segments available in the complete report.

Regional Architecture and Country Demand Map

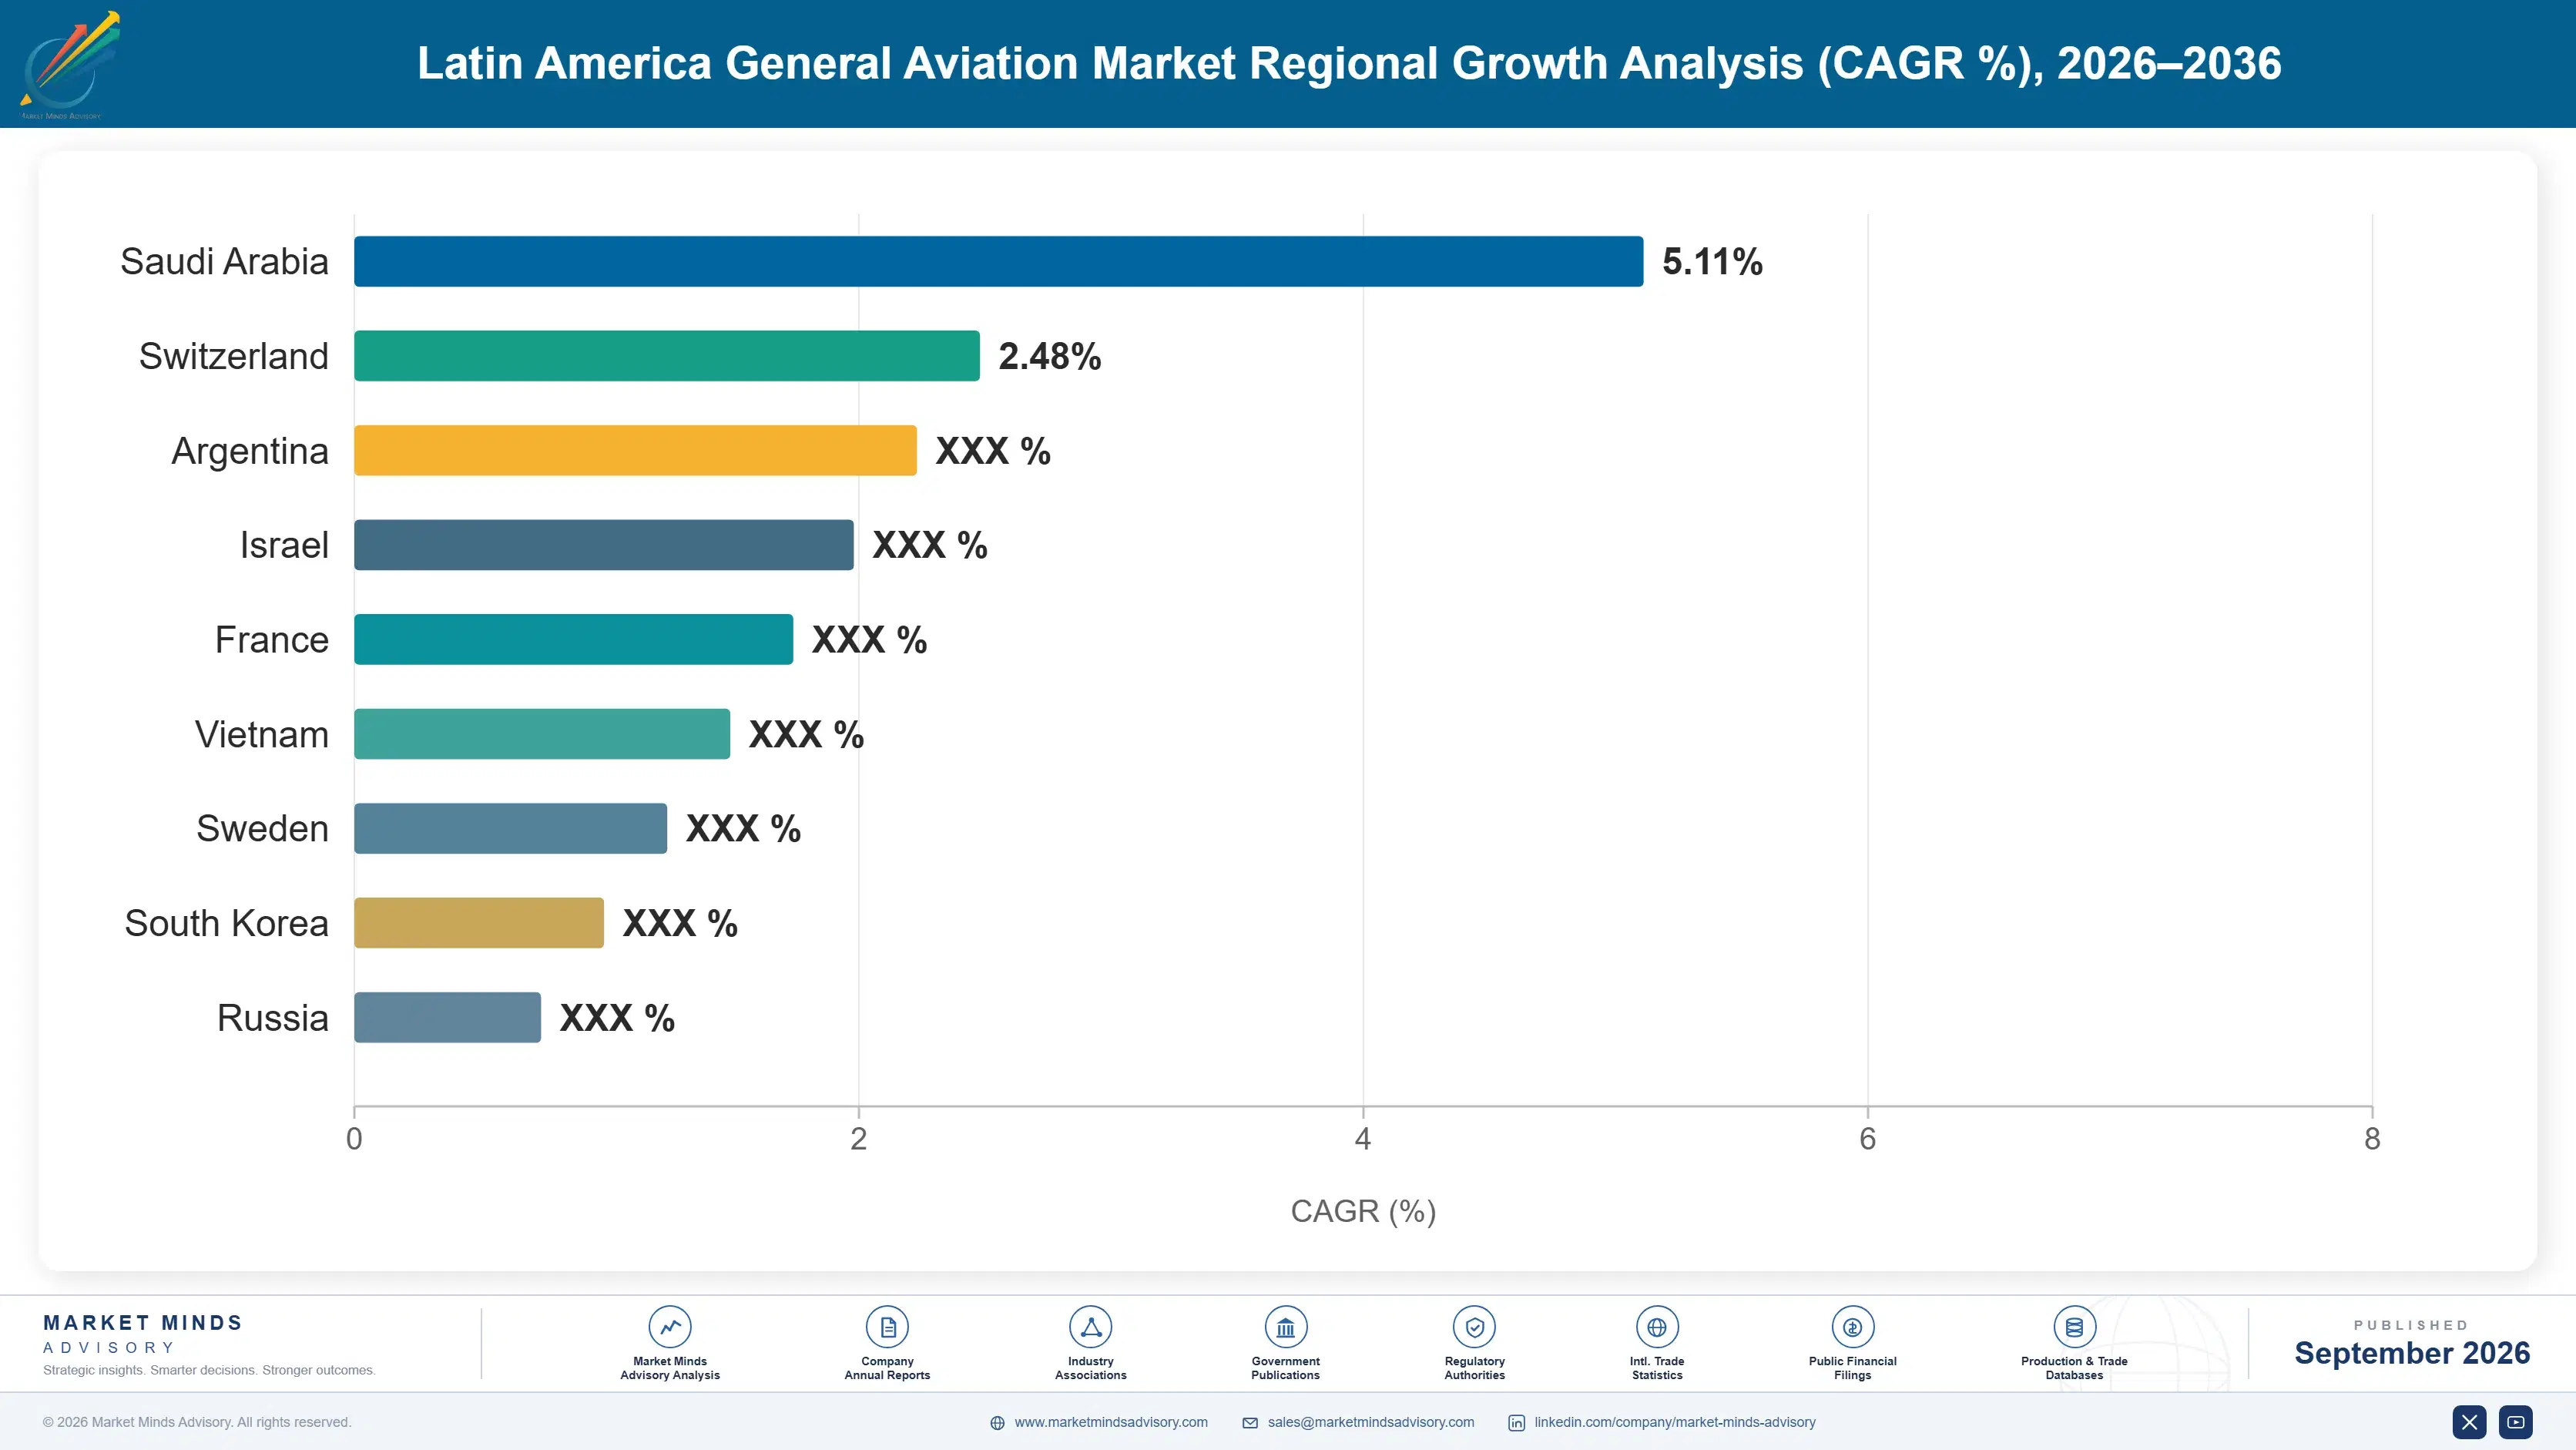
This is a region-scoped report, so the regional table records where the aircraft and content serving Latin American operators are manufactured rather than where demand sits. North American manufacture supplies most of the fleet, with Brazilian production giving this region a domestic source that no comparable market holds.

North America

At 48%, far above the 22 to 32% band applied elsewhere in this report, North American manufacture supplies most of the regional fleet across almost every class. United States production dominates utility turboprops, piston aircraft, light helicopters and a substantial share of business jets, and Canadian manufacture adds engines, business jets and support content. Proximity, established distribution and decades of operator familiarity reinforce the position considerably. Growth of 5.8% sits below the regional market rate, as Brazilian production and European specialist types both take incremental share in categories where support presence matters more than purchase price. Support presence matters more than purchase price in every category where aircraft cannot afford to wait.
Share: 48% | CAGR: 5.8% (2026 to 2036)

Latin America

At 24%, far above the 5 to 9% band used elsewhere, Brazilian manufacture gives this region something no comparable emerging market has: its own general aviation manufacturer of genuine international standing. Business jets built in Brazil sell worldwide while giving regional operators a support network, parts distribution and language capability that imported types cannot match easily. Helicopter assembly in Brazil adds a second domestic source. Growth of 6.8% sits above the regional market rate, because support presence weighs heavily with operators for whom a grounded aircraft waiting on a part is the defining ownership problem. A grounded aircraft waiting on a part is the defining ownership problem, and proximity answers it.
Share: 24% | CAGR: 6.8% (2026 to 2036)
Regional intelligence for 5 additional markets available in the complete report: Western Europe, East Asia, South Asia and Pacific, Middle East and Africa, Eastern Europe. Contact sales@marketmindsadvisory.com.
latin-america-general-aviation-market-country-cagr-analysis-1790026398269

Where General Aviation Suppliers Earn Here

New aircraft deliveries are the visible revenue in this market and a minority of it. Parts availability, support presence and ownership model access decide economics instead. The four levers below reflect positions participants have used to improve returns measurably rather than to lift delivery counts. Aftermarket is where the market actually lives. Deliveries are the small half.

Hold Parts Inventory Inside The Region

Duty and clearance add around 19% to component cost and 23 days to delivery, which makes a regional parts pool worth more to an operator than almost any product improvement. Manufacturers and distributors holding bonded regional inventory capture aftermarket revenue that would otherwise be lost to cannibalisation or deferral entirely. Participants with regional distribution report aftermarket revenue roughly 2.7 times that of those supplying from outside the region. The working capital commitment is real and it is precisely why so few competitors have made it. Few competitors have made the commitment at all.
Market Impact: Aftermarket revenue runs roughly 2.7 times higher overall

Compete On Support Presence Rather Than Aircraft Specification

A grounded aircraft waiting weeks for a part is the defining ownership problem across this region, which makes service network depth the criterion operators actually weigh once an aircraft meets the mission. Manufacturers with regional service presence and local language support hold market share well above their global standing in comparable categories, in one case by roughly 17 points. Specification comparisons feature in brochures and rarely in decisions. Building that presence costs money ahead of the revenue that justifies it. Presence must be built well ahead of the revenue justifying it.
Market Impact: Regional share exceeds global standing by 17 points

Sell Into Shared Ownership Operators, Not Individuals

Fractional and shared ownership programmes now reach around 14% of the regional fleet and have become significant fleet purchasers, which converts a manufacturer's customer base from many individuals with unpredictable financing into a few sophisticated buyers with balance sheets. Those operators also absorb the parts availability risk that deters individual ownership. Manufacturers selling through them report order predictability and average transaction size well above direct individual sales, and considerably lower cost of sale as well. Cost of sale falls considerably as well, which manufacturers frequently overlook when comparing the two channels.
Market Impact: Shared programmes now cover 14% of the fleet

Build Utility Capability Rather Than Cabin Appeal

Roughly 41% of regional flight hours are flown on missions with no surface alternative, and those operators buy on payload, unpaved field performance and maintainability rather than on anything a cabin brochure describes. Manufacturers offering genuine utility capability face far less competition than in business categories, and the demand is close to inelastic because there is no substitute. Utility types have held delivery volumes through periods when business aviation stopped entirely, which is a durability no other class in this market offers. Competition in the category is considerably thinner than elsewhere.
Market Impact: Utility covers 41% of all regional flight hours

Who Controls the Margin Pool

Concentration is 57% for the top five, measured on regional fleet participation and delivered aircraft content, the basis used throughout this section. One of those five is Brazilian, which makes this the only emerging region with a domestic general aviation manufacturer of international standing, and that presence reshapes the competitive picture because support network depth matters more here than almost anywhere else.
Competition currently turns on three dimensions. Regional parts availability decides whether an aircraft flies or waits, which operators weigh above specification once the mission is met. Service network and language presence decides who operators trust with an asset they cannot afford to have grounded. And ownership model access decides whether a manufacturer reaches buyers who cannot fund an aircraft outright at regional financing costs.

Positions will move on support rather than product. A manufacturer improving regional parts distribution changes operator preference within a season, while a new aircraft takes years and a certification programme. European manufacturers with genuinely suitable utility products are held back by support thinness rather than by aircraft merit, and the same is true of capable Czech, Polish and South African types that have never established a regional presence at all.
latin-america-general-aviation-market-company-positioning-matrix-1790026398790

Competitive Moat and Risk Dimensions

EMBRAER

Moat: Domestic Manufacture And Support Depth

Embraer is the only general aviation manufacturer of international standing based in the region, which gives it a service network, parts distribution and language support imported types cannot match on cost or responsiveness. In a market where a grounded aircraft waiting on a part is the defining problem, that advantage translates into regional share well above the company's global standing.
EMBRAER

Risk: Absent From Utility Categories

The company's general aviation range sits in business jets rather than in the utility turboprop and light aircraft classes that carry roughly 41% of regional flight hours and grow fastest. Entering those categories means a different aircraft, a different buyer and a certification programme, none of which follows from the business jet position however strong that position happens to be.
TEXTRON AVIATION

Moat: Utility Fleet Installed Base

Textron's utility turboprop is the defining aircraft of regional substitution aviation, operating from unpaved strips into communities with no road access across several countries. That installed base generates continuous parts and support demand, and operator familiarity with the type across generations makes displacement genuinely difficult for any competitor offering comparable capability.
TEXTRON AVIATION

Risk: Regional Parts Distribution Gaps

The company's aftermarket position depends on parts reaching operators, and duty plus clearance adds around 19% and 23 days across much of the region. Where regional inventory is thin, operators cannibalise or defer rather than buying, which loses revenue the installed base should generate and pushes owners toward types with better local distribution.

Players Tracked

Prominent Players

Embraer
Textron Aviation
Cirrus Aircraft
Airbus Helicopters
Robinson Helicopter

Other Key Players

Bombardier
Gulfstream Aerospace
Pilatus Aircraft
Daher
Piper Aircraft
Diamond Aircraft
Leonardo Helicopters
Bell
Sikorsky
Honda Aircraft Company
Pratt and Whitney Canada
Garmin
Collins Aerospace
Safran Helicopter Engines
Lycoming Engines

Recent Developments

MAY 2025

Manufacturer opens regional parts distribution centre serving South American operators

An aircraft manufacturer commissioned a regional parts distribution centre intended to cut clearance delay for South American operators, holding inventory inside the region rather than shipping from abroad. This was organic investment rather than any acquisition, and it addresses the constraint operators cite above all others.
Signal: Regional inventory changes operator preference within a single season, which no product improvement can ever match
OCTOBER 2024

Brazilian shared ownership operator places multi-aircraft fleet order

A Brazilian shared ownership operator placed a multi-aircraft order covering business jets and helicopters, consolidating demand that would previously have come from many individual buyers. This was a commercial fleet purchase rather than any corporate transaction, and it reflects how ownership models are reshaping the customer base.
Signal: Fleet buyers replace individual purchasers, changing both order predictability and the cost of selling aircraft entirely
JANUARY 2025

Regional authorities examine customs treatment of aviation spare parts

Aviation and customs authorities in several regional countries opened examination of how aircraft spare parts are treated on import, following industry submissions on cost and clearance delay. This was a regulatory review rather than any corporate event, and it addresses a constraint that shapes fleet age across the region.
Signal: Customs reform would lower operating cost and pull deferred replacement forward across an unusually old fleet

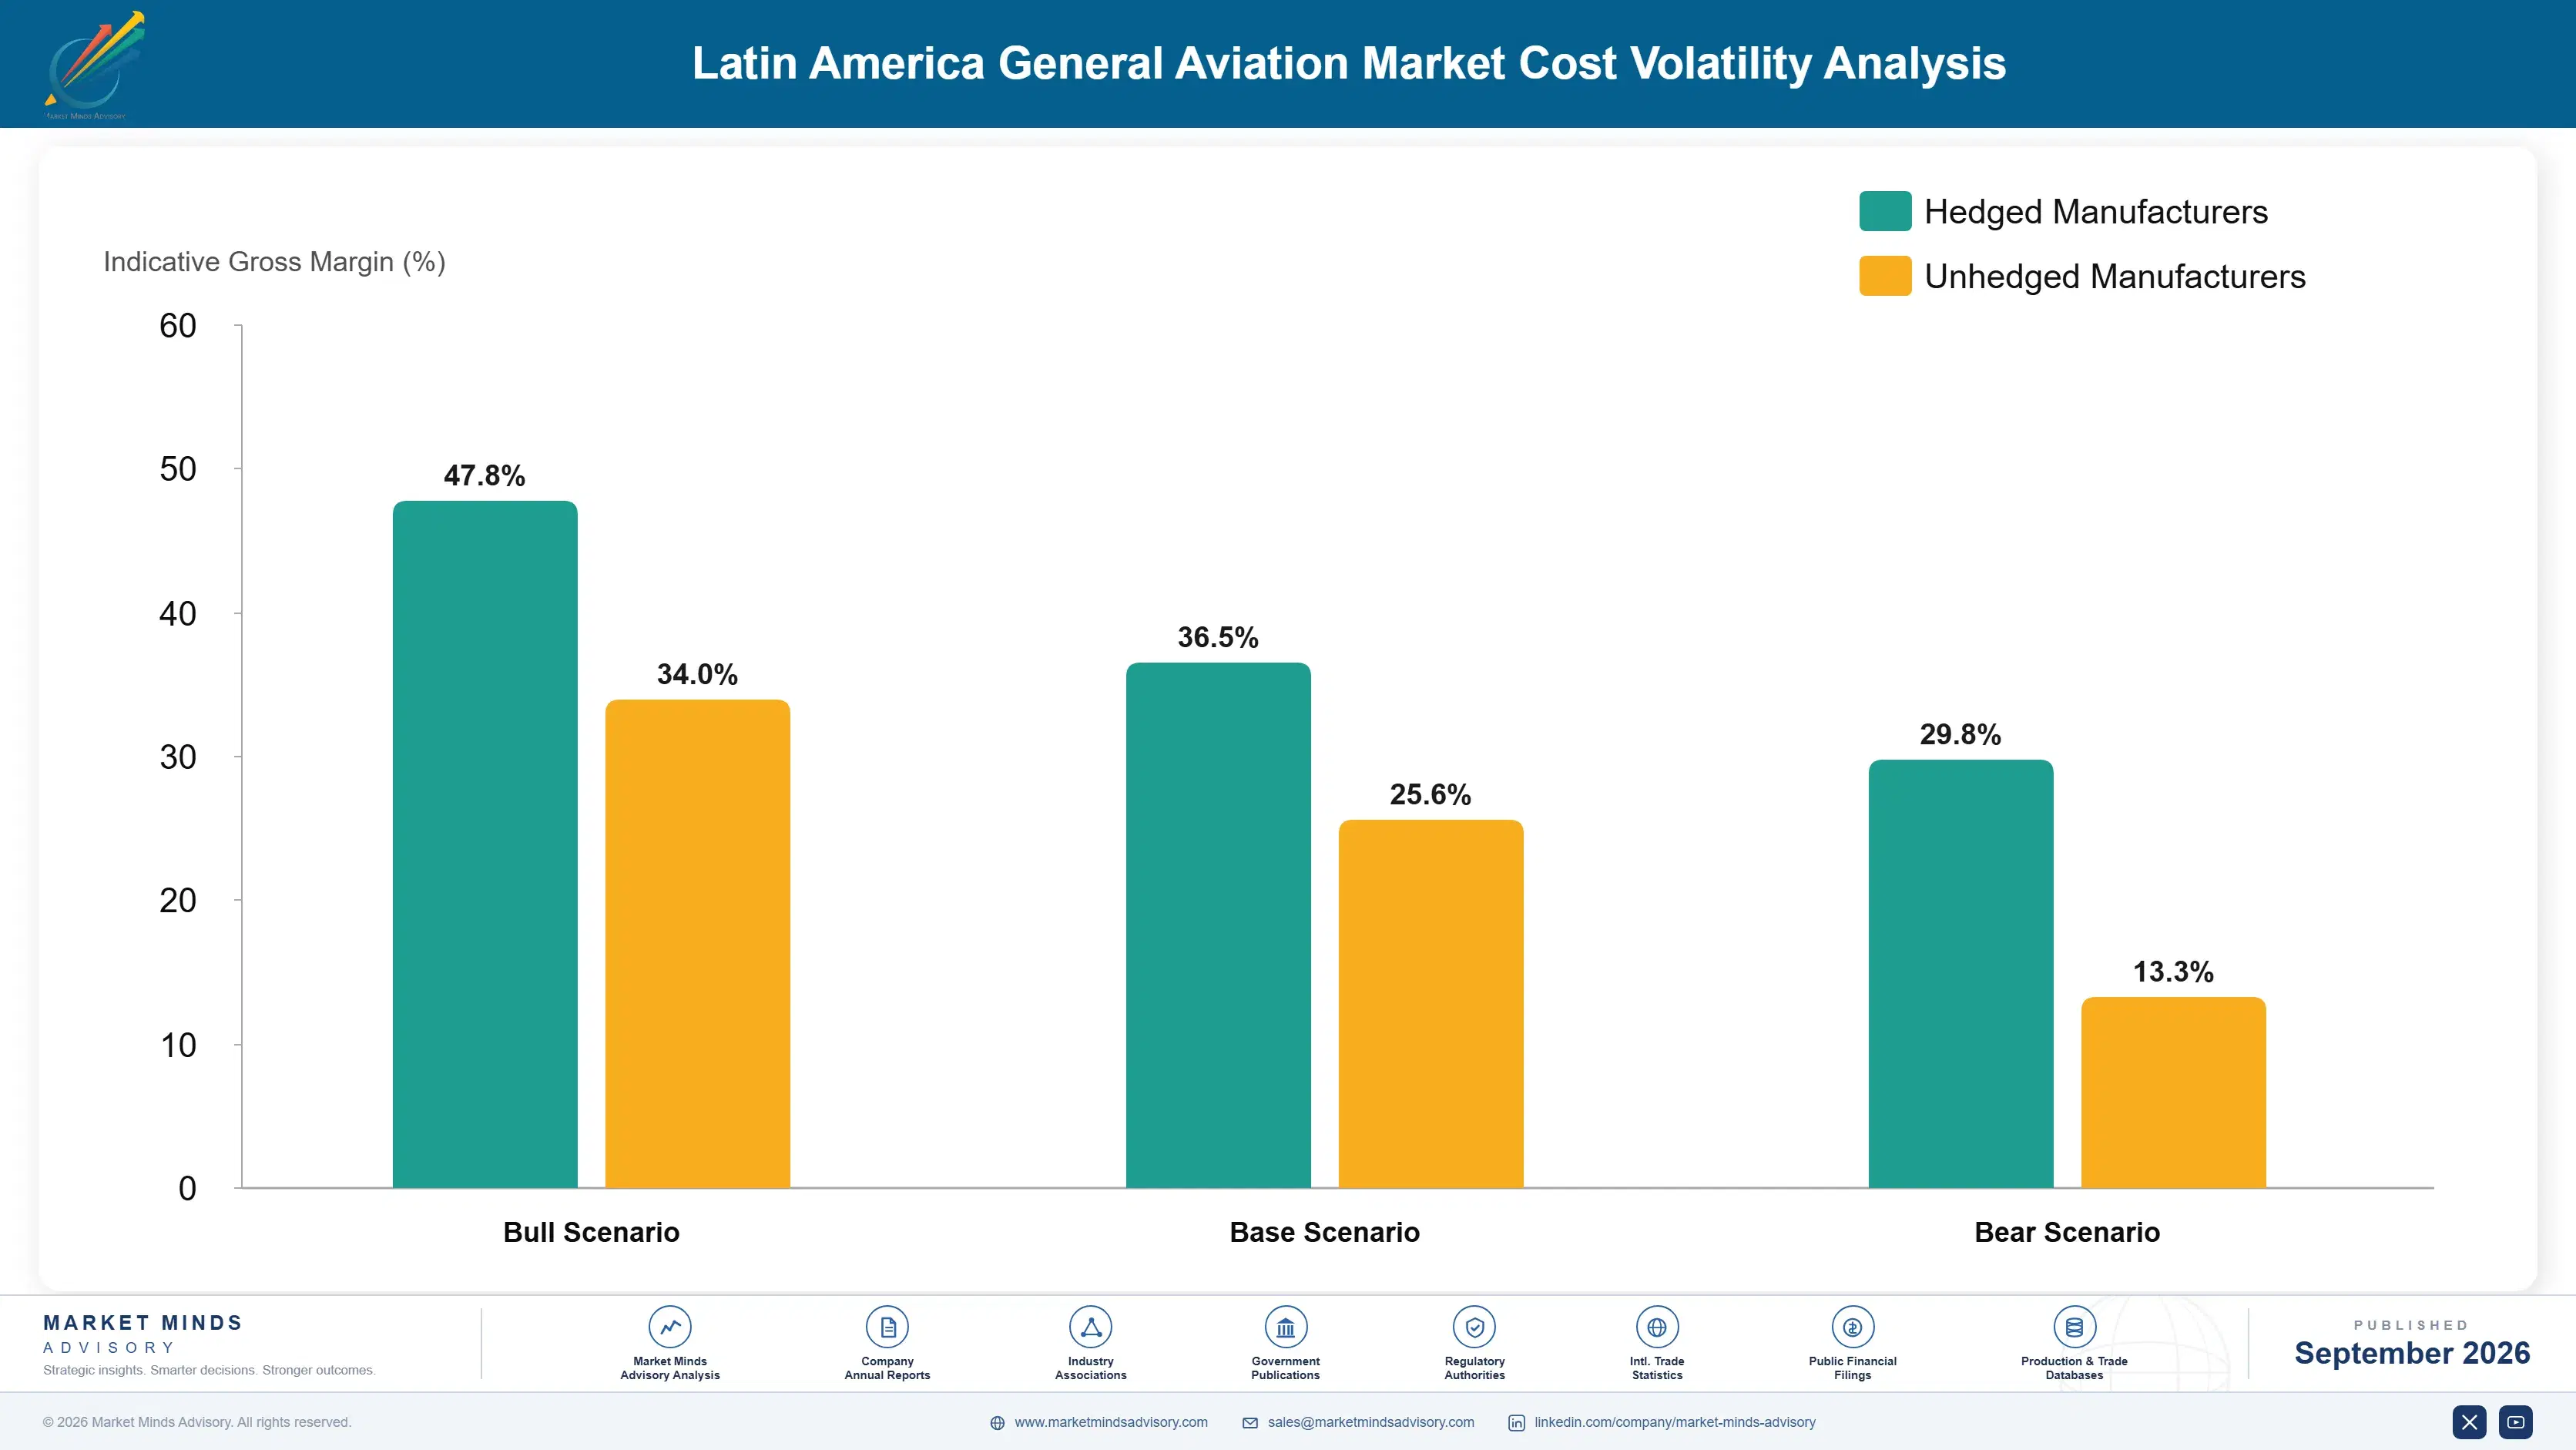
What Drives Regional Operating Cost

Four inputs dominate operating economics. Parts and components run roughly 31% of operating cost including duty and clearance, fuel about 27%, maintenance labour close to 21%, and insurance with financing the remaining 21%. Parts and fuel are priced in dollars while operator revenue arrives almost entirely in local currency, and duty plus clearance adds around 19% and 23 days to every imported component.
Currency was the decisive cost movement across the period. Several regional currencies depreciated substantially against the dollar between 2022 and 2025, with IMF exchange rate data showing the extent, while IATA data records regional fuel cost movements adding a second layer. Embraer and Textron both addressed regional demand and support conditions in annual reporting. Operators absorbed it by deferring maintenance and extending airframe life rather than raising rates.

Exposure separates by revenue currency rather than by operating skill. Operators earning dollars, including those serving mining, energy and international charter, absorb parts and fuel costs without difficulty. Those earning local currency on domestic utility missions carry the full mismatch, and they are precisely the operators serving communities with no alternative transport. That asymmetry explains why the region's oldest aircraft fly its most essential missions.
latin-america-general-aviation-market-cost-volatility-analysis-1790026398989

Pool spare parts regionally under bonded arrangements

Bonded regional inventory removes most of the clearance delay that grounds aircraft over inexpensive items, and pooling spreads holding cost across operators none of whom could justify it alone. Several regional operator groups have established such arrangements successfully. The obstacle is trust between competing operators rather than any customs difficulty, which is a coordination problem more than a regulatory one.

Target dollar-earning missions to match cost currency

Operators serving mining, energy, international charter and export sectors earn dollars and therefore carry no mismatch against dollar-priced parts and fuel. Weighting a fleet toward those missions is the most complete currency hedge available and needs no financial engineering. The limitation is that these missions concentrate in specific corridors, and the utility flying defining this region is not among them.

Extend maintenance intervals through approved reliability programmes

Approved reliability-based maintenance programmes let operators extend intervals on evidence rather than on calendar schedules, which reduces parts consumption and the clearance exposure that comes with it. Regulatory acceptance varies considerably across the region and the data burden is real. Operators with the fleet size to generate credible reliability evidence benefit most, which leaves smaller operators carrying the higher cost.

Portfolio Architecture for Margin Defence

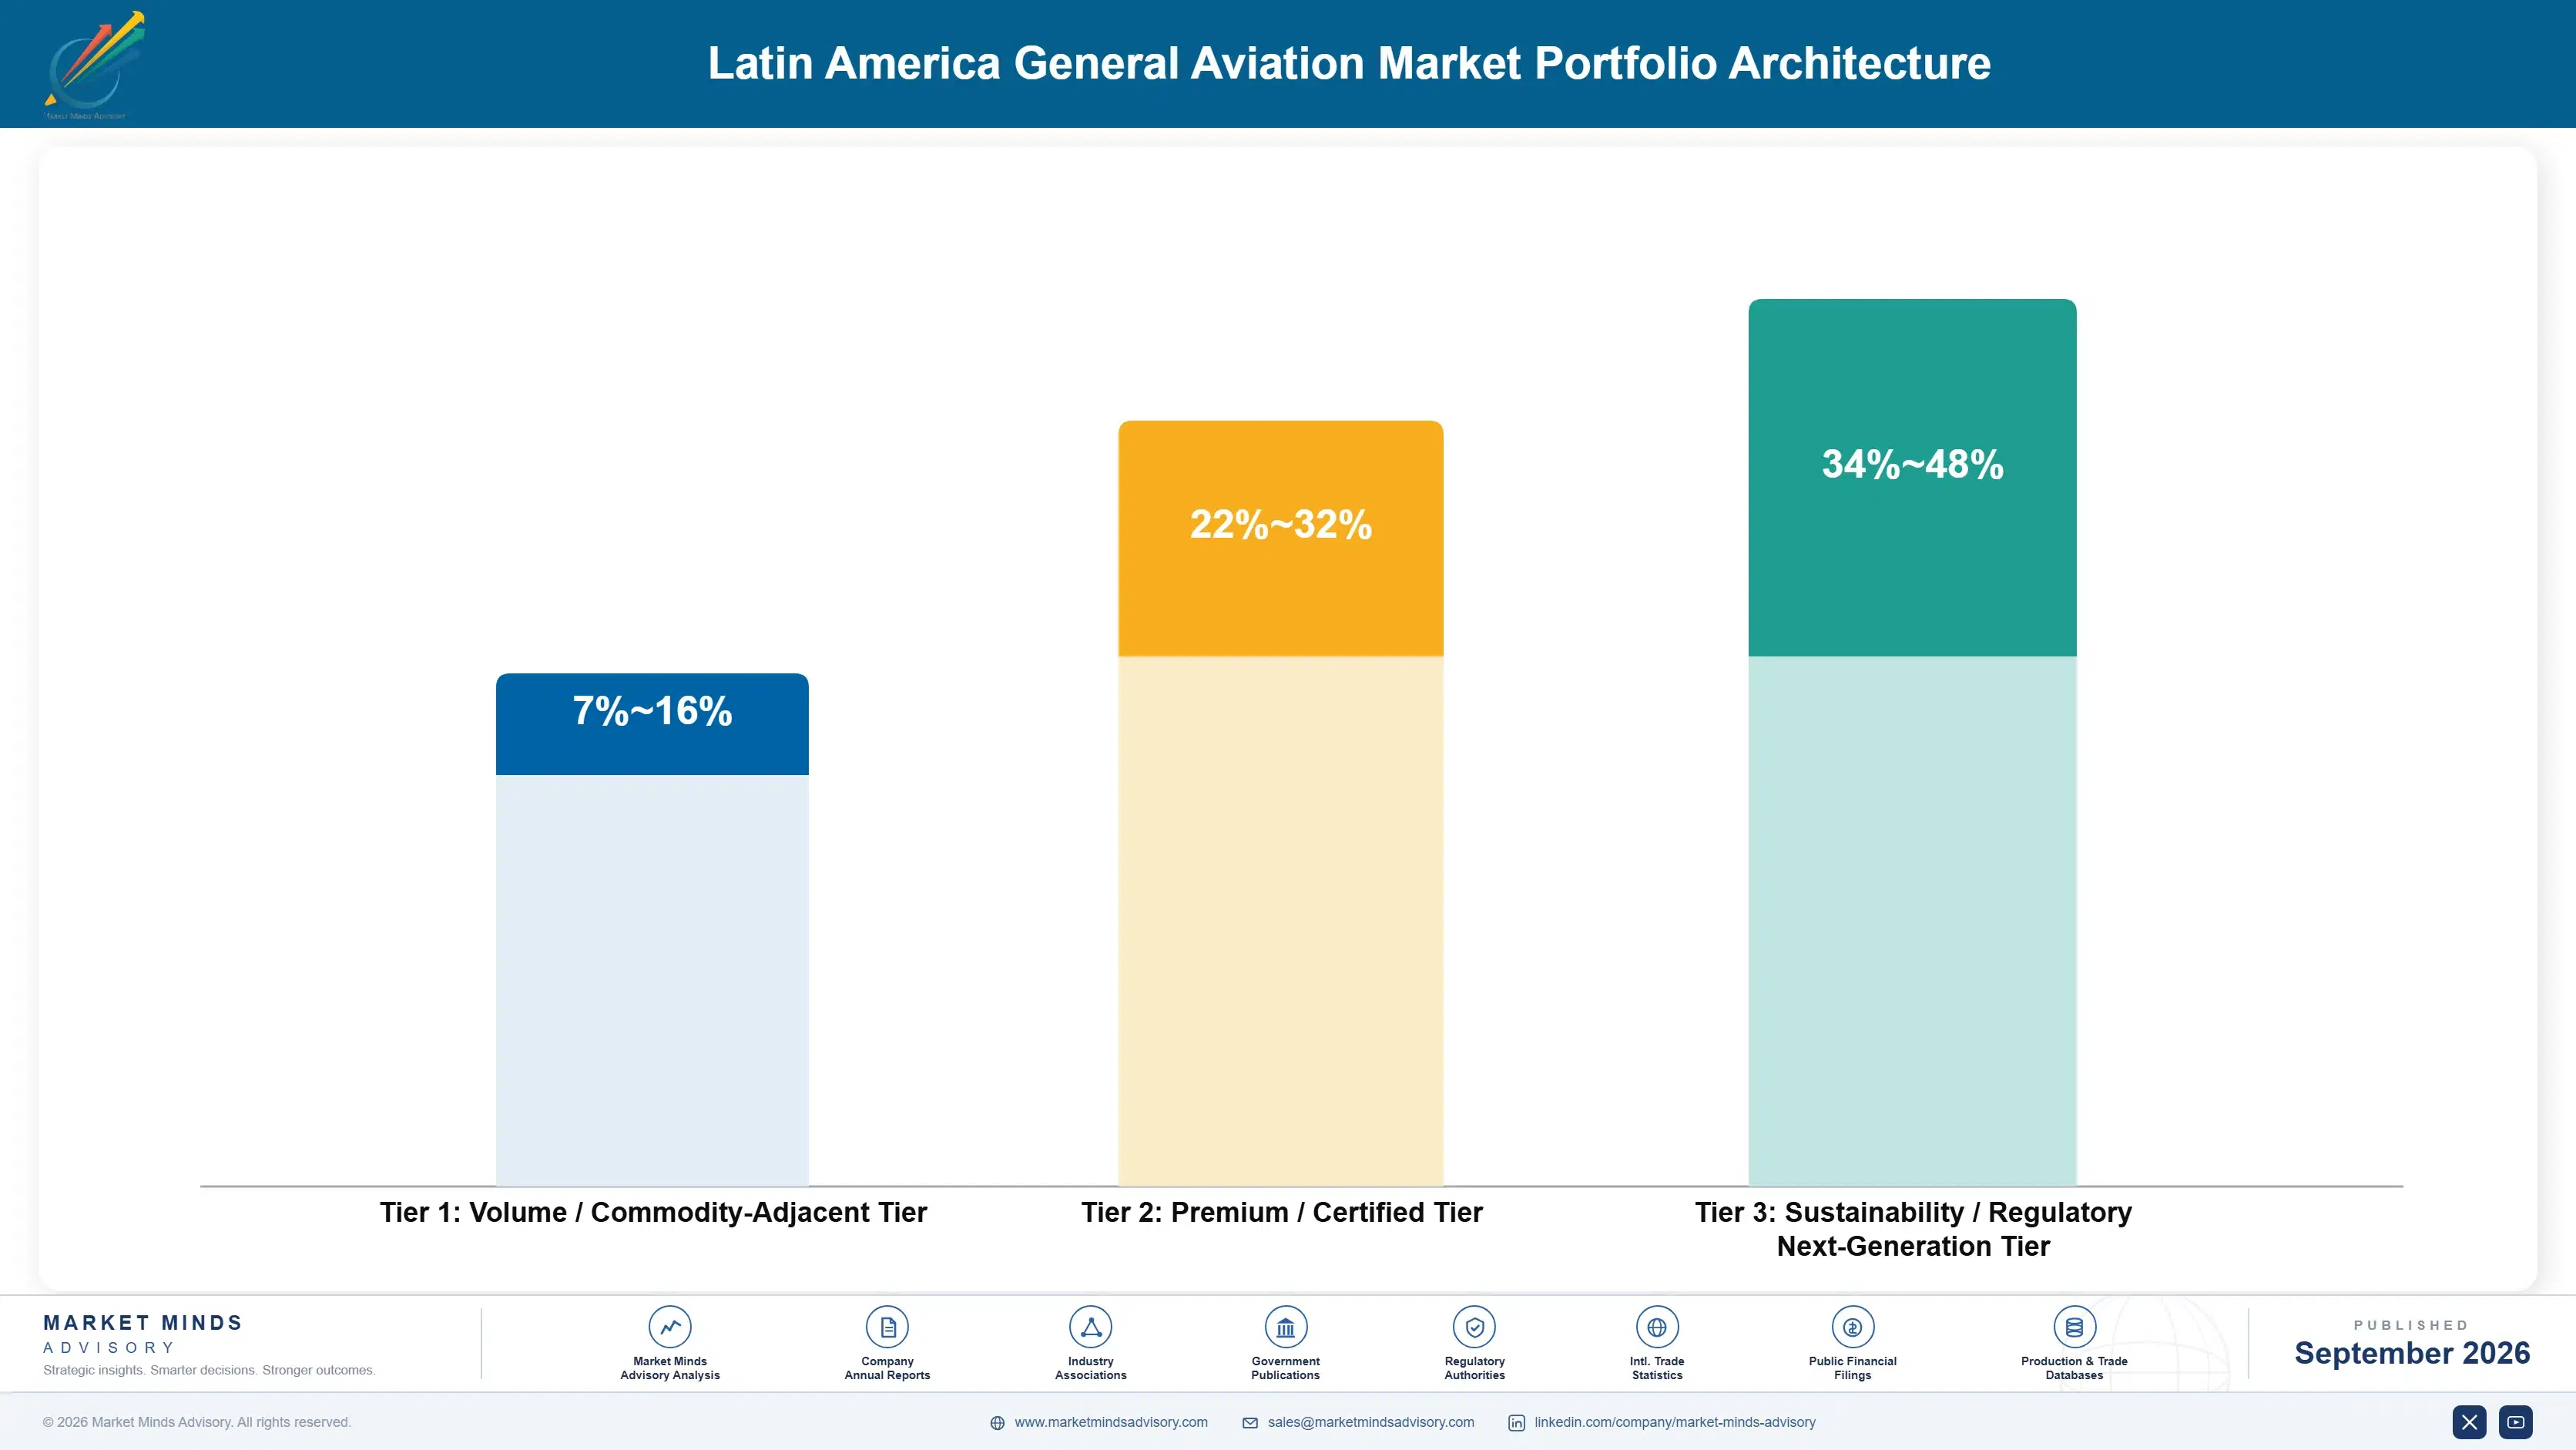
Margin architecture here favours everything that happens after delivery. New aircraft sales sit at the bottom, competed on price against pre-owned inventory and constrained by currency movement that reprices a decision overnight. Parts and maintenance sit in the middle at considerably better economics and account for roughly 62% of market value. Regional distribution, support network access and reliability programme services sit at the top, priced against grounded aircraft cost rather than against product comparisons.
The volume-versus-premium tension runs between new aircraft and the installed fleet. Volume means competing for deliveries in a market where pre-owned transactions outnumber new ones substantially and currency movement can remove a buyer overnight. Premium means serving a fleet averaging 26 years old that consumes parts and labour continuously and cannot easily stop. The second is larger, steadier and far less exposed to anything a finance ministry decides.

High-value pools concentrate in three places: regional parts inventory that converts clearance delay into competitive advantage, support network presence that decides operator preference before specification enters the conversation, and reliability programme services that reduce parts consumption for operators who can generate the evidence.

Volume / Commodity-Adjacent Tier

New aircraft deliveries competed against pre-owned inventory and exposed to currency movement that can remove a buyer between order and delivery. The nine point range reflects class and how much regional support content is bundled into the transaction.
Gross Margin: 7-16%

Premium / Certified Tier

Parts supply, scheduled maintenance and component overhaul across an installed fleet averaging 26 years old. Availability rather than price defends the margin here. The ten point range tracks whether inventory is held regionally or shipped in against each order.
Gross Margin: 22-32%

Sustainability / Regulatory / Next-Generation Tier

Regional distribution services, support network access agreements and approved reliability programme management. Priced against the cost of a grounded aircraft rather than against product alternatives. The fourteen point range spans a logistics business and a services business with different economics.
Gross Margin: 34-48%
latin-america-general-aviation-market-portfolio-architecture-1790026399494

High-value Sub-segments and Strategic Watch-out

Regional Parts Distribution

Best returns available because duty and clearance add roughly 19% and 23 days to anything shipped in, making regional inventory worth more than product improvement. Aftermarket revenue runs roughly 2.7 times higher with it in place. The twelve point range reflects bonded against conventional regional inventory arrangements.
Gross Margin: 36-48%

Utility Turboprop Support

Serving the aircraft that fly roughly 41% of regional hours on missions with no surface alternative, which makes demand close to inelastic. Operators cannot defer support on aircraft that whole communities depend on. The ten point range reflects support network proximity to the actual operating areas themselves.
Gross Margin: 28-38%

Business Jet Parts And Maintenance

The premium aftermarket core, growing with a fleet concentrated in Brazil and Mexico where corporate activity supports it best. Regional manufacturer presence lowers ownership friction considerably here. The ten point range reflects whether work is performed regionally or requires ferrying the aircraft abroad for it entirely.
Gross Margin: 24-34%

New Aircraft Deliveries

Thinnest margins in the market, competed against pre-owned inventory and repriced overnight by currency movement that has nothing to do with the buyer's business. Pre-owned transactions outnumber new deliveries substantially. The nine point range reflects aircraft class and how much regional support content is bundled.
Gross Margin: 7-16%

What Operators Fund Every Year

The annuity here is keeping old aircraft flying, and it is unusually dependable. A fleet averaging 26 years old consumes parts, labour and inspection continuously, and the missions many of these aircraft fly cannot be suspended when budgets tighten. Aftermarket accounts for roughly 62% of market value, and it accrues to whoever puts a component into an operator's hands quickly rather than to whoever sold the airframe decades ago.
Adoption depth varies enormously by operator type. Corporate flight departments in Brazil and Mexico fund complete support relationships including scheduled maintenance, parts programmes and avionics upgrades, because downtime carries a business cost they can quantify. Utility operators in the interior buy parts when an aircraft stops and cannibalise when they cannot, which is rational given cash constraints and produces a fleet nobody would design. Shared ownership programmes sit between the two, buying support professionally on behalf of members.

The buyer has shifted toward operators and away from individuals. Aircraft were historically bought by owner-pilots and companies for their own use. Fractional programmes, charter operators and utility fleets now account for a growing share, and they buy on cost per hour and parts availability rather than on what sold aircraft to individuals.
latin-america-general-aviation-market-end-use-penetration-index-1790026399988

Where Participants Should Concentrate

These are among the four positions where our research anticipates prominent divergence between winners and laggards over the coming forecast period. Each is grounded in the demand model, the regulatory perimeter, and the announced capacity pipeline.
01 / REGIONAL INVENTORY INVESTMENT

Hold the parts inside the region or lose the aftermarket

Duty and clearance add around 19% to component cost and about 23 days to delivery, which makes regional bonded inventory worth more to an operator than any product improvement a manufacturer can offer. Participants holding regional distribution report aftermarket revenue roughly 2.7 times that of those supplying from outside the region entirely. The working capital commitment is genuine and it is precisely why so few competitors have made it, which is exactly what leaves the position available to whoever finally does.
02 / SUPPORT NETWORK PRIORITY

Compete on service presence, not on aircraft specification

A grounded aircraft waiting weeks for a single part is the defining ownership problem across this region, so service network depth and local language support decide operator preference once any aircraft meets the mission at all. One manufacturer holds regional share roughly 17 points above its own global standing on precisely that single advantage. Specification comparisons appear in brochures and almost never in actual decisions, and building that presence costs real money well ahead of the revenue eventually justifying it.
03 / UTILITY CAPABILITY FOCUS

Build for the strip with no road, not the cabin brochure

Roughly 41% of regional flight hours are flown on missions with no surface alternative at all, and those operators buy on payload, unpaved field performance and maintainability rather than on anything a cabin describes. Demand there is close to inelastic because no substitute exists, and utility types held delivery volumes through periods when business aviation stopped entirely. That durability is unmatched by any other class in this entire market, and competition within the category itself is considerably thinner than elsewhere.
04 / OWNERSHIP MODEL ACCESS

Sell to the fleet operators, not to individual owners

Fractional and shared ownership programmes now reach around 14% of the regional fleet and have become genuinely significant fleet purchasers in their own right, which converts a customer base of many individuals with unpredictable financing into a handful of sophisticated buyers holding genuinely real balance sheets. Those operators also absorb the parts availability risk that otherwise deters individual ownership entirely. Manufacturers selling through those programmes report considerably better order predictability, larger transactions and materially lower cost of sale as well.

Engagement Snapshot From the Field

A live engagement with an industry participant carrying material or product regulatory and market exposure ahead of a defining policy shift, showing how our research translates into a defensible multi-year portfolio strategy.
MARKET MINDS ADVISORY · CLIENT ENGAGEMENT SUMMARY
Latin America General Aviation Producer Strategic Portfolio Review and Transition Roadmap 2026·Investment Scenario on Latin America General Aviation Exposure Evaluation 2025-26
CLIENT PROFILE
A North American general aviation manufacturer with roughly USD 720 million in annual revenue (client-reported, unverified by MMA) holding a substantial installed fleet across Latin America. Regional aftermarket revenue had declined for four consecutive years despite a stable fleet size, and management could not explain why parts sales were falling while the aircraft were demonstrably still flying.
STRATEGIC CHALLENGE
Management assumed operators were switching to unapproved parts and had escalated enforcement. The operational data showed something different: operators were cannibalising retired airframes and deferring work because approved parts took weeks to clear customs and cost substantially more once duty was applied. The board needed to decide whether regional inventory investment could recover revenue the enforcement approach clearly would not.
MMA APPROACH
MMA analysed parts demand against actual fleet utilisation by country, separating genuine demand decline from substitution and deferral, then modelled regional bonded inventory against continued supply from outside the region. Expert interviews with operators established what clearance delay and duty actually cost them in grounded aircraft days across a typical year.
KEY FINDINGS
  1. Fleet utilisation had not declined at all, which meant falling parts revenue reflected substitution and deferral rather than any reduction in the flying these aircraft were actually doing.
  2. Clearance delay averaged 23 days and duty added roughly 19%, which together made cannibalising a retired airframe cheaper and faster than ordering an approved component.
  3. Operators reported grounded aircraft days attributable to parts waiting that exceeded their entire scheduled maintenance downtime across a typical operating year by a wide margin.
  4. Regional bonded inventory at two locations modelled recovery of most lost revenue within three years, at a working capital cost the enforcement programme had already exceeded.
CLIENT PROFILE
A North American general aviation manufacturer with roughly USD 720 million in annual revenue (client-reported, unverified by MMA) holding a substantial installed fleet across Latin America. Regional aftermarket revenue had declined for four consecutive years despite a stable fleet size, and management could not explain why parts sales were falling while the aircraft were demonstrably still flying.
STRATEGIC CHALLENGE
Management assumed operators were switching to unapproved parts and had escalated enforcement. The operational data showed something different: operators were cannibalising retired airframes and deferring work because approved parts took weeks to clear customs and cost substantially more once duty was applied. The board needed to decide whether regional inventory investment could recover revenue the enforcement approach clearly would not.
MMA APPROACH
MMA analysed parts demand against actual fleet utilisation by country, separating genuine demand decline from substitution and deferral, then modelled regional bonded inventory against continued supply from outside the region. Expert interviews with operators established what clearance delay and duty actually cost them in grounded aircraft days across a typical year.
KEY FINDINGS
  1. Fleet utilisation had not declined at all, which meant falling parts revenue reflected substitution and deferral rather than any reduction in the flying these aircraft were actually doing.
  2. Clearance delay averaged 23 days and duty added roughly 19%, which together made cannibalising a retired airframe cheaper and faster than ordering an approved component.
  3. Operators reported grounded aircraft days attributable to parts waiting that exceeded their entire scheduled maintenance downtime across a typical operating year by a wide margin.
  4. Regional bonded inventory at two locations modelled recovery of most lost revenue within three years, at a working capital cost the enforcement programme had already exceeded.
RECOMMENDED STRATEGY
Phase 1: Phase 1 (five months): Halt the enforcement programme and establish bonded regional parts inventory at the two highest-demand locations identified. Phase 2: Phase 2 (14 months): Price regional stock to compete against cannibalisation rather than against list, and publish availability commitments to operators. Phase 3: Phase 3 (22 months): Build reliability programme support for larger operators so approved maintenance becomes cheaper than the alternatives they currently use.
OUTCOME
Regional parts revenue recovered to above its previous peak within sixteen months of the first bonded location opening (client-reported, unverified by MMA). Cannibalisation fell sharply once approved components were available within days, and the enforcement programme was closed without any measurable loss of control over parts provenance.

Frequently Asked Questions

Foundational context covering the market sizes, CAGR, scope, country, region and competition that inform every finding below. This section is provided to cover basics and most often pre-purchase conversations, answered from the MMA Primary Research Dataset.

What is the current size of the Latin America General Aviation Market?

The market was worth USD 4.2 billion in 2025 and reaches USD 4.5 billion in 2026. That covers new and pre-owned aircraft across all general aviation classes plus the parts and maintenance supporting the regional fleet.

How large will the Latin America General Aviation Market be by 2036?

MMA forecasts USD 8.2 billion by 2036, an increase of USD 3.7 billion over the 2026 base. That represents an expansion multiple of 1.82 times across the forecast period.

What is the CAGR for the Latin America General Aviation Market 2026 to 2036?

The base case CAGR is 6.2%, with a bull case of 7.4% if customs treatment of aviation parts improves. The bear case of 5.0% assumes duty and currency keep extending an already old fleet.

Which segment is growing fastest?

Single-engine utility turboprops grow at 9.3%, half again the market rate of 6.2%. They fly roughly 41% of regional hours on missions where no road or scheduled service exists at all.

Who are the major companies in the Latin America General Aviation Market?

Embraer, Textron Aviation, Cirrus Aircraft, Airbus Helicopters and Robinson Helicopter lead on regional fleet participation and delivered aircraft content. Bombardier, Pilatus and Daher follow in the next tier.

Which country is growing fastest?

Within this region-scoped report, Colombia leads at 8.6%, driven by regional connectivity requirements across terrain that surface transport cannot serve. Countries outside Latin America are assessed only as sources of aircraft supply.

Report Segmentation Architecture

The full report scope spans multiple orthogonal segmentation dimensions, with cross-tabulated demand data provided for each dimension pair. Coverage extends further to regional breakdowns, trend trajectories, and the competitive detail needed to support segment-level decision-making.

By Aircraft Class

  • Single-Engine Utility Turboprops
  • Light And Midsize Business Jets
  • Twin Turboprops
  • Piston Aircraft
  • Light And Intermediate Helicopters
  • Large-Cabin Business Jets

By End-Use Industry

  • Utility And Community Air Services
  • Corporate Flight Departments
  • Charter And Air Taxi Operators
  • Mining Energy And Agriculture
  • Flight Training Organisations

By Commercial Dimension

  • New Aircraft Delivery
  • Pre-Owned Aircraft Transaction
  • Fractional And Shared Ownership
  • Parts And Maintenance Supply

By Region

  • North America
  • Latin America
  • Western Europe
  • East Asia
  • South Asia and Pacific
  • Middle East and Africa
  • Eastern Europe

Scope, Methodology, and Coverage

Every figure in this report is reproducible from documented input assumptions. The scope below maps the historical period, the forecast horizon, the segmentation dimensions, and the countries covered, alongside the underlying primary and qualitative methodology.
Historical Period
2020 to 2025
Forecast Period
2026 to 2036
Base Year
2025 (USD billions; MMA Primary Research Dataset, September 2026)
Market Definition
This report covers general aviation aircraft operated across Latin America and the Caribbean together with the parts, maintenance and equipment content supporting them. Scope includes single-engine utility turboprops, light and midsize business jets, twin turboprops, piston aircraft, light and intermediate helicopters, and large-cabin business jets, covering new deliveries, pre-owned transactions and aftermarket support. Excluded are commercial airline and regional airliner aircraft, military and government aviation, unmanned aircraft, airport infrastructure, separately sold flight training services, and charter brokerage operations.
Quantitative Units
USD billions (current prices); aircraft deliveries and fleet counts; average fleet age; aftermarket revenue share
Segmentation Dimensions
By Aircraft Class; By End-Use Industry; By Commercial Dimension; By Region
Regions Covered
North America, Latin America, Western Europe, East Asia, South Asia and Pacific, Middle East and Africa, Eastern Europe
Countries Covered
Brazil, Mexico, Colombia, Argentina, Chile, Peru, Ecuador, Bolivia, Venezuela, Panama, Dominican Republic, Costa Rica, Guatemala, Paraguay, Uruguay, Jamaica, Trinidad and Tobago, with aircraft and content supply origin also assessed across the USA, Canada, France, Switzerland, Germany, Austria, Italy, Japan, China, India, Australia, Israel, South Africa, Czech Republic and Poland
Key Companies Profiled
Embraer, Textron Aviation, Cirrus Aircraft, Airbus Helicopters, Robinson Helicopter, Bombardier, Gulfstream Aerospace, Pilatus Aircraft, Daher, Piper Aircraft, Diamond Aircraft, Leonardo Helicopters, Bell, Sikorsky, Honda Aircraft Company, Pratt and Whitney Canada, Garmin, Collins Aerospace, Safran Helicopter Engines, Lycoming Engines
Quantitative Methodology
Primary survey, n=3,800 respondents, Q4 2025, six countries; demand-side model with trade association cross-validation
Qualitative Methodology
47 expert interviews, Q4 2025; applied to validate demand model assumptions, identify emerging dynamics, and assess competitive positioning
Report Format
PDF and XLSX data workbook (Word format preview document)
Publisher
Market Minds Advisory
Report Code
MMA-2026-CON-924
Published
September 2026
Contact
sales@marketmindsadvisory.com | www.marketmindsadvisory.com

Purchase the full Latin America General Aviation Market Report (2026 to 2036).

The full report sizes Latin American general aviation across six aircraft classes with fleet counts, deliveries and average ages behind every figure, and assesses where the aircraft serving regional operators are manufactured. It models utility aviation separately from discretionary flying throughout, because roughly two fifths of regional hours are flown where no surface alternative exists and that demand behaves nothing like business aviation. Competitive analysis covers 20 participants on fleet participation and delivered content, including regional parts distribution and service network presence by manufacturer. Duty and clearance costs are quantified per component as the binding constraint on aftermarket revenue. Brazil is analysed separately given how far it distorts regional averages.
Six-class sizing with fleet counts and ages
Utility aviation modelled separately from discretionary flying
Parts duty and clearance costs quantified per component
Regional service network presence mapped by manufacturer
Brazil analysed separately from regional averages
Shared ownership fleet purchasing assessed as distinct channel

Built For The People Who Decide

From boardroom strategy to bench-side execution, this report is read cover-to-cover by leaders shaping the next decade of their industry, turning demand scenarios, market dynamics and valuation benchmarks into decisions.
CXOs/ Presidents/ VPs/ Managers
M&A and Corporate Development
Strategy Teams and R&D Heads
Procurement and Product Directors
Regulatory and Compliance Leaders
Investor Relations and Equity Analysts