Market Minds Advisory
Laser Projection Market

Laser Projection Market: Laser Projection Market: Phosphor Light Sources Displace Lamps

Phosphor and RGB laser light sources are displacing lamp projectors across cinema, home theater and large venue applications as brightness, lifespan and total cost of ownership economics converge decisively in favor of laser designs.

Lead Analyst

Published

October 2026

Make Smarter Decisions with Customized Research Insights

Request a free sample report and evaluate market opportunities, growth trends, and competitive dynamics relevant to your business needs.

2025 MARKET VALUE$5.8BMarket Size 2025
2036 FORECAST VALUE$16.4BBase Case , 2026 to 2036
CAGR 2026 TO 20369.8 %Bull 11.0% / Bear 8.6%
INCREMENTAL OPPORTUNITY$9.9BNet 10- year value creation
EXPANSION MULTIPLE2.55x2036 value over 2026 base
Strategic Levers
M&A Pipeline
Regional Outlook
Country Rankings
Competitive Intelligence
Segmental Deep-dive
Call-Us : 91 93563 13602

Executive Snapshot and Market Trajectory.

Laser light sources have crossed the price-performance threshold that lamp projectors could never clear, and replacement cycles across cinema and corporate venues are accelerating as operators retire aging lamp fleets years ahead of their originally planned service life and capital budget cycle this particular budget cycle.
Home theater demand is the fastest-moving commercial force right now, pulled forward by compact ultra-short-throw laser units that fit living rooms lamp projectors never could serve effectively or affordably. East Asian manufacturers dominate unit output while cinema and large venue upgrade spending concentrates most heavily in North America and Western Europe, where digital cinema chains are mid-cycle on their second major equipment refresh since 2015, a cycle now entering its final phase.
Competition spans five major brands commanding under half of global revenue, with Chinese challengers climbing fast on price and compact form factor innovation across every product tier from entry level to premium. Brightness regulation in cinema exhibition and tightening energy efficiency rules for commercial displays are reshaping which light engine architecture wins new installations, favoring phosphor-converted designs over costlier pure RGB systems across most volume segments worldwide.
Market Definition
This report covers laser-illuminated projection systems across cinema, home theater, business, education, large venue and government applications, including phosphor-converted and RGB pure laser light engines. It excludes lamp-based and LED-illuminated projectors, standalone laser light show equipment and projection mapping software sold independently of hardware.
Base Year Value
$5.8B in 2025 (MMA Primary Research Dataset, October 2026)
Forecast Period
2026 to 2036, eleven discrete annual values
CAGR
9.8% base case. Bull 11.0%. Bear 8.6%.
Fastest Growth Segment
Home Theater and Residential Projectors: 13.7% CAGR
Fastest Growth Country
China: 11.3% CAGR
Fastest Growth Region
South Asia and Pacific: 11.8% CAGR
Largest Region
East Asia: 28% of 2025 global value
Market Leaders
Epson, Sony, BenQ, Hisense, Barco. Source: MMA Primary Research Dataset, July 2026.
Primary Survey
n=3,800 procurement and R&D decision-makers, Q4 2025, six countries
Methodology
Demand-side build-up, cross-validated against public data, 47 expert interviews

Laser Projection Market Forecast Scenarios

laser-projection-market-size-forecast-scenario-1790911655041
Between 2020 and 2025 the laser projection market grew at an 8.8 percent annual rate, propelled by early cinema digital light processing conversions and a first wave of premium home theater adoption among enthusiast buyers willing to pay a substantial laser premium over comparable lamp units. Supply disruption slowed component availability briefly in early 2021.
The base case assumes 9.8 percent annual growth through 2036, built on three mechanisms: continued lamp-to-laser cinema conversion as exhibitors replace aging fleets ahead of schedule, falling laser module costs that pull mainstream home theater buyers down from the enthusiast tier into volume price points, and rising corporate and education budgets for ultra-short-throw classroom and boardroom units replacing older flat panel and lamp-based displays across most developed markets. Government and simulation budgets add a smaller but steady fourth tailwind.
A bull case near 11.0 percent hinges on faster-than-expected laser module cost declines pulling forward mass-market home theater adoption well ahead of current projections. The bear risk, closer to 8.6 percent, is a slower cinema refresh cycle if exhibitor capital spending tightens amid uneven box office recovery across major markets and delayed replacement decisions. Neither scenario assumes a collapse in laser module pricing.

Phosphor Light Engines Rewrite Projector Economics

Laser light engines now ship in a majority of new projectors above entry price points, a reversal from just five years ago when lamp units still dominated every segment above the cheapest classroom models. Phosphor-converted designs lead on cost while pure RGB laser systems hold the premium cinema and large venue tiers where color accuracy commands a real price premium over phosphor alternatives.
MARKET CONCENTRATIONCR5 48%Top five brands together hold this combined output share
AVERAGE SELLING PRICE$1,850Blended figure across cinema, home and business units
TOP PRODUCING COUNTRYChina 34%Share of global unit output from domestic factories
CAPACITY UTILIZATION76%Average rate across major assembly facilities this year
TRADE INTENSITY61%Share of units crossing a border before final sale
LIGHT ENGINE COST SHARE38%Portion of unit bill of materials from laser modules
Manufacturing remains concentrated in China, Japan and South Korea, where component supply chains for laser diodes and phosphor wheels cluster around a handful of specialized suppliers serving the entire industry. Brand assembly happens closer to these component hubs than final demand, keeping freight costs embedded in unit economics for distant markets, particularly for bulkier cinema and large venue units. Freight costs matter less for lightweight home units shipped by air.
Replacement economics now favor laser units outright. A typical laser light source lasts twenty thousand hours against roughly three thousand for a comparable lamp, and total cost of ownership over a five-year horizon already undercuts lamp projectors in most commercial deployment scenarios once bulb replacement costs are counted honestly against the higher upfront laser price tag buyers still notice.
"Lamp replacement revenue is disappearing faster than most manufacturers budgeted for, and that hole in the aftermarket is bigger than the hardware upside for several legacy brands."
Senior Analyst, Display Technology Practice · MMA Technology Practice · October 2026

Market Trends

Phosphor Laser Modules Undercut Pure RGB Pricing

Phosphor-converted laser light engines have fallen to roughly 40 percent below pure RGB laser costs while closing most of the color gamut gap that once justified the premium, pulling volume buyers away from lamp projectors faster than manufacturers forecast two years ago. Component suppliers in China and South Korea have scaled phosphor wheel production meaningfully, driving the cost curve down roughly 12 percent annually since 2023. Mainstream home theater and classroom segments are the primary beneficiaries, with enthusiast buyers increasingly trading up to pure RGB units instead for the color performance phosphor designs still cannot fully match.
Market Impact: Grew 22 percent in 2025

Digital Cinema Exhibitors Accelerate Laser Conversion Cycles

Major cinema chains across North America and Western Europe are replacing first-generation digital projectors with laser units years ahead of their planned fifteen-year service life, driven by lower operating costs and new high dynamic range content formats that lamp units cannot display adequately. Roughly 28 percent of global cinema screens had converted to laser illumination by the end of 2025, up from under 10 percent five years earlier, and exhibitors report payback periods under four years on operating cost savings alone across typical multiplex deployments. Second-generation screens are now entering the conversion queue as laser shifts from choice to default.
Market Impact: Saves 15 percent on upkeep

Market Opportunities and Growth Drivers

Ultra-Short-Throw Designs Expand Home Theater Addressable Market

Ultra-short-throw laser projectors that sit inches from the wall and avoid ceiling mounting entirely have opened home theater demand among renters and smaller households who could never accommodate a traditional installation. Unit shipments in this category grew roughly 22 percent in 2025 alone, outpacing every other home theater format by a wide margin and pulling buyers directly from large-screen television upgrade budgets instead. Manufacturers now treat this format as the primary growth engine for consumer laser projection over the next several years, ahead of every other residential category combined. This growth is not expected to slow meaningfully through 2028.
Market Impact: 20-week lead times recorded

Classroom and Boardroom Refresh Cycles Favor Laser Durability

Education and corporate buyers increasingly specify laser light sources for new classroom and boardroom installations given twenty-thousand-hour lifespans that eliminate scheduled bulb replacement entirely across typical five-to-seven-year deployment windows. Procurement teams report maintenance budget savings of roughly 15 percent over comparable lamp fleets once replacement labor and downtime are counted, a figure that has pushed several large school district and enterprise tenders toward laser-only specifications starting in 2025 procurement cycles. Adoption is spreading fastest in districts and firms that manage large multi-building projector fleets centrally, where the maintenance savings scale directly with unit count.
Market Impact: 30-50 percent price premium

Market Restraints and Challenges

Laser Diode Supply Chain Concentration Limits Expansion

Blue laser diodes used in most projector light engines come from a small number of specialized semiconductor fabricators concentrated in Japan and China, and that concentration caps how quickly manufacturers can scale output when demand accelerates. The root cause is the specialized epitaxial growth process these diodes require, which takes years to qualify at a new facility. Lead times stretched to roughly twenty weeks during 2024 demand spikes, delaying several large cinema and corporate tender deliveries. Several brands are now qualifying secondary diode suppliers to reduce this single-source exposure going forward.
Market Impact: Cuts module cost 40 percent

Upfront Price Premium Still Deters Budget-Constrained Buyers

Laser projectors still carry a 30 to 50 percent upfront price premium over comparable lamp units, and that gap remains the single biggest objection procurement teams raise despite favorable total cost of ownership math over a five-year horizon. The root cause is laser diode and phosphor wheel component cost, which has not fallen as fast as unit volume has grown. Budget-constrained education and small business buyers often choose cheaper lamp units regardless, deferring the laser transition. Manufacturers are responding with financing programs and leasing options that spread the premium over the unit's service life instead of charging it upfront.
Market Impact: 28 percent of screens converted
3 additional market trends, 2 additional growth drivers, and 4 additional restraints and challenges are covered in the full report. Contact sales@marketmindsadvisory.com to access the complete intelligence.

Segment CAGR and Growth Architecture

The market splits into six application segments defined by end-use venue and buyer type. Home theater and large venue applications lead near-term growth while cinema and business segments anchor the installed base that manufacturers depend on for steady replacement revenue across multi-year equipment cycles worldwide. Government, retail and signage applications round out the remaining four segments by scale.
laser-projection-market-market-share-analysis-1790911655214

Home Theater and Residential Projectors

Compact ultra-short-throw laser units have pulled home theater projection into a genuinely mainstream consumer category for the first time, competing directly against large-screen televisions on price and picture size rather than serving only enthusiast buyers as in prior generations. Unit shipments grew sharply through 2025 as phosphor laser module costs fell, and major brands including Hisense, XGIMI and Samsung have launched dedicated residential laser television lines built around this light engine architecture. Renters and smaller households without ceiling mount options drive much of the incremental demand, since ultra-short-throw designs sit on a credenza inches from the wall. Manufacturers expect this segment to keep outpacing the broader market through the forecast window as pricing continues falling toward mainstream television price points.
CAGR 13.7%

Large Venue and Live Events Projectors

Live event production, concert touring and immersive art installation work increasingly specify high-brightness laser projectors capable of running continuously across multi-day events without the brightness degradation lamp units suffer partway through a show. Rental and staging companies have replaced significant portions of their lamp inventory with laser units over the past three years, citing lower operating costs across intensive usage schedules that would exhaust a lamp's service life in weeks rather than months. Barco and Christie Digital lead this segment given their long-standing relationships with staging and rental houses worldwide. Demand growth here tracks the broader recovery in live events spending alongside genuine laser-specific adoption momentum. Smaller independent production houses are following more slowly given the capital it requires.
CAGR 11.8%
Full segment breakdown across 7 segments available in the complete report.

Regional Architecture and Country Demand Map

Regional demand follows manufacturing presence and consumption patterns together rather than either alone. East Asia leads on component and assembly scale while North America and Western Europe anchor cinema and premium home theater spending that keeps pace close behind across the forecast period. Middle East investment adds a share.

North America

Cinema chains across the United States and Canada are mid-cycle on their second major digital projector refresh, replacing first-generation lamp-based systems installed during the 2010s digital conversion with laser units offering lower operating costs and support for high dynamic range content formats. Corporate and education budgets add a second steady demand stream, particularly for ultra-short-throw units replacing flat panel displays in boardrooms and classrooms across both large enterprises and public school districts. Home theater enthusiast spending remains concentrated among higher-income households willing to pay a premium for laser picture quality, though mainstream adoption is accelerating as prices fall toward television price points region-wide, pulling in buyers who previously considered only flat panel upgrades.
Share: 27% | CAGR: 9.5% (2026 to 2036)

Western Europe

Germany, the United Kingdom and France anchor cinema exhibitor spending, where laser conversion has proceeded somewhat more slowly than North America given tighter capital budgets across independent and mid-size theater chains following uneven box office recovery since the pandemic disruption years. Corporate and government procurement favor laser units for sustainability reporting reasons, since lower power draw and the absence of mercury-containing lamps support environmental compliance goals several governments now track formally under national emissions reduction programs. Home theater demand trails North America somewhat, reflecting smaller average living spaces that favor compact ultra-short-throw formats over larger traditional installations across most urban housing markets today. Scandinavian markets add a smaller but notable premium cinema contribution given high per-capita entertainment spending.
Share: 20% | CAGR: 8.3% (2026 to 2036)
Regional intelligence for 5 additional markets available in the complete report: East Asia, South Asia and Pacific, Latin America, Middle East and Africa, Eastern Europe. Contact sales@marketmindsadvisory.com.
laser-projection-market-country-cagr-analysis-1790911655393

Capturing Value as Laser Displaces Lamp Fleets

Three commercial moves let suppliers capture more of the lamp-to-laser transition than hardware sales alone would deliver. Each targets a different point in the purchase process, from financing the upfront premium to locking cinema exhibitors into multi-year service relationships. Suppliers that execute on all three simultaneously tend to outgrow peers still selling hardware as a one-time transaction.

Financing Programs That Spread the Laser Premium

Offering lease and financing structures that spread the 30 to 50 percent laser price premium over a projector's service life removes the single biggest objection budget-constrained education and small business buyers raise during procurement. Several manufacturers have launched dedicated financing arms or partnered with equipment leasing firms specifically to capture this segment rather than cede it to cheaper lamp alternatives. Early adopters report conversion rate gains of roughly 18 percent among previously price-sensitive buyers who would otherwise have chosen lamp units. Dealers report the financing conversation now happens earlier, before price objections can derail the deal.
Market Impact: Lifts conversion rates by roughly 18 percentage points

Multi-Year Cinema Maintenance and Calibration Contracts

Bundling multi-year maintenance, color calibration and software update service into cinema equipment sales creates recurring revenue that survives well beyond the initial hardware transaction and deepens exhibitor switching costs substantially. Exhibitors value predictable maintenance budgets over ad hoc service calls, particularly across multiplex chains managing dozens of screens simultaneously across multiple sites. Suppliers offering these contracts report renewal rates above 85 percent, turning a one-time hardware sale into a dependable multi-year revenue stream worth pursuing aggressively. Several suppliers are now pitching these contracts proactively at the point of initial sale rather than waiting for renewal conversations.
Market Impact: Achieves contract renewal rates above 85 percent now

Bundled Content and Calibration Software Subscriptions

Pairing projector hardware with subscription access to content optimization and automatic calibration software creates a second revenue stream that scales with install base rather than unit sales alone, particularly valuable as hardware margins compress with rising competition. Home theater and corporate buyers increasingly expect this kind of software layer given its prevalence in adjacent consumer electronics categories already. Early software bundle adopters report attach rates near 32 percent among premium tier buyers specifically, a meaningfully profitable addition to hardware-only economics. Manufacturers expect attach rates to climb further as software feature depth continues expanding across newer product generations.
Market Impact: Reaches a 32 percent software attach rate today

Who Controls the Margin Pool

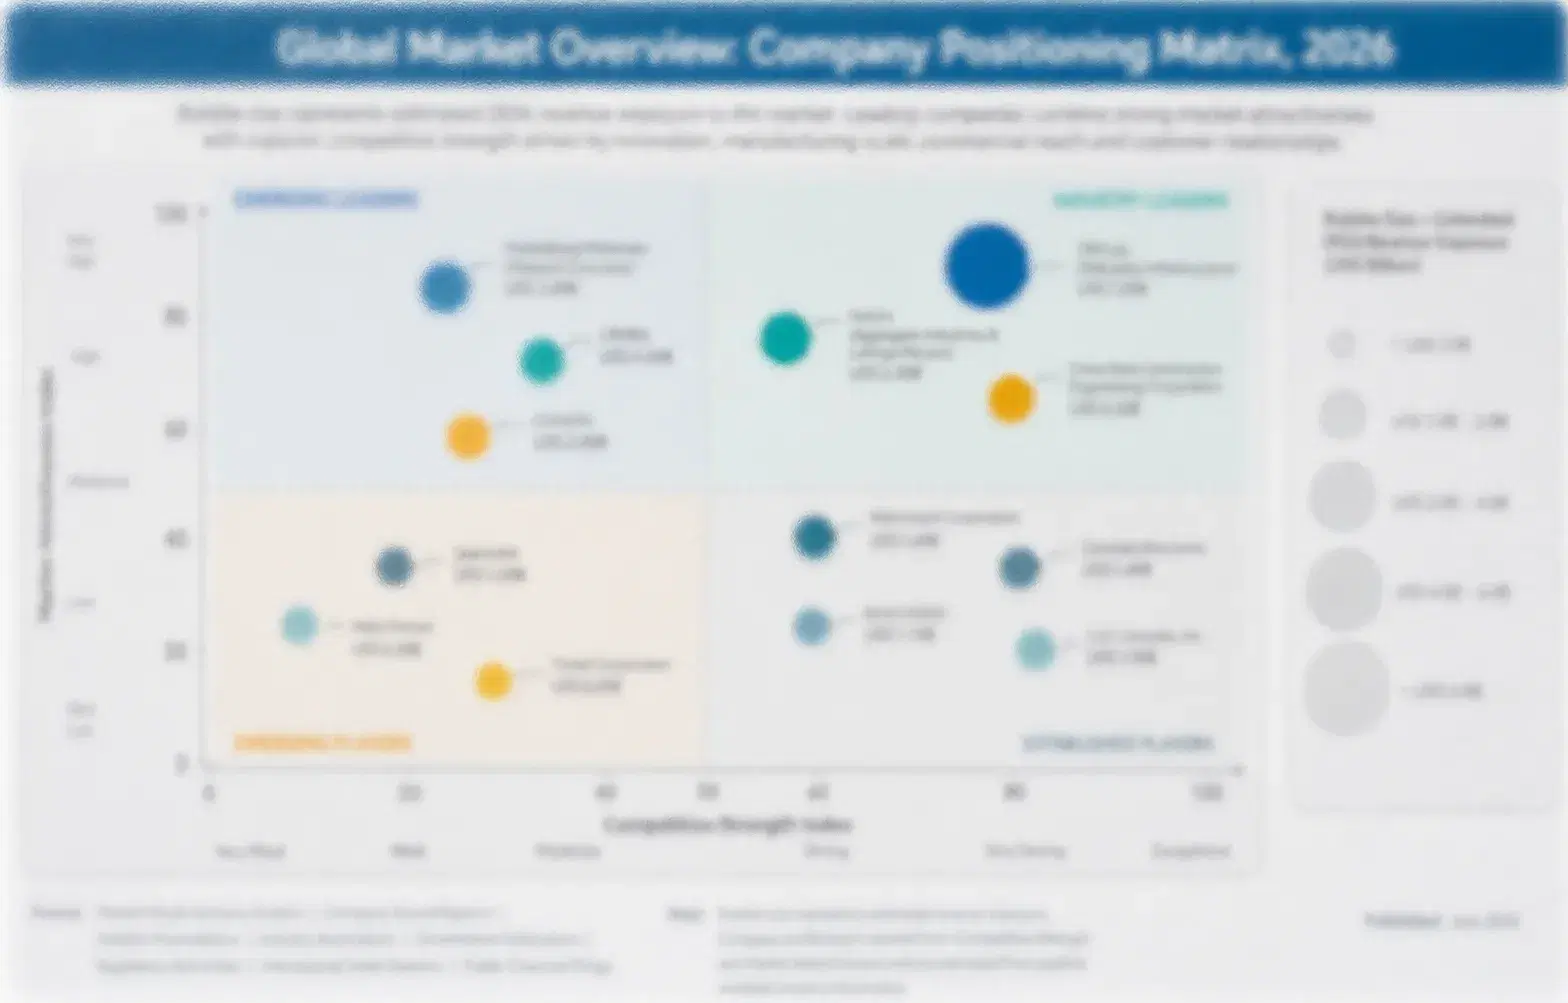
Five brands hold roughly 48 percent of global revenue, a moderate concentration that leaves meaningful room for Chinese challengers climbing fast on price and compact design. The gap between the leader and the next two challengers is narrow, unlike more consolidated display categories, and no single brand commands commanding share across every application segment simultaneously. Market share shifts gradually year over year as new product cycles land.
Competitive activity currently centers on three dimensions: financing programs that spread the laser price premium, multi-year cinema maintenance contracts that lock in exhibitor relationships, and bundled calibration software subscriptions that monetize the installed base beyond hardware alone. Manufacturers are also racing to qualify secondary laser diode suppliers to reduce single-source exposure, and several have launched financing arms this cycle.

Emerging pressure is coming from Chinese home theater brands expanding beyond their domestic base into export markets previously dominated by Japanese and American names. Rankings in the consumer segment specifically could shift meaningfully over the next three to five years if these challengers continue closing the brand trust gap that has so far protected incumbent pricing power. Established brands are sharpening entry-tier pricing in response.
laser-projection-market-company-positioning-matrix-1790911655572

Competitive Moat and Risk Dimensions

EPSON

Moat: Three-Chip LCD Engineering Depth

Epson's decades of three-chip LCD projection engineering give it color accuracy credentials that laser competitors still struggle to match on a comparable price basis. This reputation lets it command premium pricing in business and education tenders where color fidelity is explicitly specified, reinforcing its position as the default choice for demanding corporate buyers.
EPSON

Risk: Limited Home Theater Brand Pull

Epson's brand recognition in the fast-growing consumer home theater segment trails specialized entrants like Hisense and XGIMI, who market directly to younger buyers through different channels entirely. As this segment keeps outpacing the broader market, this gap could widen the revenue difference versus better-positioned consumer-focused competitors.
HISENSE

Moat: Vertically Integrated Manufacturing Scale

Hisense's vertically integrated manufacturing across display panels, laser modules and finished units gives it cost advantages that brands sourcing components externally cannot easily replicate. This lets it undercut international competitors meaningfully on price while maintaining respectable margins, winning share rapidly in both domestic Chinese and export markets simultaneously.
HISENSE

Risk: Thin Commercial Venue Presence

Hisense's presence in cinema and large venue projection remains thin compared to established specialists like Barco and Christie, limiting its exposure to the premium commercial tiers. As commercial segments continue carrying higher margins than consumer units, this gap could cap overall profitability relative to diversified competitors.

Players Tracked

Prominent Players

Epson
Sony
BenQ
Hisense
Barco

Other Key Players

Optoma Corporation
LG Electronics
Panasonic Corporation
Christie Digital Systems
NEC Display Solutions
ViewSonic Corporation
Vivitek Corporation
XGIMI Technology
JMGO Technology
Digital Projection International
Canon Inc
Acer Inc
InFocus Corporation
Ricoh Company
Formovie Technology

Recent Developments

JANUARY 2026

Epson Launches New Business-Tier Laser Series

Epson launched a new laser projector series targeting mid-tier business and education buyers, its most aggressively priced laser line to date aimed squarely at budget-constrained institutional tenders. The launch includes a bundled three-year calibration software subscription included at no additional cost, with strong early distributor interest reported.
Signal: Signals Epson's push to defend institutional share against rising price competition from Chinese entrants in this tier
AUGUST 2025

Hisense Expands Laser Television Production Capacity

Hisense announced an organic capacity expansion at its domestic Chinese manufacturing facility to add laser television production lines, targeting rising export demand from North American and European retailers simultaneously. The expansion reaches full planned output within twelve months of construction start, ahead of the original schedule.
Signal: Signals anticipated growth in international laser television demand across multiple export markets simultaneously this decade going forward
APRIL 2026

Barco and European Cinema Chain Sign Service Agreement

Barco signed a multi-year maintenance and calibration service agreement with a major European cinema chain covering its entire laser projector fleet across several hundred screens. The agreement does not constitute an acquisition or joint venture, and Barco expects it to extend to additional chains within the next fiscal year.
Signal: Signals growing supplier emphasis on recurring service revenue rather than one-time hardware sales across cinema accounts

Laser Diode and Phosphor Wheel Cost Exposure

Laser diodes and phosphor wheel assemblies together represent roughly 38 percent of a projector's bill of materials, sourced primarily from specialized Japanese and Chinese semiconductor fabricators that supply the entire industry. This concentration leaves manufacturers exposed whenever diode supply tightens or a major fabricator faces disruption. Phosphor wheel suppliers are even more concentrated, with only a handful of qualified vendors globally.
Laser diode lead times stretched to roughly twenty weeks during 2024 demand spikes, an episode several manufacturers referenced in annual report commentary on component availability risk. Several brands delayed major cinema and corporate tender deliveries by one to two quarters as a direct result, compressing margins on contracts with fixed delivery penalty clauses already in place. The episode pushed several manufacturers to begin diversification efforts that are still underway today.

Smaller regional brands carry proportionally higher cost exposure than Epson, Sony and other vertically integrated leaders who negotiate volume discounts directly with fabricators. This gap widens further for brands without direct relationships to Japanese or Chinese diode suppliers, who pay additional markup through intermediary distributors that erode their already thinner margins substantially. This dynamic rewards scale in a market where volume discounts compound meaningfully over time.
laser-projection-market-cost-volatility-analysis-1790911655758

Secondary Laser Diode Supplier Qualification

Leading brands are qualifying secondary laser diode fabricators beyond their traditional primary suppliers to reduce single-source dependency across the product line. Qualification cycles run twelve to eighteen months but meaningfully reduce exposure to any single fabricator's capacity constraints or allocation decisions during demand spikes going forward. Several brands have already added a second qualified source for their highest-volume product lines.

Multi-Year Component Supply Agreements

Manufacturers are locking in multi-year pricing agreements with phosphor wheel and diode suppliers, trading some flexibility for budget certainty across large institutional and cinema orders spanning several fiscal years. This approach shields project economics from the kind of spot price volatility seen during 2024's lead time spike. Suppliers that resist multi-year terms are increasingly losing bids to more flexible competitors.

Portfolio Architecture for Margin Defence

The market splits into three tiers with distinct margin economics. Volume and commodity-adjacent projectors serving standard classroom and small business applications carry gross margins of 20 to 26 percent, reflecting intense price competition from Chinese brands undercutting on entry-tier pricing. Premium and certified units for cinema and large venue applications command 30 to 38 percent margins on specialized engineering. Mid-tier brands sit uncomfortably between these two poles, squeezed from both directions.
Sustainability, regulatory, and next-generation units, meaning ultra-short-throw home theater and software-bundled commercial models, reach 34 to 44 percent margins, reflecting brand premium and recurring software revenue layered on top of hardware sales. The volume versus premium tension is real: budget buyers push for the cheapest laser option available while premium buyers pay for calibration and support. Brands that serve both camps well tend to maintain separate product and go-to-market teams.

High-value pools concentrate most heavily in home theater and cinema maintenance contracts, where brand trust and recurring service revenue sustain pricing power that standard classroom projectors no longer offer manufacturers competing on cost alone. Brands positioned early in software bundling capture disproportionate share of this margin pool. This pool expands faster than any other tier across the forecast.

Volume / Commodity-Adjacent

Entry-tier classroom and small business projectors competing primarily on unit price against both lamp holdouts and aggressive Chinese laser entrants undercutting on cost across every major export market. Margins remain thin as a result, rewarding scale and manufacturing efficiency above all else.
Gross Margin: 20-26%

Premium / Certified

Cinema and large venue units carrying brightness and color accuracy certification that exhibitors and staging companies specify explicitly, commanding pricing premiums from buyers who value documented performance. Certification requirements vary by application but rarely change year to year once established.
Gross Margin: 30-38%

Sustainability / Regulatory / Next-Generation

Ultra-short-throw home theater and software-bundled commercial units where brand trust and recurring service revenue sustain the strongest margins in the market as hardware alone becomes increasingly commoditized. These units also carry the fastest unit growth of any tier across the forecast period.
Gross Margin: 34-44%
laser-projection-market-portfolio-architecture-1790911655949

High-value Sub-segments and Strategic Watch-out

Home Theater and Residential Projectors

The fastest-growing and highest-value consumer segment, driven by ultra-short-throw designs and falling laser module costs pulling buyers away from large-screen television upgrade budgets entirely. Chinese brands dominate the fastest-growing price tiers within this category specifically. Growth here is expected to keep outpacing every other segment through the forecast window.
Gross Margin: MMA Estimate, July 2026.

Large Venue and Live Events Projectors

High-value and still growing well above the market average, anchored by rental and staging company replacement of lamp inventory and continued recovery in live events spending worldwide across major touring circuits and festival calendars this year. Barco and Christie Digital remain the two names most closely associated with this segment.
Gross Margin: MMA Estimate, July 2026.

Business and Education Projectors

The volume core of the market, serving established corporate and institutional buyers across every major region. Growth is steady but unspectacular as many developed markets approach replacement-cycle saturation rather than genuine expansion over the coming years. Replacement cycles still generate dependable order volume for established commercial suppliers.
Gross Margin: MMA Estimate, July 2026.

Government and Simulation Projectors

A strategic watch-out segment where procurement pace depends heavily on defense and public sector budget cycles that can shift unpredictably year to year. Demand could accelerate quickly if simulation and training budgets expand meaningfully over the next several planning cycles. Policy shifts in major defense budgets could change this quickly.
Gross Margin: MMA Estimate, July 2026.

Service Contracts Lock In Replacement Cycles

Laser projector demand increasingly carries annuity characteristics once a cinema or corporate buyer signs a multi-year maintenance contract alongside the hardware purchase. These contracts bundle calibration, software updates and support into a single recurring fee that survives well beyond the original transaction, giving suppliers revenue visibility pure hardware sales never provided during the lamp era.
Adoption stickiness and depth vary meaningfully by end-use vertical. Cinema exhibitors rarely switch suppliers mid-contract given the calibration continuity these agreements require across an entire multiplex fleet, while home theater buyers remain highly price-sensitive and switch brands readily between purchase cycles. Corporate and education buyers sit between these extremes, favoring proven brands but open to competitive tenders. Misjudging which category a buyer falls into costs suppliers bids they should win.

A generational shift in buyer profiles is underway as younger home theater buyers, raised on subscription software and connected devices, increasingly expect projectors to behave like smart home appliances rather than static display hardware. These buyers evaluate brands on software experience and content integration as much as picture quality, a shift favoring brands investing early in software depth over those competing on optics alone.
laser-projection-market-end-use-penetration-index-1790911656133

Where Laser Projection Value Concentrates Next

These are among the four positions where our research anticipates prominent divergence between winners and laggards over the coming forecast period. Each is grounded in the demand model, the regulatory perimeter, and the announced capacity pipeline.
01 / HOME THEATER BRAND POSITIONING

Build consumer brand trust before Chinese entrants do

Home theater and residential projectors are growing at 13.72 percent annually, roughly 1.40 times the overall market rate, driven by ultra-short-throw designs pulling buyers directly from television upgrade budgets across every major developed market. Chinese brands including Hisense and XGIMI are winning this segment on price and design today, and established names that wait too long to respond with competitive consumer offerings risk ceding the fastest-growing part of the market permanently. Early and sustained investment in consumer brand building pays off disproportionately here.
02 / CINEMA SERVICE CONTRACT STRATEGY

Convert hardware sales into recurring service revenue

Multi-year maintenance and calibration contracts already achieve renewal rates above 85 percent among cinema exhibitors, turning one-time hardware transactions into dependable recurring revenue streams worth pursuing aggressively across every major account and every major regional cinema chain. Suppliers that fail to pitch these contracts proactively at the point of initial sale leave meaningful recurring revenue on the table for competitors willing to bundle service more aggressively from day one. This gap will only widen further as existing fleets continue aging.
03 / LASER DIODE SUPPLY DIVERSIFICATION

Qualify secondary diode suppliers before the next spike

Laser diode lead times stretched to twenty weeks during 2024 demand spikes, and manufacturers without qualified secondary suppliers absorbed the resulting delivery delays and penalty costs most severely across fixed-price contracts signed before the shortage hit the broader supply chain. Companies that complete qualification cycles now, before the next demand spike arrives, will protect delivery commitments and margins when component tightness inevitably returns across future cycles. Those that wait will face the same margin compression repeatedly across every future shortage cycle.
04 / SOFTWARE BUNDLE MONETIZATION

Layer software subscriptions onto hardware margins

Bundled content and calibration software subscriptions already reach a 32 percent attach rate among premium tier buyers, adding a profitable second revenue stream that scales with installed base rather than unit sales alone as hardware margins compress across nearly every product category and price point. Brands that delay building this software layer will find it harder to catch up once buyer expectations around connected projector experiences become standard across every price tier. The window to establish this expectation gap is now.

Engagement Snapshot From the Field

A live engagement with an industry participant carrying material or product regulatory and market exposure ahead of a defining policy shift, showing how our research translates into a defensible multi-year portfolio strategy.
MARKET MINDS ADVISORY · CLIENT ENGAGEMENT SUMMARY
Laser Projection Producer Strategic Portfolio Review and Transition Roadmap 2026·Investment Scenario on Laser Projection Exposure Evaluation 2025-26
CLIENT PROFILE
A mid-sized regional cinema chain operating roughly forty screens across the southeastern United States engaged MMA to evaluate whether to proceed with a full laser conversion now or phase the transition across multiple fiscal years. The client's board wanted an independent view before committing capital (client-reported, unverified by MMA). The engagement was commissioned directly by the chain's finance committee ahead of its annual capital planning cycle.
STRATEGIC CHALLENGE
The chain's first-generation digital projectors were approaching end of service life, and the board needed to decide between a full laser conversion across all screens at once or a phased three-year rollout that would preserve capital but extend the transition period substantially (client-reported, unverified by MMA). Either path carried real tradeoffs between cash preservation and foregone operating savings.
MMA APPROACH
MMA's research team modeled total cost of ownership across both scenarios using primary interviews with comparable regional chains that had already completed similar conversions, cross-referencing findings against manufacturer financing terms available in the current market. The team then built a screen-by-screen prioritization framework based on attendance volume. This framework ranked screens by combined attendance and remaining lamp inventory value.
KEY FINDINGS
  1. A full conversion would require roughly 4.2 million dollars in upfront capital, but financing programs could spread this over five years at terms competitive with the chain's existing debt facilities.
  2. Phasing the rollout across three years would delay roughly 35 percent of projected operating cost savings, since unconverted screens would keep incurring lamp replacement costs during the interim period.
  3. Prioritizing the chain's twelve highest-attendance screens for the first conversion wave captured 60 percent of the total operating savings potential within the first year alone.
  4. Bundling a multi-year maintenance contract into the conversion order reduced the manufacturer's quoted price by roughly eight percent compared to purchasing hardware and service separately.
CLIENT PROFILE
A mid-sized regional cinema chain operating roughly forty screens across the southeastern United States engaged MMA to evaluate whether to proceed with a full laser conversion now or phase the transition across multiple fiscal years. The client's board wanted an independent view before committing capital (client-reported, unverified by MMA). The engagement was commissioned directly by the chain's finance committee ahead of its annual capital planning cycle.
STRATEGIC CHALLENGE
The chain's first-generation digital projectors were approaching end of service life, and the board needed to decide between a full laser conversion across all screens at once or a phased three-year rollout that would preserve capital but extend the transition period substantially (client-reported, unverified by MMA). Either path carried real tradeoffs between cash preservation and foregone operating savings.
MMA APPROACH
MMA's research team modeled total cost of ownership across both scenarios using primary interviews with comparable regional chains that had already completed similar conversions, cross-referencing findings against manufacturer financing terms available in the current market. The team then built a screen-by-screen prioritization framework based on attendance volume. This framework ranked screens by combined attendance and remaining lamp inventory value.
KEY FINDINGS
  1. A full conversion would require roughly 4.2 million dollars in upfront capital, but financing programs could spread this over five years at terms competitive with the chain's existing debt facilities.
  2. Phasing the rollout across three years would delay roughly 35 percent of projected operating cost savings, since unconverted screens would keep incurring lamp replacement costs during the interim period.
  3. Prioritizing the chain's twelve highest-attendance screens for the first conversion wave captured 60 percent of the total operating savings potential within the first year alone.
  4. Bundling a multi-year maintenance contract into the conversion order reduced the manufacturer's quoted price by roughly eight percent compared to purchasing hardware and service separately.
RECOMMENDED STRATEGY
Phase 1: Convert the twelve highest-attendance screens in year one using vendor financing, capturing the majority of operating savings fastest. This sequencing matched the pattern MMA observed across comparable chains. Phase 2: Convert the remaining screens across years two and three, sequenced by attendance volume and remaining lamp inventory on hand. This pacing kept annual capital outlay within the board's approved ceiling. Phase 3: Negotiate a bundled multi-year maintenance contract upfront across the full conversion rather than renegotiating with each phase. This single negotiation improved pricing leverage meaningfully across the full order.
OUTCOME
The client proceeded with the phased approach prioritizing high-attendance screens, securing vendor financing terms roughly in line with MMA's modeled estimate. Operating cost savings in the first year came in close to projections, and the chain has continued the rollout on schedule into its second phase (client-reported, unverified by MMA).

Frequently Asked Questions

Foundational context covering the market sizes, CAGR, scope, country, region and competition that inform every finding below. This section is provided to cover basics and most often pre-purchase conversations, answered from the MMA Primary Research Dataset.

What is the current size of the Laser Projection Market?

The Laser Projection Market was valued at 5.85 billion dollars in 2025. Growth is anchored by cinema conversion and rising ultra-short-throw home theater adoption worldwide.

How large will the Laser Projection Market be by 2036?

The market is projected to reach 16.36 billion dollars by 2036, up from 5.85 billion in 2025. That represents a 2.55 times expansion over the eleven-year forecast window.

What is the CAGR for the Laser Projection Market 2026 to 2036?

The market is forecast to grow at a 9.8 percent compound annual rate. This compares to a historical rate of 8.8 percent between 2020 and 2025.

Which segment is growing fastest?

Home Theater and Residential Projectors lead at a 13.72 percent CAGR, roughly 1.40 times the overall market rate. Falling laser module costs are the primary driver behind this acceleration.

Who are the major companies in the Laser Projection Market?

Epson, Sony, BenQ, Hisense, and Barco lead the competitive field. Together the top five brands hold roughly 48 percent of global revenue share this year.

Which country is growing fastest?

China leads country-level growth at an 11.3 percent CAGR. Its domestic laser television adoption and manufacturing scale are the single largest drivers of this pace.

Report Segmentation Architecture

The full report scope spans multiple orthogonal segmentation dimensions, with cross-tabulated demand data provided for each dimension pair. Coverage extends further to regional breakdowns, trend trajectories, and the competitive detail needed to support segment-level decision-making.

By Application Type

    By End-Use Industry

      By Commercial Dimension

        By Region

        • North America
        • Western Europe
        • East Asia
        • South Asia and Pacific
        • Latin America
        • Middle East and Africa
        • Eastern Europe

        Scope, Methodology, and Coverage

        Every figure in this report is reproducible from documented input assumptions. The scope below maps the historical period, the forecast horizon, the segmentation dimensions, and the countries covered, alongside the underlying primary and qualitative methodology.
        Historical Period
        2020 to 2025
        Forecast Period
        2026 to 2036
        Base Year
        2025 (USD billions; MMA Primary Research Dataset, October 2026)
        Market Definition
        This report covers laser-illuminated projection systems across cinema, home theater, business, education, large venue and government applications, including phosphor-converted and RGB pure laser light engines. It excludes lamp-based and LED-illuminated projectors, standalone laser light show equipment and projection mapping software sold independently of hardware.
        Quantitative Units
        USD Billion, CAGR 2026-2036
        Segmentation Dimensions
        By Application Type, By End-Use Industry, By Commercial Dimension, By Region
        Regions Covered
        North America, Western Europe, East Asia, South Asia and Pacific, Latin America, Middle East and Africa, Eastern Europe
        Countries Covered
        United States, China, Japan, South Korea, Germany, United Kingdom, India, Australia, Brazil, Saudi Arabia, and 15 additional markets
        Key Companies Profiled
        Epson, Sony, BenQ, Hisense, Barco, and 15 additional companies
        Quantitative Methodology
        Primary survey, n=3,800 respondents, Q4 2025, six countries; demand-side model with trade association cross-validation
        Qualitative Methodology
        47 expert interviews, Q4 2025; applied to validate demand model assumptions, identify emerging dynamics, and assess competitive positioning
        Report Format
        PDF and XLSX data workbook (Word format preview document)
        Publisher
        Market Minds Advisory
        Report Code
        MMA-2026-TEC-205
        Published
        October 2026
        Contact
        sales@marketmindsadvisory.com | www.marketmindsadvisory.com

        Purchase the full Laser Projection Market Report (2026 to 2036).

        The full Laser Projection Market report extends this summary with complete segment-level data tables, country-level sizing across twenty-five markets, and detailed supplier benchmarking across all twenty profiled companies named in this overview. It includes primary survey findings from 3,800 respondents across six countries and 47 expert interviews conducted in the fourth quarter of 2025, each sourced and documented separately throughout. Buyers receive editable data files alongside the narrative report, supporting direct use in internal planning models and board presentations. Analysts remain available for a follow-up briefing call to walk through the findings in more depth with procurement teams.
        Complete seven-region sizing and forecast tables
        Twenty company competitive benchmarking profiles included
        Five-year historical and eleven-year forecast data
        Segment-level CAGR and margin detail included
        Primary survey and expert interview data files
        Editable Excel data appendix fully included

        Built For The People Who Decide

        From boardroom strategy to bench-side execution, this report is read cover-to-cover by leaders shaping the next decade of their industry, turning demand scenarios, market dynamics and valuation benchmarks into decisions.
        CXOs/ Presidents/ VPs/ Managers
        M&A and Corporate Development
        Strategy Teams and R&D Heads
        Procurement and Product Directors
        Regulatory and Compliance Leaders
        Investor Relations and Equity Analysts