Market Minds Advisory
Large Format Display Market

Large Format Display Market: Large Format Display Market: Signage Panels, Fine Pitch Video Walls and Interactive Displays, 2026 to 2036

The screen is about a third of what a deployment costs and the only part anybody negotiates hard. Mounting, power, content systems and five years of service carry the rest of it.

Lead Analyst

Published

September 2026

Make Smarter Decisions with Customized Research Insights

Request a free sample report and evaluate market opportunities, growth trends, and competitive dynamics relevant to your business needs.

2025 MARKET VALUE$22.4BMarket Size 2025
2036 FORECAST VALUE$50.1BBase Case , 2026 to 2036
CAGR 2026 TO 20367.6 %Bull 8.8% / Bear 6.4%
INCREMENTAL OPPORTUNITY$26.0BNet 10- year value creation
EXPANSION MULTIPLE2.08x2036 value over 2026 base
Strategic Levers
M&A Pipeline
Regional Outlook
Country Rankings
Competitive Intelligence
Segmental Deep-dive
Call-Us : 91 93563 13602

Executive Snapshot and Market Trajectory.

Buyers procure large format displays on panel price, and the panel is roughly 34% of what the deployment actually costs. Mounting, power distribution, content management, and five years of service account for the rest. Procurement optimises the smallest line on the sheet. Nearly every disappointing project traces back to that.
Fine pitch LED video walls grow at 11.4%, half again the market rate of 7.6%, and picture quality has little to do with it. LED has no bezel and no size ceiling, so a video wall becomes one continuous surface rather than a visible grid of panels. East Asia holds 37% of shipment value, on manufacturing concentration and on domestic deployment volume arriving together.
Five manufacturers hold 46% of shipment value, and beneath them sit dozens of Chinese LED producers competing hard enough that delivered cost per square metre falls about 11.2% a year. Commercial displays run around 18 hours daily against warranty terms written for lighter duty, and field failure near 3.1% annually is the predictable consequence. Replacement modules from a later batch are visibly a different colour, which is the complaint suppliers hear most often of all.
Market Definition
The large format display market covers commercial display products of 32 inches and above, including liquid crystal digital signage panels, fine pitch light emitting diode video walls, interactive flat panel displays, outdoor light emitting diode billboard displays, hospitality and institutional televisions, and transparent and specialty displays. It excludes consumer televisions sold through retail, computer monitors, projection systems, mounting hardware sold separately, and content management software licensed independently.
Base Year Value
$22.4B in 2025 (MMA Primary Research Dataset, September 2026)
Forecast Period
2026 to 2036, eleven discrete annual values
CAGR
7.6% base case. Bull 8.8%. Bear 6.4%.
Fastest Growth Segment
Fine Pitch LED Video Walls: 11.4% CAGR
Fastest Growth Country
India: 12.8% CAGR
Fastest Growth Region
South Asia and Pacific: 9.7% CAGR
Largest Region
East Asia: 37% of 2025 global value
Market Leaders
Samsung Electronics, LG Electronics, Leyard, Unilumin, and BOE Technology lead the field. Source: MMA Primary Research Dataset, July 2026.
Primary Survey
n=3,800 procurement and R&D decision-makers, Q4 2025, six countries
Methodology
Demand-side build-up, cross-validated against public data, 47 expert interviews

Large Format Display Market Forecast Scenarios

large-format-display-market-size-forecast-scenario-1790007930067
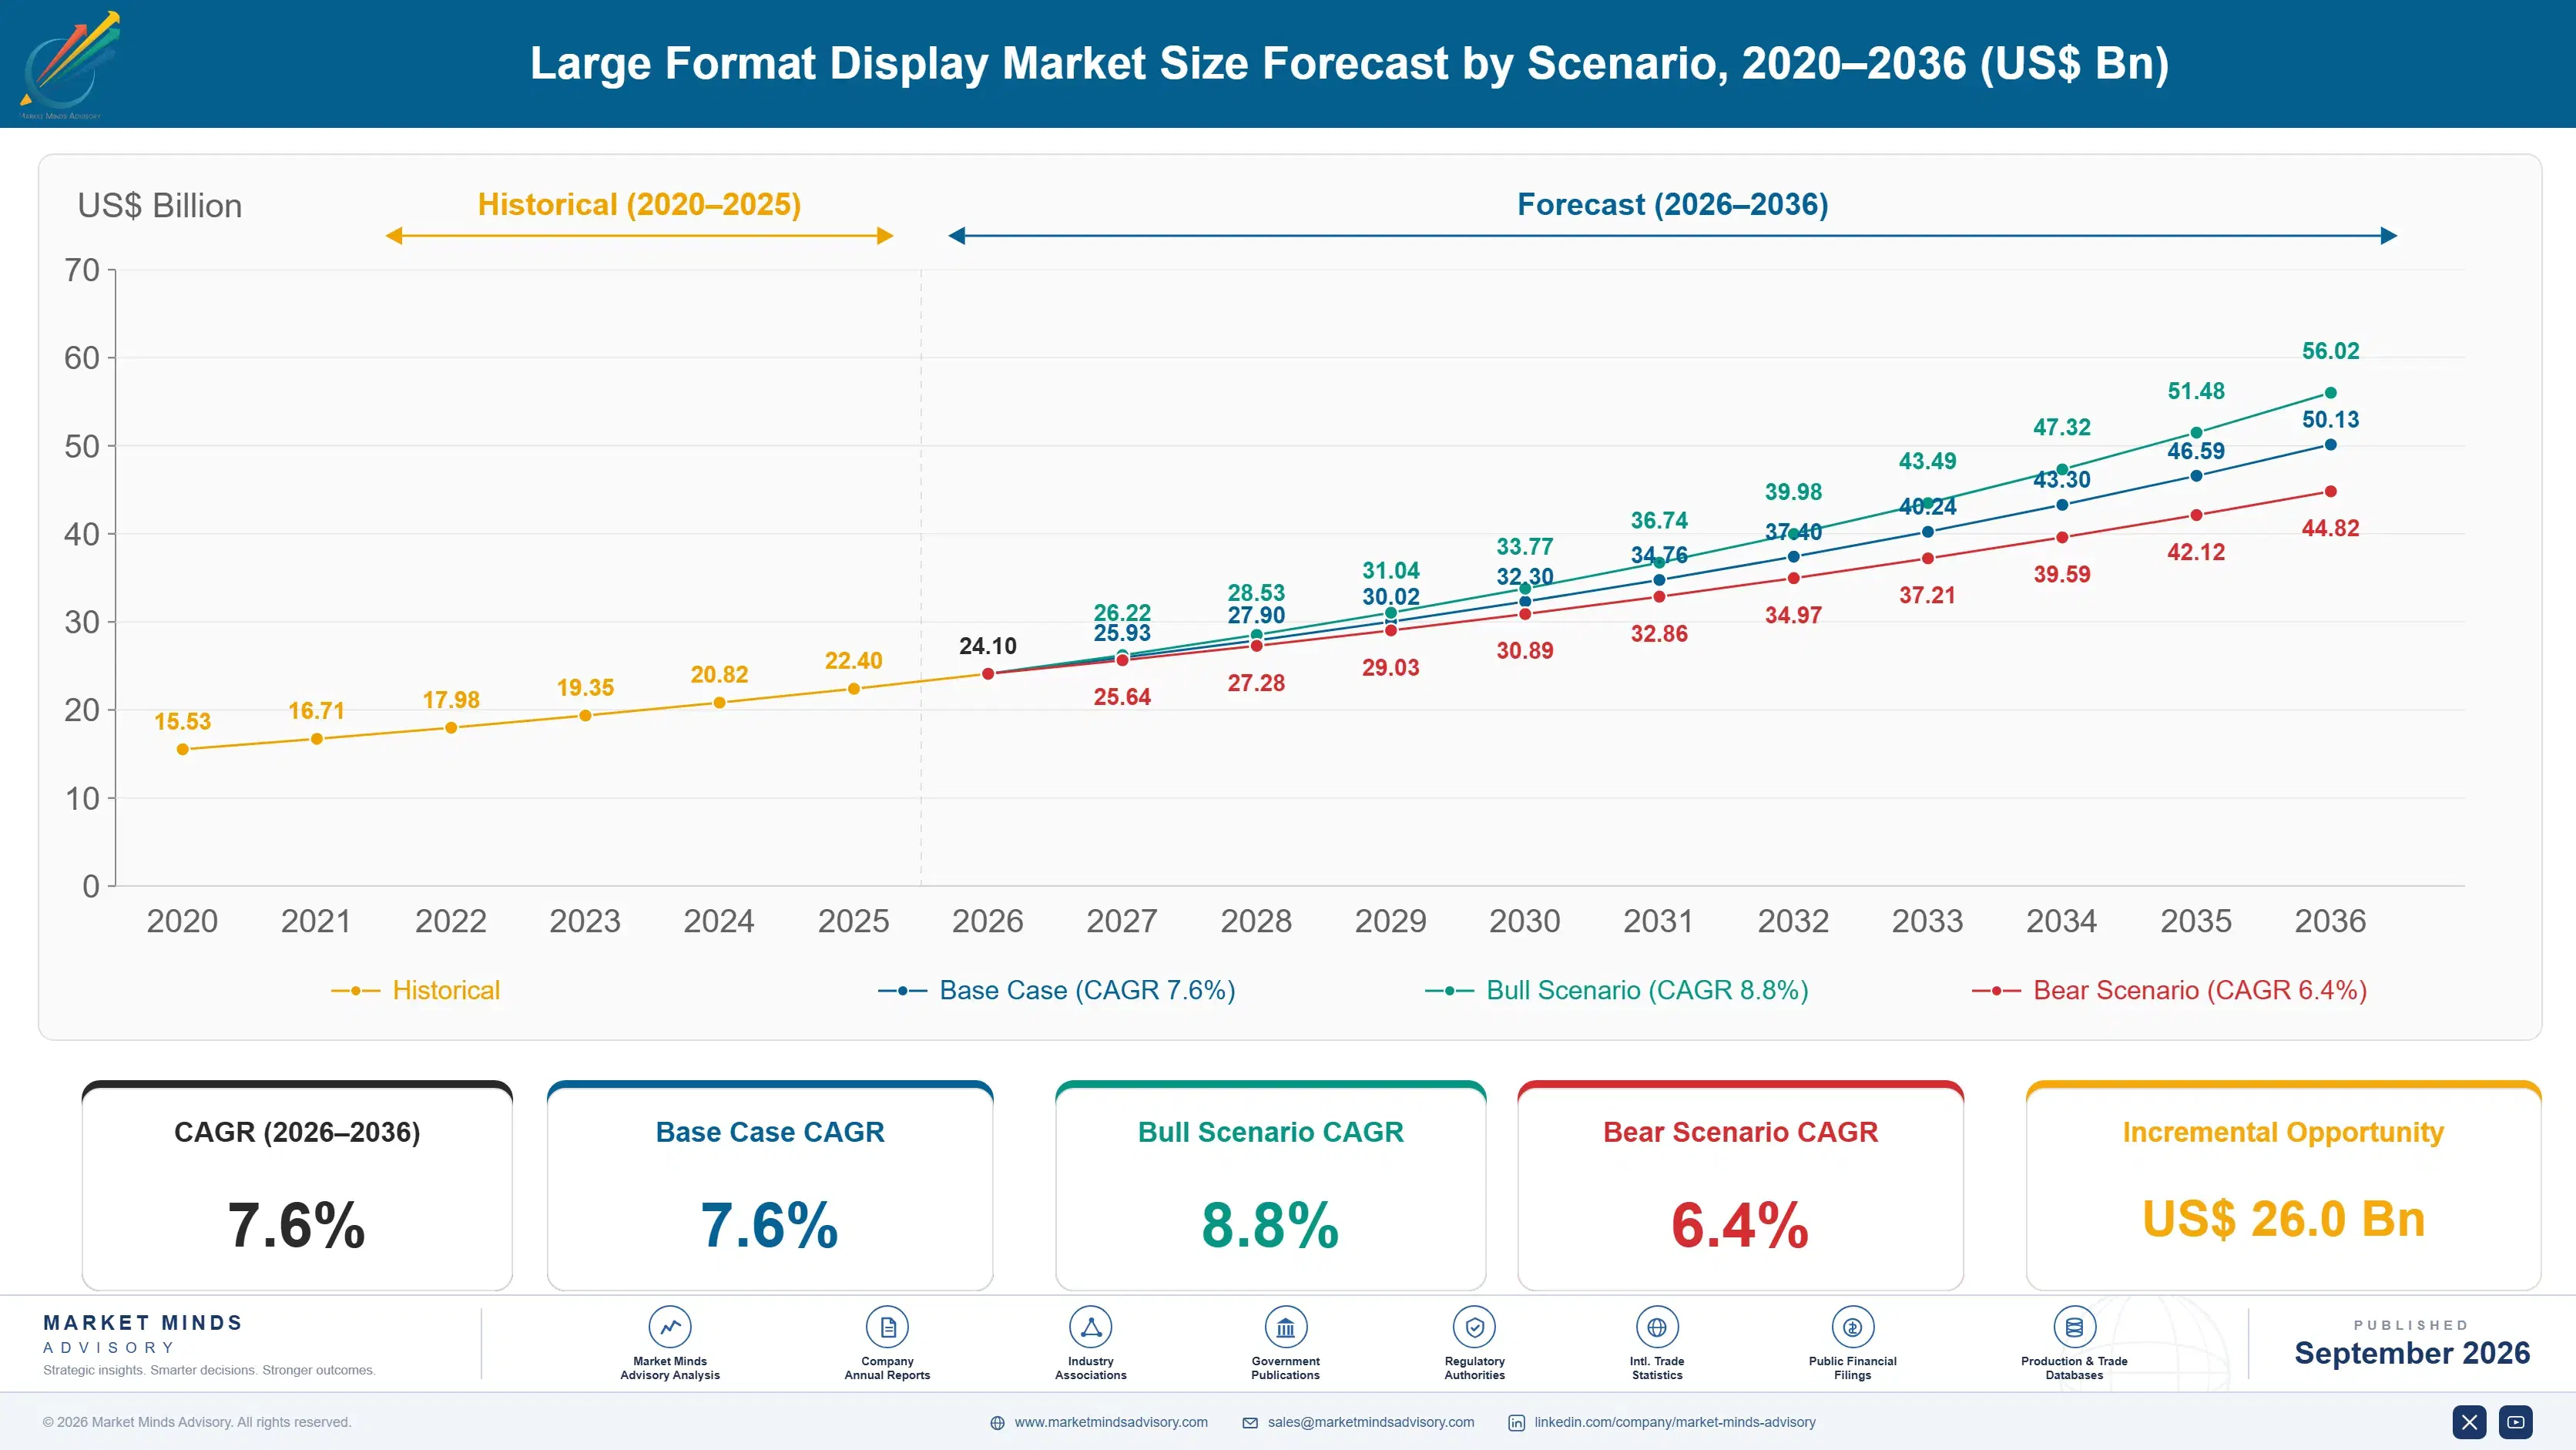
Growth between 2020 and 2025 was interrupted and then rebuilt on different products. Retail and hospitality deployment stopped almost completely during the pandemic period, then returned alongside a shift toward light emitting diode video walls that liquid crystal panels could not answer on size or continuity. Historical growth of 6.5% blends a collapse, a recovery, and a product transition.
The base case at 7.6% rests on three mechanisms. Fine pitch light emitting diode pricing continues falling at double digit rates, which brings video walls into project budgets that previously stopped at liquid crystal. Education and corporate meeting spaces keep replacing whiteboards and projectors with interactive panels on refresh cycles now firmly established. And transport, stadium, and public information deployment expands across Asia and the Gulf where infrastructure programmes fund it directly.
The bull case at 8.8% depends on micro light emitting diode manufacturing yields improving enough to reach commercial pricing, which would extend the fine pitch argument into sizes and applications currently served by liquid crystal. The bear case at 6.4% is commercial property weakness: retail, hospitality, and office deployment all follow occupancy and refurbishment cycles, and a sustained downturn in any of the three removes visible demand quickly.

The Screen Is Not The Project

Procurement in this market consistently optimises the wrong line. The display accounts for about 34% of what a deployment costs; mounting structures, power distribution, cabling, commissioning, content management, and a five year service agreement make up the remainder. Buyers who negotiate the panel hard and accept whatever the integrator quotes for everything else are shaving a third of a budget.
TOP FIVE CONCENTRATION46%Share of shipment value held by the leading manufacturers
PANEL SHARE OF PROJECT34%Portion of deployment cost represented by the display itself
AVERAGE DAILY OPERATING HOURS18Duty cycle across commercial signage installations currently in service
FINE PITCH PRICE DECLINE11.2%Annual erosion in delivered cost per square metre
FIELD FAILURE RATE3.1%Annual proportion requiring replacement or on-site engineer intervention
INSTALLED BASE REFRESH CYCLE7 yearsMedian period before a commercial display is replaced
Duty cycle explains most of the disappointments that follow. Commercial installations run around 18 hours a day, every day, against warranty terms and reliability figures largely inherited from consumer product assumptions. Field failure near 3.1% annually sounds small until it is a video wall in an airport concourse and the replacement panel is a different production batch with visibly different colour. Consumer product assumptions do not survive continuous commercial duty.
Light emitting diode pricing is doing the rest. Delivered cost per square metre falls about 11.2% a year as Chinese manufacturers compete on volume, which pulls fine pitch video walls into budgets that previously stopped at tiled liquid crystal. That erosion is excellent for buyers and brutal for anybody manufacturing panels without a service or systems business attached. Hardware alone is no longer a business.
"We have reviewed procurement documents that specify panel brightness to the nit and say nothing whatever about who replaces a failed module in year four. The screen is the easy part. Everything that makes an installation still look right in 2031 sits in the two thirds nobody scrutinised."
Practice Director, Display Technologies and Visual Systems · MMA Technology Practice · September 2026

Market Trends

Fine Pitch Light Emitting Diode Removes The Bezel Entirely

A tiled liquid crystal video wall shows its seams however narrow the bezels become, and for a corporate lobby or a broadcast set that visible grid is the objection nobody can design around. Light emitting diode surfaces have no seams and no size ceiling, so the wall becomes one continuous image at whatever dimensions the space allows. Fine pitch grows at 11.4% on that argument rather than on any resolution advantage. Delivered cost per square metre falling 11.2% annually is what moved it from prestige installations into ordinary project budgets.
Market Impact: Drives 12.8% Indian growth

Interactive Panels Complete The Classroom Replacement Cycle

Interactive flat panels replaced projectors and whiteboards across education and corporate meeting rooms, and the first wave of those installations is now reaching replacement age on cycles that have become routine and budgeted. Interactive displays grow at 9.8%. What has changed commercially is that the second purchase is a refresh rather than a conversion, so it competes on price and service against an incumbent rather than against a projector. Manufacturers who built installed bases during the conversion wave are defending them under quite different conditions. Winning an account and defending it are very different exercises.
Market Impact: Funds 27% of retail deployment

Market Opportunities and Growth Drivers

Asian Infrastructure Programmes Fund Public Information Displays

Metro systems, airports, stadiums, and civic developments across Asia and the Gulf specify passenger information and advertising displays as part of the construction budget rather than as a later addition, which removes the separate business case that slows deployment elsewhere. Indian growth of 12.8% leads every country covered on that basis. These projects are large, specified years ahead, and awarded through construction procurement, which favours manufacturers with local presence and project references over those selling through conventional distribution channels. Local project presence beats distribution reach here, and the specification is written years before anybody buys anything.
Market Impact: Failure reaches 3.1% annually

Retail Reformats Displays As Advertising Inventory

Grocery and general merchandise retailers increasingly treat in-store screens as media inventory sold to suppliers rather than as a marketing cost carried internally, which changes the funding source completely and makes deployment self-financing. That reframing supports far larger installations than a marketing budget would approve. Roughly 27% of new retail display deployment is now funded from advertising revenue rather than from capital budgets, and those projects specify measurement and uptime commitments that conventional signage procurement never asked for. Marketing approval would never have funded installations at this scale, and the reframing changed that overnight.
Market Impact: Prices fall 11.2% yearly

Market Restraints and Challenges

Duty Cycle Exceeds What Warranty Terms Assume

Commercial installations run about 18 hours daily against reliability figures and warranty periods inherited from lighter duty assumptions, and field failure near 3.1% annually follows directly. The root cause is thermal and backlight ageing rather than any manufacturing defect. Commercially this produces service costs nobody budgeted, colour mismatch when replacement panels come from later production batches, and disputes that damage manufacturer relationships. Participants respond with commercial grade specifications rated for continuous operation, batch matching commitments on video wall projects, and service agreements priced against measured duty rather than assumed. Monitoring makes the exposure visible.
Market Impact: Grows at 11.4% annually

Price Erosion Outruns Manufacturing Cost Reduction

Delivered cost per square metre for fine pitch light emitting diode falls about 11.2% annually, faster than component and process cost improvement at most manufacturers, and the root cause is capacity competition among a large field of Chinese producers rather than any technology curve. Commercially this compresses hardware margin toward nothing and punishes anybody selling panels alone. Participants respond by attaching content management, service, and installation revenue, by pursuing project specification rather than distribution sales, and by concentrating on applications where reliability commitments matter more than unit price. Panels alone earn nothing now.
Market Impact: Segment grows at 9.8%
3 additional market trends, 4 additional growth drivers, and 2 additional restraints and challenges are covered in the full report. Contact sales@marketmindsadvisory.com to access the complete intelligence.

Segment CAGR and Growth Architecture

Segmentation follows display product type. Six categories cover the market: liquid crystal digital signage panels, fine pitch light emitting diode video walls, interactive flat panel displays, outdoor light emitting diode billboard displays, hospitality and institutional televisions, and transparent and specialty displays. Liquid crystal still carries most units while value migrates toward light emitting diode.
large-format-display-market-market-share-analysis-1790007930634

Fine Pitch LED Video Walls

Fine pitch light emitting diode grows at 11.4%, half again the market rate of 7.6%, and the winning argument is geometric rather than optical. A tiled liquid crystal wall shows its grid however narrow the bezels get, and light emitting diode surfaces do not, which settles the specification for lobbies, control rooms, broadcast sets, and retail flagships. Size is unconstrained too, since the wall is assembled from modules rather than from finished panels. Delivered cost per square metre falling 11.2% a year is what carried it out of prestige installations and into ordinary budgets, and that same erosion is destroying hardware margin across the supply base. Volume growth and revenue growth have parted company.
CAGR 11.4%

Interactive Flat Panel Displays

Interactive panels grow at 9.8% on a replacement cycle rather than a conversion. Education and corporate meeting rooms swapped projectors and whiteboards for panels during the past decade, and those installations are reaching refresh age with budgets already established for the purpose. The commercial character has changed accordingly: the second purchase competes on price, software compatibility, and service response against a sitting incumbent, not against a projector nobody wants. Manufacturers who built installed bases during the conversion wave now have to defend them, which is a different and considerably less comfortable exercise than winning them was. Software compatibility and service response decide these renewals more than panel specification does, which suits incumbents holding the account.
CAGR 9.8%
Full segment breakdown across 6 segments available in the complete report.

Regional Architecture and Country Demand Map

Regional shares reflect where displays are deployed and installed rather than where the panels themselves are fabricated. East Asia is the only region covered where both activities happen at once, which is exactly why its share sits so far outside the standard band. Elsewhere the two diverge sharply.

East Asia

At 37% East Asia sits well above the standard band, and the justification is that manufacturing and deployment coincide here in a way they do nowhere else. Chinese light emitting diode producers supply most of the world's fine pitch modules while Chinese retail, transport, and civic deployment consumes them at volumes no other region approaches. Korean manufacturers hold the premium liquid crystal and commercial television positions. Growth of 8.6% runs above the world rate because domestic infrastructure programmes and retail modernisation continue funding installations directly, and because price erosion here converts into volume rather than into lost revenue. Price erosion converts into volume here rather than into lost revenue. Domestic programmes fund it.
Share: 37% | CAGR: 8.6% (2026 to 2036)

North America

Corporate lobbies, sports venues, quick service restaurant menu boards, and retail media networks account for most deployment, and the retail media shift matters more here than anywhere else. Roughly a quarter of new retail installation is now funded from advertising revenue rather than from capital budgets, which supports far larger deployments than marketing approval would ever have permitted. Growth of 6.8% is moderate, held back by commercial property weakness in office and by mature penetration in quick service restaurants. Service and content management revenue represents an unusually large share of project value in this region. Service and content revenue represent an unusually large share of project value. Office deployment remains weak.
Share: 22% | CAGR: 6.8% (2026 to 2036)
Regional intelligence for 5 additional markets available in the complete report: Western Europe, South Asia and Pacific, Latin America, Middle East and Africa, Eastern Europe. Contact sales@marketmindsadvisory.com.
large-format-display-market-country-cagr-analysis-1790007931160

Where Suppliers Escape Price Erosion

Four commercial moves separate manufacturers holding margin from those watching hardware pricing fall 11.2% a year. Each moves revenue away from the panel, which is the part buyers negotiate hardest and the part where a dozen Chinese producers will always quote lower than anybody else can. Hardware alone is not defensible. Chinese producers always quote lower.

Sell The Two Thirds Buyers Never Scrutinise

The display is about 34% of deployment cost, and mounting, power, commissioning, content management, and five year service make up the rest, quoted by integrators with far less scrutiny applied. Manufacturers capturing that scope directly report project revenue 2.4 times the hardware value alone, with margin that does not erode at 11.2% a year. It requires installation and service capability most panel manufacturers deliberately avoided building, and the ones who built it are the ones still earning properly. Integrators quote that scope with far less scrutiny applied to it. Most avoided building it.
Market Impact: Earns 2.4 times the hardware value alone overall

Commit Batch Matching Across Video Wall Projects

A failed module replaced from a later production batch is visibly a different colour on a continuous surface, and that single problem generates more customer dissatisfaction than any other in this category. Manufacturers reserving matched inventory against installed video walls, typically for five years, win specification against cheaper competitors at roughly 2.9 times the rate. The inventory carry is real and modest, and the alternative is a customer whose flagship installation looks patched within four years of opening. It is the single most common source of dissatisfaction in the category.
Market Impact: Wins project specification 2.9 times more often overall

Enter Through Construction Procurement Not Distribution

Metro systems, airports, stadiums, and civic developments specify displays inside the construction budget years before installation, and the manufacturer named in that specification faces no competitive process afterward. Suppliers with project teams working alongside architects and consultants win 3.6 times more infrastructure work than those quoting through distribution channels. The engagement is long, unfunded, and requires people who can read a construction programme, which is unfamiliar territory for organisations built around channel sales. Channel sales organisations rarely employ anybody who can do it, which is precisely why the position stays available.
Market Impact: Wins 3.6 times more infrastructure project awards overall

Price Service Against Measured Duty Cycle

Commercial installations run about 18 hours daily and fail at roughly 3.1% annually, and service agreements priced on assumed lighter duty lose money predictably. Manufacturers pricing against measured operating hours, with monitoring built into the display, improve service margin by 12 to 19 points and can offer genuinely better response commitments because the exposure is understood. Customers accept the arrangement readily, since it replaces a dispute about whether a failure was covered with a number both sides can see. Coverage disputes disappear entirely. Both parties can see the same number, which changes the conversation entirely.
Market Impact: Improves service margin by 12 to 19 points

Who Controls the Margin Pool

Concentration is moderate and falling. Five manufacturers hold 46% of shipment value, measured consistently on that basis across all participants, and beneath them sits a very large field of Chinese light emitting diode producers whose capacity competition drives the price erosion everybody else is managing. The gap between the leader and the fifth is narrow, and positions move with product transition rather than with any commercial manoeuvre. Product transition rather than commercial manoeuvre moves the field.
Competition currently turns on three things: installation and service capability that captures scope beyond the panel, batch matching commitments on video wall projects, and presence in construction specification before procurement begins. Panel specification differentiates less each year, since brightness, resolution, and colour performance have converged across every credible supplier at a given price point.

Pressure comes from two directions. Chinese light emitting diode manufacturers keep expanding capacity into a market where price already falls faster than cost. Meanwhile systems integrators are capturing project value that manufacturers historically ceded. Rankings will shift toward suppliers who own installation and service rather than those optimising panel cost, since only one of those escapes the erosion.
large-format-display-market-company-positioning-matrix-1790007931678

Competitive Moat and Risk Dimensions

SAMSUNG ELECTRONICS

Moat: Brand And Channel Reach

Specification default status across corporate, retail, and hospitality procurement means the brand appears on shortlists without competing to get there, and a very wide integrator channel converts that reach into installations across every region. For buyers unable to evaluate panel specifications meaningfully, brand functions as a risk decision they can defend internally.
SAMSUNG ELECTRONICS

Risk: Light Emitting Diode Cost Position

Fine pitch pricing falls about 11.2% annually driven by Chinese manufacturers with cost positions built on domestic component supply and enormous volume. Competing there on hardware alone is unwinnable, and defending share means moving toward service and systems revenue that the current channel-led model was never designed to capture.
LEYARD

Moat: Fine Pitch Manufacturing Scale

Vertical light emitting diode manufacturing at very large volume produces a delivered cost position that competitors buying modules cannot approach, and it is the direct reason fine pitch has moved from prestige installations into mainstream project budgets. That cost advantage compounds as the segment grows and volumes rise further.
LEYARD

Risk: Service Network Outside Asia

Project value increasingly sits in installation, commissioning, and multi-year service rather than in hardware, and building that capability across Western markets requires local presence, trained engineers, and spares logistics. Competitors with established service networks capture scope the company must subcontract, sharing margin it would otherwise keep.

Players Tracked

Prominent Players

Samsung Electronics
LG Electronics
Leyard
Unilumin
BOE Technology

Other Key Players

Sharp NEC Display Solutions
Panasonic
Sony
TP Vision
Absen
Daktronics
Barco
ViewSonic
BenQ
Christie Digital
Planar Systems
Hisense
TCL
AUO
Innolux

Recent Developments

MARCH 2026

Leyard Expands Fine Pitch Module Manufacturing Capacity

Leyard completed an organic expansion of fine pitch light emitting diode module capacity aimed at pixel pitches below one millimetre, extending the delivered cost position that has moved video walls from prestige installations into ordinary project budgets. Output is directed toward project business rather than distribution channels.
Signal: Capacity additions keep driving price erosion faster than component cost improvement across the whole supply base.
OCTOBER 2025

Samsung Electronics Awarded Metro Passenger Information Display Contract

Samsung Electronics was selected to supply passenger information and advertising displays across a metro expansion programme, on a specification written during construction design rather than procured separately after the stations were completed. Content management and multi-year service formed part of the same award. Commissioning ran alongside construction.
Signal: Construction stage specification removes the competitive process that distribution channel selling always has to face later.
JUNE 2025

Absen Signs Supply Agreement With European Systems Integrator

Absen entered a multi-year supply agreement with a European systems integrator covering fine pitch video wall modules, with batch matching inventory reserved against installed projects for a defined period after each deployment completes. Reserved inventory covers colour binning as well as pitch and module type.
Signal: Batch matching commitments are becoming contractual because colour mismatch generates more complaints than anything else does.

What These Displays Cost To Build

Three inputs dominate manufacturing cost. Light emitting diode packages and driver integrated circuits, or liquid crystal panels depending on product, run 44% to 52% of cost of goods sold. Cabinets, mechanical assembly, and power supplies take 18% to 24%. Logistics, import duty, and packaging add a further 8% to 13%, which is unusually high because these products are large, heavy, and fragile in combination.
Light emitting diode chip and driver integrated circuit pricing fell substantially through 2024 and 2025 as capacity additions outpaced demand, and several manufacturers described the resulting pressure on selling prices in their annual reports for those years. Component cost fell alongside, though not as fast as delivered prices, which compressed hardware margin across the field rather than improving it for anybody. Nobody gained from the movement.

The competitive disadvantage mechanism runs through logistics and service rather than through components. A manufacturer shipping finished displays across long distances carries freight and damage cost that regional assembly avoids, and cannot recover it when panel pricing is the comparison. Exposure varies by participant type. Vertically integrated producers control component cost directly. Module buyers pay market prices for their largest input and compete against the companies selling it.
large-format-display-market-cost-volatility-analysis-1790007931877

Assemble Cabinets Regionally And Ship Modules

Finished displays are large, heavy, and easily damaged, so freight and breakage cost far more than the same product shipped as modules and assembled near the customer. Manufacturers who moved to regional assembly report delivered cost improving several points and damage claims falling sharply, with the additional benefit of much shorter lead times on project work.

Integrate Light Emitting Diode Package Manufacture

Packages and driver circuits are the largest input by a wide margin, and buying them means paying market prices to companies who also compete for the same projects. Vertical manufacture removes that exposure and is the direct reason the strongest cost positions in fine pitch belong to producers who make their own components. Component supply and competition overlap.

Standardise Cabinet Platforms Across Pixel Pitches

Mechanical design, power supply, and thermal management repeat across pixel pitches that customers treat as entirely different products. Sharing cabinet platforms spreads tooling and qualification cost across far more volume, and it simplifies spares holding for service organisations supporting installations across several pitch generations simultaneously. Spares holding across pitch generations becomes considerably simpler for the service organisation.

Portfolio Architecture for Margin Defence

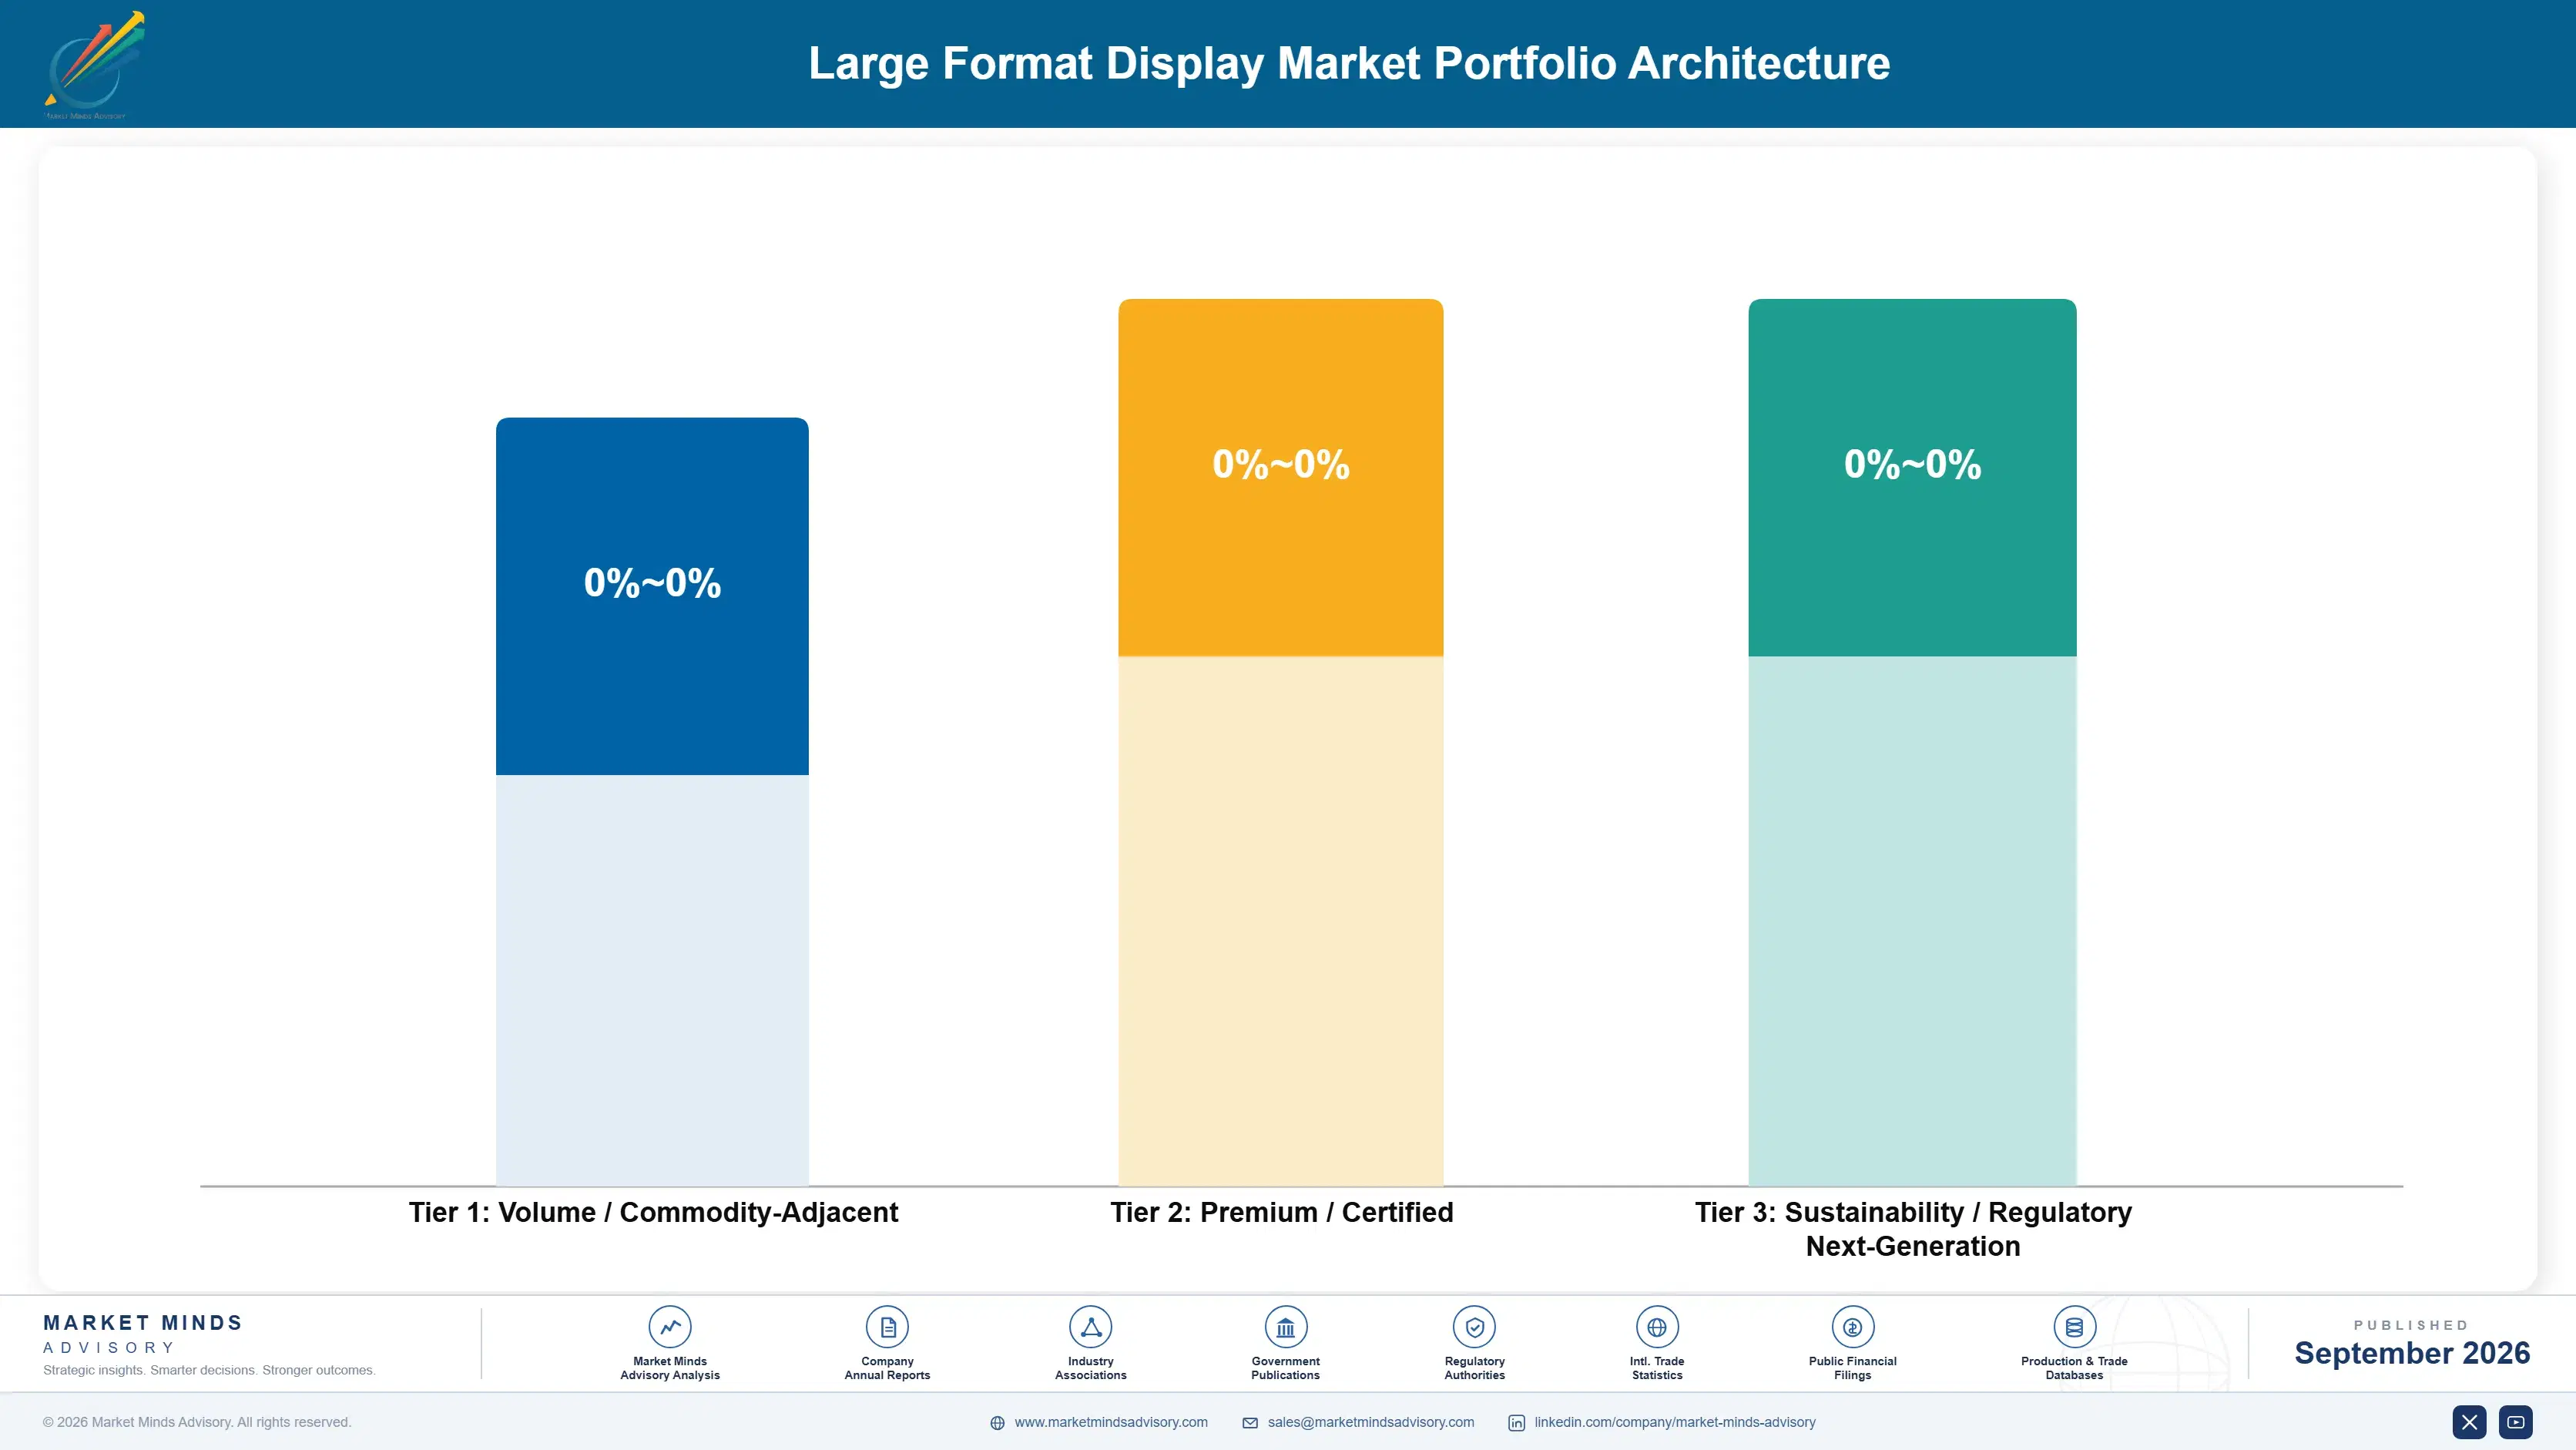
Margin follows how far a supplier sits from the panel. Liquid crystal signage and commercial television hardware are close to commodity, competing on specifications that have converged across every credible manufacturer at a given price. Fine pitch modules earn better where vertical component manufacture supports the cost position. Installation, content management, and multi-year service earn most, because none of it erodes at 11.2% a year.
The tension between volume and premium is sharpened by price erosion. Hardware volume growth looks impressive on shipment figures and delivers falling revenue per square metre, so a manufacturer growing units without capturing project scope is running backwards. Service and systems revenue scales with installed base rather than with shipments, which makes it slower to build and considerably more durable once established.

High-value pools concentrate where reliability commitments matter more than unit price: infrastructure projects specified during construction, video walls carrying batch matching obligations, and retail media networks with contractual uptime attached to advertising revenue. These share a buyer for whom a dark screen costs something specific. Elsewhere the product is square metres of light, and square metres of light get cheaper every year.

Volume / Commodity-Adjacent

Liquid crystal signage panels, hospitality televisions, and standard commercial displays where specifications have converged and buyers compare price directly. Price erosion outruns component cost improvement. The nine-point range reflects wide variation in whether manufacturers fabricate panels or purchase them.
Gross Margin: 13% to 22%

Premium / Certified

Fine pitch light emitting diode modules and interactive panels where vertical component manufacture or installed base position supports pricing. Competition remains intense and capacity keeps expanding. The nine-point range separates vertically integrated producers from those buying packages at market prices.
Gross Margin: 28% to 37%

Sustainability / Regulatory / Next-Generation

Installation, commissioning, content management, batch matched spares, and multi-year service priced against measured duty cycle. None of it erodes with hardware pricing. The twelve-point range reflects how differently manufacturers and integrators price scope that buyers rarely scrutinise closely.
Gross Margin: 44% to 56%
large-format-display-market-portfolio-architecture-1790007932382

High-value Sub-segments and Strategic Watch-out

Project Installation And Service Scope

Highest value in the market, covering roughly two thirds of deployment cost that procurement rarely examines. Margin does not erode with panel pricing. The twelve-point range reflects the difference between manufacturers owning service capability and those subcontracting it to integrators entirely. Procurement rarely tenders it.
Gross Margin: 46% to 58%

Fine Pitch Video Wall Modules

Fastest growth at 11.4% on a geometric argument rather than an optical one, since light emitting diode surfaces have no bezel and no size ceiling. Delivered pricing falls 11.2% annually. The nine-point range separates vertically integrated producers from module purchasers competing against their own suppliers.
Gross Margin: 29% to 38%

Interactive Panel Refresh Demand

Growing at 9.8% on replacement rather than conversion, which means competing against a sitting incumbent on price, software compatibility, and service response. Budgets are established and cycles predictable. Defending an installed base is considerably harder than winning it during the original conversion wave. Incumbency helps less than expected.
Gross Margin: 26% to 35%

Standard Liquid Crystal Signage Supply

The strategic watch-out. Specifications have converged, a dozen manufacturers quote credibly, and value is migrating toward light emitting diode at the top of the market. The ten-point range reflects the gap between panel fabricators and assemblers buying glass at market prices. Value migrates upward steadily.
Gross Margin: 11% to 21%

How Deployments Generate Repeat Revenue

Hardware revenue arrives in projects and then stops, with a median seven year gap before replacement, which makes it lumpy and competitive every time. What recurs is service, content management, and spares against an installed base that only accumulates. Manufacturers who captured that scope hold revenue between refresh cycles; those who sold panels through distribution have nothing at all until the customer next needs screens.
Depth of engagement varies sharply by application. Infrastructure installations embed deeply, because the display is part of a commissioned system with documented maintenance obligations and replacing the supplier means revalidating everything. Retail media networks are similarly durable, since advertising revenue depends on contractual uptime. Corporate meeting room displays are the least committed, refreshed on price against whichever integrator holds the account that year.

The buyer profile has moved in an awkward direction for manufacturers. Facilities and audiovisual managers once specified displays directly and knew the products well. Construction consultants now write infrastructure specifications years ahead, retail media teams buy against advertising economics, and procurement functions compare panel prices without seeing the rest. Selling to the person who understands displays reaches the smallest of those three groups.
large-format-display-market-end-use-penetration-index-1790007932870

Where This Market Rewards

These are among the four positions where our research anticipates prominent divergence between winners and laggards over the coming forecast period. Each is grounded in the demand model, the regulatory perimeter, and the announced capacity pipeline.
01 / PROJECT SCOPE CAPTURE

The panel is a third of what buyers actually spend

Mounting, power distribution, commissioning, content management, and five years of service make up roughly two thirds of deployment cost and receive a fraction of the scrutiny that panel pricing attracts during procurement. Manufacturers capturing that scope directly report project revenue 2.4 times the hardware value, on margin that does not fall 11.2% a year. It demands installation and service capability that most panel manufacturers deliberately chose not to build, and which most of them now regret avoiding entirely, to their evident cost.
02 / COLOUR CONTINUITY COMMITMENT

Mismatched replacement modules ruin flagship installations

A module replaced from a later production batch is visibly a different colour on a continuous light emitting diode surface, and that single failure generates more customer dissatisfaction than anything else in this category. Manufacturers reserving matched inventory against installed video walls for five years win specification roughly 2.9 times more often than cheaper competitors. The inventory carry is modest against a customer whose flagship wall looks patched within four years of opening, in front of every passenger walking through it.
03 / CONSTRUCTION STAGE SPECIFICATION

Infrastructure displays are chosen years before procurement

Metro systems, airports, stadiums, and civic developments write displays into construction specifications long before any purchasing process begins, and the manufacturer named there faces no competition afterward. Suppliers with project teams working alongside architects and consultants win 3.6 times more infrastructure work than those quoting through distribution. The engagement is long and unfunded and requires people who can read a construction programme rather than a price list, which is unfamiliar work for a channel organisation rather than a familiar one.
04 / DUTY CYCLE PRICING

Warranties assume hours these displays never keep

Commercial installations run about 18 hours daily and fail at roughly 3.1% annually against reliability figures inherited from lighter duty assumptions, so service agreements priced on those assumptions lose money predictably every year. Manufacturers pricing against measured operating hours, with monitoring built into the display, improve service margin by 12 to 19 points. Customers accept it readily, because it replaces an argument about coverage with a number both parties can see and check independently against their own records, quarter by quarter.

Engagement Snapshot From the Field

A live engagement with an industry participant carrying material or product regulatory and market exposure ahead of a defining policy shift, showing how our research translates into a defensible multi-year portfolio strategy.
MARKET MINDS ADVISORY · CLIENT ENGAGEMENT SUMMARY
Large Format Display Producer Strategic Portfolio Review and Transition Roadmap 2026·Investment Scenario on Large Format Display Exposure Evaluation 2025-26
CLIENT PROFILE
An airport operator running three terminals across two hubs, with approximately 4,100 installed displays covering passenger information, wayfinding, retail advertising, and gate systems. Annual capital budget for terminal systems exceeded USD 180 million (client-reported, unverified by MMA). A terminal expansion required roughly 900 new displays, and the existing estate was reaching replacement age simultaneously. No consistent service arrangement covered the estate.
STRATEGIC CHALLENGE
Procurement had specified displays on panel price and technical specification for a decade, and the resulting estate contained four manufacturers across seven product generations with incompatible spares and no consistent service arrangement. Failed video wall modules were being replaced with visibly mismatched panels in the busiest concourse, which had become a reputational issue.
MMA APPROACH
MMA analysed total deployment cost across the existing estate, separating panel value from installation, power, content systems, and service to establish where money had actually gone. Failure records were matched against duty cycle by location. Supplier capability was assessed on service network, batch matching commitments, and construction stage engagement rather than on panel specification.
KEY FINDINGS
  1. Displays accounted for 31% of historical deployment spending, while installation, power, content systems, and service made up the remainder with no competitive tendering applied.
  2. Failure rates in the busiest concourse ran at 4.6% annually against 2.2% in low traffic areas, tracking measured operating hours almost exactly across every location examined.
  3. Only two of six candidate suppliers would commit to reserving batch matched spares against installed video walls for the full expected service life of the estate.
  4. Consolidating to a single supplier across the expansion and the refresh would reduce spares holding by an estimated 44% and eliminate the mismatch problem entirely.
CLIENT PROFILE
An airport operator running three terminals across two hubs, with approximately 4,100 installed displays covering passenger information, wayfinding, retail advertising, and gate systems. Annual capital budget for terminal systems exceeded USD 180 million (client-reported, unverified by MMA). A terminal expansion required roughly 900 new displays, and the existing estate was reaching replacement age simultaneously. No consistent service arrangement covered the estate.
STRATEGIC CHALLENGE
Procurement had specified displays on panel price and technical specification for a decade, and the resulting estate contained four manufacturers across seven product generations with incompatible spares and no consistent service arrangement. Failed video wall modules were being replaced with visibly mismatched panels in the busiest concourse, which had become a reputational issue.
MMA APPROACH
MMA analysed total deployment cost across the existing estate, separating panel value from installation, power, content systems, and service to establish where money had actually gone. Failure records were matched against duty cycle by location. Supplier capability was assessed on service network, batch matching commitments, and construction stage engagement rather than on panel specification.
KEY FINDINGS
  1. Displays accounted for 31% of historical deployment spending, while installation, power, content systems, and service made up the remainder with no competitive tendering applied.
  2. Failure rates in the busiest concourse ran at 4.6% annually against 2.2% in low traffic areas, tracking measured operating hours almost exactly across every location examined.
  3. Only two of six candidate suppliers would commit to reserving batch matched spares against installed video walls for the full expected service life of the estate.
  4. Consolidating to a single supplier across the expansion and the refresh would reduce spares holding by an estimated 44% and eliminate the mismatch problem entirely.
RECOMMENDED STRATEGY
Phase 1: Phase one: tender the full deployment scope rather than the panels alone, requiring suppliers to price installation, content systems, and multi-year service together. Phase 2: Phase two: require batch matched spares reservation against every video wall installation as a mandatory condition, eliminating the two suppliers unwilling to commit. Phase 3: Phase three: price service against measured operating hours by location rather than a flat estate rate, reflecting the failure pattern the analysis had established.
OUTCOME
Total deployment cost for the expansion came in 19% below the estimate built from previous panel-led procurement, once the full scope was competitively tendered (client-reported, unverified by MMA). Concourse video wall mismatch was resolved within the first year. Spares holding fell 41% against the previous multi-supplier estate.

Frequently Asked Questions

Foundational context covering the market sizes, CAGR, scope, country, region and competition that inform every finding below. This section is provided to cover basics and most often pre-purchase conversations, answered from the MMA Primary Research Dataset.

What is the current size of the Large Format Display Market?

The market was worth USD 22.4 billion in 2025 and reaches USD 24.1 billion in 2026. Value covers commercial display products of 32 inches and above.

How large will the Large Format Display Market be by 2036?

MMA forecasts USD 50.1 billion by 2036, an increase of USD 26.0 billion across the forecast period. That represents 2.08 times the 2026 base of USD 24.1 billion.

What is the CAGR for the Large Format Display Market 2026 to 2036?

The base case compound annual growth rate is 7.6%, with a bull case at 8.8% and a bear case at 6.4%. Historical growth from 2020 to 2025 ran at 6.5%.

Which segment is growing fastest?

Fine pitch light emitting diode video walls grow at 11.4%, half again the market rate of 7.6%. They have no bezel and no size ceiling, unlike tiled liquid crystal.

Who are the major companies in the Large Format Display Market?

Samsung Electronics, LG Electronics, Leyard, Unilumin, and BOE Technology lead, holding 46% of shipment value between them. A large field of Chinese producers competes beneath them.

Which country is growing fastest?

India grows at 12.8%, funded through metro, airport, and civic infrastructure programmes that specify displays inside construction budgets. Retail modernisation adds a second demand stream.

Report Segmentation Architecture

The full report scope spans multiple orthogonal segmentation dimensions, with cross-tabulated demand data provided for each dimension pair. Coverage extends further to regional breakdowns, trend trajectories, and the competitive detail needed to support segment-level decision-making.

By Display Product Type

  • Liquid Crystal Digital Signage Panels
  • Fine Pitch Light Emitting Diode Video Walls
  • Interactive Flat Panel Displays
  • Outdoor Light Emitting Diode Billboard Displays
  • Hospitality and Institutional Televisions
  • Transparent and Specialty Displays

By End-Use Industry

  • Retail and Quick Service Restaurants
  • Transport and Public Infrastructure
  • Corporate and Commercial Offices
  • Education and Training Institutions
  • Hospitality, Leisure and Sports Venues
  • Broadcast, Control Rooms and Command Centres

By Commercial Dimension

  • Construction Specification Award
  • Systems Integrator Delivered
  • Distribution and Reseller Channel
  • Direct Enterprise Procurement
  • Retail Media Network Funded
  • Managed Display Service Contract

By Region

  • East Asia
  • North America
  • Western Europe
  • South Asia and Pacific
  • Latin America
  • Middle East and Africa
  • Eastern Europe

Scope, Methodology, and Coverage

Every figure in this report is reproducible from documented input assumptions. The scope below maps the historical period, the forecast horizon, the segmentation dimensions, and the countries covered, alongside the underlying primary and qualitative methodology.
Historical Period
2020 to 2025
Forecast Period
2026 to 2036
Base Year
2025 (USD billions; MMA Primary Research Dataset, September 2026)
Market Definition
The large format display market covers commercial display products of 32 inches and above, including liquid crystal digital signage panels, fine pitch light emitting diode video walls, interactive flat panel displays, outdoor light emitting diode billboard displays, hospitality and institutional televisions, and transparent and specialty displays. It excludes consumer televisions sold through retail, computer monitors, projection systems, mounting hardware sold separately, and independently licensed content management software.
Quantitative Units
USD billions, delivered shipment value
Segmentation Dimensions
Display product type, end-use industry, commercial dimension, region
Regions Covered
East Asia, North America, Western Europe, South Asia and Pacific, Latin America, Middle East and Africa, Eastern Europe
Countries Covered
China, Japan, South Korea, Taiwan, United States, Canada, Mexico, Germany, France, United Kingdom, Netherlands, Spain, Italy, India, Australia, Singapore, Indonesia, Brazil, Colombia, Chile, Saudi Arabia, United Arab Emirates, Qatar, South Africa, Nigeria, Poland, Czechia, Romania
Key Companies Profiled
Samsung Electronics, LG Electronics, Leyard, Unilumin, BOE Technology, Sharp NEC Display Solutions, Panasonic, Sony, TP Vision, Absen, Daktronics, Barco, ViewSonic, BenQ, Christie Digital, Planar Systems, Hisense, TCL, AUO, Innolux
Quantitative Methodology
Primary survey, n=3,800 respondents, Q4 2025, six countries; demand-side model with trade association cross-validation
Qualitative Methodology
47 expert interviews, Q4 2025; applied to validate demand model assumptions, identify emerging dynamics, and assess competitive positioning
Report Format
PDF and XLSX data workbook (Word format preview document)
Publisher
Market Minds Advisory
Report Code
MMA-2026-TEC-521
Published
September 2026
Contact
sales@marketmindsadvisory.com | www.marketmindsadvisory.com

Purchase the full Large Format Display Market Report (2026 to 2036).

The full report sizes the large format display market across six product types, seven regions, and twenty-eight countries, with forecasts to 2036 under base, bull, and bear cases. It examines why the panel represents only a third of deployment cost, what fine pitch light emitting diode changes about video wall specification, and how duty cycle undermines warranty economics across the installed base. Competitive analysis covers twenty participants evaluated consistently on shipment value, with detailed treatment of price erosion, batch matching commitments, and construction stage specification. Cost structure, margin architecture by product type, and regional deployment drivers are analysed in full. Primary research includes 3,800 survey responses and 47 expert interviews.
Six display product types sized and forecast separately
Twenty participants evaluated on delivered shipment value
Regional deployment and funding drivers across seven geographies
Margin architecture by product type and service capture
Deployment cost decomposition beyond panel pricing analysed
Duty cycle and field failure benchmarks by installation type

Built For The People Who Decide

From boardroom strategy to bench-side execution, this report is read cover-to-cover by leaders shaping the next decade of their industry, turning demand scenarios, market dynamics and valuation benchmarks into decisions.
CXOs/ Presidents/ VPs/ Managers
M&A and Corporate Development
Strategy Teams and R&D Heads
Procurement and Product Directors
Regulatory and Compliance Leaders
Investor Relations and Equity Analysts