Market Minds Advisory
Laboratory Balances and Scales Market

Laboratory Balances and Scales Market: Precision Measurement Meets Digital Compliance

Pharmaceutical quality control mandates, biotech R&D expansion, and tightening ISO 17025 calibration requirements are pushing laboratories worldwide toward connected, audit-ready balances, while low-cost Asian manufacturers challenge established precision instrument makers on price across mid-tier segments.

Lead Analyst

Alice Ballenger

Published

September 2026

Make Smarter Decisions with Customized Research Insights

Request a free sample report and evaluate market opportunities, growth trends, and competitive dynamics relevant to your business needs.

2025 MARKET VALUE$2.4BMarket Size 2025
2036 FORECAST VALUE$4.8BBase Case , 2026 to 2036
CAGR 2026 TO 20366.4 %Bull 7.6% / Bear 5.2%
INCREMENTAL OPPORTUNITY$2.2BNet 10- year value creation
EXPANSION MULTIPLE1.86x2036 value over 2026 base
Strategic Levers
M&A Pipeline
Regional Outlook
Country Rankings
Competitive Intelligence
Segmental Deep-dive
Call-Us : 91 93563 13602

Executive Snapshot and Market Trajectory

Laboratory balances and scales are shifting from standalone measurement devices to networked instruments feeding directly into laboratory information management systems, as pharmaceutical, biotech, and food-safety labs demand unbroken digital audit trails that satisfy regulators without manual transcription errors creeping into compliance records and audit workflows across regulated facilities.
Demand concentrates around pharmaceutical and biotechnology quality control, where analytical and micro-balances handling milligram-level active ingredient verification are growing fastest as generic drug manufacturing expands across India and China. Contract research and manufacturing organizations are replacing analog bench scales with connected units in bulk equipment refresh cycles. East Asia's manufacturing base and North America's biotech R&D concentration generate the largest share of new placements worldwide each year.
Competition splits between legacy precision instrument makers defending laboratory-grade accuracy and calibration traceability, and aggressive mid-market entrants from China undercutting on acquisition price alone. Tightening ISO 17025 accreditation requirements and pharmacopeia data-integrity rules are forcing even budget manufacturers to add electronic audit logging, narrowing the feature gap that once separated premium brands from cheaper alternatives. Software subscription revenue is emerging as a meaningful new margin layer for established players expanding into recurring service contracts steadily.
Market Definition
The Laboratory Balances and Scales Market covers analytical, precision, micro, and industrial-grade weighing instruments used for quantitative measurement in pharmaceutical, biotechnology, chemical, food, and academic research laboratories. It includes benchtop and portable units, moisture analyzers with integrated weighing cells, and their associated calibration and connectivity software. Retail and logistics weighing equipment, and non-laboratory industrial platform scales used purely for bulk material handling, are excluded from this scope.
Base Year Value
$2.4B in 2025 (MMA Primary Research Dataset, August 2026)
Forecast Period
2026 to 2036, eleven discrete annual values
CAGR
6.4% base case. Bull 7.6%. Bear 5.2%.
Fastest Growth Segment
Micro and Ultra-Micro Analytical Balances: 9.8% CAGR
Fastest Growth Country
India: 10.2% CAGR
Fastest Growth Region
South Asia and Pacific: 8.4% CAGR
Largest Region
East Asia: 27% of 2025 global value
Market Leaders
Mettler-Toledo International Inc., Sartorius AG, Shimadzu Corporation, OHAUS Corporation, and A&D Company Limited. Source: MMA Analysis based on company annual reports.
Primary Survey
n=3,800 procurement and R&D decision-makers, Q4 2025, six countries
Methodology
Demand-side build-up, cross-validated against public data, 47 expert interviews

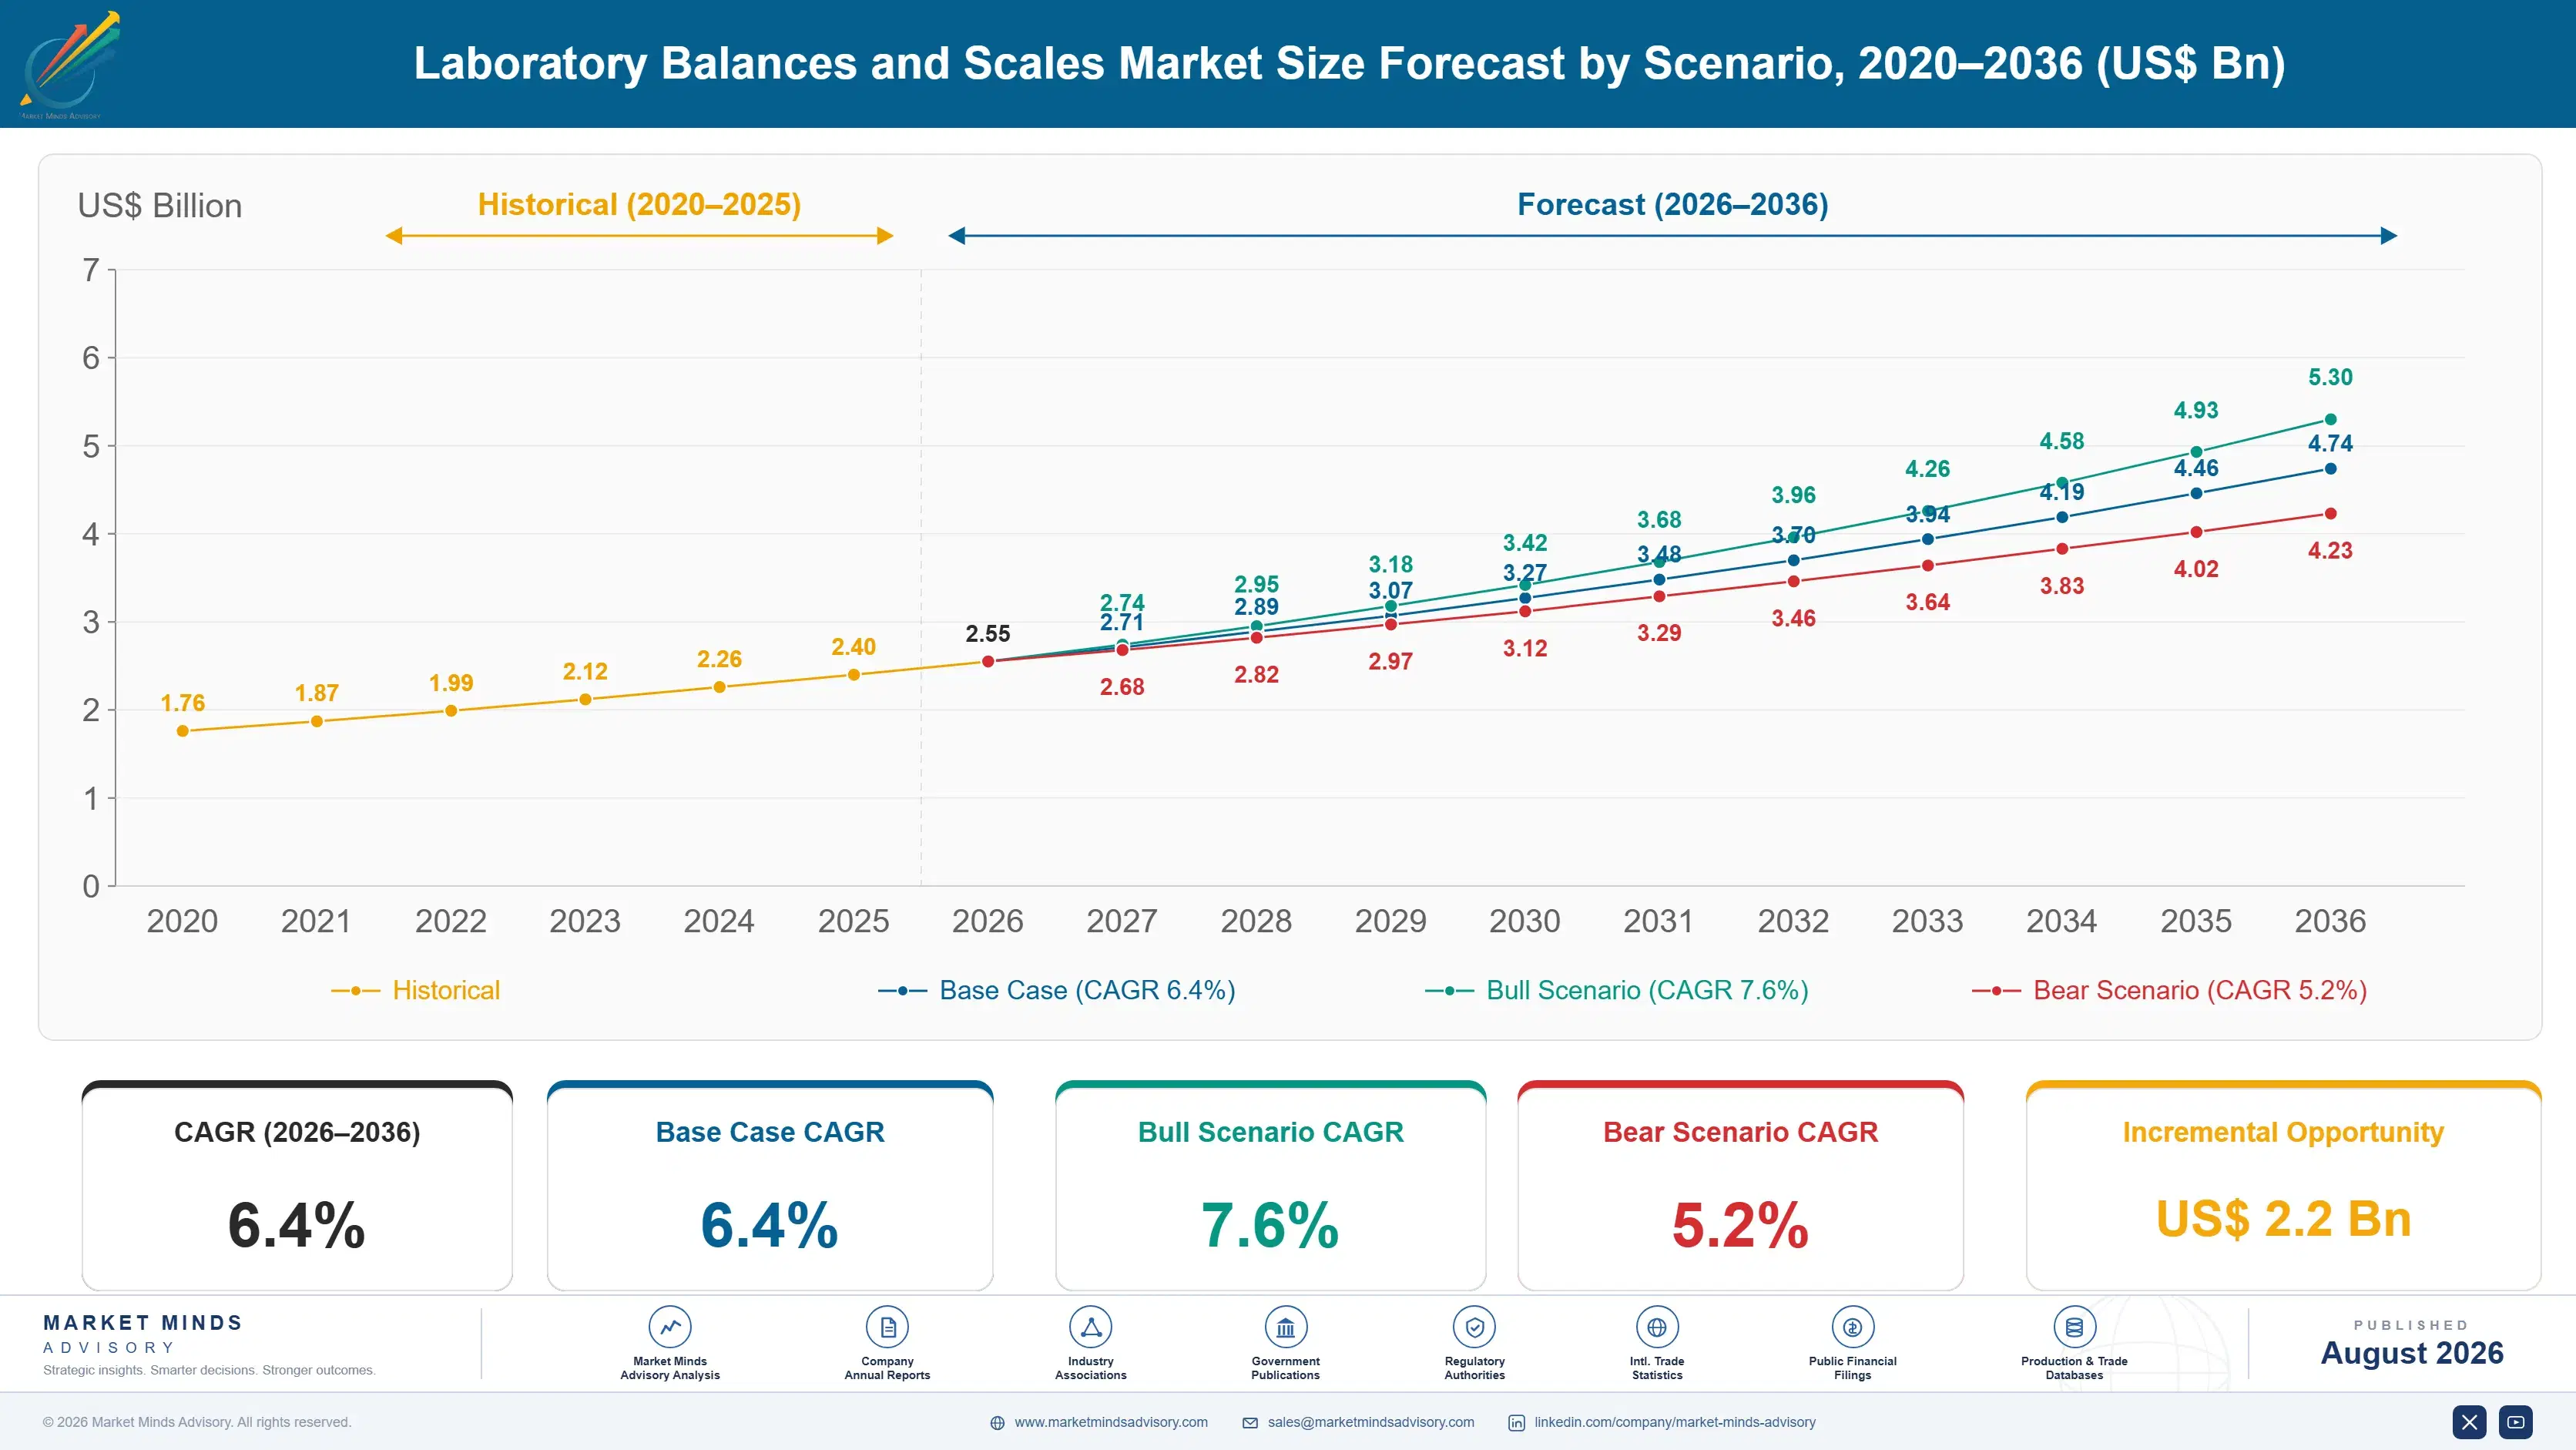
Laboratory Balances and Scales Market Forecast Scenarios

laboratory-balances-and-scales-market-size-forecast-scenario-1787304655987
Laboratory balance demand grew steadily between 2020 and 2025 at roughly 5.4 percent annually, supported by pandemic-driven diagnostic testing capacity expansion and steady replacement of analog units. Growth decelerated briefly in 2022 as component shortages delayed electronic balance shipments, before pharmaceutical capital spending and biotech funding recovered through 2024 and 2025, restoring order backlogs across most regional distributor networks nationwide.
The base case assumes 6.4 percent annual growth through 2036, anchored on three mechanisms: continued generic and biosimilar drug manufacturing expansion across India and China requiring in-process quality control instrumentation, tightening pharmacopeia and ISO 17025 data-integrity mandates forcing replacement of non-compliant analog balances, and rising academic and government research laboratory budgets in South Asia funding new instrument purchases. Contract manufacturing and testing laboratories are also standardizing fleet-wide on connected balance platforms to simplify multi-site calibration audits.
A bull scenario, at 7.6 percent, assumes accelerated cell and gene therapy manufacturing capacity buildout drives premium micro-balance demand faster than currently modeled. A bear scenario, at 5.2 percent, assumes pharmaceutical capital spending slows if generic drug pricing pressure squeezes contract manufacturer margins, delaying instrument fleet upgrades. Currency volatility across emerging manufacturing hubs adds further variance to near-term regional order timing.

Precision Measurement Meets Digital Compliance

Laboratory weighing instrumentation sits at the intersection of pharmaceutical quality assurance, academic research funding cycles, and industrial process control, giving the category unusually diverse but stable demand across economic cycles and geographies. Regulatory data-integrity requirements increasingly function as a forced replacement driver independent of underlying laboratory budget growth, since non-compliant analog units simply cannot be certified for regulated testing environments a
MARKET CONCENTRATION (CR5)42%Top five instrument makers hold meaningful but incomplete leadership
AVERAGE SELLING PRICE$1,850Analytical balances command premium pricing over industrial platform units
TOP PRODUCING COUNTRY SHARE34%China anchors global manufacturing capacity for mid-tier balance production
CAPACITY UTILIZATION76%Manufacturers run comfortably below peak amid steady order visibility
TRADE INTENSITY58%Balances cross borders extensively between manufacturing hubs and end markets
ELECTRONICS COST SHARE31%Load cell and sensor components dominate total input cost structure
Commercially, the market splits between a handful of full-line precision instrument makers serving regulated pharmaceutical and biotech customers at premium price points, and a fragmented tier of Asian manufacturers competing on acquisition cost for academic, food-testing, and light-industrial applications. Distribution runs through both direct technical sales for high-value analytical balances and broad distributor networks for standard bench units across most regions and customer segments served today.
Connectivity and software integration will define competitive position over the next decade more than raw measurement accuracy, which has largely plateaued across premium brands. Vendors able to bundle calibration management software, cloud audit trails, and predictive maintenance alerts into hardware sales are positioned to capture a growing share of laboratory instrumentation budgets industry-wide over time, particularly among regulated pharmaceutical customers standardizing multi-site fleets.
"Balance manufacturers spent a decade competing on the fourth decimal place of accuracy. The real fight now is over who owns the audit trail."
Director, Laboratory Instrumentation Practice · MMA Industrial and Laboratory Eq

Market Trends

IoT-Enabled Balances Replace Standalone Analog Units

Laboratory networks are standardizing on balances with built-in Ethernet or Wi-Fi connectivity that stream weight readings directly into laboratory information management systems, eliminating manual transcription steps that regulators increasingly flag during pharmaceutical inspections. Sartorius, Mettler-Toledo, and Shimadzu have all expanded connected-balance product lines since 2023, bundling cloud calibration scheduling and electronic signature capture as standard features rather than costly add-ons. Contract testing laboratories report meaningfully faster batch release cycles after adopting connected fleets, since results post automatically without secondary data entry. Around 38 percent of new analytical balance shipments in 2025 included connectivity, up from 19 percent in 2021.
Market Impact: Anchors demand across 200-plus new
Moisture Analysis Integration Expands Beyond Pharma

Moisture analyzers, which combine a precision balance with a halogen or infrared heating element to measure loss on drying, are expanding beyond pharmaceutical quality control into food safety, plastics recycling, and agricultural commodity testing. Grain exporters and recycled-plastics processors increasingly specify moisture analyzers alongside standard balances to meet buyer contract moisture-content tolerances before shipment. Manufacturers including Sartorius and Mettler-Toledo have broadened moisture analyzer product tiers to serve these lower-cost industrial buyers without cannibalizing pharmaceutical-grade product lines. Unit shipments into food and agricultural end markets grew an estimated 11 percent in 2025 alone, outpacing the category's broader average growth rate meaningfully.
Market Impact: Shortens replacement cycle to 7-8 y

Market Opportunities and Growth Drivers

Generic Drug Manufacturing Expansion Across Asia

India and China continue expanding generic and biosimilar drug manufacturing capacity, with India's Pharmaceuticals Export Promotion Council reporting sustained double-digit growth in bulk drug and formulation export volume through 2025. Each new formulation line requires in-process quality control balances calibrated to pharmacopeia tolerances, creating predictable instrument demand tied directly to facility commissioning schedules rather than discretionary laboratory budget cycles. Contract manufacturing organizations expanding capacity across Telangana, Gujarat, and Zhejiang are standardizing procurement on a small number of qualified vendors to simplify multi-site validation. This favors established precision instrument makers with strong regional service networks already in place.
Market Impact: Cuts mid-tier pricing 40-55% below

Tightening Data-Integrity Regulation Forces Fleet Replacement

Pharmacopeia and FDA data-integrity expectations increasingly require weighing instruments to generate tamper-evident electronic records with full audit trails, a standard that most analog and first-generation digital balances installed before 2015 cannot meet. Regulated laboratories facing inspection findings related to data integrity are replacing entire balance fleets rather than upgrading individual units, since mixed fleets complicate validation documentation. This dynamic has shortened the effective replacement cycle from roughly twelve years to seven or eight years across pharmaceutical and contract testing facilities. Instrument makers have responded by offering fleet-wide replacement financing programs to capture these accelerated cycles.
Market Impact: Adds weeks-long delays across 30-pl

Market Restraints and Challenges

Price Competition From Low-Cost Asian Entrants

A growing tier of Chinese and Indian manufacturers now offers analytical-grade balances at 40 to 55 percent below established Western and Japanese brand pricing, eroding margins for mid-tier product lines in academic and light-industrial channels. The root cause is component commoditization: load cells, strain gauges, and microprocessor boards are now available from a broad qualified supplier base that low-cost entrants can access on comparable terms to established makers. The impact falls hardest on distributors carrying mid-market brands, who face shrinking margin on bench balances. Established makers are shifting mid-tier development toward connectivity and software features budget competitors have not replicated.
Market Impact: Drives 38% connectivity adoption in

Calibration and Service Network Gaps in Emerging Markets

Laboratories in parts of Latin America, Africa, and Southeast Asia often lack accredited calibration service providers within reasonable travel distance, forcing instruments to sit out of service for weeks awaiting a certified technician visit. The root cause is that accreditation bodies have been slow to certify local calibration laboratories outside major metropolitan centers, leaving instrument makers to fly in specialists for routine annual recertification. This raises total cost of ownership and discourages smaller laboratories from upgrading to instruments requiring frequent professional calibration. Manufacturers are mitigating the gap by training regional distributor technicians and deploying remote verification software to extend certification intervals.
Market Impact: Adds 11% food-testing shipment grow
3 additional market trends, 2 additional growth drivers, and 4 additional restraints and challenges are covered in the full report. Contact sales@marketmindsadvisory.com to access the complete intelligence.

Segment CAGR and Growth Architecture

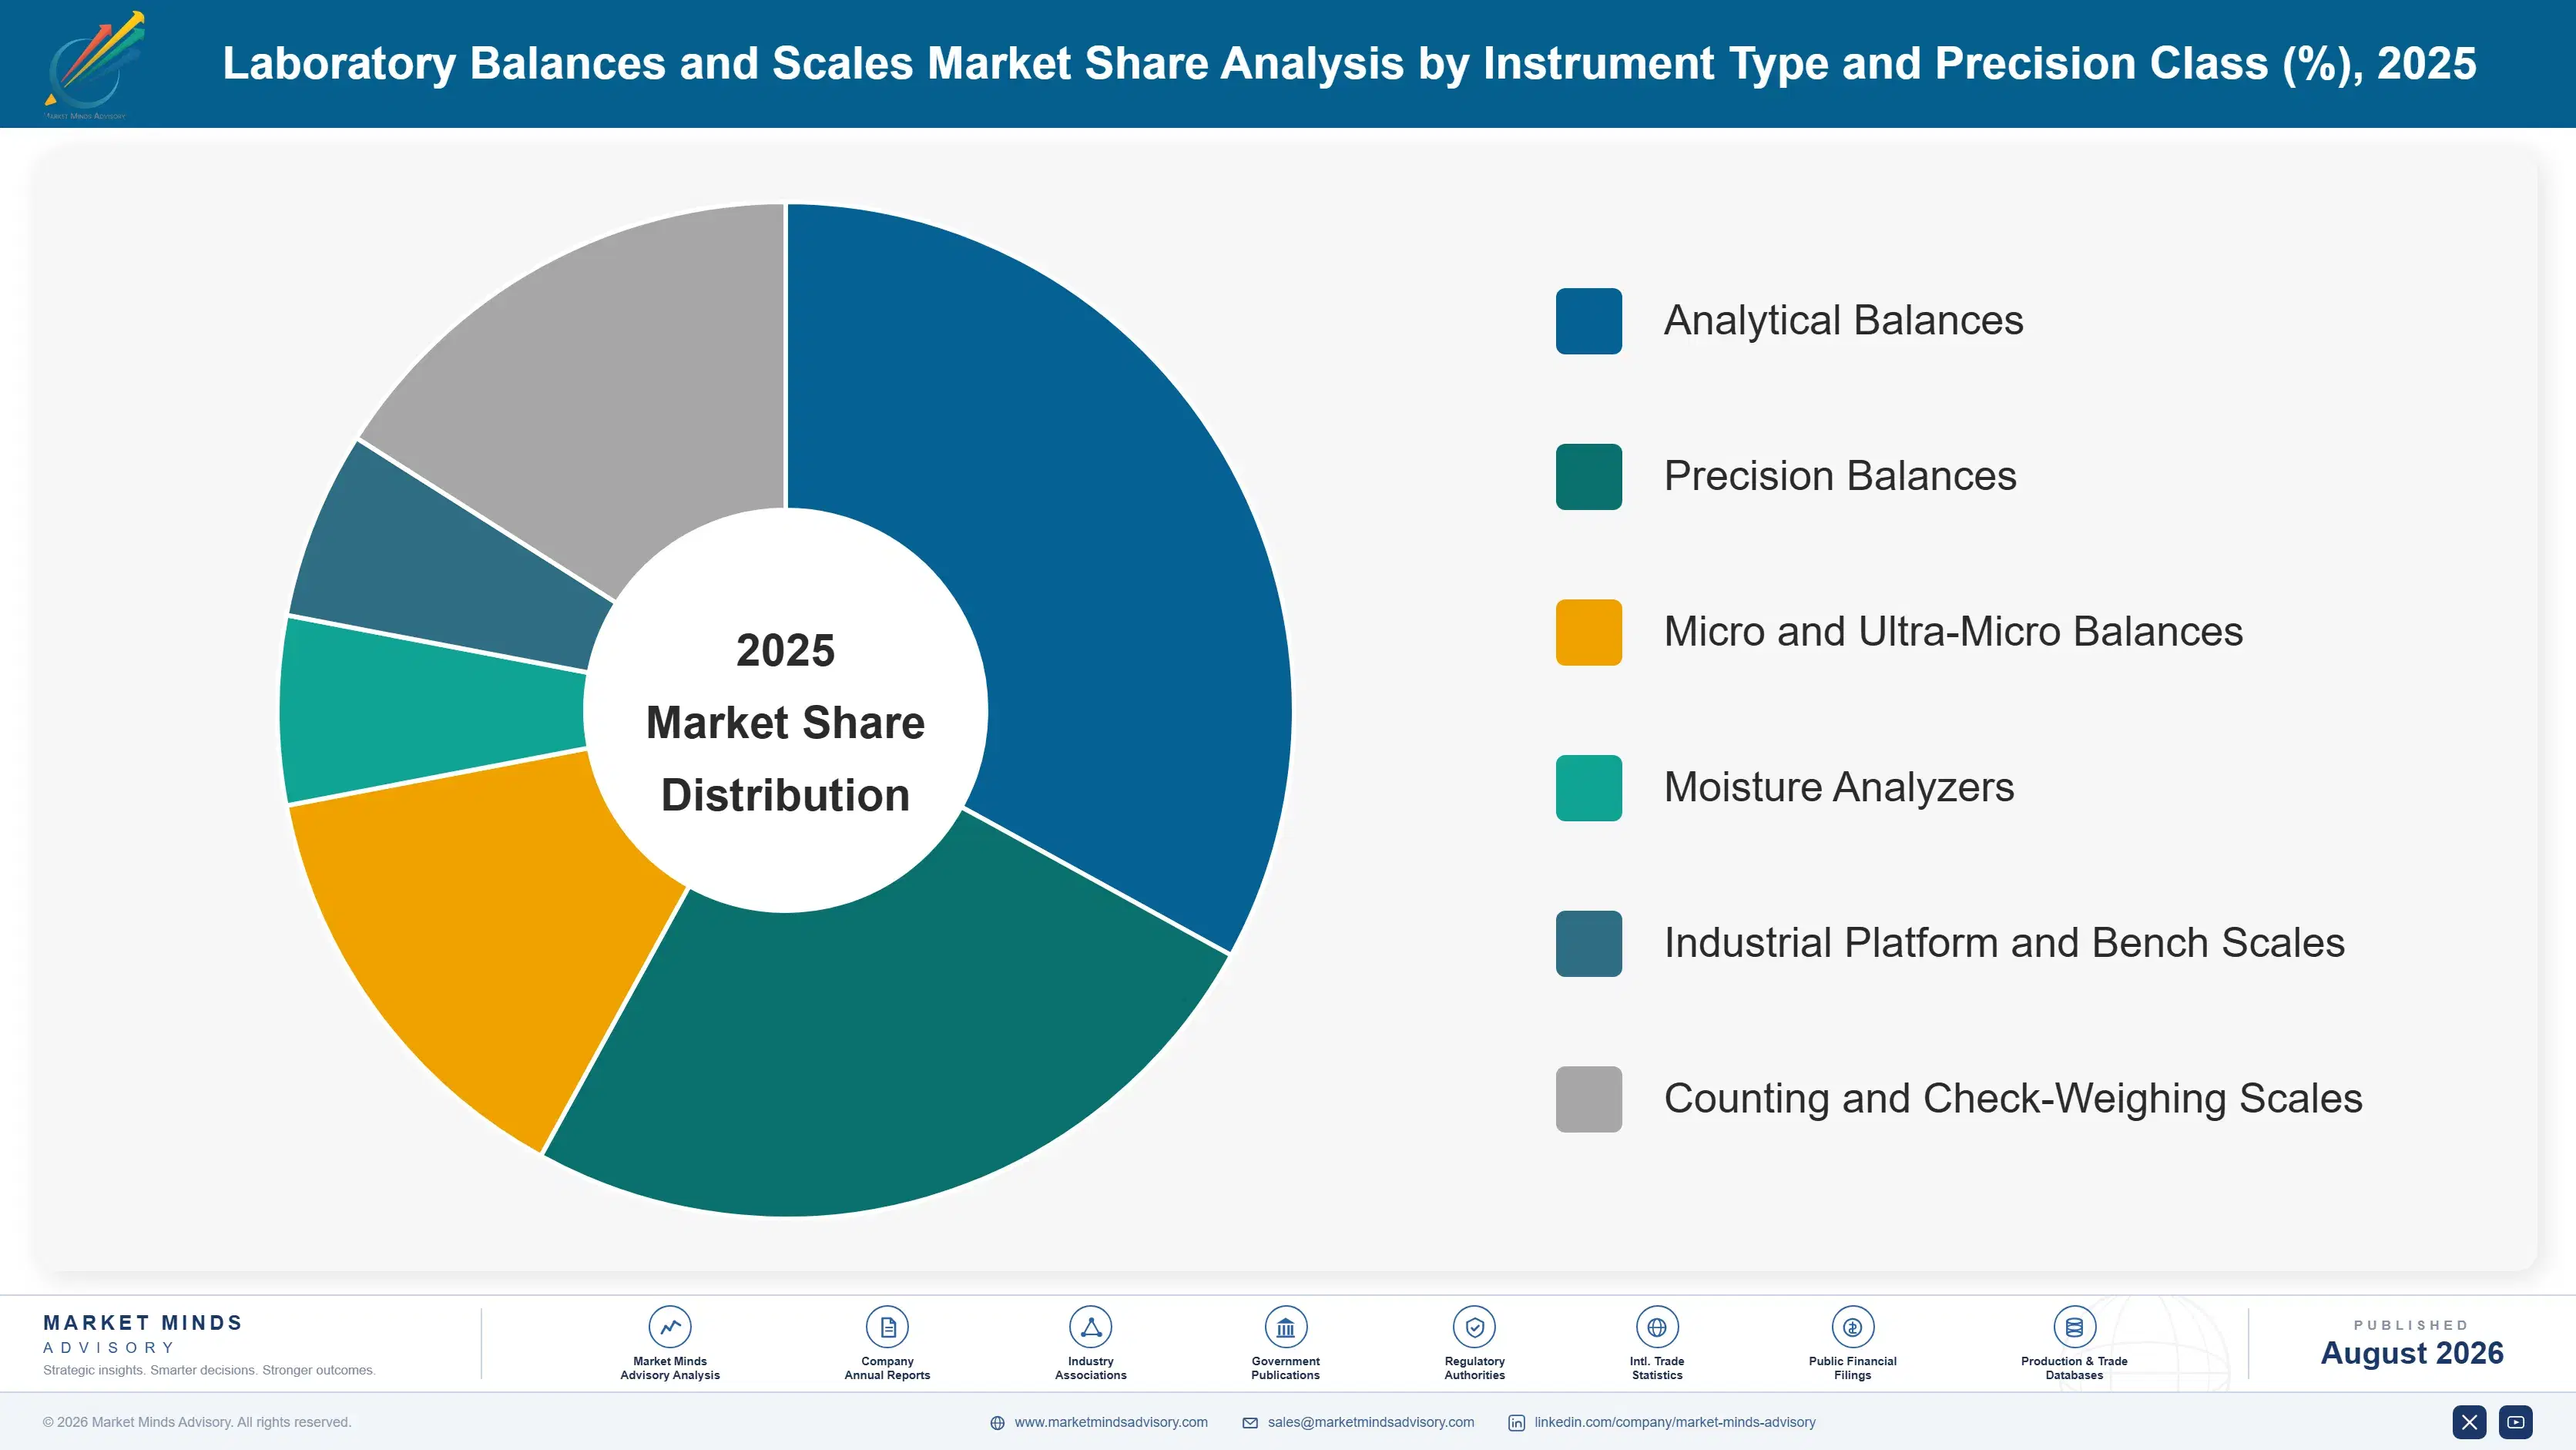
Segmentation follows instrument type and precision class, the classification laboratories themselves use for procurement, calibration protocol assignment, and pharmacopeia compliance documentation, rather than end-use application or distribution channel. Six segments span the full precision range from ultra-micro analytical balances through industrial platform scales, keeping each category mutually exclusive by measurable readability and capacity specification.
laboratory-balances-and-scales-market-market-share-analysis-1787304656528

Micro and Ultra-Micro Analytical Balances

Micro and ultra-micro balances, capable of readability down to one microgram, serve active pharmaceutical ingredient verification, forensic trace analysis, and cell and gene therapy formulation work where sample quantities are measured in single-digit milligrams. Demand is growing fastest of any segment as biopharmaceutical manufacturers scale cell and gene therapy production, a category requiring exceptionally precise dosing verification at every formulation step. Sartorius and Mettler-Toledo dominate this segment given the metrology expertise required to maintain microgram-level accuracy under real laboratory vibration and airflow conditions, a barrier smaller competitors have struggled to clear. Unit prices run several multiples above standard analytical balances, making this segment disproportionately profitable despite comparatively low shipment volume across the broader instrument category overall today.
CAGR 9.8%

Moisture Analyzers

Moisture analyzers combine a precision balance with a halogen, infrared, or microwave heating element to determine loss-on-drying moisture content in a single automated measurement cycle, replacing slower oven-drying reference methods across pharmaceutical, food, and agricultural laboratories. Growth is accelerating as food exporters and grain processors adopt moisture specification testing to meet buyer contract tolerances before shipment, a requirement that barely existed in this channel a decade ago. Pharmaceutical formulation laboratories also rely on moisture analyzers to verify tablet and powder stability during development, tying demand to new drug pipeline activity. Manufacturers including Sartorius, Mettler-Toledo, and A&D Company have broadened moisture analyzer tiers specifically to reach lower-cost industrial buyers without diluting pharmaceutical-grade product positioning.
CAGR 8.6%
Full segment breakdown across 6 segments available in the complete report.

Regional Architecture and Country Demand Map

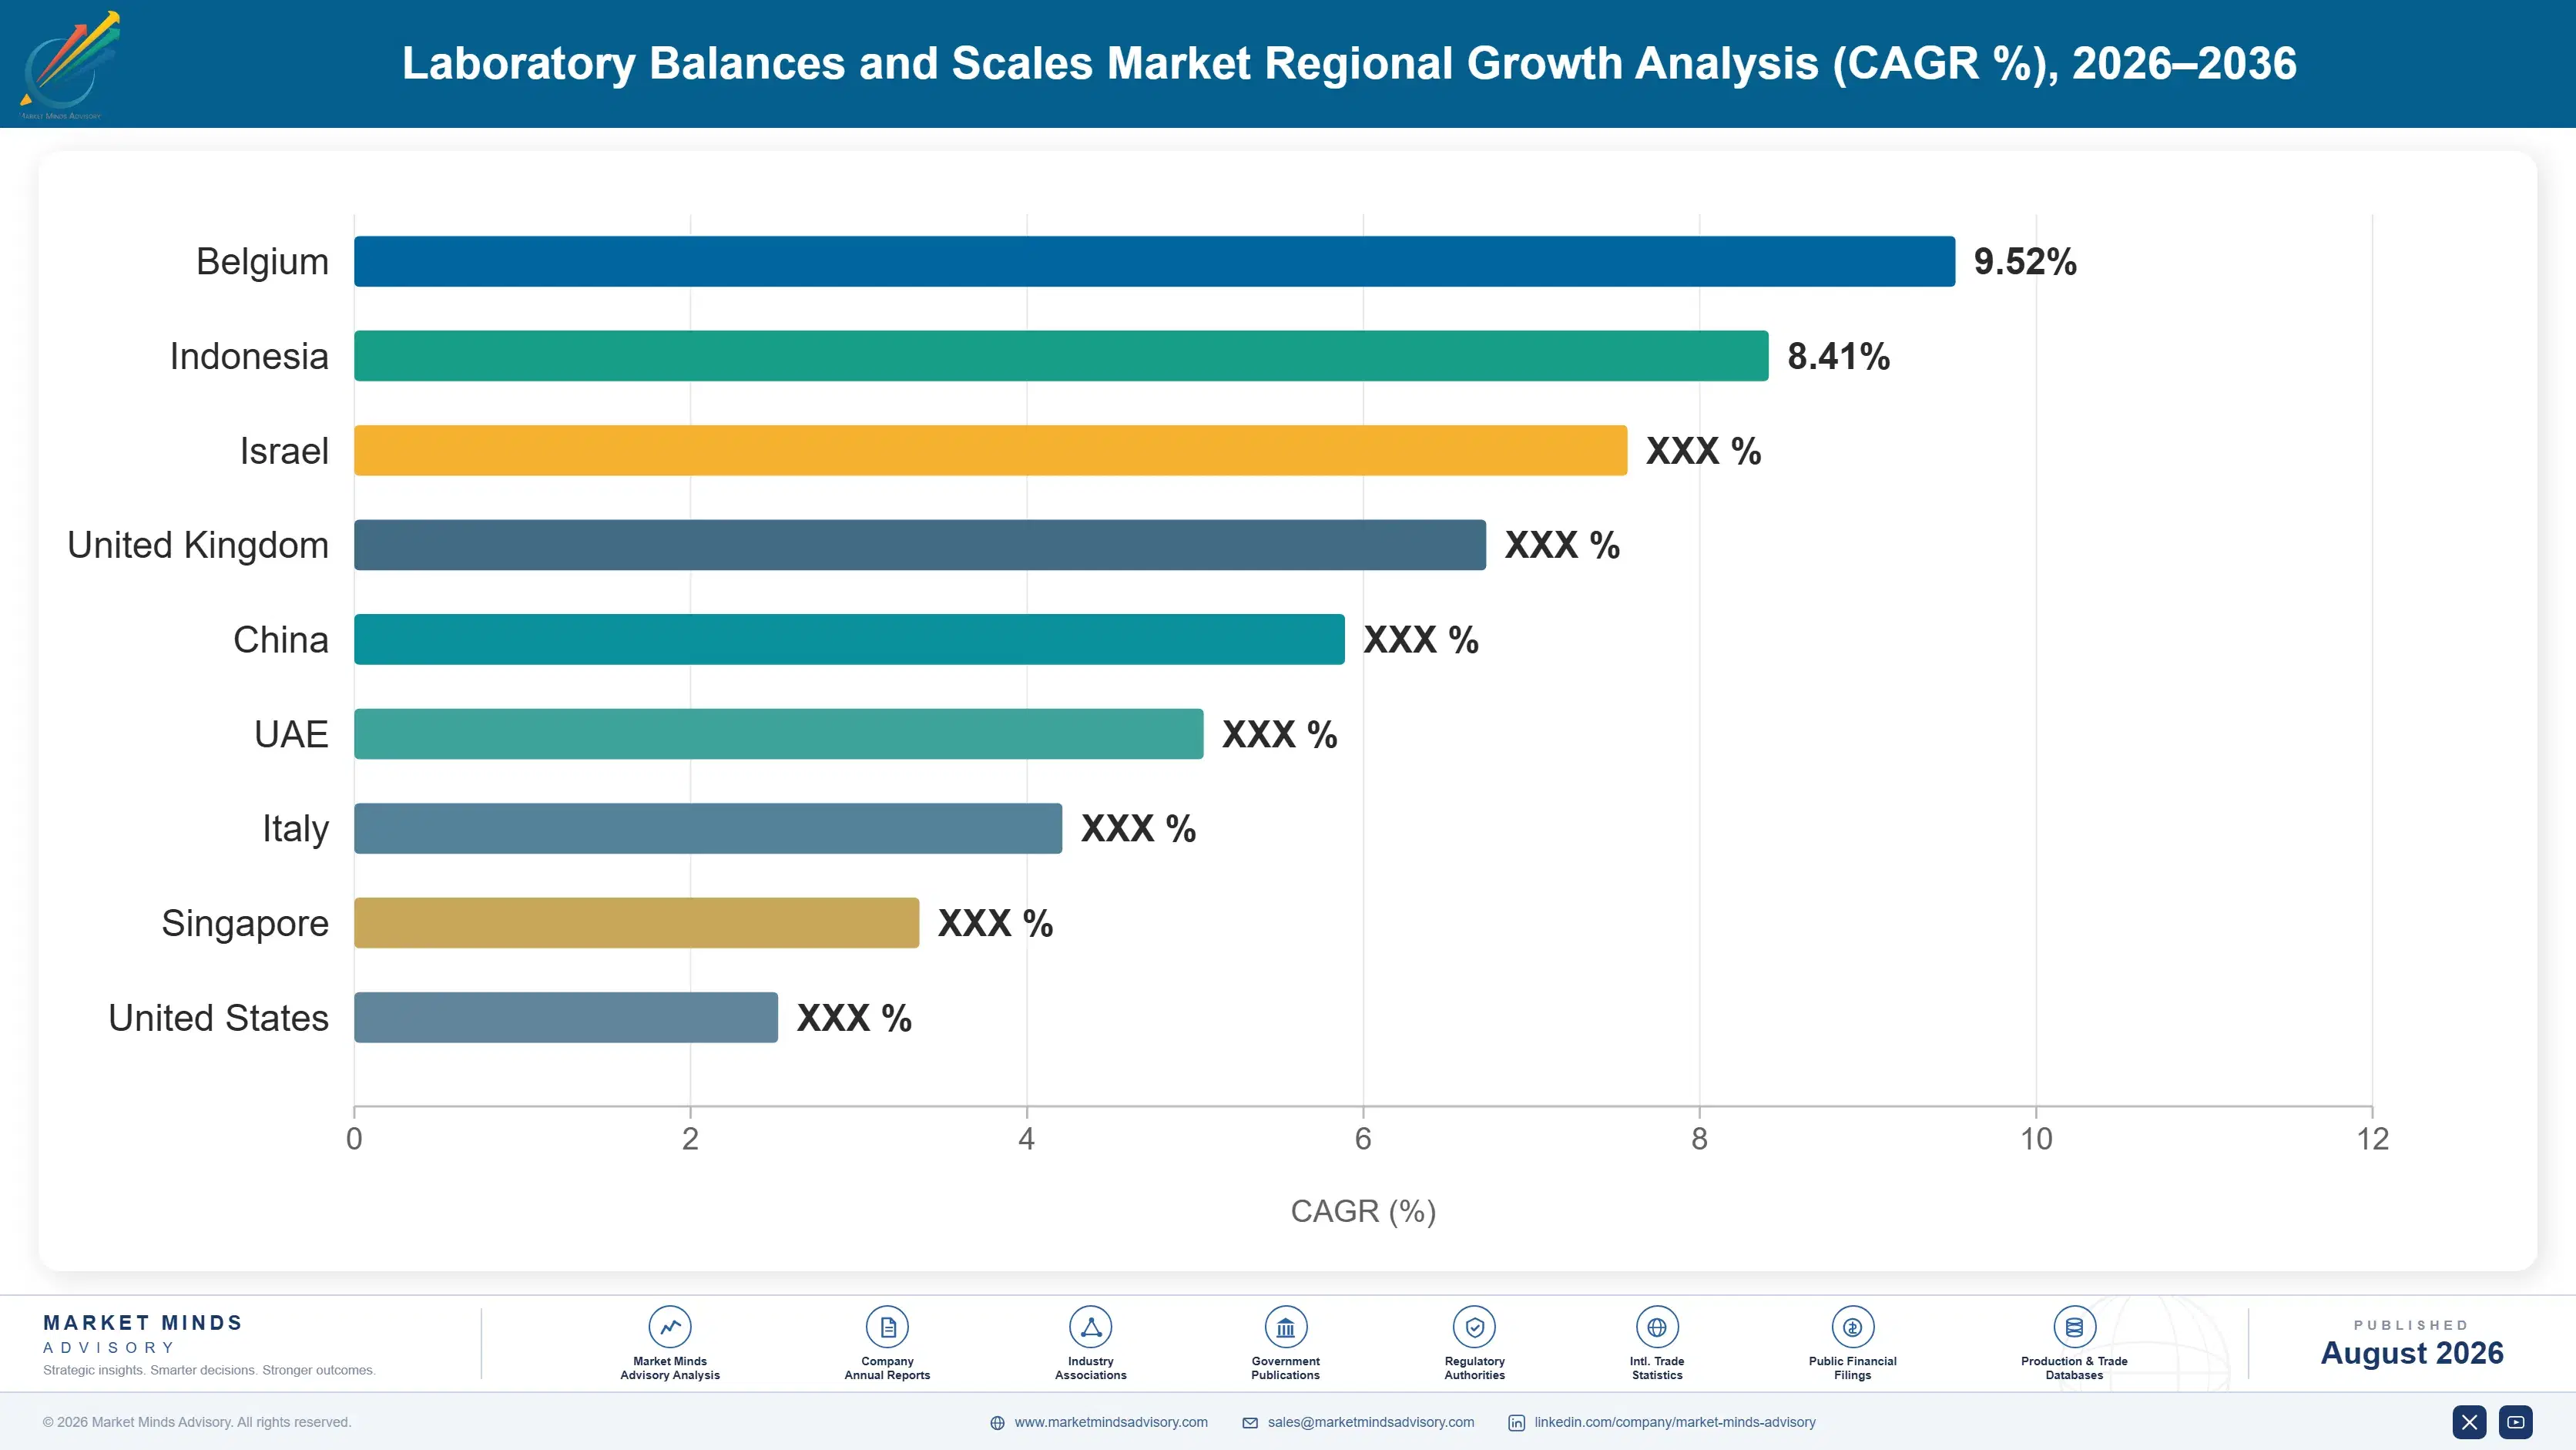
Laboratory balance demand concentrates where pharmaceutical manufacturing, biotech research funding, and academic laboratory density are highest. East Asia's manufacturing base, North America's biotech research spending, and Western Europe's precision instrument heritage together account for the large majority of global installed base and annual unit shipments worldwide today.

North America

Biotechnology research funding anchors North American demand, with the National Institutes of Health and privately funded biotech clusters in Massachusetts, California, and North Carolina sustaining a steady pipeline of new laboratory buildouts each year. Contract research organizations expanding cell and gene therapy manufacturing capacity are among the largest single buyers of micro and ultra-micro balances in the region, often standardizing entire multi-site fleets on a single qualified vendor to simplify FDA validation documentation. Food safety testing laboratories and environmental testing labs add a steady secondary demand layer independent of pharmaceutical cycles. Replacement demand, driven by tightening data-integrity expectations during FDA inspections, is proving a more reliable growth driver than net-new laboratory formation across the region currently.
Share: 26% | CAGR: 6.8% (2026 to 2036)

Western Europe

Precision instrument manufacturing heritage defines Western Europe's position more than end-market demand alone, since Switzerland and Germany host the headquarters and primary production facilities of Mettler-Toledo, Sartorius, and several specialist balance makers serving global export markets from European plants. Domestic demand centers on pharmaceutical quality control in Germany, France, and Ireland's large contract manufacturing sector, alongside academic research funding across the region's dense university laboratory network. Stricter German and French calibration accreditation standards keep replacement cycles shorter than the global average, sustaining steady fleet renewal demand even where net-new laboratory construction has slowed. Currency strength has periodically pressured export competitiveness against Asian manufacturers on price-sensitive mid-tier product lines sold outside the region.
Share: 24% | CAGR: 4.9% (2026 to 2036)
Regional intelligence for 5 additional markets available in the complete report: East Asia, South Asia and Pacific, Latin America, Middle East and Africa, Eastern Europe. Contact sales@marketmindsadvisory.com.
laboratory-balances-and-scales-market-country-cagr-analysis-1787304657064

Where Balance Makers Can Capture More Margin

Instrument makers face a market where hardware pricing is under sustained pressure from low-cost entrants, making recurring revenue streams and defensible technical differentiation increasingly central to profitability. Four levers stand out: software and calibration subscription attachment, regulatory compliance bundling, service network depth in underserved regions, and application-specific product development for high-growth pharmaceutical manufacturing segments worldwide.

Attach Calibration Software Subscriptions To Hardware Sales

Manufacturers bundling cloud-based calibration scheduling, electronic audit trail, and remote diagnostic software with balance hardware sales are converting a one-time equipment purchase into a recurring revenue relationship worth an estimated 8 to 12 percent of original hardware value annually. Sartorius and Mettler-Toledo have both expanded subscription software tiers since 2023, reporting attach rates climbing well above early expectations among regulated pharmaceutical customers who value simplified multi-site compliance reporting over marginal hardware cost savings. This shift also deepens customer lock-in, since laboratories invested in a vendor's software platform face switching costs when evaluating competing hardware at the next refresh.
Market Impact: Adds 8-12% recurring software reven

Bundle Regulatory Compliance Documentation With Instrument Sales

Rather than selling balances as standalone hardware, leading manufacturers now bundle pre-validated qualification documentation packages, including installation, operational, and performance qualification protocols, that save regulated laboratories weeks of internal validation work per instrument. This bundling commands a price premium of roughly 15 to 20 percent over unbundled hardware while meaningfully shortening customer time-to-compliance, a value proposition that resonates strongly with pharmaceutical quality assurance teams facing constant inspection readiness pressure. Distributors report that bundled compliance packages have become a decisive purchase factor in competitive tenders, particularly among contract manufacturing organizations managing multiple simultaneous facility qualifications across different markets.
Market Impact: Commands a 15-20% price premium on

Expand Certified Service Networks Into Underserved Regions

Manufacturers extending accredited calibration service coverage into secondary cities across Latin America, Africa, and Southeast Asia are capturing service revenue that previously went uncaptured or drove customers toward instruments requiring less frequent professional recertification. Building a regional calibration laboratory network requires meaningful upfront investment, but manufacturers report service revenue per installed unit climbing by roughly 25 percent within three years of establishing local coverage, since customers no longer defer calibration visits due to technician travel cost and scheduling delays. This expansion also strengthens competitive position against low-cost entrants that typically offer minimal local service infrastructure of their own.
Market Impact: Lifts service revenue per installed

Develop Application-Specific Balances For Cell And Gene Therapy

Cell and gene therapy manufacturing requires exceptionally precise dosing verification at microgram scale under cleanroom conditions that standard analytical balances were not originally engineered to satisfy, creating an opening for purpose-built instrument variants with enhanced vibration isolation and cleanroom-compatible housings. Early movers developing application-specific product lines for this segment are commanding price points running 30 to 40 percent above standard micro-balance equivalents, reflecting both engineering differentiation and the segment's currently limited qualified supplier base. As cell and gene therapy manufacturing capacity expands globally, manufacturers positioned early in this niche are securing multi-year supply relationships with biopharmaceutical customers ahead of broader entry.
Market Impact: Commands a 30-40% price premium ove

Who Controls the Margin Pool

Five companies, Mettler-Toledo, Sartorius, Shimadzu, OHAUS, and A&D Company, hold an estimated 42 percent of global revenue on a company-revenue basis, leaving a long tail of regional and specialist manufacturers competing for the remainder. Mettler-Toledo leads by a meaningful margin over the next closest challenger, reflecting decades of accumulated pharmaceutical customer relationships and calibration service infrastructure that smaller rivals have struggled to replicate at comparable scale.
Current competitive activity centers on three dimensions: connectivity and software feature parity, calibration service network expansion into underserved regions, and application-specific product development for cell and gene therapy manufacturing. Established brands are also defending mid-tier pricing through simplified product lines aimed directly at cost-sensitive Asian competitors, a departure from their traditional premium-only positioning strategy across most channels.

Emerging pressure comes primarily from Chinese manufacturers moving up the value chain into analytical-grade balances with genuine metrology credibility, no longer confined to basic industrial platform scales. If these entrants close the accuracy and connectivity gap meaningfully within the next several years, mid-tier rankings could shift faster than the premium segment, where accumulated pharmaceutical validation history remains a durable barrier smaller challengers cannot quickly replicate today.
laboratory-balances-and-scales-market-company-positioning-matrix-1787304657589

Competitive Moat and Risk Dimensions

METTLER-TOLEDO INTERNATIONAL INC.

Moat: Pharmaceutical Validation History Depth

Mettler-Toledo has accumulated decades of pharmaceutical customer validation documentation and calibration service relationships that competitors cannot replicate quickly, since regulated laboratories strongly prefer sticking with vendors whose qualification protocols inspectors already recognize from prior successful facility audits and inspections across multiple regulatory jurisdictions worldwide.
METTLER-TOLEDO INTERNATIONAL INC.

Risk: Premium Pricing Under Pressure

Mettler-Toledo's premium pricing position faces growing pressure from Chinese manufacturers now offering comparable core accuracy at meaningfully lower cost, particularly in mid-tier academic and industrial channels where brand loyalty carries less weight than acquisition price among increasingly price-sensitive laboratory buyers today across most emerging markets.
SARTORIUS AG

Moat: Bioprocessing Platform Integration

Sartorius benefits from deep integration between its balance product line and its broader bioprocessing equipment portfolio, giving it privileged access to biopharmaceutical manufacturing customers already standardized on Sartorius filtration and bioreactor systems elsewhere across their production facilities and global manufacturing networks currently expanding.
SARTORIUS AG

Risk: Bioprocessing Cyclicality Exposure

Sartorius's balance business is increasingly tied to biopharmaceutical capital spending cycles through its bundled bioprocessing relationships, exposing instrument revenue to funding slowdowns in biotech venture capital and capital equipment budgets that standalone balance competitors are less directly exposed to overall across most markets.

Players Tracked

Prominent Players

Mettler-Toledo International Inc.
Sartorius AG
Shimadzu Corporation
OHAUS Corporation
A&D Company Limited

Other Key Players

Kern & Sohn GmbH
Adam Equipment Co Ltd
Radwag Balances and Scales
Precisa Gravimetrics AG
Avery Weigh-Tronix
Minebea Intec
Rice Lake Weighing Systems
Scientech Inc.
Torbal LLC
Gibertini Elettronica Srl
Essae Digitronics Pvt Ltd
Wensar Weighing Systems Pvt Ltd
Contech Instruments Ltd
Citizen Scales India Pvt Ltd
Shinko Denshi Co Ltd

Recent Developments

MARCH 2025

Sartorius Expands Cloud Calibration Software Platform

Sartorius launched an expanded cloud-based calibration management platform integrating directly with its analytical and micro-balance product lines, an organic product development rather than an acquisition, enabling multi-site pharmaceutical customers to centralize audit trail documentation and calibration scheduling across globally distributed laboratory facilities from a single dashboard.
Signal: Established manufacturers are increasingly
SEPTEMBER 2024

Mettler-Toledo Acquires Precision Load Cell Component Maker

Mettler-Toledo completed the acquisition of a specialty load cell component manufacturer, securing dedicated internal supply of a critical precision sensing component rather than continuing to rely solely on third-party component suppliers for its highest-precision analytical and micro-balance product lines going forward across its global manufacturing footprint.
Signal: Leading balance manufacturers are backward
JANUARY 2025

OHAUS Signs Distribution Agreement With Southeast Asian Partner

OHAUS signed a multi-year distribution and calibration service agreement, not an acquisition or joint venture, with a regional distributor to expand certified service coverage across Vietnam, Thailand, and the Philippines, addressing a service network gap that had previously slowed adoption of higher-precision instruments in the region.
Signal: Manufacturers are formalizing regional ser

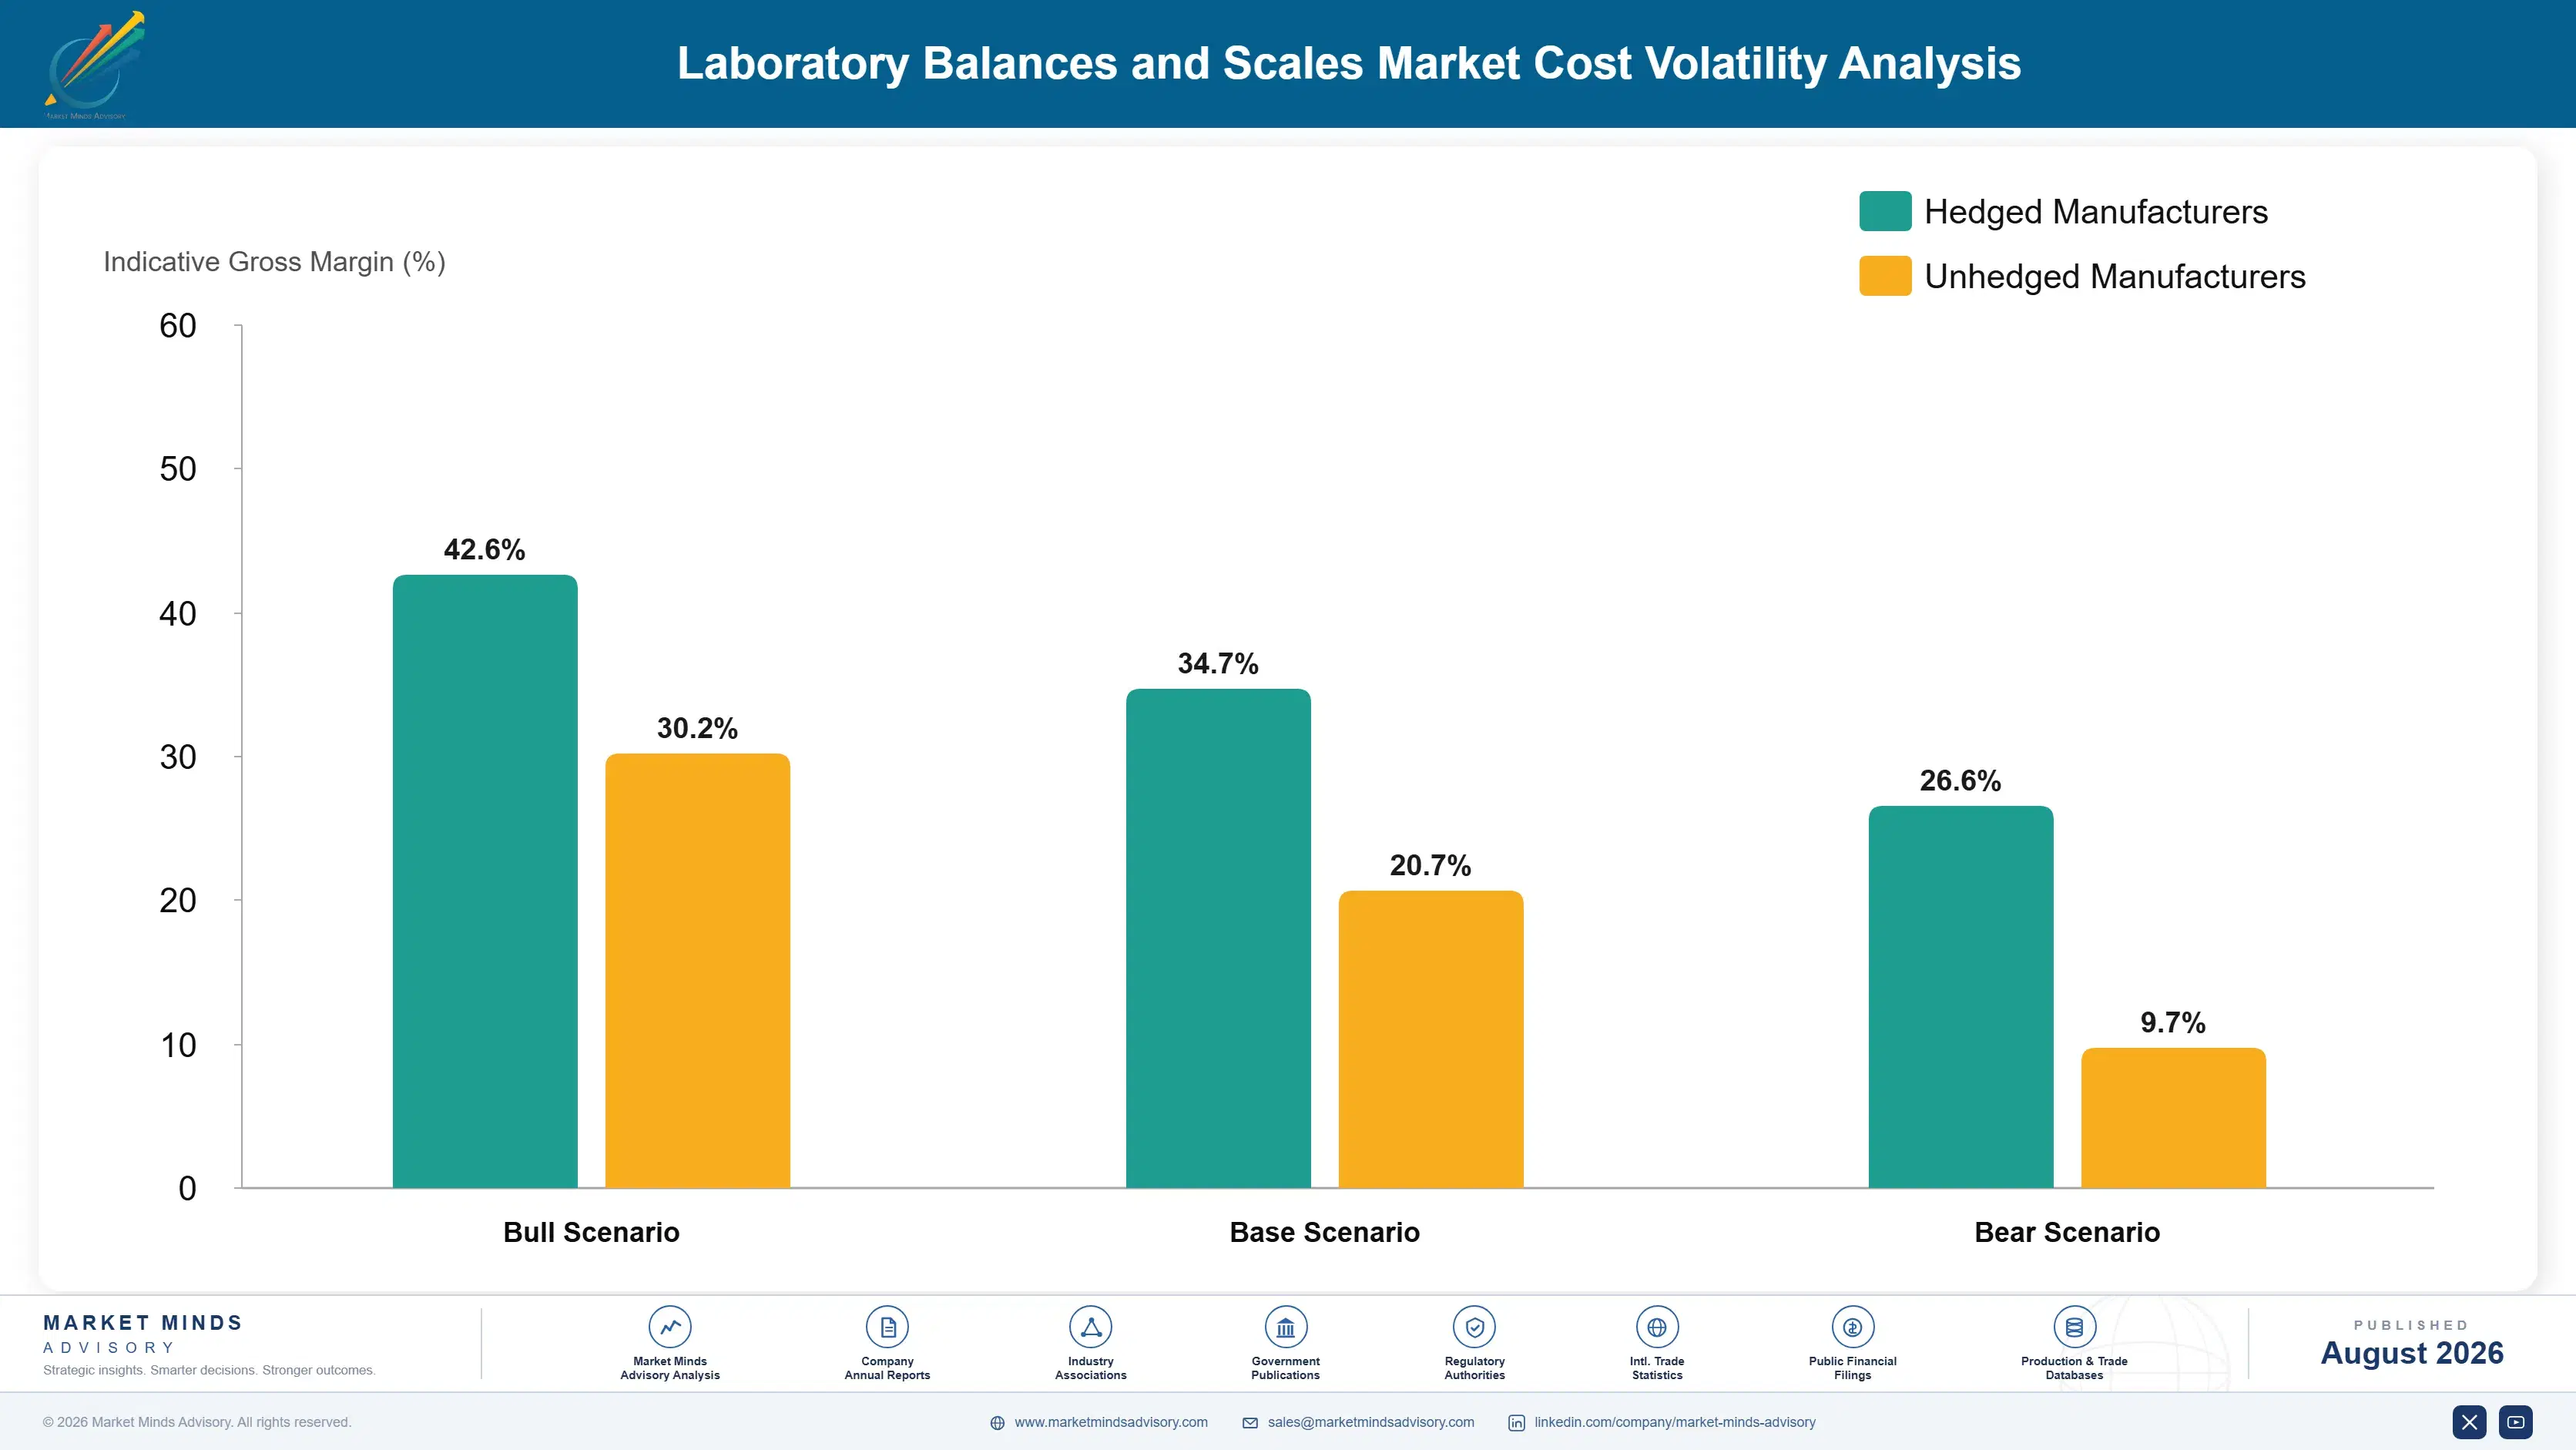
Sensor and Electronics Component Cost Exposure

Load cells, strain gauge sensors, and microprocessor boards together represent roughly 31 percent of cost of goods sold for a typical connected analytical balance, with the remainder split across housing, display, and calibration weight components. Most precision load cells and semiconductor components originate from Japan, Germany, and Taiwan, concentrating supply risk among a comparatively small number of qualified component manufacturers worldwide.
The 2021 to 2022 global semiconductor shortage delayed electronic balance shipments industry-wide, with several manufacturers reporting order backlogs extending beyond six months as microprocessor and display driver components became difficult to source at any price. Mettler-Toledo's 2022 annual report cited component availability as a specific factor limiting connected-balance shipment growth that year, a constraint that eased only gradually through 2023 as semiconductor supply normalized across the broader electronics industry worldwide.

Established manufacturers with long-standing component supplier relationships and larger purchase volumes secured priority allocation during the shortage more easily than smaller regional competitors, widening the delivery reliability gap between tier-one and budget brands during that period. Manufacturers without long-term component supply agreements, concentrated among smaller Asian producers, faced the longest shipment delays and lost some competitive ground to established brands during the recovery period.
laboratory-balances-and-scales-market-cost-volatility-analysis-1787304657785

Diversify Load Cell Supplier Qualification Across Regions

Manufacturers are qualifying multiple load cell suppliers across Japan, Germany, and increasingly China, reducing dependency on any single component source following the 2021-2022 shortage experience across the wider industry. Dual-sourcing adds modest qualification cost but has proven worthwhile given the shipment delays single-source manufacturers experienced when component availability tightened unexpectedly across global supply chains.

Build Strategic Component Inventory Buffers

Several manufacturers have increased safety stock of critical microprocessor and display components beyond historical norms, accepting higher working capital cost in exchange for shipment reliability during future supply disruptions across their networks. This buffer strategy proved valuable during the most recent shortage cycle and is now standard practice among the largest instrument makers globally today.

Pursue Backward Integration Into Load Cell Manufacturing

The largest manufacturers are acquiring or building captive load cell production capacity, insulating their highest-margin analytical and micro-balance lines from third-party component pricing and availability pressure entirely across regions. This approach requires significant capital investment but has delivered meaningfully more predictable shipment schedules for companies that have pursued it fully and consistently.

Portfolio Architecture for Margin Defence

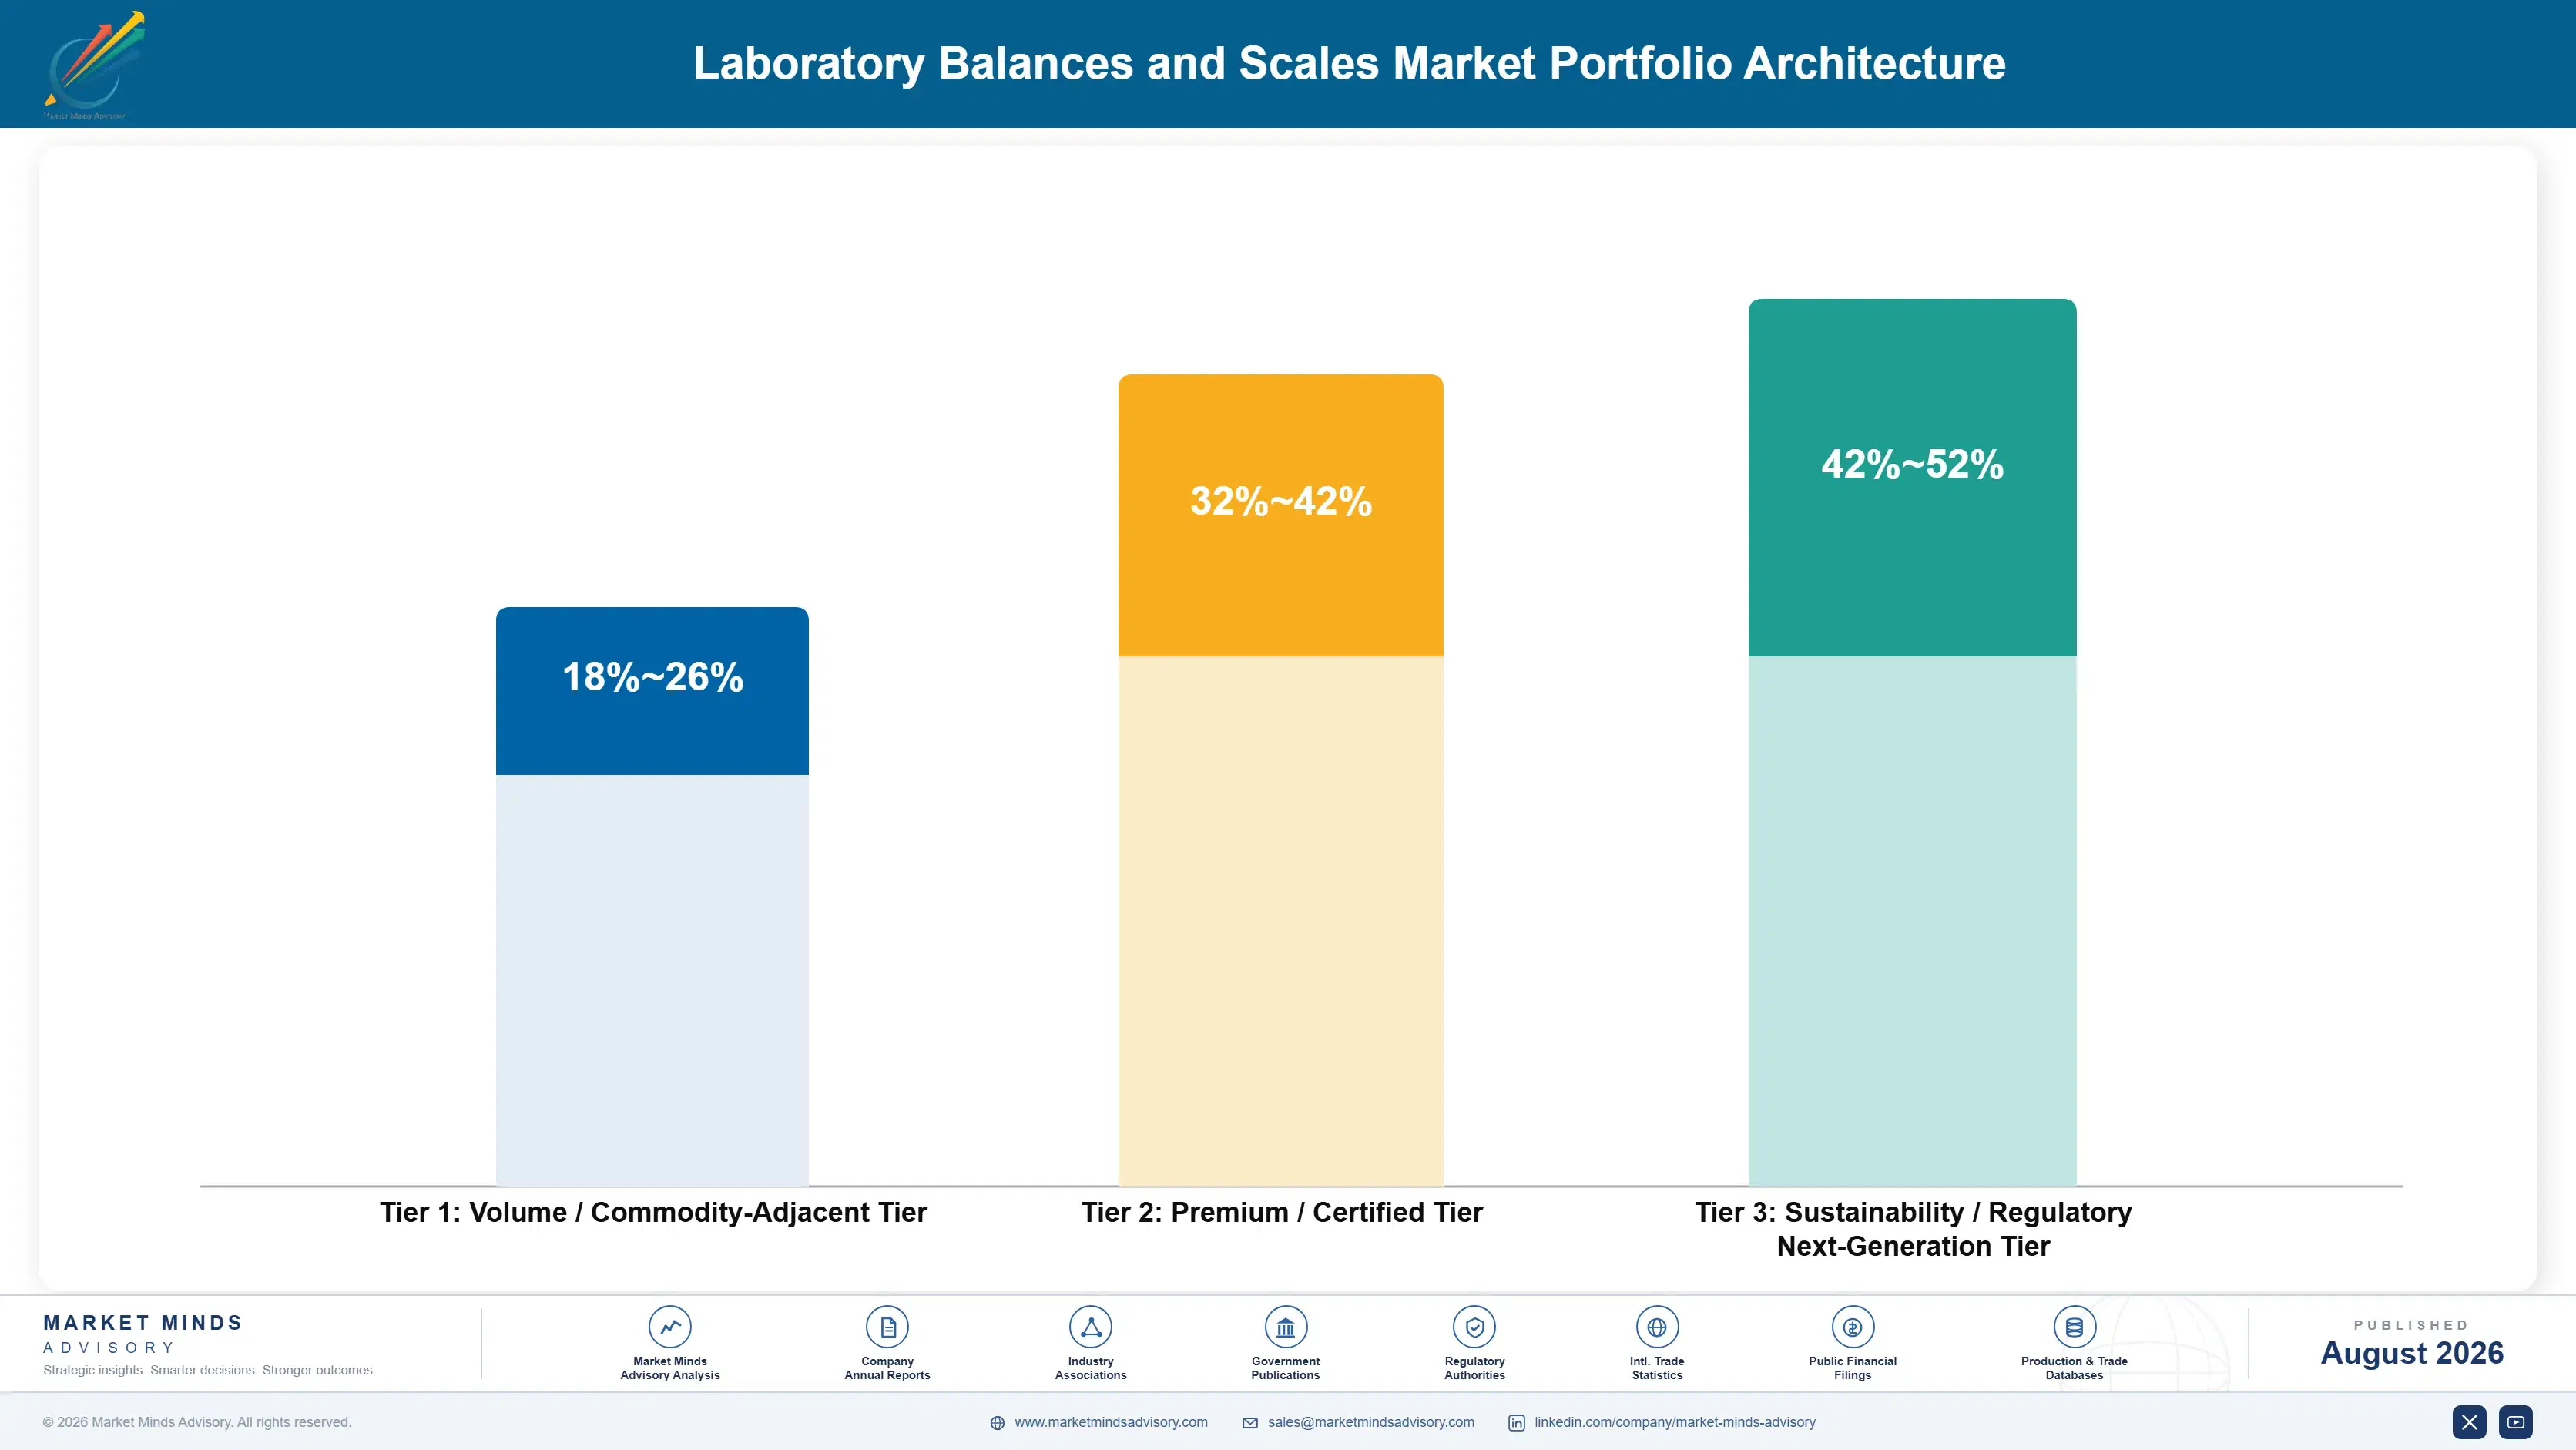
The market organizes into three margin tiers running from commodity-adjacent bench scales through certified pharmaceutical-grade analytical balances to next-generation connected micro-balance platforms bundled with calibration software. Gross margins widen substantially moving up this ladder, reflecting both engineering complexity and the regulatory validation documentation premium customers pay for at the top tier of the category consistently across nearly every regulated end market served.
Volume sits overwhelmingly in the commodity-adjacent tier by unit count, but profitability concentrates in premium and next-generation tiers where regulated pharmaceutical customers pay meaningfully more for compliance-ready instrumentation and bundled software. This volume-versus-margin tension shapes product development priorities across nearly every major manufacturer's roadmap and capital allocation decisions for the years ahead, favoring continued investment in software and connectivity features.

High-value pools concentrate specifically around cell and gene therapy manufacturing instrumentation and connected calibration software subscriptions, both growing considerably faster than the broader instrument category. Manufacturers positioned early in these pools are capturing disproportionate profit growth relative to their unit shipment share of the overall market today, a gap likely to widen further as biopharmaceutical manufacturing capacity keeps expanding.

Volume / Commodity-Adjacent Tier

Standard bench and industrial platform scales sold largely on price and basic reliability across academic, light-industrial, and retail-adjacent channels through broad distributor networks worldwide, with minimal connectivity features and thin service attach.
Gross Margin: 18-26%

Premium / Certified Tier

Pharmaceutical-grade analytical and precision balances with full calibration documentation and validation support, commanding meaningful premiums tied to regulatory compliance requirements across regulated laboratory customers and contract manufacturers globally.
Gross Margin: 32-42%

Sustainability / Regulatory / Next-Generation Tier

Connected micro-balances and moisture analyzers bundled with cloud calibration software, carrying the category's highest margins given engineering complexity and recurring software attach revenue across regulated customer accounts.
Gross Margin: 42-52%
laboratory-balances-and-scales-market-portfolio-architecture-1787304658512

Compliance-Driven Replacement Economics

Laboratory balance demand functions less like a discretionary capital purchase and more like an annuity tied to regulatory compliance cycles, since regulated laboratories cannot legally operate without properly calibrated, audit-compliant instrumentation. This dynamic insulates a meaningful share of replacement demand from broader laboratory capital budget cycles that affect most other analytical instrumentation categories across the industry today, providing manufacturers with unusually predict
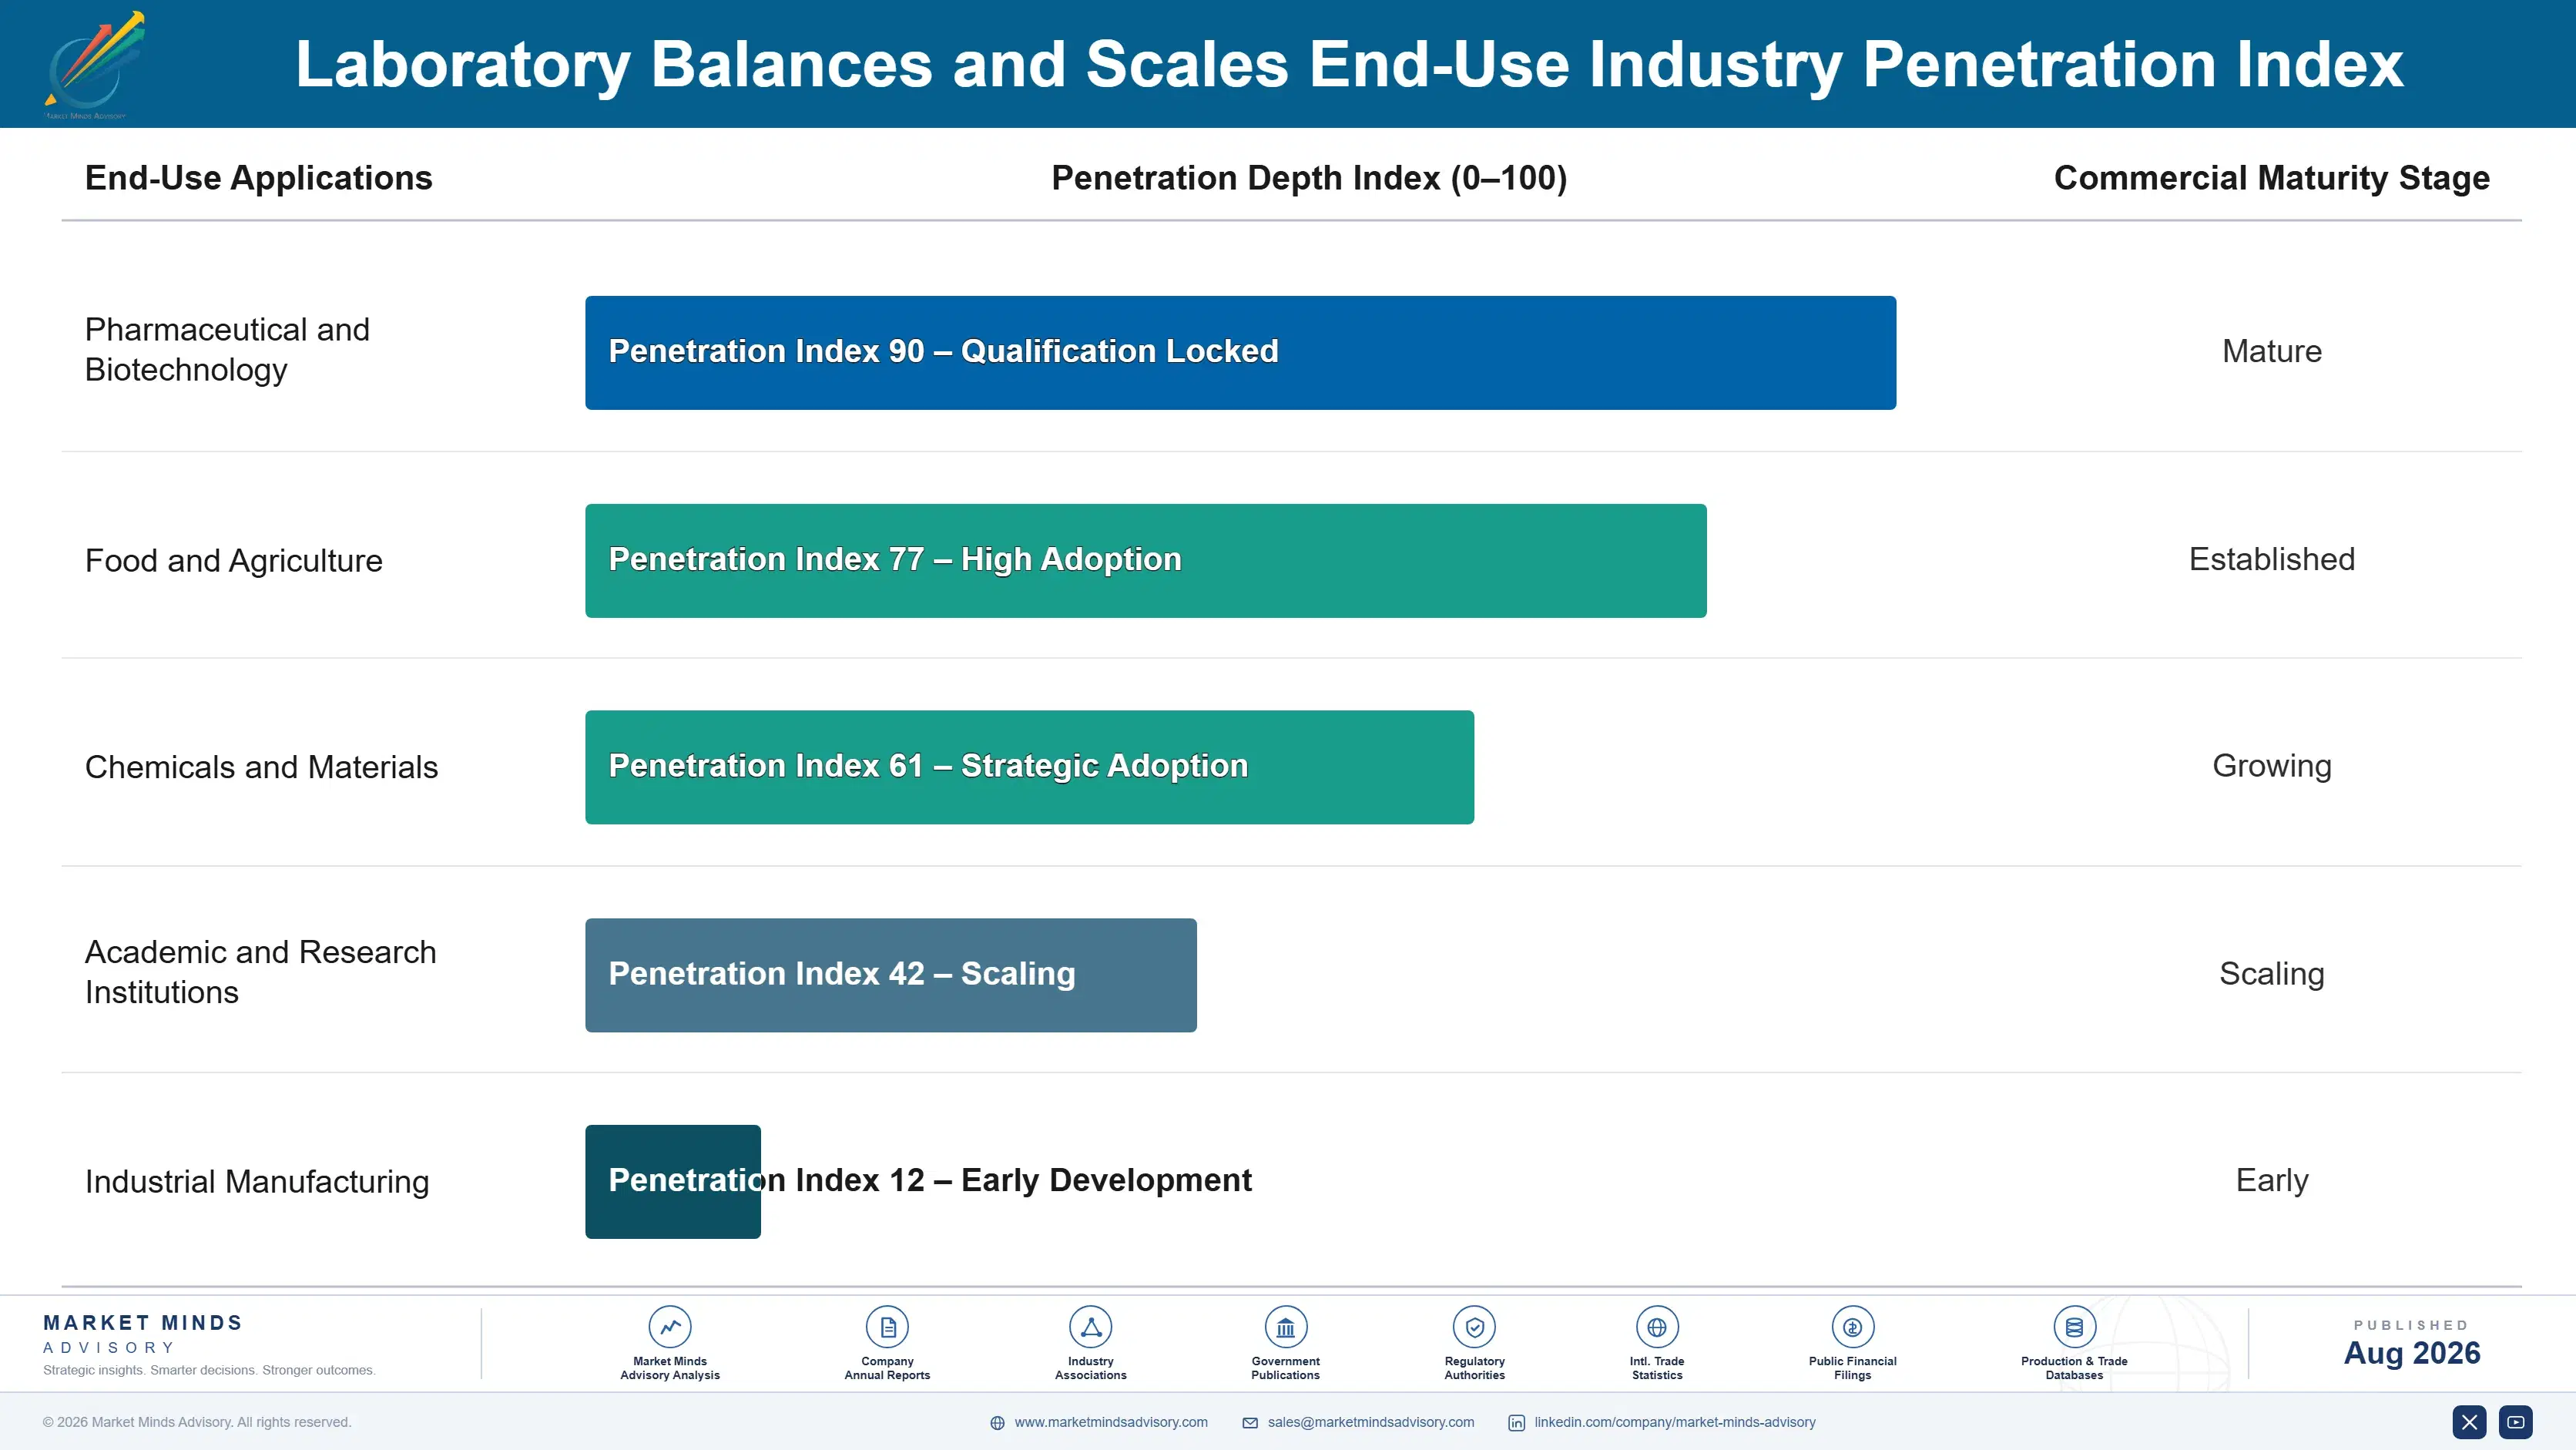
Adoption depth varies considerably by end-use vertical: pharmaceutical and biotech laboratories have adopted connected, compliance-ready balances almost universally, while academic and light-industrial laboratories still operate substantial fleets of older analog and first-generation digital units. Food safety and environmental testing laboratories sit between these extremes, adopting connectivity selectively where specific buyer or regulatory documentation requirements demand it directly rather than as a general fleet standard.

A generational shift in laboratory buyer profiles is underway as younger laboratory managers, accustomed to cloud software and mobile interfaces elsewhere in their professional lives, increasingly expect balance software to match that experience rather than tolerating clunky proprietary calibration tools. This expectation is accelerating connected-platform adoption even in laboratory segments not strictly required to upgrade by regulation yet, reshaping vendor selection criteria industry-wide.
laboratory-balances-and-scales-market-end-use-penetration-index-1787304659368

Where MMA Sees The Opportunity

These are among the four positions where our research anticipates prominent divergence between winners and laggards over the coming forecast period. Each is grounded in the demand model, the regulatory perimeter, and the announced capacity pipeline.
01 / SOFTWARE ATTACH STRATEGY

Prioritize calibration software attach over hardware price competition

Manufacturers competing primarily on hardware price against low-cost Asian entrants are fighting a battle with structurally thin margins and little durable advantage over time. Those instead building recurring calibration software and compliance documentation revenue streams are converting one-time hardware sales into multi-year customer relationships worth meaningfully more over the instrument's service life. MMA views software attach rate as the single clearest predictor of which established manufacturers sustain premium positioning against Chinese competitors over the next decade of category consolidation and change.
02 / CELL THERAPY POSITIONING

Build application-specific instrumentation for cell and gene therapy manufacturers early

Cell and gene therapy manufacturing capacity is expanding rapidly worldwide, and purpose-built micro-balance instrumentation for this application commands meaningful price premiums over standard equivalents across the broader instrument category. Manufacturers establishing qualified supplier relationships with biopharmaceutical customers now are securing multi-year positioning before broader competitive entry narrows the opportunity considerably over the next several years. MMA expects this segment to remain among the fastest-growing and highest-margin pools in the category through the full forecast period, rewarding early movers with durable customer relationships and loyalty.
03 / EMERGING MARKET SERVICE

Expand certified calibration service networks into underserved regions proactively

Calibration service access gaps across Latin America, Africa, and parts of Southeast Asia currently suppress instrument upgrade demand more than price or product availability alone. Manufacturers investing early in regional calibration laboratory networks are capturing service revenue that competitors without local infrastructure simply cannot access, while also building customer relationships that translate into hardware replacement loyalty over time. MMA views service network depth as an underappreciated differentiator relative to the disproportionate competitive attention product accuracy specifications still receive across the industry today.
04 / CHINESE COMPETITIVE RESPONSE

Defend mid-tier pricing before Chinese manufacturers close the connectivity gap

Chinese manufacturers have moved up the value chain from basic industrial scales into genuinely credible analytical-grade balances, closing an accuracy gap that once protected established brands almost entirely on technical merit alone. The connectivity and software feature gap remains wider than the accuracy gap for now, giving established manufacturers a narrowing but still meaningful window to differentiate their offerings. MMA expects mid-tier competitive rankings to shift measurably within the next several years absent a clear response from incumbent manufacturers across the category.

Engagement Snapshot From the Field

A live engagement with an industry participant carrying material or product regulatory and market exposure ahead of a defining policy shift, showing how our research translates into a defensible multi-year portfolio strategy.
MARKET MINDS ADVISORY · CLIENT ENGAGEMENT SUMMARY
Laboratory Balances and Scales Producer Strategic Portfolio Review and Transition Roadmap 2026·Investment Scenario on Laboratory Balances and Scales Exposure Evaluation 2025-26
CLIENT PROFILE
The client is a mid-sized contract development and manufacturing organization operating multiple formulation facilities across India, historically running a mixed fleet of analog and first-generation digital balances accumulated through years of ad hoc equipment purchases across different facility managers (client-reported, unverified by MMA). Recent FDA inspection findings related to data integrity documentation prompted leadership to pursue fleet-wide standardization on connected, audit-compliant instrumentation across every formulation line and facility.
STRATEGIC CHALLENGE
Leadership needed to select a single qualified balance vendor capable of supplying connected analytical and precision balances across all facilities within a compressed remediation timeline set by the FDA inspection response commitment, while minimizing production disruption during the transition and controlling capital expenditure across a facility network operating on tight formulation production schedules.
MMA APPROACH
MMA benchmarked candidate vendors against connectivity feature depth, calibration service network coverage across India, and total cost of ownership including software subscription costs, modeled expected remediation timeline under three distinct vendor scenarios, and recommended a phased fleet replacement sequence prioritizing the facilities under closest regulatory scrutiny first, ahead of the remaining network.
KEY FINDINGS
  1. Roughly 60 percent of the client's existing balance fleet lacked any electronic audit trail capability, representing the single largest data-integrity remediation gap identified across the facility network overall.
  2. Vendors with pre-validated qualification documentation packages reduced estimated internal validation labor by an estimated 30 percent compared to vendors requiring the client to develop protocols independently.
  3. Regional calibration service coverage varied considerably between candidate vendors, with response time gaps of several days materially affecting total cost of ownership projections across facilities.
  4. Bundled software subscription costs, while adding recurring expense, were projected to pay back within roughly eighteen months through reduced internal compliance documentation labor requirements alone.
CLIENT PROFILE
The client is a mid-sized contract development and manufacturing organization operating multiple formulation facilities across India, historically running a mixed fleet of analog and first-generation digital balances accumulated through years of ad hoc equipment purchases across different facility managers (client-reported, unverified by MMA). Recent FDA inspection findings related to data integrity documentation prompted leadership to pursue fleet-wide standardization on connected, audit-compliant instrumentation across every formulation line and facility.
STRATEGIC CHALLENGE
Leadership needed to select a single qualified balance vendor capable of supplying connected analytical and precision balances across all facilities within a compressed remediation timeline set by the FDA inspection response commitment, while minimizing production disruption during the transition and controlling capital expenditure across a facility network operating on tight formulation production schedules.
MMA APPROACH
MMA benchmarked candidate vendors against connectivity feature depth, calibration service network coverage across India, and total cost of ownership including software subscription costs, modeled expected remediation timeline under three distinct vendor scenarios, and recommended a phased fleet replacement sequence prioritizing the facilities under closest regulatory scrutiny first, ahead of the remaining network.
KEY FINDINGS
  1. Roughly 60 percent of the client's existing balance fleet lacked any electronic audit trail capability, representing the single largest data-integrity remediation gap identified across the facility network overall.
  2. Vendors with pre-validated qualification documentation packages reduced estimated internal validation labor by an estimated 30 percent compared to vendors requiring the client to develop protocols independently.
  3. Regional calibration service coverage varied considerably between candidate vendors, with response time gaps of several days materially affecting total cost of ownership projections across facilities.
  4. Bundled software subscription costs, while adding recurring expense, were projected to pay back within roughly eighteen months through reduced internal compliance documentation labor requirements alone.
RECOMMENDED STRATEGY
Phase 1: Phase 1 (Months 1-3): Complete vendor evaluation and finalize selection based on connectivity, service coverage, and total cost of ownership. Phase 2: Phase 2 (Months 4-8): Replace balance fleets at the two facilities under closest regulatory scrutiny first, prioritizing remediation commitment deadlines. Phase 3: Phase 3 (Months 9-14): Complete remaining facility fleet replacement and establish ongoing calibration compliance monitoring across the full network and every remaining site.
OUTCOME
Fourteen months into the engagement, the client reported successful fleet-wide standardization meeting its regulatory remediation commitment, with subsequent internal audits finding no further data-integrity documentation gaps across any formulation facility (client-reported, unverified by MMA), validating MMA's vendor selection and phased rollout recommendation fully across every site involved.

Frequently Asked Questions

Foundational context covering the market sizes, CAGR, scope, country, region and competition that inform every finding below. This section is provided to cover basics and most often pre-purchase conversations, answered from the MMA Primary Research Dataset.

What is the current size of the Laboratory Balances and Scales Market?

The global Laboratory Balances and Scales Market was valued at approximately $2.4 billion in 2025. Growth is driven by pharmaceutical quality control demand and tightening data-integrity regulation.

How large will the Laboratory Balances and Scales Market be by 2036?

The market is projected to reach approximately $4.75 billion by 2036, roughly 1.86 times its 2026 value. Growth is led by pharmaceutical and biotech instrumentation demand across Asia.

What is the CAGR for the Laboratory Balances and Scales Market 2026 to 2036?

The market is forecast to grow at a 6.4 percent CAGR between 2026 and 2036. Bull and bear scenarios range from 7.6 percent to 5.2 percent.

Which segment is growing fastest?

Micro and ultra-micro analytical balances are growing fastest at a 9.8 percent CAGR, roughly 1.53 times the overall market rate, driven by cell and gene therapy manufacturing expansion.

Who are the major companies in the Laboratory Balances and Scales Market?

Mettler-Toledo, Sartorius, Shimadzu, OHAUS, and A&D Company lead the market, together holding roughly 42 percent of category revenue on a company-revenue basis.

Which country is growing fastest?

India is growing fastest among major markets at an estimated 10.2 percent CAGR, driven by generic and biosimilar pharmaceutical manufacturing expansion across Telangana and Gujarat.

Report Segmentation Architecture

The full report scope spans multiple orthogonal segmentation dimensions, with cross-tabulated demand data provided for each dimension pair. Coverage extends further to regional breakdowns, trend trajectories, and the competitive detail needed to support segment-level decision-making.

By Instrument Type and Precision Class

  • Analytical Balances
  • Precision Balances
  • Micro and Ultra-Micro Balances
  • Moisture Analyzers
  • Industrial Platform and Bench Scales
  • Counting and Check-Weighing Scales

By End-Use Industry

  • Pharmaceutical and Biotechnology
  • Food and Agriculture
  • Chemicals and Materials
  • Academic and Research Institutions
  • Industrial Manufacturing

By Commercial Dimension

  • Direct Technical Sales
  • Distributor Networks
  • Calibration and Service Contracts
  • Software Subscription

By Region

  • North America
  • Western Europe
  • East Asia
  • South Asia and Pacific
  • Latin America
  • Middle East and Africa
  • Eastern Europe

Scope, Methodology, and Coverage

Every figure in this report is reproducible from documented input assumptions. The scope below maps the historical period, the forecast horizon, the segmentation dimensions, and the countries covered, alongside the underlying primary and qualitative methodology.
Historical Period
2020 to 2025
Forecast Period
2026 to 2036
Base Year
2025 (USD billions; MMA Primary Research Dataset, August 2026)
Market Definition
The Laboratory Balances and Scales Market covers analytical, precision, micro, and industrial-grade weighing instruments used for quantitative measurement in pharmaceutical, biotechnology, chemical, food, and academic research laboratories. It includes benchtop and portable units, moisture analyzers with integrated weighing cells, and their associated calibration and connectivity software. Retail and logistics weighing equipment, and non-laboratory industrial platform scales used purely for bulk material handling, are excluded from this scope.
Quantitative Units
USD billions (current prices); unit shipment volume where applicable
Segmentation Dimensions
By Instrument Type and Precision Class; By End-Use Industry; By Commercial Dimension; By Region
Regions Covered
North America, Western Europe, East Asia, South Asia and Pacific, Latin America, Middle East and Africa, Eastern Europe
Countries Covered
USA, China, Germany, France, UK, Japan, South Korea, India, Australia, Canada, Brazil, Mexico, Indonesia, Vietnam, Thailand, Malaysia, UAE, Saudi Arabia, South Africa, Nigeria, Turkey, Poland, Netherlands, Italy, Spain, Sweden, Switzerland, Argentina, Colombia, Singapore, and additional markets relevant to this sector
Key Companies Profiled
Mettler-Toledo International Inc., Sartorius AG, Shimadzu Corporation, OHAUS Corporation, A&D Company Limited, Kern & Sohn GmbH, Adam Equipment Co Ltd, Radwag Balances and Scales, Precisa Gravimetrics AG, Avery Weigh-Tronix, Minebea Intec, Rice Lake Weighing Systems, Scientech Inc., Torbal LLC, Gibertini Elettronica Srl, Essae Digitronics Pvt Ltd, Wensar Weighing Systems Pvt Ltd, Contech Instruments Ltd, Citizen Scales India Pvt Ltd, Shinko Denshi Co Ltd
Quantitative Methodology
Primary survey, n=3,800 respondents, Q4 2025, six countries; demand-side model with trade association cross-validation
Qualitative Methodology
47 expert interviews, Q4 2025; applied to validate demand model assumptions, identify emerging dynamics, and assess competitive positioning
Report Format
PDF and XLSX data workbook (Word format preview document)
Publisher
Market Minds Advisory
Report Code
MMA-2026-CON-142
Published
August 2026
Contact
sales@marketmindsadvisory.com | www.marketmindsadvisory.com

Purchase the full Laboratory Balances and Scales Market Report (2026 to 2036).

The full Laboratory Balances and Scales Market report provides detailed 2026 to 2036 forecasts across all six instrument segments and seven global regions, alongside company-level competitive profiles for the twenty manufacturers covered in this summary. It includes primary survey data from 3,800 laboratory procurement and quality assurance respondents across six countries, supplemented by 47 expert interviews with instrument manufacturers, calibration service providers, and regulated laboratory quality directors. The report addresses regulatory data-integrity trends, calibration service network economics, and connected-instrument adoption patterns in depth. Segment-level margin analysis and vendor selection frameworks support procurement and product strategy decisions across the value chain.
Segment-level 2026-2036 forecasts across all six categories
Full competitive profiles for twenty manufacturers profiled
Regional deep-dive analysis across all seven regions covered
Primary survey data from 3,800 laboratory procurement respondents
47 expert interviews with manufacturers and calibration providers
Vendor selection and total cost of ownership frameworks included

Built For The People Who Decide

From boardroom strategy to bench-side execution, this report is read cover-to-cover by leaders shaping the next decade of their industry, turning demand scenarios, market dynamics and valuation benchmarks into decisions.
CXOs/ Presidents/ VPs/ Managers
M&A and Corporate Development
Strategy Teams and R&D Heads
Procurement and Product Directors
Regulatory and Compliance Leaders
Investor Relations and Equity Analysts