Market Minds Advisory
Korea Automated People Mover Market

Korea Automated People Mover Market: Ridership risk, concession structure and operations revenue to 2036

Korean urban light rail lines opened to ridership running roughly 47% below forecast, municipalities discovered what a revenue guarantee actually costs, and the concession model for these systems changed everywhere as a result.

Lead Analyst

David Horsley

Published

September 2026

Make Smarter Decisions with Customized Research Insights

Request a free sample report and evaluate market opportunities, growth trends, and competitive dynamics relevant to your business needs.

2025 MARKET VALUE$4.9BMarket Size 2025
2036 FORECAST VALUE$11.2BBase Case , 2026 to 2036
CAGR 2026 TO 20367.8 %Bull 9.1% / Bear 6.5%
INCREMENTAL OPPORTUNITY$5.9BNet 10- year value creation
EXPANSION MULTIPLE2.12x2036 value over 2026 base
Strategic Levers
M&A Pipeline
Regional Outlook
Country Rankings
Competitive Intelligence
Segmental Deep-dive
Call-Us : 91 93563 13602

Executive Snapshot and Market Trajectory

Korea taught this industry its most expensive lesson. Urban automated light rail built under minimum revenue guarantee concessions opened to ridership around 47% below forecast, municipalities faced compensation liabilities nobody had budgeted, and one operator entered court receivership. The concession model changed globally as a result. Nobody has forgotten it.
Automated bus rapid transit on exclusive guideway grows at 11.7%, half again the market rate of 7.8%, because it delivers automated capacity at a fraction of the civil engineering cost that a fixed guideway system demands. East Asia holds 28% of value on airport and urban projects together. Airports account for 44% of contracted value and remain the reliable half. Nothing about that looks likely to change.
Five suppliers hold 62% of contracted value, which is high concentration and reflects how few organisations can deliver an integrated automated system with a twenty-five year operations agreement attached to it. The vehicles are 29% of system value and the signalling outlasts them, which is why the automation contract rather than the rolling stock decides who actually holds a project across its life. Very few suppliers have organised around that particular fact.
Market Definition
This report covers fully automated, driverless transit systems operating on exclusive guideway, spanning rubber-tyred guideway systems, steel-wheel automated light metro, monorail, cable-propelled movers, maglev and linear motor systems, and automated bus rapid transit on exclusive guideway. Value covers vehicles, guideway systems, signalling and contracted operations, with Korea treated as the analytical centre. Excluded are conventional attended metro, tramways sharing road space, escalators and moving walkways, and airport baggage systems.
Base Year Value
$4.9B in 2025 (MMA Primary Research Dataset, August 2026)
Forecast Period
2026 to 2036, eleven discrete annual values
CAGR
7.8% base case. Bull 9.1%. Bear 6.5%.
Fastest Growth Segment
Automated Bus Rapid Transit on Exclusive Guideway: 11.7% CAGR
Fastest Growth Country
India: 10.6% CAGR
Fastest Growth Region
South Asia and Pacific: 10.0% CAGR
Largest Region
East Asia: 28% of 2025 global value
Market Leaders
Alstom, Siemens Mobility, Hitachi Rail, Mitsubishi Heavy Industries and Hyundai Rotem lead the market. Source: MMA Primary Research Dataset, July 2026.
Primary Survey
n=3,800 procurement and R&D decision-makers, Q4 2025, six countries
Methodology
Demand-side build-up, cross-validated against public data, 47 expert interviews

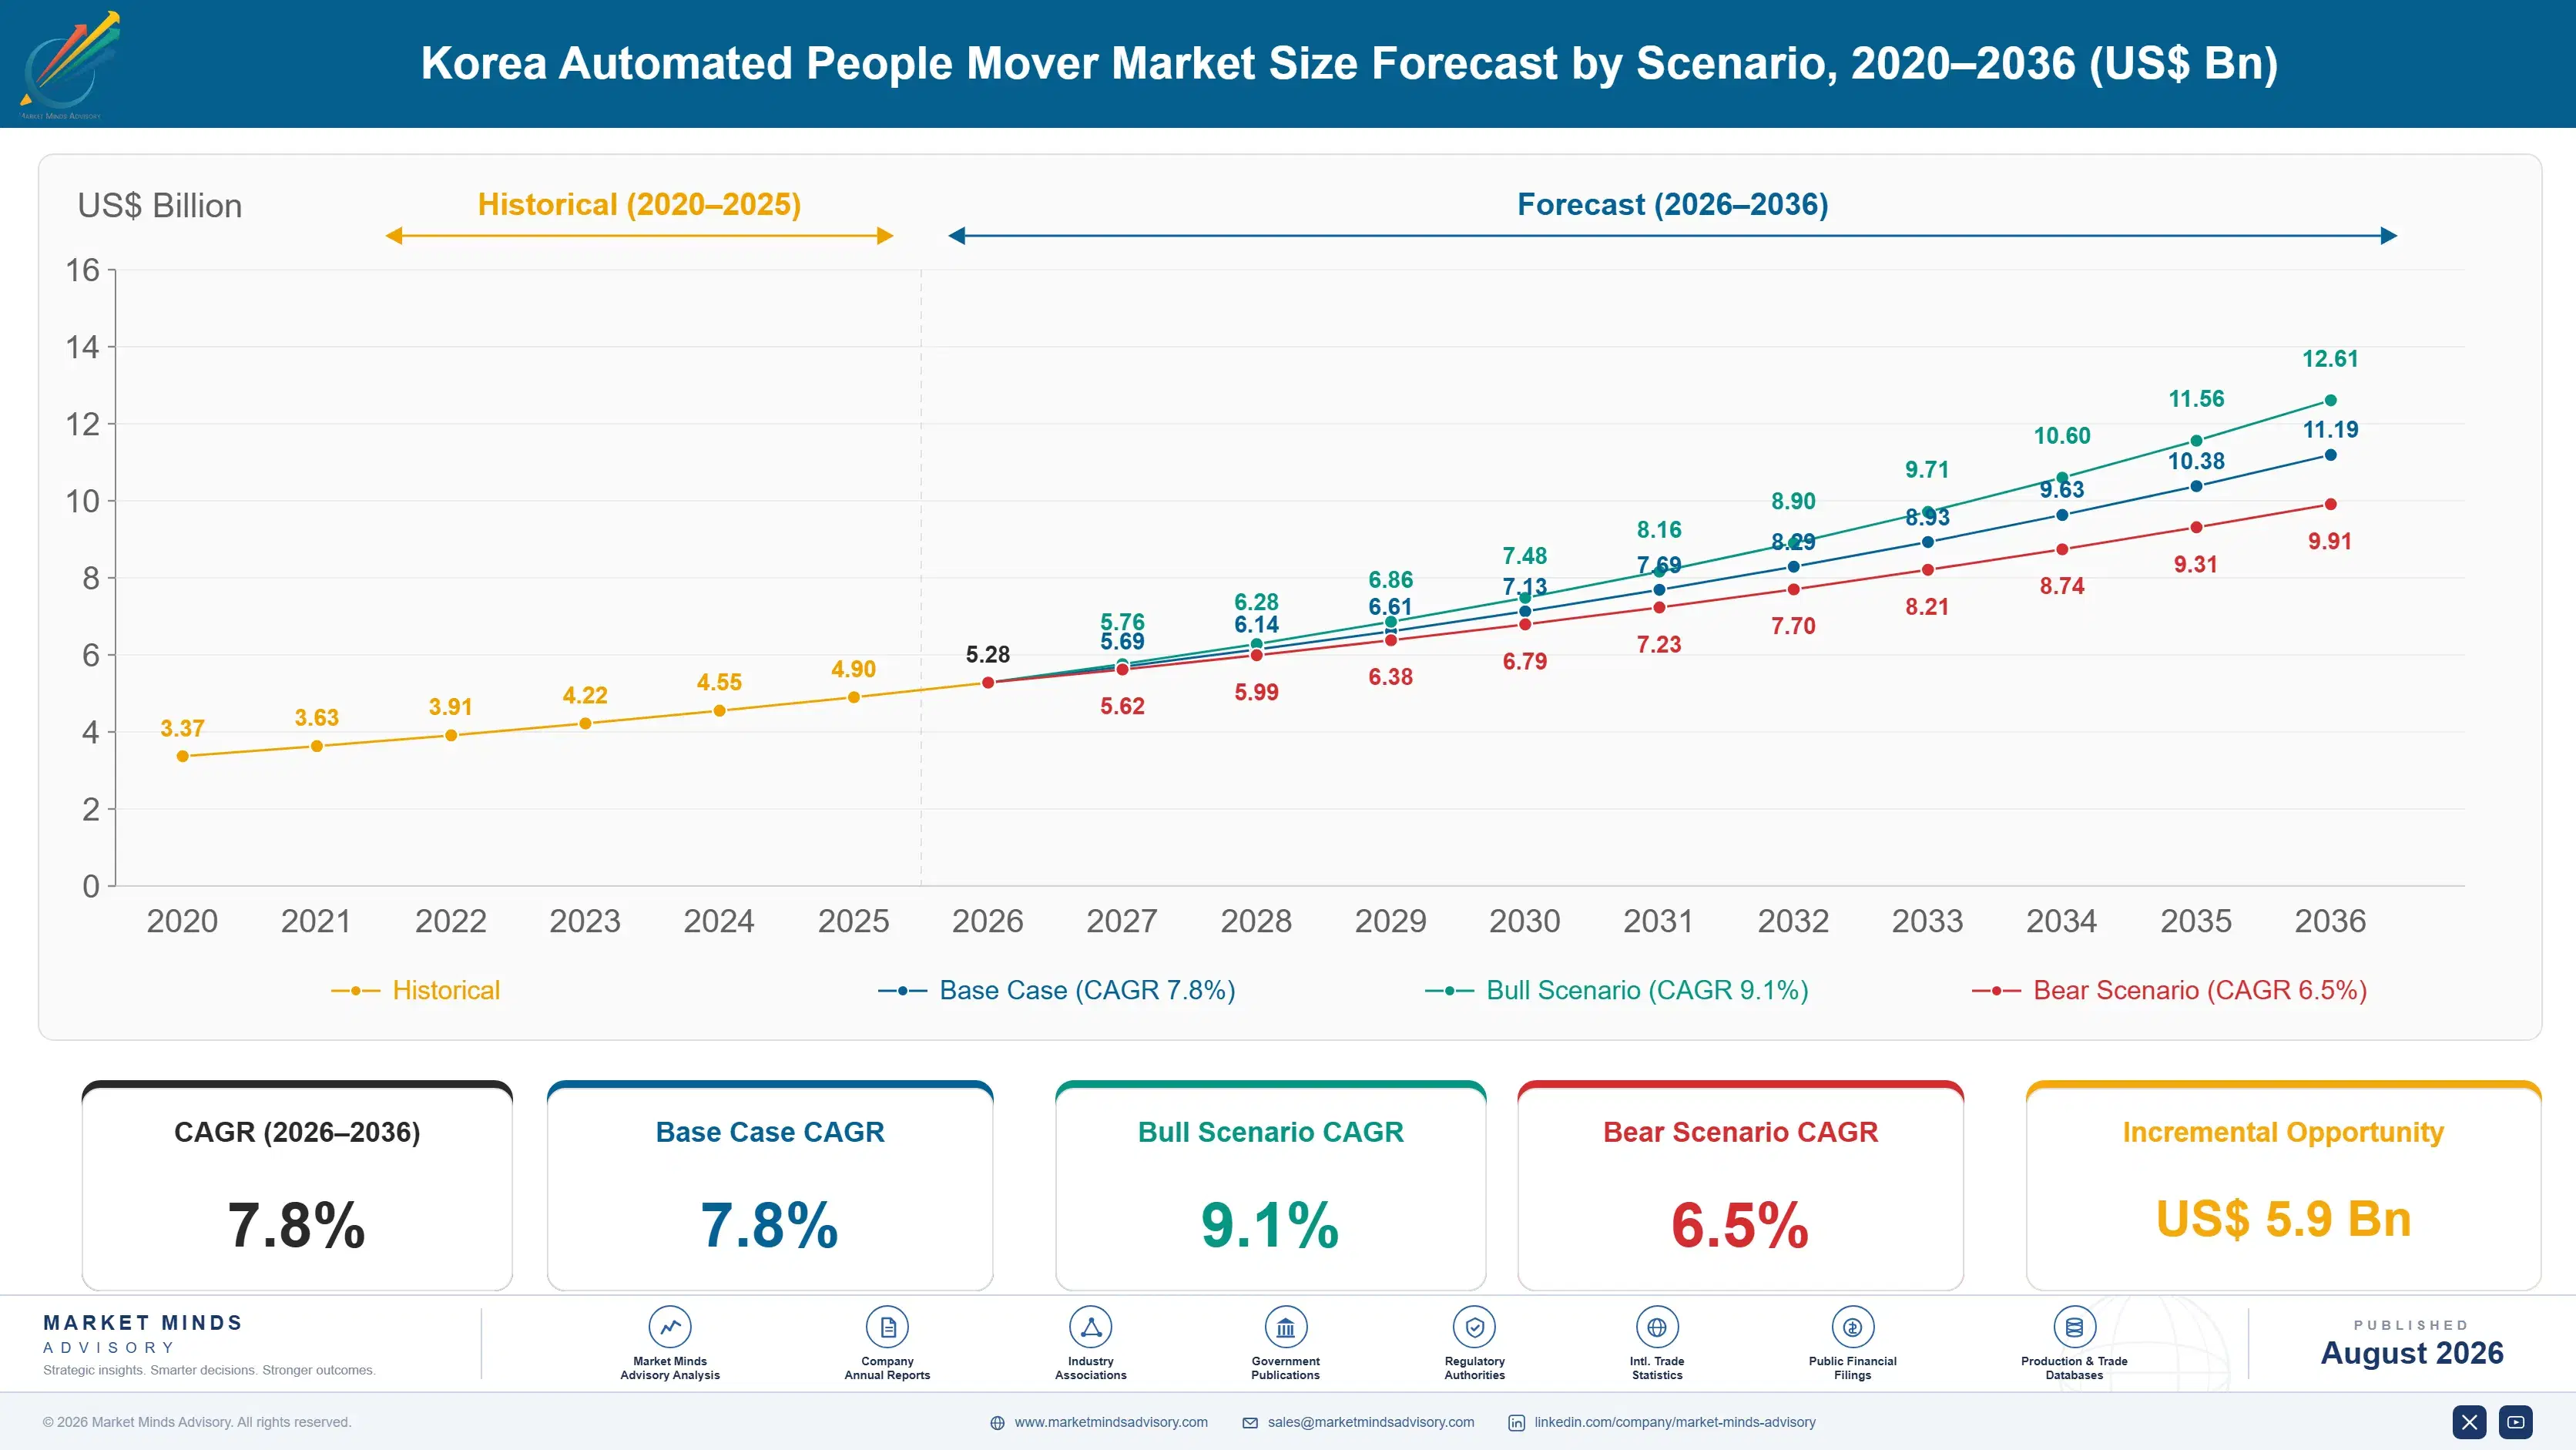
Korea Automated People Mover Market Forecast Scenarios

korea-automated-people-mover-industry-market-trend-size-forecast-scenario-1787553487402
Growth ran at 6.4% between 2020 and 2025 and airport projects carried almost all of it. Passenger traffic collapsed through 2020 and airport capital programmes largely continued anyway, because terminal expansion runs on decade timescales that a two-year traffic disruption does not reset. Urban automated projects moved more slowly as municipalities worked through the concession structures that Korean and comparable experience had discredited.
The 7.8% base case rests on three mechanisms. Airport terminal expansion keeps generating automated shuttle requirements, and at 44% of contracted value that is the steadiest demand in this market. Automation grade four is now specified as default on new urban systems, which pulls signalling content up as a share of every project. And automated guideway bus systems keep taking projects that could not justify fixed guideway civil works, growing at 11.7% from a small base.
The 9.1% bull case is availability payment concessions restoring municipal appetite for urban automated projects, which the ridership experience suppressed for a decade. The 6.5% bear case is exactly the opposite: another ridership failure on a high-profile line would set urban procurement back years and leave this market dependent on airports alone. Nobody in procurement has forgotten the last one.

What Korea Taught Everybody Else

Korean urban automated light rail was built on a concession structure that guaranteed the operator a minimum revenue and left the municipality carrying the difference when ridership fell short. It fell short by around 47% on average, which is not a forecasting error so much as a category failure, and the compensation liabilities that followed reached numbers that municipal budgets could not absorb. One operator entered court receivership. Every concession negotiated since has moved toward availability payments instead, which is the single most consequential thing this industry learned in twenty years.
TOP-FIVE CONCENTRATION62%Combined position across automated people mover supply held by leaders
RIDERSHIP FORECAST VARIANCE47%Typical shortfall between forecast and actual ridership on Korean lines
AIRPORT PROJECT SHARE44%Portion of contracted value delivered into airport systems
AUTOMATION GRADE STANDARD4Grade of automation now specified as default on new systems
OPERATIONS CONTRACT DURATION25 yearsTypical period across which a system operations agreement runs
VEHICLE COST SHARE29%Portion of total system value attributable to rolling stock
Airports work completely differently and account for 44% of contracted value. A passenger changing terminals has no alternative to the shuttle, so ridership is a function of terminal design rather than of anybody's demand forecast, and the funding comes from airport charges rather than from fare revenue. That is why airport projects kept proceeding through a period when urban ones stalled.
The value has migrated inside the system. Vehicles are only 29% of contracted value, the signalling and automation package is larger and outlasts them, and a twenty-five year operations agreement dwarfs both. Whoever holds the automation contract holds the project.
"Everybody in this industry can quote the Korean ridership numbers and rather fewer have changed how they bid because of them. The suppliers doing well stopped selling trains and started selling twenty-five years of availability, which is a completely different proposition."
Principal, Urban Transit Systems and Infrastructure Practice · MMA Industrial Equipment Practice · August 2026

Market Trends

Availability payment concessions replace ridership risk transfer

Minimum revenue guarantee structures asked private operators to carry demand risk on forecasts that turned out to be wrong by around 47% in the Korean cases, and the municipalities carrying the guarantee absorbed liabilities that broke several budgets. Availability payments move the compensation basis to whether the system runs rather than to how many people use it, which reflects what an operator can actually control. Every recent concession has moved that way. The commercial consequence for suppliers is significant: bidding against availability rather than ridership changes the risk premium and makes long operations agreements considerably more financeable.
Market Impact: Delivers 44% of contracted value
Automated guideway buses take projects fixed guideway cannot justify

A fixed guideway automated system requires civil engineering that many corridors simply cannot support financially, which has left a large number of transit needs unmet rather than served by something cheaper. Automated bus systems on exclusive guideway deliver comparable capacity and full automation with a fraction of the structure, using optical or magnetic guidance rather than rails. Growth at 11.7% comes off a small base and reflects corridors that were never going to get a fixed system. The technology is less proven and the procurement authorities buying it are generally smaller and more willing to accept that trade.
Market Impact: Standard on grade 4 systems

Market Opportunities and Growth Drivers

Airport terminal expansion generates predictable shuttle requirements

A terminal beyond a certain size cannot be walked and an airport adding a satellite pier has to move passengers to it somehow, which makes an automated shuttle a design consequence rather than a demand forecast. Airports account for 44% of contracted value in this market and the demand behaves nothing like urban transit: ridership is determined by terminal layout, funding comes from airport charges, and nobody has to be persuaded to use the system. That reliability is why airport projects continued through the period when urban automated procurement effectively stopped after the Korean experience.
Market Impact: Left ridership 47% below forecast

Grade four automation becomes the default new-build specification

Unattended train operation is now what procurement authorities specify by default on new systems, because the operating cost saving over a twenty-five year concession is large and the safety case is settled. That pulls signalling and control content upward as a share of every project while vehicles stay at around 29% of system value. It also concentrates the market further, since the number of suppliers able to deliver certified grade four automation is considerably smaller than the number able to build rolling stock. Retrofit of existing attended lines is a separate and growing requirement.
Market Impact: Limits corridors below 11.7% growth

Market Restraints and Challenges

Ridership forecast failure destroyed municipal appetite for urban projects

Korean urban automated lines opened to ridership around 47% below forecast, and under minimum revenue guarantee concessions the municipalities carried the shortfall as a direct budget liability for decades. The root cause was forecasting methodology applied to corridors with no comparable precedent, compounded by concession structures that transferred nothing. Commercially this stalled urban automated procurement across several markets for years, since no mayor wants to explain another one. Availability payment structures address the mechanism and not the memory, and restoring appetite requires a few successful projects rather than any argument about concession design.
Market Impact: Removes a 47% forecast risk

Civil engineering cost excludes most corridors from fixed guideway

An elevated or tunnelled guideway costs more per kilometre than most transit authorities can raise for a corridor that does not carry heavy metro volumes, which leaves a very large number of genuine transit needs unserved rather than served differently. The root problem is that automation reduces operating cost and does nothing for construction cost, which is where the money actually goes. Commercially this caps the addressable market to corridors that clear a high funding threshold. Automated guideway bus systems address it directly at 11.7% growth, and cable-propelled systems serve short constrained alignments others cannot.
Market Impact: Segment compounding at 11.7%
3 additional market trends, 4 additional growth drivers, and 2 additional restraints and challenges are covered in the full report. Contact sales@marketmindsadvisory.com to access the complete intelligence.

Segment CAGR and Growth Architecture

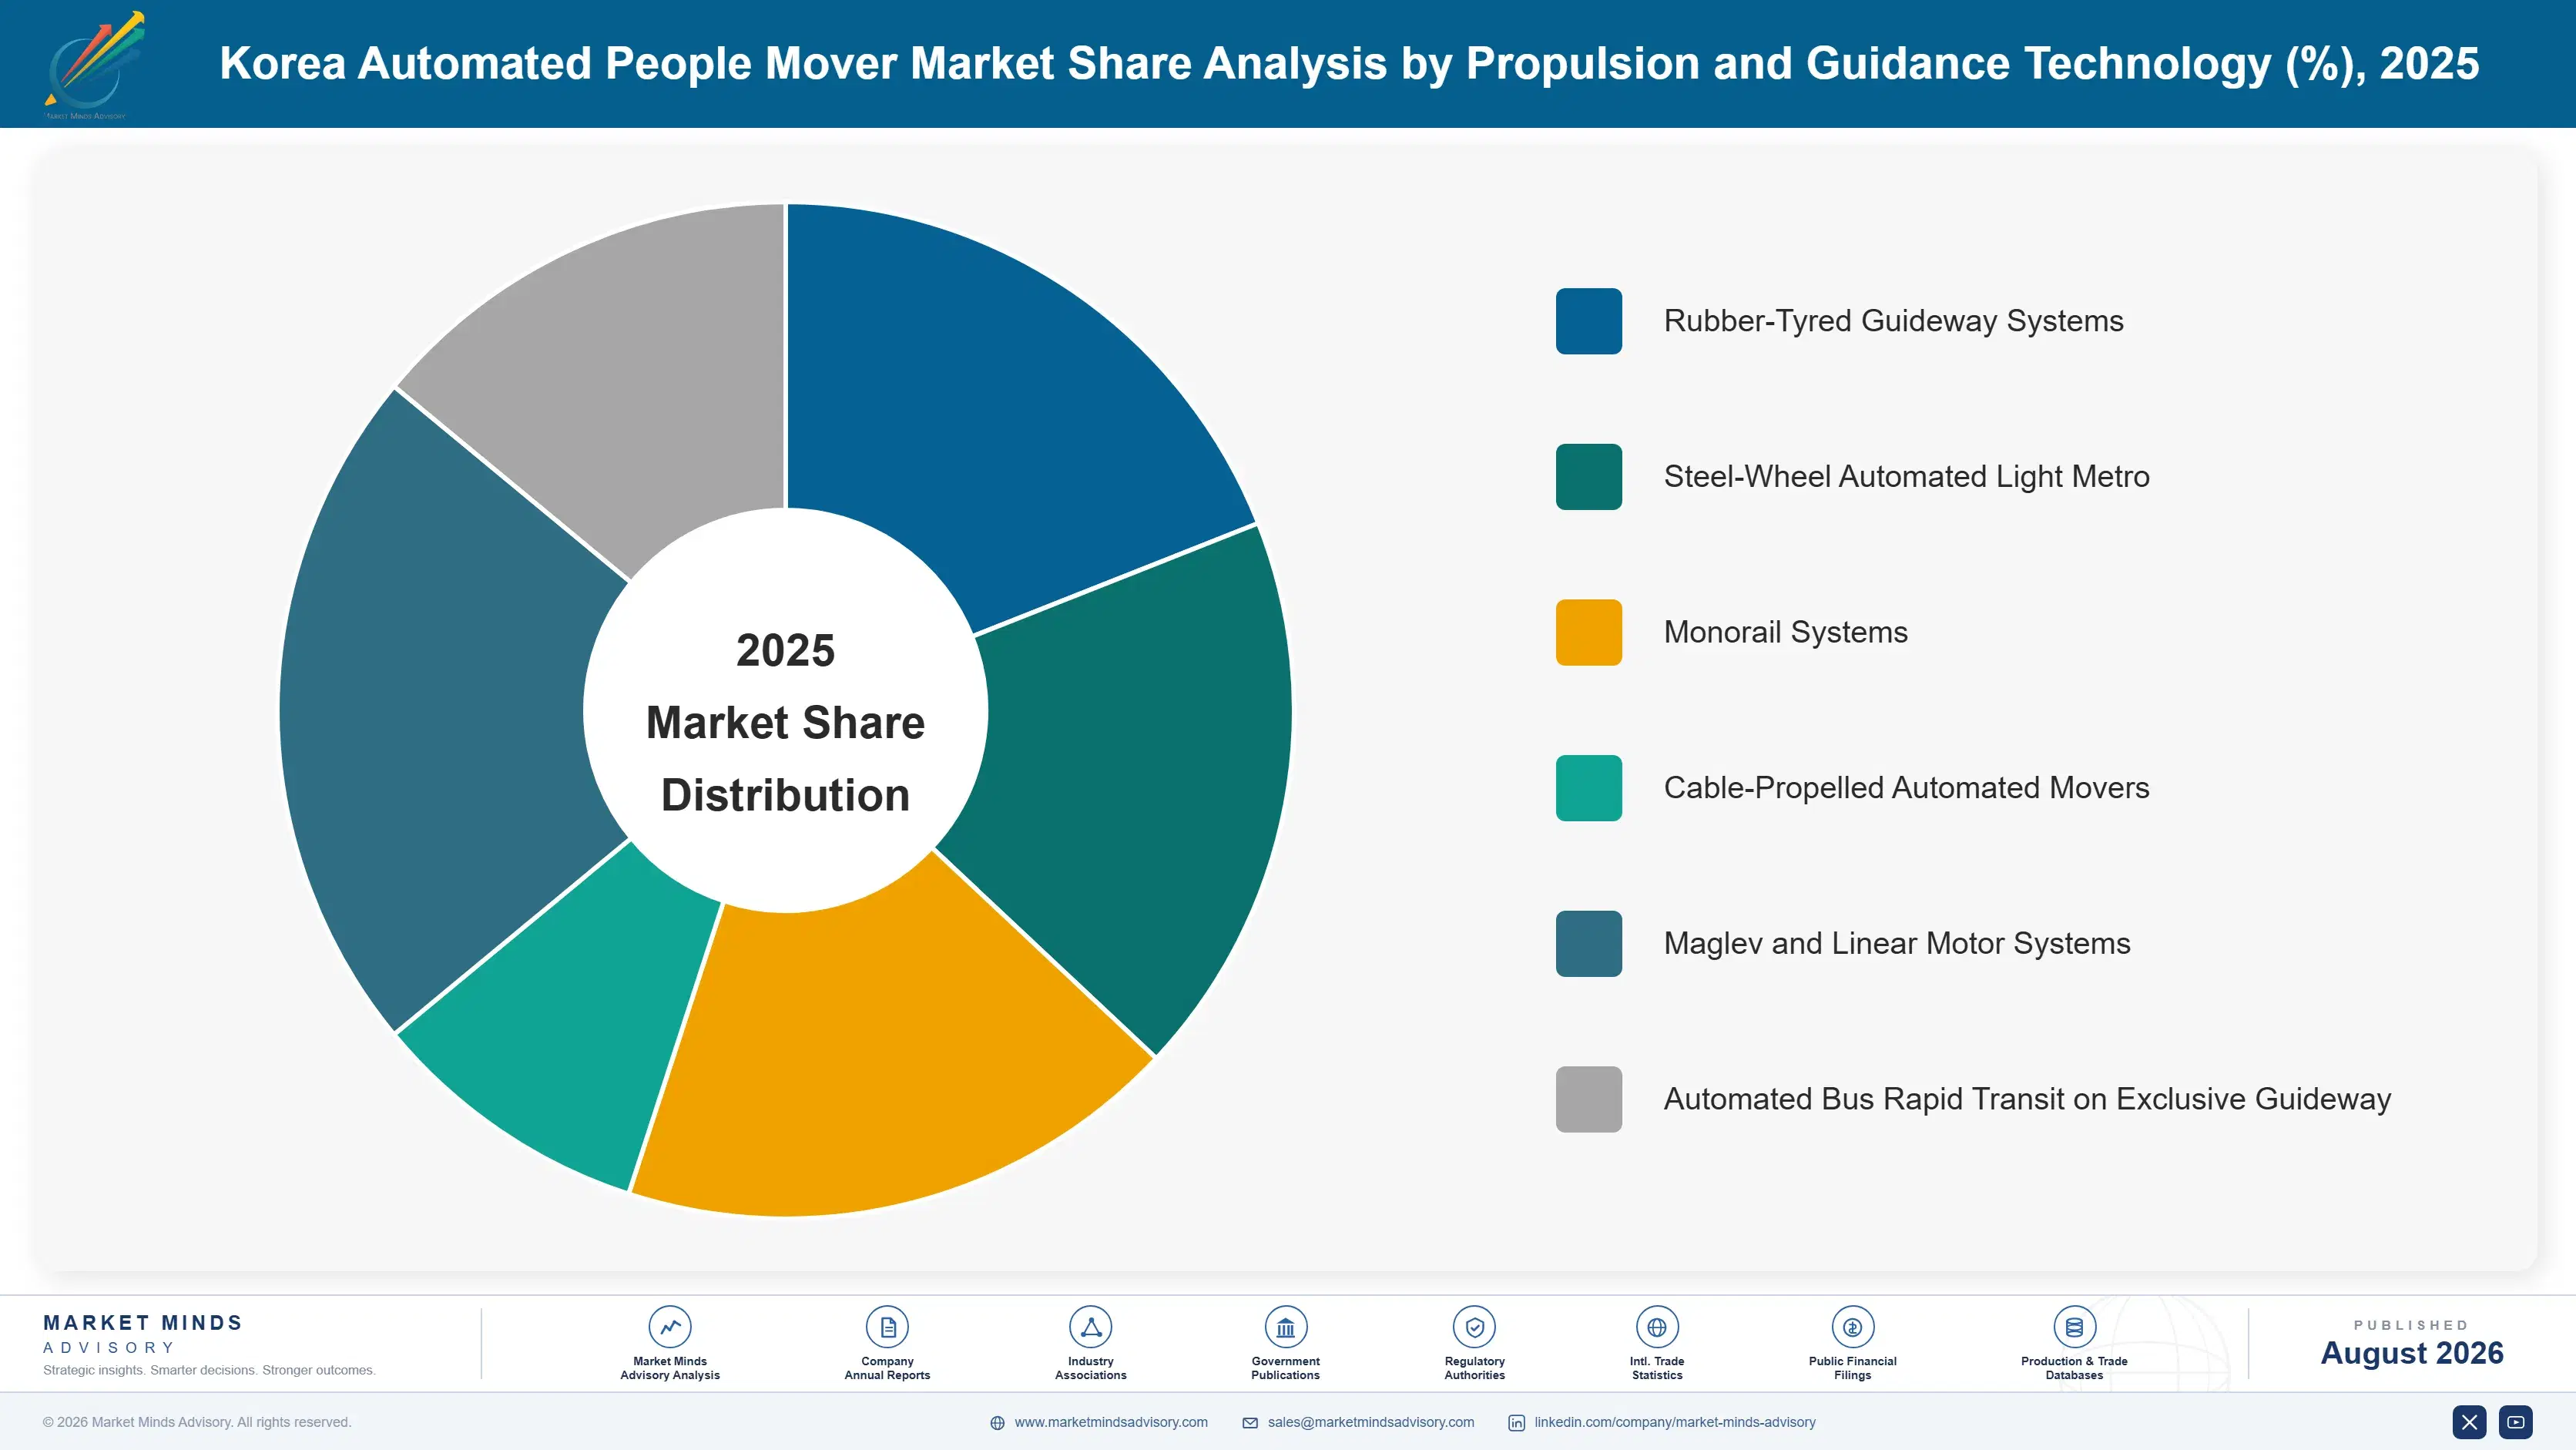
Systems are classified here by propulsion and guidance technology, since that determines civil engineering cost, capacity, gradient capability and which suppliers can deliver it. Application setting, capacity band and contract structure are handled separately in the framework, because a single technology serves airport and urban projects with the same engineering behind it. Technology decides the funding threshold.
korea-automated-people-mover-industry-market-trend-market-share-analysis-1787553487934

Automated Bus Rapid Transit on Exclusive Guideway

Growing at 11.7%, half again the market rate, this segment exists because fixed guideway civil engineering prices most corridors out of automated transit entirely. Optical or magnetic guidance on a dedicated roadway delivers full automation and comparable capacity without elevated structure or tunnelling, which changes the funding threshold a project has to clear. Growth comes off a small base and reflects corridors that were never going to receive a rail-based system rather than any displacement of one. The technology carries less operational history and the authorities buying it tend to be smaller cities accepting that trade knowingly. Suppliers from bus manufacturing rather than rail are competing here, which is unfamiliar territory for the incumbents.
CAGR 11.7%

Maglev and Linear Motor Systems

Linear motor propulsion removes the adhesion limit that constrains steel wheel systems on gradients, which matters enormously in hilly cities and on airport alignments squeezed between existing structures. Korean and Japanese engineering leads this technology and Chinese deployment has scaled it. Growth at 9.3% reflects specific alignment problems rather than any general preference, since the systems cost more and the supplier base is narrow. Maintenance economics are genuinely better because there is less mechanical contact to wear. The commercial constraint is that a procurement authority choosing linear motor accepts a smaller field of bidders, which is uncomfortable in a public tender and gets raised every time. That narrowing is the practical obstacle.
CAGR 9.3%
Full segment breakdown across 6 segments available in the complete report.

Regional Architecture and Country Demand Map

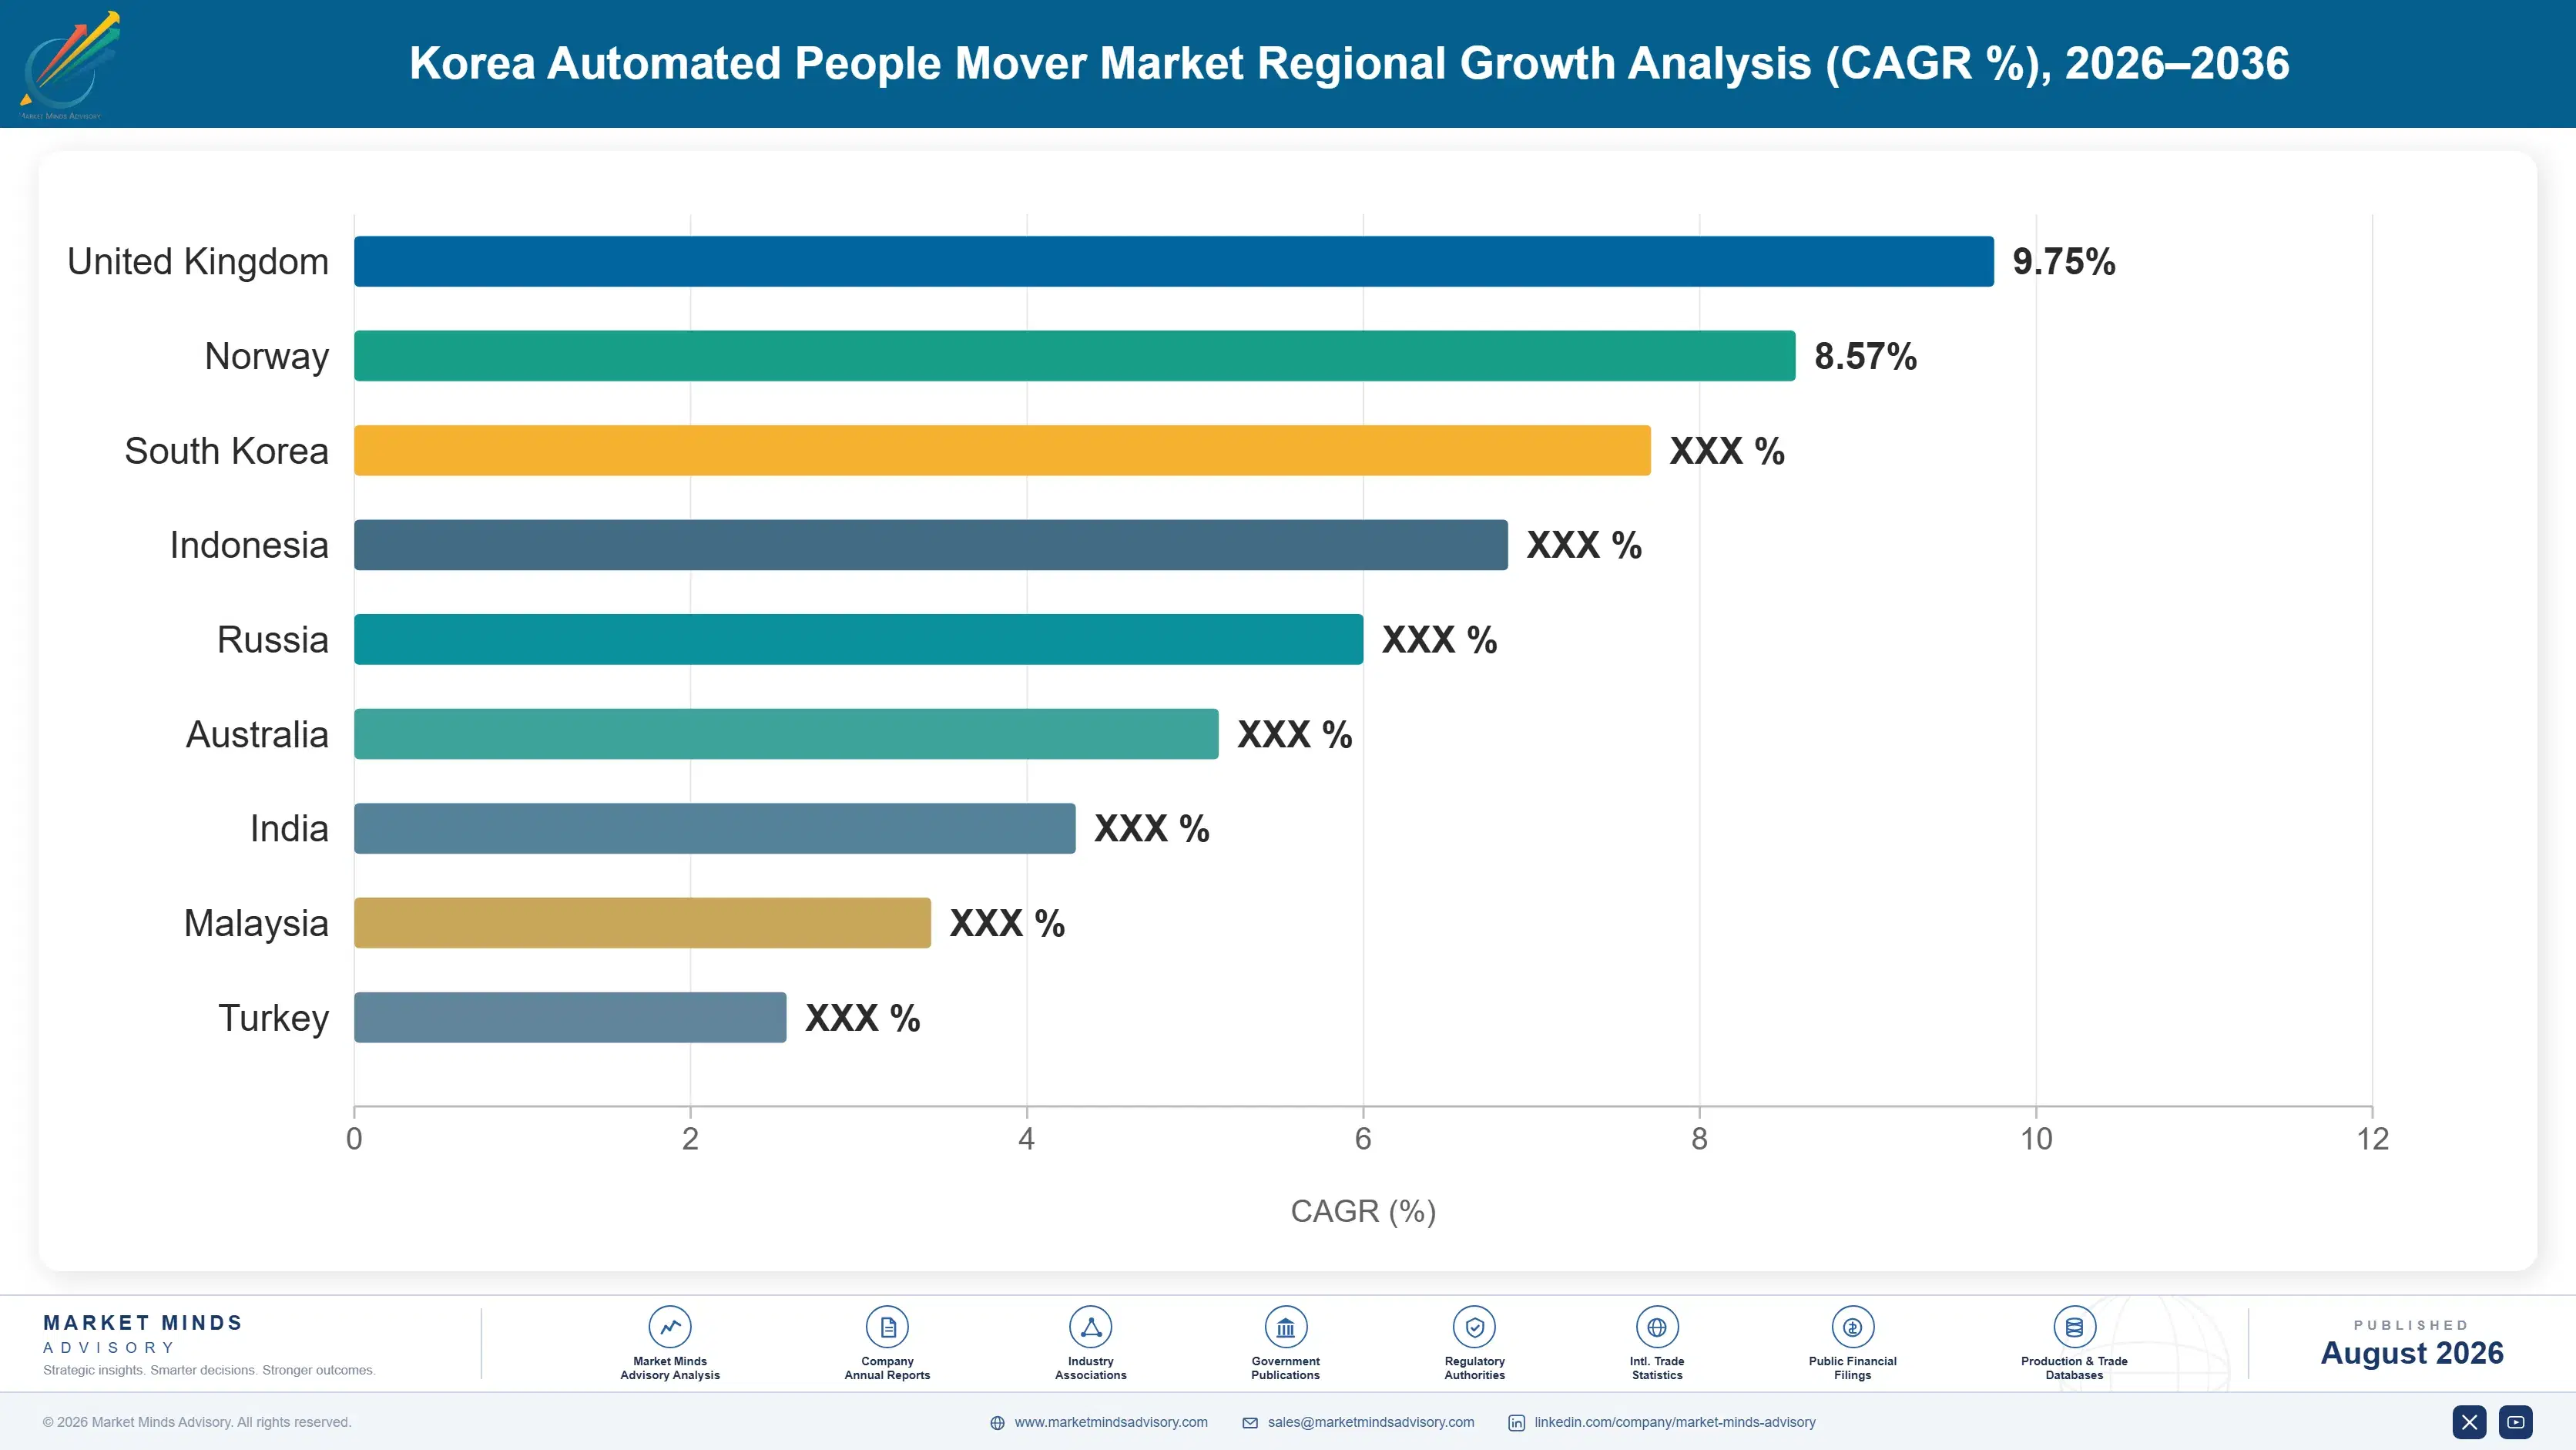
East Asia holds 28% of value on airport and urban automated projects together, and holds the most instructive project history anywhere. North America follows at 24% on airport shuttle systems almost entirely. Airport terminal design explains more of this map than urban transit policy does.

North America

Airport shuttle systems account for the large majority of demand here and the installed base is older than anywhere, which generates a substantial replacement and refurbishment requirement alongside new build. Atlanta, Denver, Dallas and several other hub airports have operated automated movers for decades and are now replacing first-generation systems entirely. Urban automated transit has barely developed, since American transit procurement favours conventional light rail and the political appetite for driverless operation is limited by labour considerations that are rarely discussed openly. Growth at 7.2% therefore tracks airport capital programmes almost exclusively. Vancouver remains the notable urban exception on the continent and has operated successfully for forty years without persuading anybody else.
Share: 24% | CAGR: 7.2% (2026 to 2036)

Western Europe

European automated metro has a longer and considerably happier history than the Korean experience, with Paris, Copenhagen, Milan and Barcelona operating driverless lines that carry the ridership their forecasts predicted. That track record matters commercially, since procurement authorities elsewhere cite it. Airport systems at the major hubs add steady demand. Retrofit of existing attended metro lines to unattended operation is the distinctive European opportunity and it is substantial, because the installed base is large and the operating cost argument is compelling. Growth at 6.2% is the weakest of the seven regions and reflects a mature market where retrofit rather than new build increasingly drives the numbers. The retrofit opportunity is larger than most suppliers acknowledge.
Share: 22% | CAGR: 6.2% (2026 to 2036)
Regional intelligence for 5 additional markets available in the complete report: East Asia, South Asia and Pacific, Latin America, Middle East and Africa, Eastern Europe. Contact sales@marketmindsadvisory.com.
korea-automated-people-mover-industry-market-trend-country-cagr-analysis-1787553488456

Where System Value Actually Sits

Four moves matter in a business where a project arrives once a decade and lasts twenty-five years. Two are about the automation and operations content that outlasts the vehicles, and two are about the projects that funding structures have historically excluded. Competing on rolling stock price is not among them. That question was settled some time ago.

Bid the operations agreement, not the system

A twenty-five year operations agreement is worth considerably more across its life than the capital delivery it follows, and vehicles are only 29% of contracted system value in any case. Suppliers structuring bids around availability performance across that period rather than around delivered capital cost are competing on the thing procurement authorities now actually price, since availability payment concessions made operational performance the compensation basis. That also finances better, because a lender assessing availability risk faces a very different proposition from one assessing ridership. Suppliers still leading with rolling stock capability are answering a question nobody is asking any more.
Market Impact: Captures a full 25 years of contracted revenue

Own the automation package across the system life

Signalling and automation content is larger than the vehicle content at 29% of system value and it outlasts the rolling stock by a full replacement cycle, which means the automation supplier holds the project when the trains get replaced. Grade four is now the default specification and the number of suppliers certified to deliver it is considerably smaller than the number able to build vehicles. That asymmetry is the whole competitive structure of this industry and rather few participants have organised around it. Holding the automation contract is what converts a single project into a permanent relationship.
Market Impact: Holds a package worth above 29% of system value

Take the corridors fixed guideway cannot fund

Automated guideway bus systems grow at 11.7% because civil engineering rather than automation is what prices corridors out of fixed guideway transit, and optical or magnetic guidance on a dedicated roadway removes most of that structure. The authorities buying these are smaller cities that were never going to procure a rail system at all, which means this is genuinely additional demand rather than displaced demand. Rail incumbents have mostly ignored it and bus manufacturers are competing instead. That is an unusual competitive gap in a market this concentrated and it is closing.
Market Impact: Enters a segment compounding at 11.7% each year

Sell airport systems on terminal design, not ridership

Airport projects deliver 44% of contracted value and behave nothing like urban transit, because a passenger changing terminals has no alternative and the funding comes from airport charges rather than fare revenue. That removes the demand risk that made urban concessions so difficult after the Korean experience. Suppliers presenting airport proposals through a transit lens are answering questions the airport planner is not asking, since the relevant argument is pier connectivity and passenger transfer time. Reaching airport masterplanning teams during terminal design rather than at tender captures specifications years before anybody bids.
Market Impact: Reaches the full 44% of contracted project value

Who Controls the Margin Pool

Five suppliers hold 62% of contracted automated people mover value, measured across vehicles, guideway systems, signalling and contracted operations, the basis used throughout this section. That concentration is high and it reflects a genuinely small field of organisations able to deliver an integrated automated system alongside a twenty-five year operations commitment. The gap between the leaders and everybody else is certified grade four automation capability rather than any ability to build rolling stock, which many more companies can do.
Competition runs on three dimensions. Automation certification depth, which decides who may bid at all on a grade four specification. Operations and maintenance track record, since availability payment concessions make that the compensation basis. And reference project credibility, because a procurement authority defending a decision publicly wants somewhere it can point to that works.

Rankings shift where automated guideway bus systems take corridors rail incumbents never bid for, and bus manufacturers competing there face none of the established rail relationships. Airport systems hold longest, because the replacement of an existing installation almost always goes to whoever can integrate with what is already there. Korean domestic procurement has restarted under structures that favour suppliers willing to carry availability rather than ridership risk.
korea-automated-people-mover-industry-market-trend-company-positioning-matrix-1787553488979

Competitive Moat and Risk Dimensions

ALSTOM

Moat: Automation certification breadth

Alstom holds certified grade four automation capability across several system technologies and jurisdictions, which lets it bid specifications that exclude most competitors before rolling stock is discussed at all. That certification portfolio took decades and considerable regulatory engagement to assemble across different safety authorities, and it cannot be acquired quickly by anybody entering the market now.
ALSTOM

Risk: Project delivery risk concentration

Large integrated system contracts carry delivery risk across civil interfaces the supplier does not control, and a delayed guideway or a changed station design reaches the supplier's schedule regardless of fault. Competitors bidding subsystem scope rather than integrated delivery carry considerably less of that exposure and sleep better through a difficult project.
HYUNDAI ROTEM

Moat: Korean project experience depth

Hyundai Rotem delivered through the Korean automated light rail programme and carries operational experience of exactly the ridership and concession problems that reshaped this industry, which is knowledge no competitor can acquire except by living through something similar. Korean procurement authorities restarting under new structures work with suppliers who understand what went wrong the first time.
HYUNDAI ROTEM

Risk: Domestic market concentration

A substantial share of the business depends on Korean and adjacent Asian procurement, which is a narrower base than European or Japanese competitors operate from. Export competition against Alstom, Siemens and Hitachi on their home references is genuinely difficult, and the Korean project history that provides useful experience is also a reference competitors will raise.

Players Tracked

Prominent Players

Alstom
Siemens Mobility
Hitachi Rail
Mitsubishi Heavy Industries
Hyundai Rotem

Other Key Players

CRRC
Doppelmayr Cable Car
Leitner Group
BYD
Woojin Industrial Systems
Kawasaki Heavy Industries
Niigata Transys
Wabtec
Knorr-Bremse
Stadler Rail
CAF
Nippon Signal
Kyosan Electric
Ingerop
Lea+Elliott

Recent Developments

APRIL 2025

Hyundai Rotem secured an automated light metro contract under an availability payment structure

Hyundai Rotem won an automated light metro delivery and operations contract structured on availability payments rather than any minimum revenue guarantee. The award was a competitive procurement rather than a partnership, and it reflects Korean authorities restarting urban automated projects under concession terms revised after earlier ridership experience.
Signal: Korean procurement has restarted under structures that transfer availability rather than demand risk, which is the durable lesson here
SEPTEMBER 2025

Alstom expanded grade four automation retrofit capability for existing metro lines

Alstom increased engineering and delivery capacity for converting attended metro lines to unattended operation, targeting European operators pursuing operating cost reduction across mature networks. The expansion was organic rather than an acquisition, and it addresses an installed base considerably larger than the new-build market. Operating cost drove every conversation.
Signal: Retrofit of existing lines is a larger addressable base than new build and rather few suppliers have organised around it
JANUARY 2026

A Chinese manufacturer won an automated guideway bus system contract outside its home market

A Chinese manufacturer secured an automated bus rapid transit system on exclusive guideway in a Southeast Asian city, competing against no rail-based bidders at all. The award was a competitive procurement rather than any partnership, and the corridor had previously failed to justify fixed guideway civil engineering.
Signal: Rail incumbents are not bidding these corridors, which leaves the fastest growing segment to competitors from an entirely different industry

What Drives System Cost

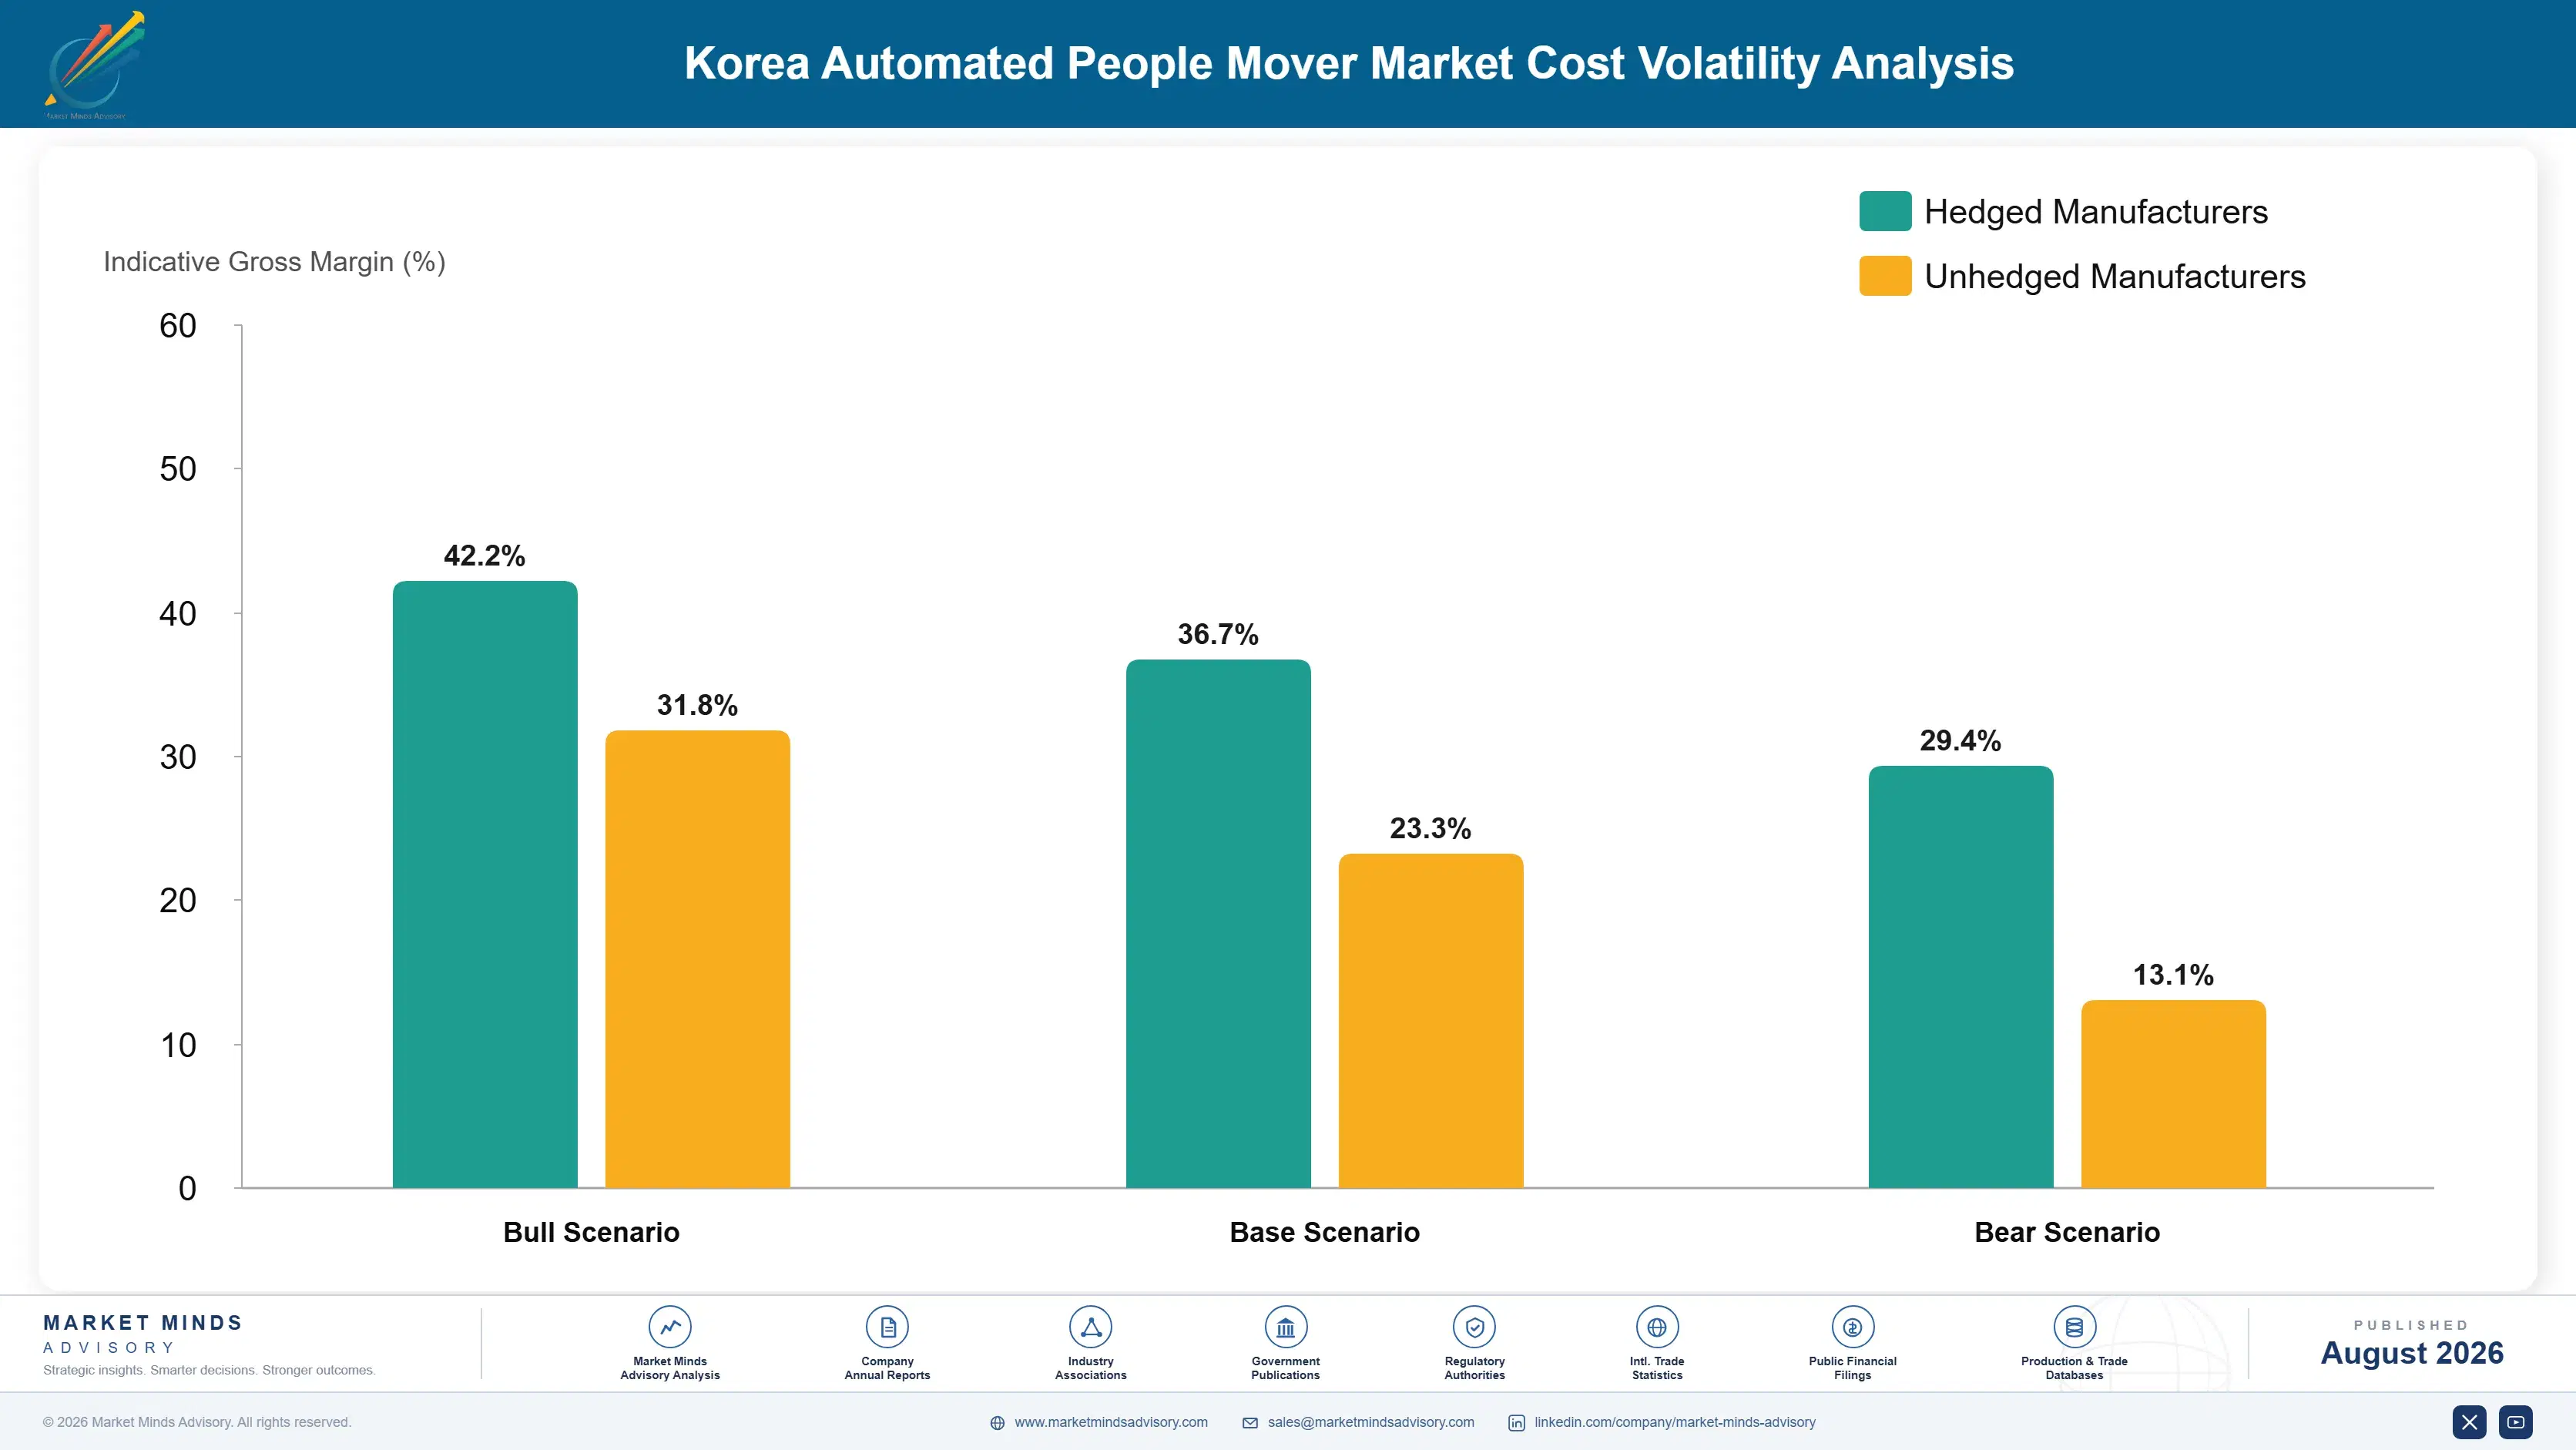
Civil engineering accounts for around 48% of total delivered system cost on elevated or tunnelled alignments, with vehicles at 29%, signalling and automation, power supply and depot facilities making up the balance. Steel, concrete and construction labour therefore matter more than anything a rolling stock manufacturer buys. Automation subsystems carry semiconductor and control electronics exposure. Guideway steel comes from regional mills on project-specific contracts.
Construction material and labour costs rose sharply across most markets through 2021 and 2022, and European energy costs raised steel and cement production expense simultaneously. IEA data show European industrial energy well above American levels then. Alstom recorded input cost and supply chain pressure across its rolling stock and systems operations in its Annual Report 2022. Suppliers on fixed-price project contracts absorbed a great deal of it, because a public infrastructure contract rarely reopens.

The fixed-price public contract is what makes this exposure severe. A system priced at tender and delivered across five to seven years carries every cost movement in between with limited recourse. Suppliers bidding subsystem scope rather than integrated delivery carry less of it. Operations agreements carry different exposure, since twenty-five year contracts generally include indexation.
korea-automated-people-mover-industry-market-trend-cost-volatility-analysis-1787553489177

Index capital delivery contracts to published construction benchmarks

Pricing a five year system delivery against fixed cost assumptions transfers every input movement to the supplier over a period nobody forecasts. Indexing to published construction cost and steel benchmarks is standard practice in some jurisdictions and absent in others, and where it is absent the tender price carries a risk premium instead. Authorities prefer the premium and should not.

Bid subsystem scope where civil interface risk is uncontrolled

Integrated delivery contracts expose a supplier to civil engineering schedules and station design changes it does not control, and those reach the delivery programme regardless of fault. Bidding signalling and vehicles as separate scope carries less exposure and less revenue, which is the trade. Suppliers accepting integrated risk without pricing the interface uncertainty have generally regretted it publicly.

Structure operations agreements with genuine indexation

A twenty-five year operations agreement without adequate indexation transfers a quarter century of labour and energy cost inflation to the operator, which nobody can forecast and few price correctly at bid. Indexation to published labour and energy indices is standard in mature markets and negotiable elsewhere. The Korean concessions were not the only ones with unmodelled terms.

Portfolio Architecture for Margin Defence

Margin in automated people mover systems tracks certification scarcity and contract duration rather than manufacturing content. Rolling stock delivery runs at gross margins in the low teens, competing against several capable builders on a component representing 29% of system value. Signalling and automation packages run considerably higher, because certified grade four capability narrows the field sharply and the package outlasts the vehicles it controls. Twenty-five year operations agreements run higher again across their life, though the returns arrive slowly.
The tension is that capital delivery generates the revenue that shows in an annual report and operations generates the returns that show over a career, and the two require entirely different organisations. A project delivery business optimised for schedule and interface management handles a twenty-five year availability commitment badly. Suppliers running both have generally found capital delivery consuming the attention that long operations agreements needed, which shows up as availability penalties nobody forecast.

High-value pools sit in certified automation packages, long operations agreements and the guideway bus corridors rail incumbents are ignoring. None of the three is where the visible contract value currently concentrates. Rolling stock capability by itself defends nothing whatsoever now.

Volume / Commodity-Adjacent

Rolling stock delivery and guideway structural supply into projects where several capable builders compete on delivered capital cost against a published specification. The eight-point range separates suppliers with integrated automation content from those delivering vehicles into somebody else's system architecture entirely.
Gross Margin: 11%-19%

Premium / Certified

Signalling and automation packages certified to grade four across the relevant safety jurisdiction, supplied with the integration engineering that makes them work. The nine-point spread reflects certification breadth, since a supplier certified in several jurisdictions bids projects a single-jurisdiction competitor cannot reach.
Gross Margin: 24%-33%

Sustainability / Regulatory / Next-Generation

Long operations and availability agreements, grade four retrofit of existing attended lines, and automated guideway bus systems. The sixteen-point range is wide because pricing reflects risk transfer terms and competitive field rather than any delivery cost a procurement authority can benchmark.
Gross Margin: 30%-46%
korea-automated-people-mover-industry-market-trend-portfolio-architecture-1787553489669

High-value Sub-segments and Strategic Watch-out

Twenty-Five Year Operations Agreements

Worth considerably more across their life than the capital delivery preceding them, and now priced on availability rather than ridership after the Korean experience reset every concession structure. Suppliers still leading with rolling stock are answering an obsolete question entirely. Very few have restructured around it.
Gross Margin: 32%-46%

Grade Four Retrofit Of Existing Lines

The installed base of attended metro is considerably larger than the new-build pipeline and the operating cost argument for conversion is compelling everywhere. Certification narrows the field sharply. Rather few suppliers have organised commercially around retrofit as a distinct business. That absence is a genuine opening.
Gross Margin: 30%-42%

Rolling Stock Delivery

Only 29% of system value, competed by several capable builders and outlasted by the signalling that controls it, which makes it the least defensible position in the whole market. Manage it as the entry ticket to everything else rather than as the business. Nothing else defends it anywhere.
Gross Margin: 11%-19%

Automated Guideway Bus Corridors

Compounding at 11.7% on corridors that civil engineering cost excluded from fixed guideway entirely, which makes it additional demand rather than displaced demand. Rail incumbents are not bidding and bus manufacturers are winning. That gap is closing quickly. Rail incumbents should be worried by that.
Gross Margin: 26%-40%

How System Demand Renews

Demand here renews on two clocks that operate on completely different timescales. Capital projects arrive when an airport expands or a city funds a corridor, which happens once in a decade or two for any given authority and depends on political and financial conditions nobody controls. Operations revenue runs continuously across twenty-five year agreements once a system opens, which makes the installed base worth considerably more than the pipeline for any supplier that holds those contracts.
Stickiness is extreme once a system is running. Replacing rolling stock on an existing guideway means matching an architecture the original supplier defined, and replacing the signalling means recommissioning a running railway that carries passengers every day. Airport systems are stickiest of all, since replacement work happens around live operations that cannot pause. New corridors are competitive and rare, which makes each worth unusual bidding effort.

The buyer has changed and rather few suppliers adjusted. Procurement once sat with transit engineers comparing technical specifications and capital cost. It increasingly sits with public finance functions assessing risk transfer across twenty-five years, and with airport planners for whom the system is a design consequence. Neither of those reads a rolling stock brochure.
korea-automated-people-mover-industry-market-trend-end-use-penetration-index-1787553490159

Where To Place The Bet

These are among the four positions where our research anticipates prominent divergence between winners and laggards over the coming forecast period. Each is grounded in the demand model, the regulatory perimeter, and the announced capacity pipeline.
01 / AVAILABILITY CONTRACT STRUCTURING

Bid availability, not ridership or rolling stock

Korean minimum revenue guarantee concessions produced ridership around 47% below forecast and compensation liabilities that reshaped how these projects are structured across every market since, and availability payments are now the settled answer. Suppliers structuring bids around availability performance across a twenty-five year agreement are competing on what procurement authorities actually price now, and lenders assess that risk on a completely different basis from demand risk. Suppliers still leading with rolling stock capability are answering a question nobody in procurement is asking any more.
02 / AUTOMATION PACKAGE OWNERSHIP

Hold the signalling, not just the trains

Vehicles represent only 29% of contracted system value and the signalling and automation package is both larger and longer lived, outlasting the rolling stock it controls by a full replacement cycle in most installations. Grade four is the default new-build specification and the number of suppliers certified to deliver it is considerably smaller than the number capable of building vehicles to a published specification. That asymmetry is the entire competitive structure of this industry, and holding the automation contract converts one project into a permanent relationship.
03 / GUIDEWAY BUS ENTRY

Bid the corridors rail incumbents are ignoring

Automated guideway bus systems compound at 11.7% because civil engineering rather than automation is what prices corridors out of fixed guideway transit, and optical or magnetic guidance removes most of that structural cost entirely. The authorities procuring these systems are smaller cities that were never realistically going to buy a rail system, which makes the demand genuinely additional rather than displaced from anywhere. Rail incumbents have largely ignored the segment and bus manufacturers are winning it, which is an unusual gap in a market this concentrated.
04 / AIRPORT MASTERPLAN ACCESS

Reach the terminal designer before the tender

Airports deliver 44% of contracted value in this market and behave nothing like urban transit, since a passenger changing terminals has no alternative and the funding comes from airport charges rather than from any fare box. The system is a consequence of terminal design rather than of a demand forecast, which means the specification gets settled during masterplanning years before a tender is published anywhere. Suppliers arriving at tender are bidding against a specification that somebody else already helped to write.

Engagement Snapshot From the Field

A live engagement with an industry participant carrying material or product regulatory and market exposure ahead of a defining policy shift, showing how our research translates into a defensible multi-year portfolio strategy.
MARKET MINDS ADVISORY · CLIENT ENGAGEMENT SUMMARY
Korea Automated People Mover Producer Strategic Portfolio Review and Transition Roadmap 2026·Investment Scenario on Korea Automated People Mover Exposure Evaluation 2025-26
CLIENT PROFILE
A Korean metropolitan transit authority responsible for an existing automated light rail line and planning a second corridor, with annual operating expenditure around KRW 210 billion (client-reported, unverified by MMA). The existing line had opened under a minimum revenue guarantee concession and carried ridership far below its original forecast. Compensation payments had become a recurring budget item nobody had planned for.
STRATEGIC CHALLENGE
Compensation under the existing guarantee had cost the authority substantially more across a decade than the entire capital contribution to the line (client-reported, unverified by MMA), and the second corridor was being planned under a similar structure by default. Political tolerance for another such outcome was nil. Nobody had modelled what an alternative structure would actually cost.
MMA APPROACH
MMA modelled availability payment and revenue guarantee structures against the second corridor's realistic ridership range rather than against the original forecast methodology. Comparable European and Japanese concession terms were assessed through the expert interview programme. Supplier appetite for availability risk was tested directly with the likely bidders, and the existing line's compensation history was reconstructed to establish where the forecast actually failed.
KEY FINDINGS
  1. The original forecast had applied methodology developed for heavy metro corridors to a light rail alignment with no comparable precedent, which explained most of the shortfall.
  2. Availability payment structures would cost the authority more in nominal terms and considerably less in downside scenarios, which is the trade nobody had explicitly priced before.
  3. Every likely bidder was willing to accept availability risk and none would accept demand risk again after the previous decade, which narrowed the concession choice sharply.
  4. The existing line's concession could be renegotiated toward availability terms, which several comparable authorities elsewhere had already done successfully under similar circumstances.
CLIENT PROFILE
A Korean metropolitan transit authority responsible for an existing automated light rail line and planning a second corridor, with annual operating expenditure around KRW 210 billion (client-reported, unverified by MMA). The existing line had opened under a minimum revenue guarantee concession and carried ridership far below its original forecast. Compensation payments had become a recurring budget item nobody had planned for.
STRATEGIC CHALLENGE
Compensation under the existing guarantee had cost the authority substantially more across a decade than the entire capital contribution to the line (client-reported, unverified by MMA), and the second corridor was being planned under a similar structure by default. Political tolerance for another such outcome was nil. Nobody had modelled what an alternative structure would actually cost.
MMA APPROACH
MMA modelled availability payment and revenue guarantee structures against the second corridor's realistic ridership range rather than against the original forecast methodology. Comparable European and Japanese concession terms were assessed through the expert interview programme. Supplier appetite for availability risk was tested directly with the likely bidders, and the existing line's compensation history was reconstructed to establish where the forecast actually failed.
KEY FINDINGS
  1. The original forecast had applied methodology developed for heavy metro corridors to a light rail alignment with no comparable precedent, which explained most of the shortfall.
  2. Availability payment structures would cost the authority more in nominal terms and considerably less in downside scenarios, which is the trade nobody had explicitly priced before.
  3. Every likely bidder was willing to accept availability risk and none would accept demand risk again after the previous decade, which narrowed the concession choice sharply.
  4. The existing line's concession could be renegotiated toward availability terms, which several comparable authorities elsewhere had already done successfully under similar circumstances.
RECOMMENDED STRATEGY
Phase 1: Phase one: structure the second corridor on availability payments and publish the ridership range rather than a single forecast figure that nobody can defend. Phase 2: Phase two: open renegotiation of the existing concession toward availability terms, using comparable precedent from authorities that have already done it. Phase 3: Phase three: rebuild ridership forecasting methodology for light rail alignments rather than continuing to borrowing heavy metro assumptions wholesale from elsewhere.
OUTCOME
The second corridor is being procured on availability payments and bidder response has been strong. Renegotiation of the existing concession has opened. The authority reports its modelled downside exposure across the second line as a fraction of what the existing structure produced (client-reported, unverified by MMA).

Frequently Asked Questions

Foundational context covering the market sizes, CAGR, scope, country, region and competition that inform every finding below. This section is provided to cover basics and most often pre-purchase conversations, answered from the MMA Primary Research Dataset.

What is the current size of the Korea Automated People Mover Market?

The global market was valued at USD 4.9 billion in 2025, rising to an estimated USD 5.28 billion in 2026. East Asia holds the largest regional share at 28% of value.

How large will the Korea Automated People Mover Market be by 2036?

MMA forecasts USD 11.20 billion by 2036 under the base case, an expansion multiple of 2.12 times the 2026 value. That represents USD 5.92 billion of incremental value.

What is the CAGR for the Korea Automated People Mover Market 2026 to 2036?

The base case runs at 7.8% compound annual growth between 2026 and 2036, with a bull case at 9.1% and a bear case at 6.5%. Historical growth from 2020 to 2025 was 6.4%.

Which segment is growing fastest?

Automated bus rapid transit on exclusive guideway leads at 11.7%, half again the market rate, because it avoids fixed guideway civil engineering cost. Maglev and linear motor systems follow at 9.3%.

Who are the major companies in the Korea Automated People Mover Market?

Alstom, Siemens Mobility, Hitachi Rail, Mitsubishi Heavy Industries and Hyundai Rotem hold 62% between them. Certified automation capability rather than rolling stock manufacture sustains those positions.

Which country is growing fastest?

India leads at 10.6%, driven by airport terminal expansion and by urban metro lines specified for unattended operation from the outset rather than retrofitted later on.

Report Segmentation Architecture

The full report scope spans multiple orthogonal segmentation dimensions, with cross-tabulated demand data provided for each dimension pair. Coverage extends further to regional breakdowns, trend trajectories, and the competitive detail needed to support segment-level decision-making.

By Propulsion and Guidance Technology

  • Rubber-Tyred Guideway Systems
  • Steel-Wheel Automated Light Metro
  • Monorail Systems
  • Cable-Propelled Automated Movers
  • Maglev and Linear Motor Systems
  • Automated Bus Rapid Transit on Exclusive Guideway

By End-Use Industry

  • Airport Passenger Transfer
  • Urban Public Transit
  • Campus and Institutional Circulation
  • Theme Park and Resort Transport
  • Industrial Site Movement
  • Intercity Feeder Connection

By Contract Structure

  • Public Capital Procurement
  • Availability Payment Concession
  • Design Build Operate Maintain
  • Turnkey System Supply
  • Operations and Maintenance Only

By Region

  • North America
  • Western Europe
  • East Asia
  • South Asia and Pacific
  • Latin America
  • Middle East and Africa
  • Eastern Europe

Scope, Methodology, and Coverage

Every figure in this report is reproducible from documented input assumptions. The scope below maps the historical period, the forecast horizon, the segmentation dimensions, and the countries covered, alongside the underlying primary and qualitative methodology.
Historical Period
2020 to 2025
Forecast Period
2026 to 2036
Base Year
2025 (USD billions; MMA Primary Research Dataset, August 2026)
Market Definition
The market comprises fully automated, driverless passenger transport systems operating on exclusive guideway, covering rubber-tyred guideway systems, steel-wheel automated light metro, monorail, cable-propelled movers, maglev and linear motor systems, and automated bus rapid transit on exclusive guideway. Value covers vehicles, guideway systems, signalling and automation, and contracted operations, with Korea treated as the analytical centre. Conventional attended metro and rail, tramways sharing road space, escalators and moving walkways, airport baggage handling, and civil engineering works procured separately fall outside scope.
Quantitative Units
USD billions (current prices); contracted system kilometres awarded annually; USD per route kilometre by technology
Segmentation Dimensions
By Propulsion and Guidance Technology; By End-Use Industry; By Contract Structure; By Region
Regions Covered
North America, Western Europe, East Asia, South Asia and Pacific, Latin America, Middle East and Africa, Eastern Europe
Countries Covered
South Korea, Japan, China, Taiwan, Singapore, India, Malaysia, Thailand, Australia, United States, Canada, Mexico, France, Denmark, Italy, Spain, Germany, United Kingdom, Netherlands, Sweden, Poland, Czechia, Hungary, Brazil, Chile, Colombia, United Arab Emirates, Saudi Arabia, Qatar, South Africa
Key Companies Profiled
Alstom, Siemens Mobility, Hitachi Rail, Mitsubishi Heavy Industries, Hyundai Rotem, CRRC, Doppelmayr Cable Car, Leitner Group, BYD, Woojin Industrial Systems, Kawasaki Heavy Industries, Niigata Transys, Wabtec, Knorr-Bremse, Stadler Rail, CAF, Nippon Signal, Kyosan Electric, Ingerop, Lea+Elliott
Quantitative Methodology
Primary survey, n=3,800 respondents, Q4 2025, six countries; demand-side model with trade association cross-validation
Qualitative Methodology
47 expert interviews, Q4 2025; applied to validate demand model assumptions, identify emerging dynamics, and assess competitive positioning
Report Format
PDF and XLSX data workbook (Word format preview document)
Publisher
Market Minds Advisory
Report Code
MMA-2026-CON-268
Published
August 2026
Contact
sales@marketmindsadvisory.com | www.marketmindsadvisory.com

Purchase the full Korea Automated People Mover Market Report (2026 to 2036).

The full report sizes the global automated people mover market to 2036 across six propulsion and guidance technologies and seven regions, covering vehicles, systems, signalling and contracted operations. It treats the Korean ridership and concession experience as the governing commercial lesson, and traces how availability payment structures changed procurement across every market since. Competitive analysis covers 20 participants evaluated on contracted system value, with moat and risk assessment for the two leaders. Airport and urban demand are separated throughout, and input cost exposure runs from construction materials to fixed-price public contracts. Four quantified revenue levers close the analysis.
Six-technology segment sizing with segment-level growth rates
Seven-region share and growth breakdown to 2036
Twenty-participant competitive map on one contracted value basis
Concession structures compared against ridership outcome history
Input cost exposure traced to construction materials and labour
Four quantified revenue levers with commercial impact ranges

Built For The People Who Decide

From boardroom strategy to bench-side execution, this report is read cover-to-cover by leaders shaping the next decade of their industry, turning demand scenarios, market dynamics and valuation benchmarks into decisions.
CXOs/ Presidents/ VPs/ Managers
M&A and Corporate Development
Strategy Teams and R&D Heads
Procurement and Product Directors
Regulatory and Compliance Leaders
Investor Relations and Equity Analysts