Market Minds Advisory
Demand for Virtual Machines in Japan

Demand for Virtual Machines in Japan: Demand for Virtual Machines in Japan: A Licensing Shock Reopened a Decision Nobody Had Revisited in Fifteen Years

Renewal costs rose by around 3.4 times for many commercial hypervisor customers, which reopened a platform decision most enterprises had left untouched since the day they first virtualised anything at all.

Lead Analyst

Published

September 2026

Make Smarter Decisions with Customized Research Insights

Request a free sample report and evaluate market opportunities, growth trends, and competitive dynamics relevant to your business needs.

2025 MARKET VALUE$18.6BMarket Size 2025
2036 FORECAST VALUE$47.0BBase Case , 2026 to 2036
CAGR 2026 TO 20368.8 %Bull 10.0% / Bear 7.6%
INCREMENTAL OPPORTUNITY$26.8BNet 10- year value creation
EXPANSION MULTIPLE2.32x2036 value over 2026 base
Strategic Levers
M&A Pipeline
Regional Outlook
Country Rankings
Competitive Intelligence
Segmental Deep-dive
Call-Us : 91 93563 13602

Executive Snapshot and Market Trajectory.

Containers were never the threat to virtual machines that everybody described. A renewal invoice was. Licence costs rising around 3.4 times reopened a platform decision most enterprises had not examined since the day they first virtualised anything at all. Nothing technical caused any of this at all.
Open source hypervisor platforms grow at 13.2%, half again the market rate of 8.8%, because a customer facing that renewal now has a reason to evaluate alternatives seriously. Sovereign and regional cloud services follow at 11.4%. East Asia takes 34% of value, and Japanese enterprises are the most exposed of any developed market since roughly 64% of their workloads still run on-premises. Hyperscale cloud virtual machines grow at 10.2% behind both of them.
Concentration sits near 63% across the top five on measured platform and service revenue. The awkward detail is that around 78% of production container platforms run on virtual machines, so container adoption has been generating hypervisor demand throughout the period the industry spent describing it as a replacement. Migration duration near 19 months rather than price is what decides whether any of it actually happens.
Market Definition
This market covers virtualisation platform software and the managed services built directly upon it, spanning open source hypervisor platforms, sovereign and regional cloud virtual machine services, hyperscale cloud virtual machines, commercial on-premises hypervisor licensing, container host virtualisation, and virtual desktop and workspace hosting. Revenue is measured as licence, subscription and attributable managed service value at supplier level, with Japan treated as the analytical centre within a global sizing frame. Server and storage hardware, bare metal cloud compute sold without virtualisation, container orchestration software licensed separately, and application software running inside virtual machines are excluded.
Base Year Value
$18.6B in 2025 (MMA Primary Research Dataset, September 2026)
Forecast Period
2026 to 2036, eleven discrete annual values
CAGR
8.8% base case. Bull 10.0%. Bear 7.6%.
Fastest Growth Segment
Open Source Hypervisor Platforms: 13.2% CAGR
Fastest Growth Country
India: 12.2% CAGR
Fastest Growth Region
South Asia and Pacific: 11.0% CAGR
Largest Region
East Asia: 34% of 2025 global value
Market Leaders
Broadcom, Microsoft, Nutanix, Red Hat and Amazon Web Services lead on measured platform and managed service revenue. Source: MMA Primary Research Dataset, July 2026.
Primary Survey
n=3,800 procurement and R&D decision-makers, Q4 2025, six countries
Methodology
Demand-side build-up, cross-validated against public data, 47 expert interviews

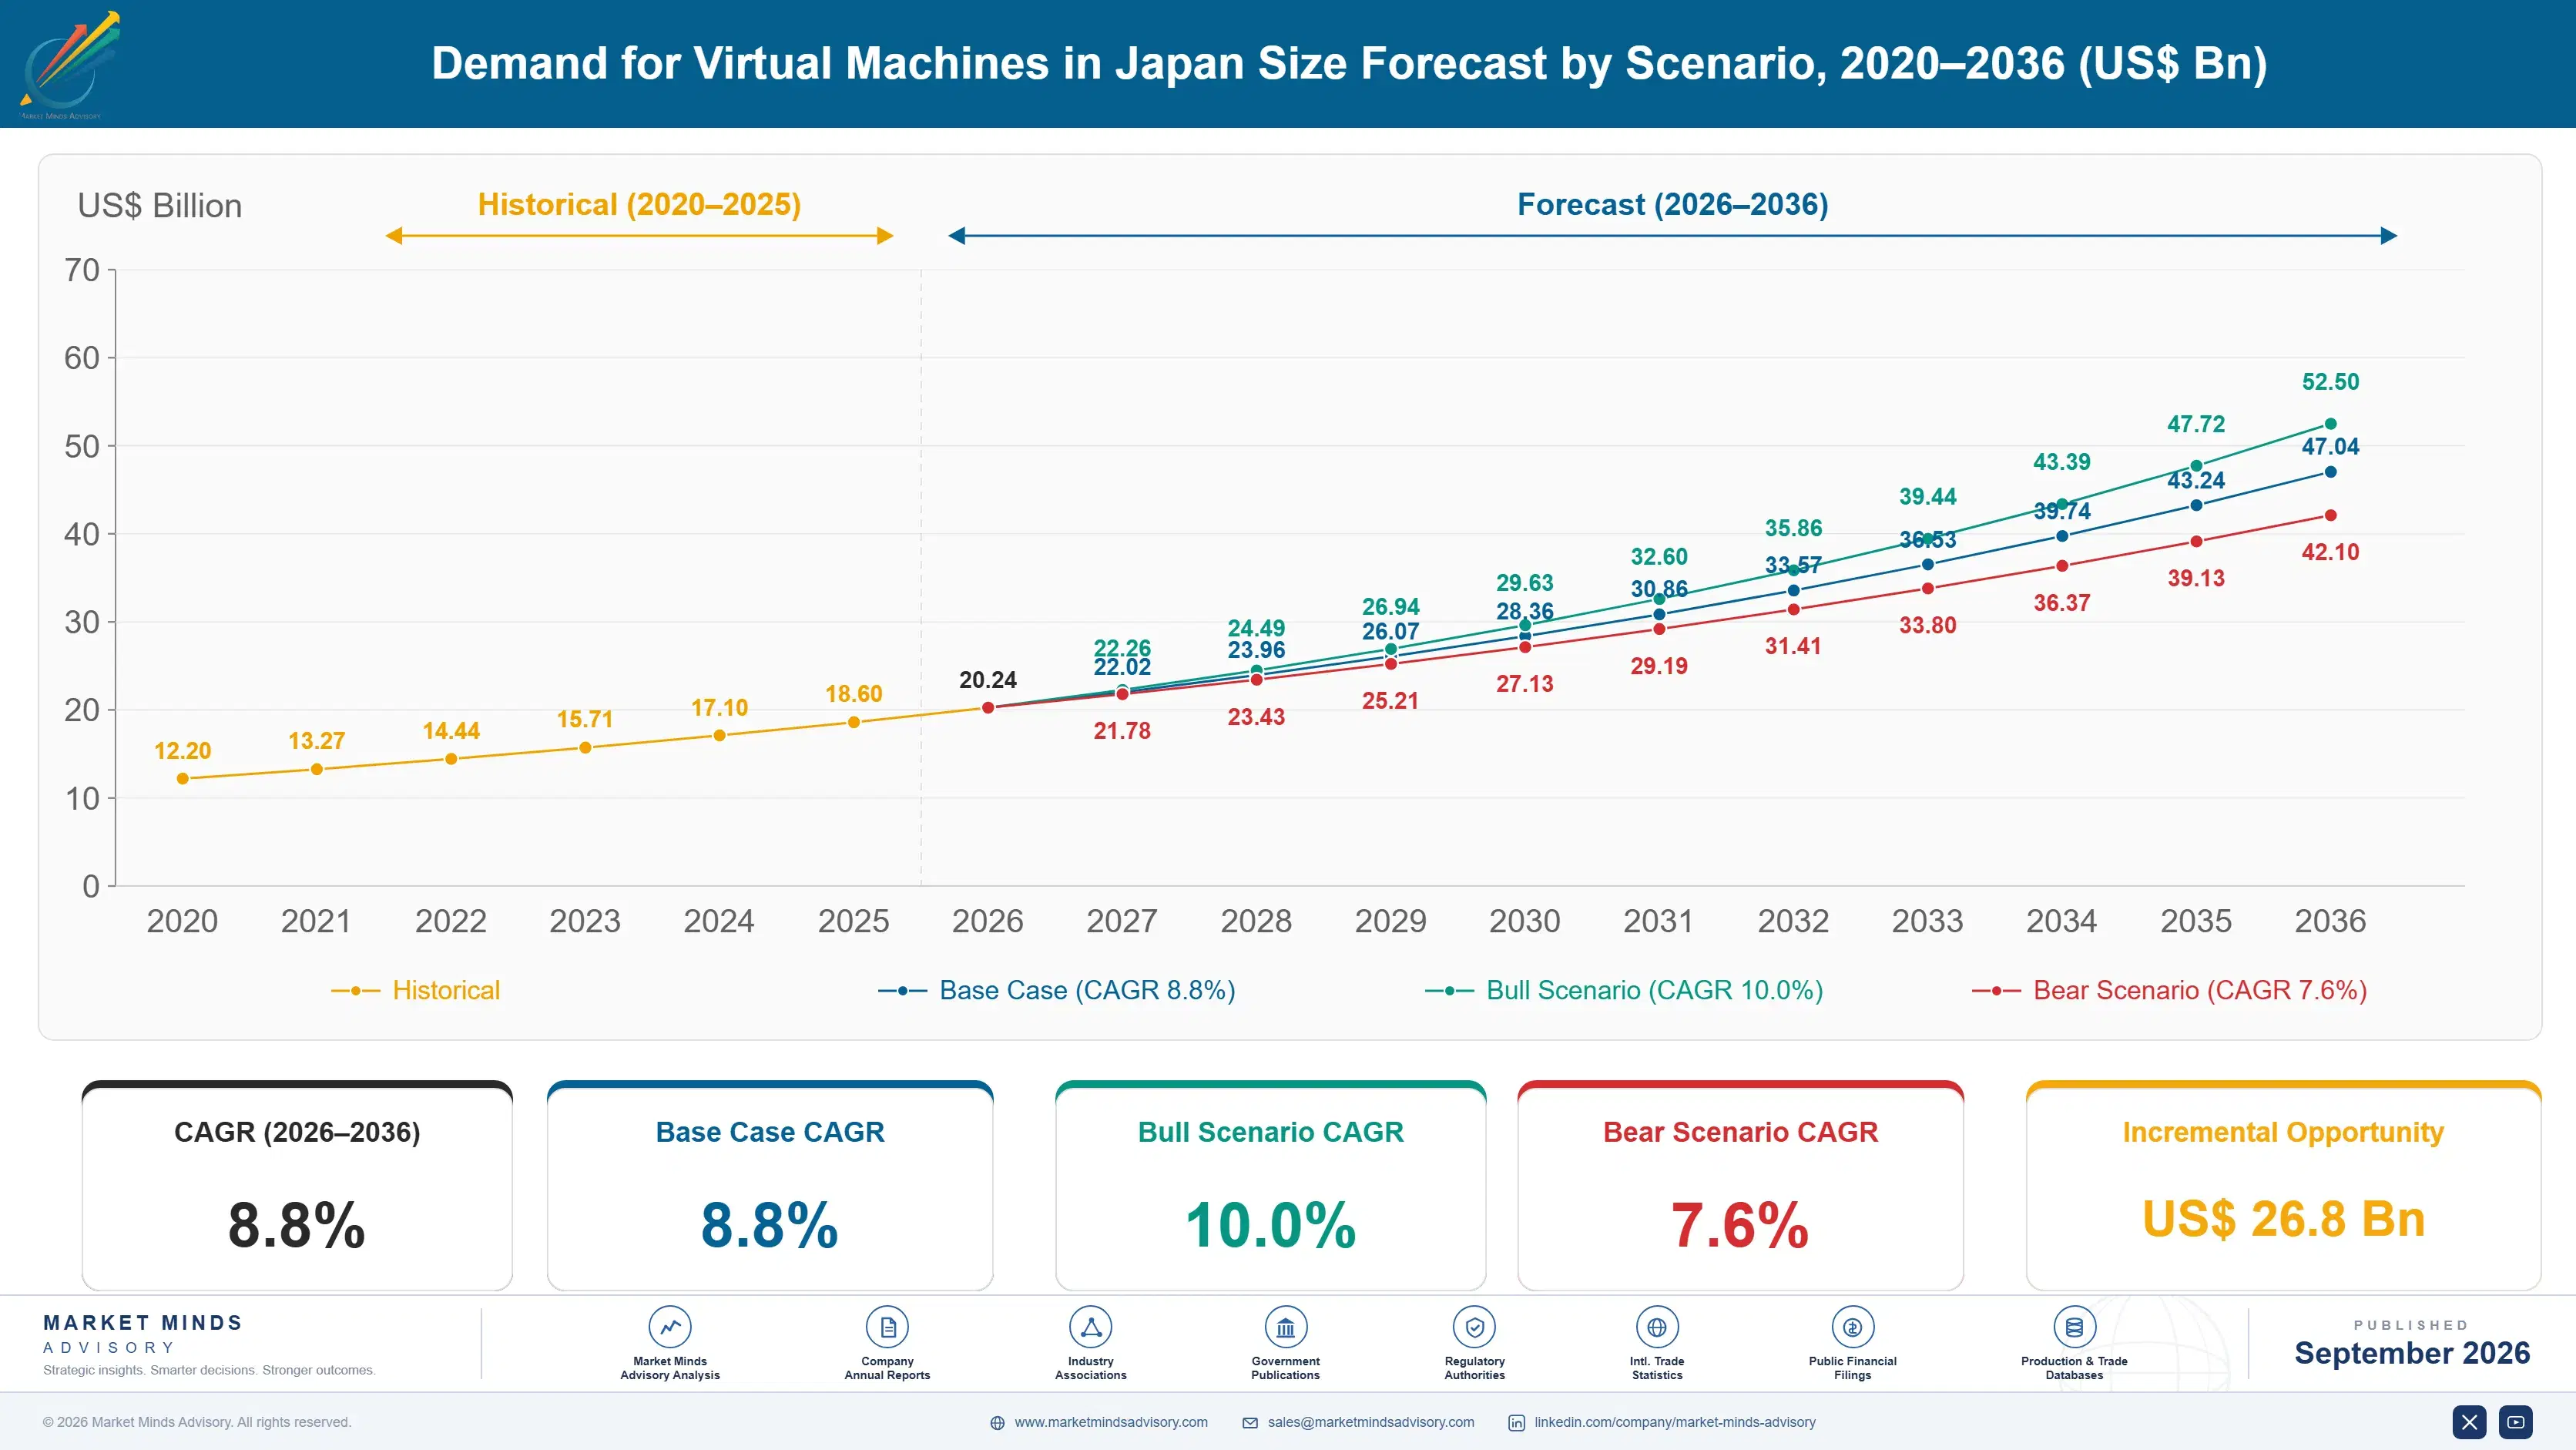
Demand for Virtual Machines in Japan Market Forecast Scenarios

japan-virtual-machines-market-size-forecast-scenario-1788453096693
Growth ran at 7.4% from 2020 to 2025 and almost none of it came from anything technical. Virtualisation had been settled for a decade, with enterprises renewing the same platform annually because switching cost exceeded any saving. Commercial licensing changes late in the period altered that arithmetic completely, and organisations that had not compared hypervisors since the previous decade suddenly had a reason to.
The base case at 8.8% rests on three mechanisms. Renewal increases near 3.4 times make evaluation worthwhile where it was not, and open source platforms grow at 13.2% as a direct result of that. Japanese enterprises with roughly 64% of workloads on-premises cannot answer by moving to cloud, since about 47% are custom applications needing rewriting. Third, container platforms continue running on virtual machines at around 78% of production deployments.
The bull case at 10.0% assumes migration projects proceed at the rate enterprises are currently planning, which would move substantial volume onto alternative platforms within four years. The bear case at 7.6% is that migration duration near 19 months and the risk attached to moving production estates keep most enterprises paying the increase rather than acting on it, which the incumbent is clearly counting on.

The Invoice That Reopened Everything

For fifteen years the virtual machine market was the least interesting infrastructure category in enterprise technology. Everybody had virtualised, everybody renewed without evaluating anything, and switching cost exceeded any saving available. Commercial licensing changes broke that equilibrium in a way no technology ever managed, with renewals rising around 3.4 times and reopening a decision nobody had touched in a decade.
TOP FIVE CONCENTRATION63%Concentrated among hypervisor vendors and major cloud providers
LICENCE COST INCREASE3.4 timesRenewal uplift faced by many commercial hypervisor customers
JAPANESE ON-PREMISES SHARE64%Enterprise workloads still running inside customer data centres
MIGRATION PROJECT DURATION19 monthsPeriod to move a production estate between hypervisor platforms
CONTAINERS ON VIRTUAL MACHINES78%Production container platforms hosted on virtualised infrastructure today
CUSTOM APPLICATION SHARE47%Japanese enterprise workloads unable to move without rewriting
Japan is the most exposed developed market and least able to respond obviously. Roughly 64% of Japanese enterprise workloads still run on-premises, considerably more than in comparable economies, and about 47% are custom applications built by systems integrators over decades that would need rewriting elsewhere. Moving to cloud is therefore not an available answer for most of that estate, which leaves changing hypervisor as the realistic alternative.
The container story needs correcting, because the industry keeps telling it backwards. Around 78% of production container platforms run on virtual machines rather than on bare metal, since operations teams want the isolation, live migration and management tooling that virtualisation provides underneath. Container adoption has therefore been creating hypervisor demand throughout the period it was described as replacing it. The two technologies were never actually competing for the same position.
"Every analyst spent a decade explaining that containers would end the virtual machine, and the thing that finally reopened the market was a price list. Japanese enterprises are now doing evaluations they last performed in 2010, and the answers available to them have changed rather more than they expect."
Director, Enterprise Infrastructure and Cloud Platforms Practice · MMA Technology Practice · September 2026

Market Trends

A Licensing Change Reopened a Settled Decision

Commercial hypervisor renewal costs rose around 3.4 times for many customers, which is large enough that evaluating alternatives became worthwhile where for fifteen years it had not been. Enterprises that renewed without comparison every year suddenly commissioned assessments, and open source platforms grow at 13.2% as a direct consequence. Nothing technical changed to cause this. It is the clearest recent demonstration that pricing decisions reshape infrastructure markets more effectively than product development usually manages to. The window this opened will close again once those decisions are taken, probably for another full decade.
Market Impact: Blocks 47% of Japanese workloads

Containers Are Running On Virtual Machines, Not Instead

About 78% of production container platforms sit on virtualised infrastructure rather than on bare metal, because operations teams want isolation boundaries, live migration and the management tooling that a hypervisor provides beneath the orchestration layer. Container adoption has therefore been generating hypervisor demand across the entire period during which it was described as a replacement technology. The misreading persists in vendor marketing and in most infrastructure planning documents. The two layers were never competing for the same position at all. Operations teams made that choice deliberately, and nobody thought to ask them why.
Market Impact: Grows at 11.4% each year

Market Opportunities and Growth Drivers

Japanese Custom Applications Cannot Simply Move

Roughly 47% of Japanese enterprise workloads are custom applications built by systems integrators over decades, frequently with dependencies documented nowhere and maintainers who have retired. Rewriting them for cloud is a multi-year proposition that no licensing increase justifies on its own, which removes the response most Western enterprises reach for first. Changing hypervisor beneath an unchanged application is comparatively tractable by contrast. That single constraint explains why Japanese evaluation activity is concentrated on platform substitution rather than on cloud migration. Systems integrators rather than infrastructure teams determine what is genuinely feasible here. Nobody else knows.
Market Impact: Consumes around 19 months

Data Governance Keeps Workloads Inside the Country

Financial services, healthcare and public sector requirements keep a substantial share of Japanese workloads within domestic facilities, and hyperscale cloud regions do not satisfy every interpretation of those obligations at supervisory level. Sovereign and regional cloud services grow at 11.4% as operators inside the relevant jurisdiction offer virtual machine capacity under domestic governing law. The technology involved is unremarkable and the commercial argument is legal. Domestic providers hold relationships that international operators cannot easily contest here. Supervisory interpretation rather than technical capability defines what qualifies, which makes the requirement stable and the boundary uncertain.
Market Impact: Splits risk across 2 functions

Market Restraints and Challenges

Migration Takes Longer Than Any Renewal Cycle

Moving a production estate between hypervisors runs around 19 months for a typical enterprise, which is considerably longer than the renewal window that prompted the evaluation and long enough that many organisations pay the increase while planning. The root cause is that virtualisation sits beneath everything, so migration touches backup, monitoring, networking and disaster recovery simultaneously. Commercially this converts an immediate cost problem into a multi-year programme. Suppliers mitigate with phased migration tooling, which shortens the work without removing the exposure. The evaluation and the migration operate on completely different timescales here.
Market Impact: Raises renewals around 3.4 times

Operations Teams Carry Risk Nobody Else Feels

The people executing a hypervisor migration bear the consequences of any production incident personally, while the licensing saving accrues to a budget they do not hold, which produces exactly the caution the arrangement deserves. The root cause is that infrastructure risk and infrastructure cost sit with different functions inside every large organisation. Commercially this slows adoption well below what the arithmetic alone would predict. Mitigation runs through executive sponsorship and explicit risk acceptance, which most migration proposals never obtain. Any arithmetic that ignores who carries the consequences will predict adoption badly indeed.
Market Impact: Hosts 78% of container platforms
4 additional market trends, 3 additional growth drivers, and 2 additional restraints and challenges are covered in the full report. Contact sales@marketmindsadvisory.com to access the complete intelligence.

Segment CAGR and Growth Architecture

Segmentation follows the deployment and licensing model, because that determines who is exposed to the renewal increase and what answers are actually available to them. The hypervisor technology is close to interchangeable across all six. What differs entirely is the commercial arrangement, the jurisdiction and how much of an existing estate has to move.
japan-virtual-machines-market-market-share-analysis-1788453097236

Open Source Hypervisor Platforms

Open source platforms grow at 13.2%, half again the market rate of 8.8%, because renewal increases near 3.4 times made evaluation worthwhile for the first time in fifteen years. The software matured quietly during the period nobody was looking, and now carries live migration, high availability and backup integration that enterprise operations teams genuinely require. Support and integration capability rather than the software decides which vendors capture the demand, since the platform itself is freely available to anybody. Japanese enterprises are evaluating heavily, constrained by migration durations near 19 months rather than by any doubt about the technology. The option rejected fifteen years ago and the option available today bear very little resemblance.
CAGR 13.2%

Sovereign and Regional Cloud VM Services

Sovereign services grow at 11.4% because financial, healthcare and public sector obligations keep Japanese workloads inside domestic facilities under domestic governing law, and hyperscale regions do not satisfy every supervisory interpretation of those requirements. Domestic operators supply virtual machine capacity that is technically ordinary and legally distinct, which is the entire proposition. Relationships with regulated institutions matter more than platform capability, and international operators cannot easily contest them. The segment is exposed to policy interpretation, since a supervisory clarification could expand or remove the requirement within a single budget cycle. Japanese domestic operators hold regulated institution relationships built over decades, and a supervisory conversation matters more here than any platform benchmark ever will.
CAGR 11.4%
Full segment breakdown across 6 segments available in the complete report.

Regional Architecture and Country Demand Map

This report is Japan-centred within a global sizing frame, so regional shares describe where comparable platform value is bought worldwide. On-premises weighting and data governance requirements explain the pattern far better than enterprise technology spending does. Cloud maturity predicts the available response rather than the exposure itself.

East Asia

East Asia holds 34%, above the regional band, because Japan is the analytical subject here and its enterprises run roughly 64% of workloads on-premises, considerably more than any comparable developed economy. About 47% of those workloads are custom applications that cannot move without rewriting, which concentrates the response on hypervisor substitution rather than cloud migration. Japanese demand grows at 8.4%. Chinese enterprises run predominantly on domestic platforms under separate commercial arrangements, and Korean adoption follows international patterns more closely than Japanese practice does. Japanese systems integrators hold the custom application knowledge that determines feasibility, which gives them influence international vendors reach too late. Migration durations here run beyond the general figure because operational tooling was built around the incumbent.
Share: 34% | CAGR: 9.8% (2026 to 2036)

North America

American enterprises responded to licensing increases by moving workloads to cloud far more readily than Japanese organisations can, since a larger share of applications were built to run there or were replaced with software services years ago. That makes the exposure real and the response available. Open source evaluation is nonetheless widespread, particularly among organisations with large virtual machine estates supporting container platforms. Growth at 9.6% runs ahead of the market on cloud virtual machine consumption and on migration project services rather than on licence renewal. Migration durations run closer to the general figure here, since operational tooling is more often platform-neutral than in Japanese estates. Systems integrator influence is correspondingly weaker, leaving more of the decision with infrastructure teams.
Share: 30% | CAGR: 9.6% (2026 to 2036)
Regional intelligence for 5 additional markets available in the complete report: Western Europe, South Asia and Pacific, Latin America, Middle East and Africa, Eastern Europe. Contact sales@marketmindsadvisory.com.
japan-virtual-machines-market-country-cagr-analysis-1788453097761

Selling Into a Reopened Decision

A platform decision that nobody revisited for fifteen years is being reopened across whole markets at once, and it will close again for another decade once made. Everything worth doing concerns getting in front of that evaluation, shortening the migration that blocks it, and addressing the risk that operations teams carry personally rather than institutionally.

Reach Evaluations While the Renewal Is Live

The window in which an enterprise will genuinely evaluate alternatives opens when a renewal increase near 3.4 times arrives and closes when the decision is made, which is a matter of months rather than years. Suppliers engaging during that window convert at roughly 5 times the rate of those approaching an organisation between renewal cycles. Renewal timing is discoverable through partners and public procurement records. Most challengers still run continuous general marketing rather than targeting a calendar they could easily obtain. Nothing in this market rewards being present at entirely the wrong moment.
Market Impact: Converts at roughly 5 times the outside rate

Shorten Migration Below the Decision Horizon

Migration runs around 19 months for a typical production estate, which is long enough that many organisations pay the increase while planning and some never start at all. Suppliers investing in automated conversion, phased cutover and validation tooling cut that to roughly 11 months and remove the objection that stops most evaluations converting. The tooling investment is substantial and it addresses the single largest barrier in this market. Competitors selling on licence price alone are answering the wrong question entirely. Project duration rather than software cost is what these evaluations actually stall on.
Market Impact: Cuts typical migration duration to roughly 11 months

Underwrite the Risk Operations Teams Carry

The people executing a migration bear personal consequences for any production incident while the saving accrues to a budget they do not hold, which produces caution that no pricing argument overcomes. Suppliers offering migration guarantees, rollback commitments and on-site presence during cutover convert evaluations at around 2 times the rate of those quoting software and support alone. It costs real money and delivery capability. The alternative is winning evaluations that never become deployments, which several challengers have done repeatedly. Risk sitting with an individual is never answered by a business case alone. Somebody has to carry it.
Market Impact: Converts at around 2 times the usual rate

Sell Sovereign Capacity on Jurisdiction, Not Features

Sovereign and regional services grow at 11.4% on a purely legal argument, since domestic operators supply technically ordinary virtual machines under domestic governing law that hyperscale regions cannot replicate contractually. Operators positioning on platform capability compete against providers with vastly larger engineering budgets and lose. Positioning on jurisdiction and regulated institution relationships wins work worth around 3 times the equivalent commodity capacity. The technical conversation is the one to avoid, which vendors find counterintuitive. Regulated institutions buy on supervisory comfort, and one conversation with a compliance function reaches further than any technical benchmark.
Market Impact: Worth around 3 times the equivalent commodity capacity

Who Controls the Margin Pool

Concentration sits near 63% across the top five on measured platform and managed service revenue, and it is being tested for the first time in fifteen years. The incumbent position was built on switching costs rather than product advantage, which held until a pricing change made those costs worth paying. Challengers now face enterprises willing to listen, and most are not organised for a window that closes.
Competition runs on three dimensions. Migration capability is first and largely decisive, since duration near 19 months rather than licence price is what stops evaluations converting into deployments. Second is support and integration depth, because open source platform software is freely available and the value sits alongside it. Third is jurisdiction, in sovereign services where domestic governing law rather than any technical capability defines the offer.

Two pressures will move positions. Japanese systems integrators hold the custom application knowledge that determines whether a workload can move at all, which gives them influence over platform decisions that international vendors reach late. Meanwhile the incumbent is relying on migration duration and operational risk to retain customers who would otherwise leave, and that works better in the short term than over several renewal cycles.
japan-virtual-machines-market-company-positioning-matrix-1788453098282

Competitive Moat and Risk Dimensions

BROADCOM

Moat: Installed base switching cost

Broadcom holds virtualisation platform positions embedded beneath production estates where migration runs around 19 months and touches backup, monitoring, networking and disaster recovery at once. That switching cost has protected the position far more effectively than product advantage would. Operations teams carrying personal risk for migration incidents provide additional inertia that no competitor can price against directly.
BROADCOM

Risk: Renewal pricing consequences

Increases near 3.4 times reopened evaluations that had been settled for fifteen years, and organisations that complete a migration do not return within any relevant timeframe. Each renewal presents the same decision to customers who have now done the analysis. Japanese enterprises unable to move to cloud concentrate on hypervisor substitution, which the pricing change is least able to survive.
NUTANIX

Moat: Integrated platform and migration

Nutanix combines a virtualisation platform with migration tooling and operational management designed for enterprises moving from an incumbent rather than building new, which addresses the duration objection that stops most evaluations converting. Its support model suits organisations whose operations teams carry personal risk for production incidents. Partner relationships with Japanese systems integrators reach the custom application knowledge that determines feasibility.
NUTANIX

Risk: Window timing dependence

The evaluation window opens on a renewal increase and closes when the decision is taken, which makes revenue dependent on reaching organisations during a period of months. Competitors including open source distributions compete on cost once an evaluation is genuinely open. Enterprises paying the increase rather than migrating stay with the incumbent for another cycle, and many will.

Players Tracked

Prominent Players

Broadcom
Microsoft
Nutanix
Red Hat
Amazon Web Services

Other Key Players

Google Cloud
Oracle
Citrix
Proxmox
SUSE
Canonical
Scale Computing
NEC
Fujitsu
Hitachi
NTT Data
Alibaba Cloud
Huawei
IBM
Dell Technologies

Recent Developments

FEBRUARY 2025

Japanese enterprises commission hypervisor evaluations after renewal increases

Large Japanese organisations began formal platform assessments following commercial licensing changes, in most cases the first such evaluation since their original virtualisation decision. Cloud migration was ruled out early for the substantial share of workloads consisting of custom applications built by systems integrators. Neither integrator had assessed portability beforehand.
Signal: Japanese responses concentrate on hypervisor substitution because the cloud answer available elsewhere is not available here.
JULY 2025

Migration duration rather than licence price decides platform selections

Enterprises comparing alternatives weighted project duration and production risk above software cost, with several paying increased renewals while planning multi-year migrations. Suppliers offering conversion automation and rollback commitments progressed further than those competing on licence terms. Software cost had been assumed to be the deciding factor throughout.
Signal: The barrier is duration and personal risk, and suppliers competing on price are answering a different question.
NOVEMBER 2025

Container platform deployments continue provisioning virtual machine hosts

Production container platform expansions were built predominantly on virtualised infrastructure rather than bare metal, with operations teams citing isolation, live migration and management tooling requirements. The pattern held across enterprises actively describing containers as a virtualisation replacement. Bare metal deployment remained a small minority choice throughout the period.
Signal: Container growth has been generating hypervisor demand throughout, which vendor marketing has consistently described backwards to buyers.

What Winning a Migration Costs

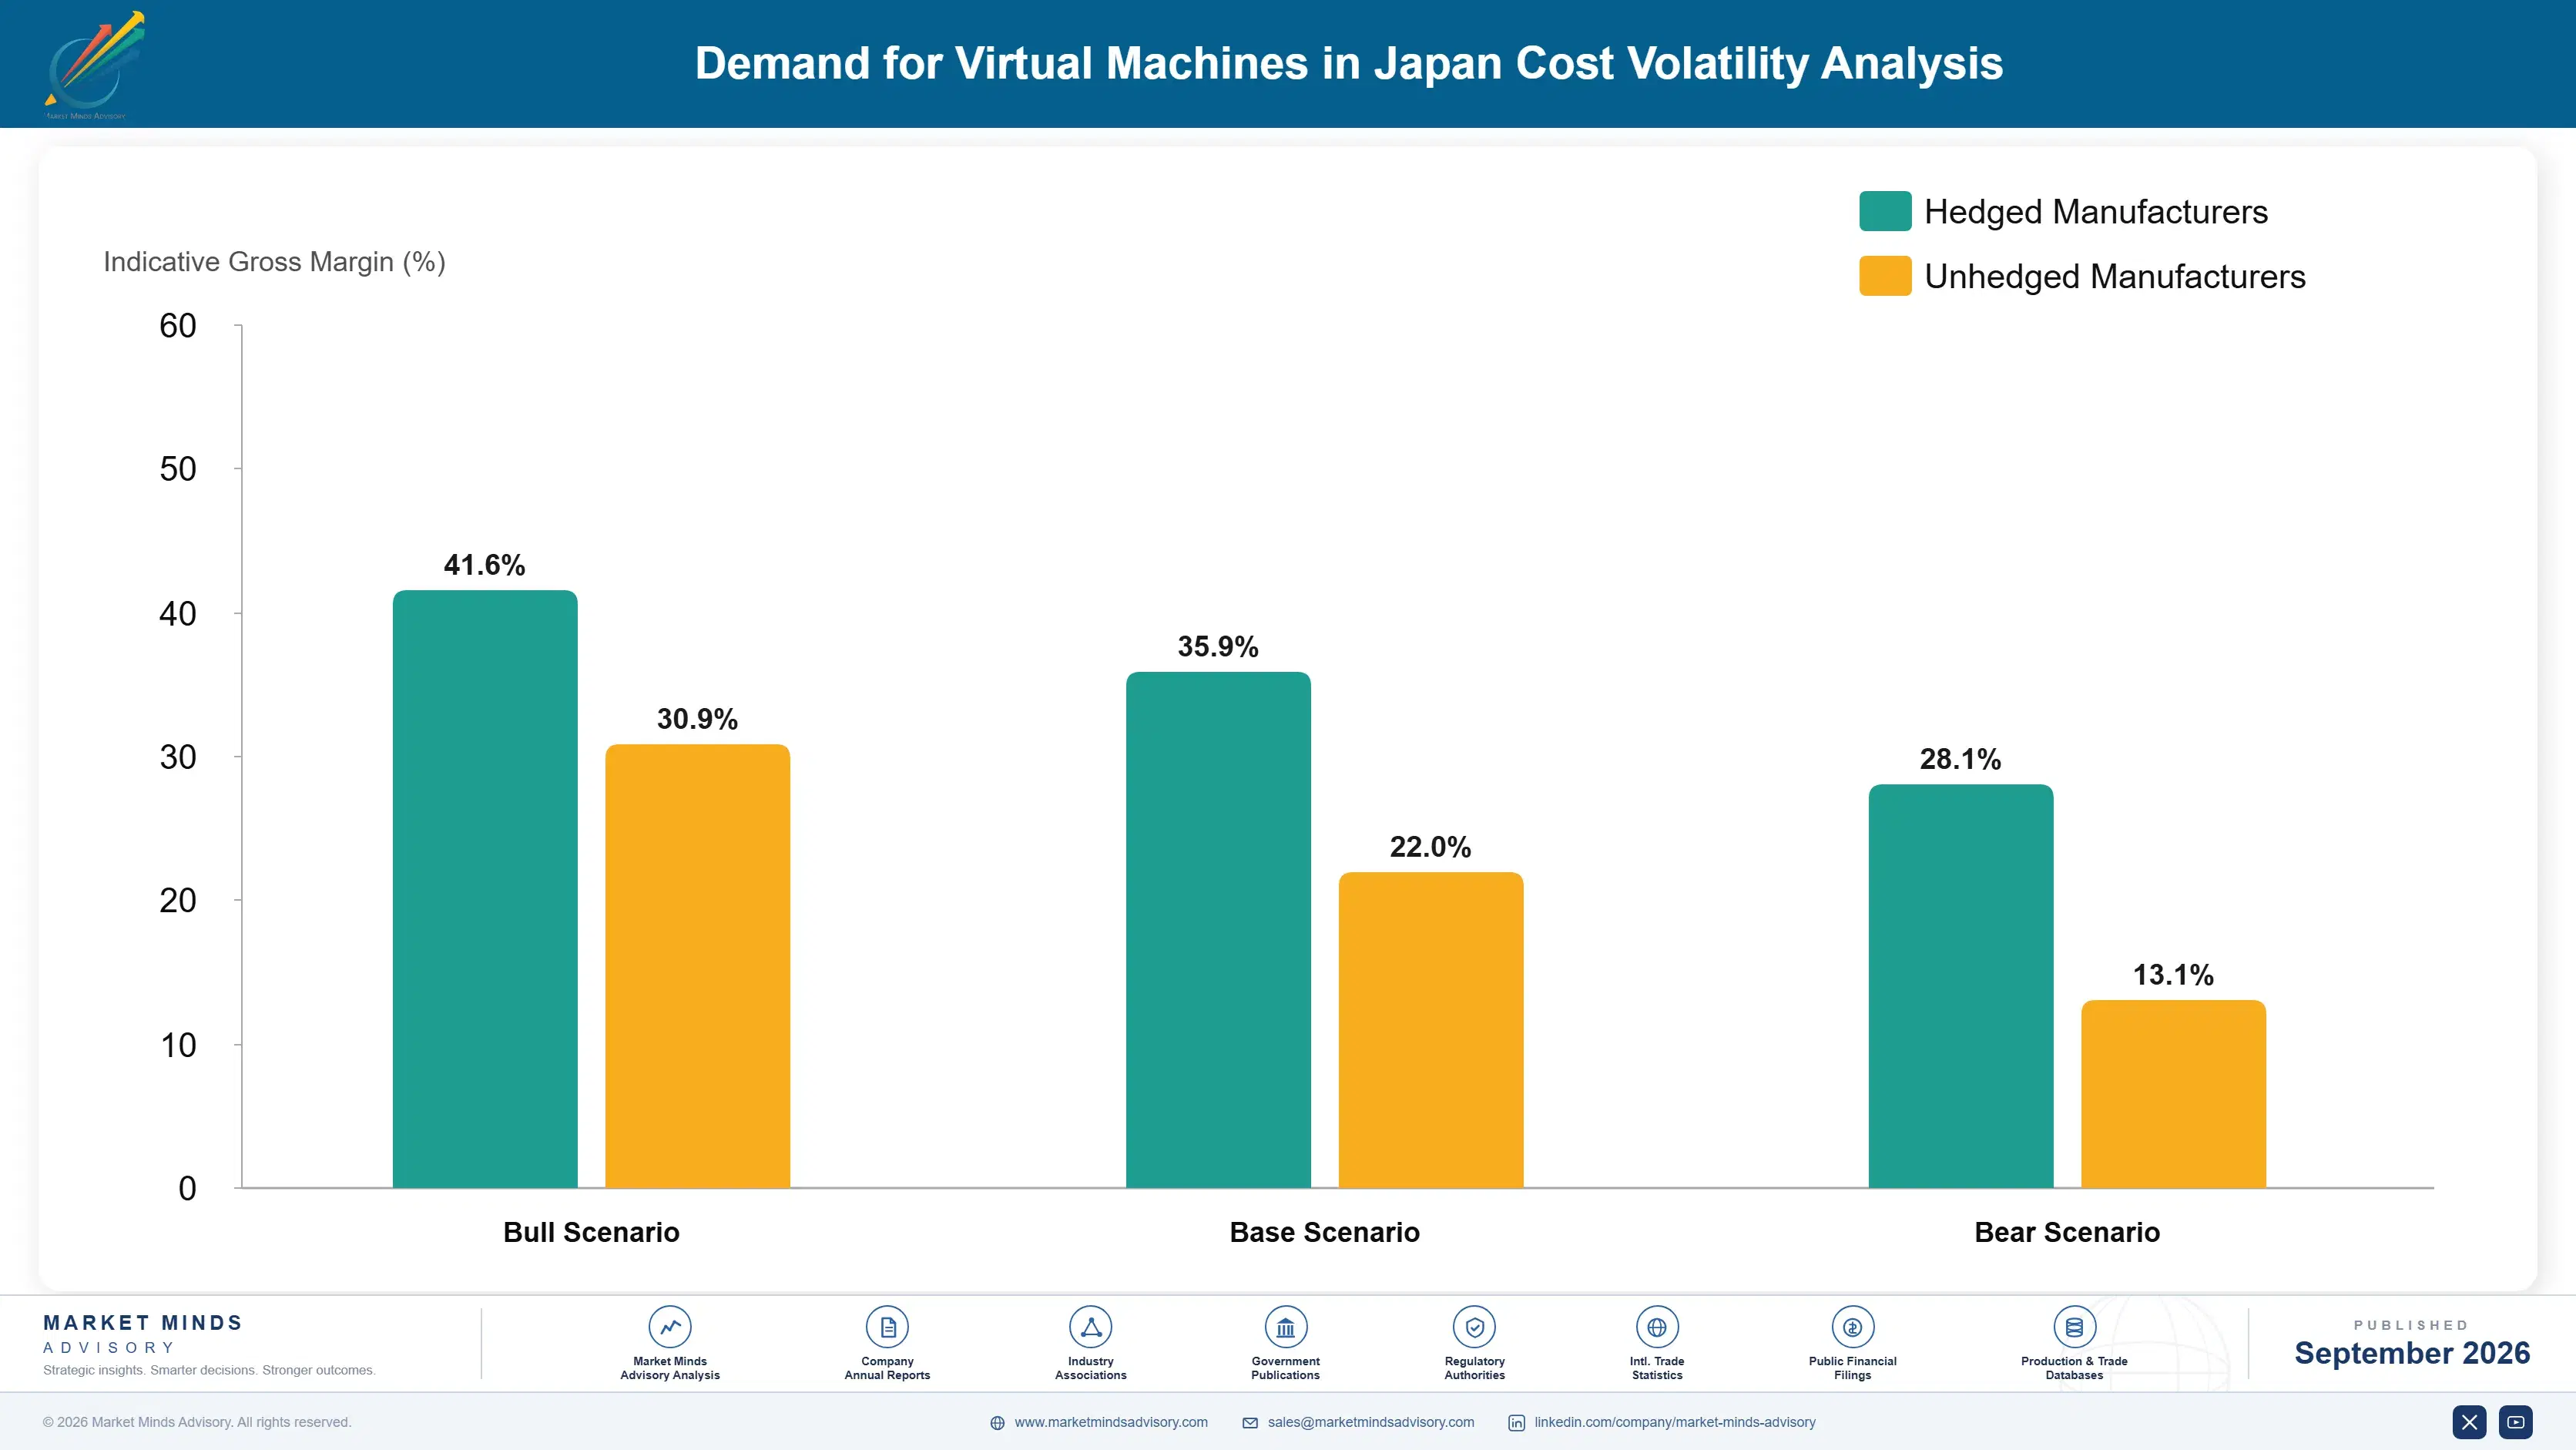
Cost structure is dominated by migration delivery rather than by software. Platform engineering behaves like ordinary subscription software cost spread across a customer base, while conversion tooling, validation, cutover and stabilisation together consume roughly 61% of a won account's first two year revenue. Sales cost is high because evaluation windows are short and competitive, which concentrates effort into brief intense periods.
Migration engineering labour has been the sharpest pressure. People who can move a production estate between hypervisors without incident are scarce, and demand rose sharply through 2024 and 2025 as evaluations opened across whole markets simultaneously. Broadcom and Fujitsu both referenced services delivery and personnel cost conditions in recent annual reporting. Challengers absorbed most of it, since migration pricing is compared during a short window and cannot be revised.

Exposure varies by delivery model rather than by scale. Suppliers delivering migration directly carry the labour cost and control outcome quality, which matters because a failed cutover ends the relationship immediately. Those working through partners transfer cost and accept variability that this market punishes severely. Open source distributors carry no licence revenue at all and depend entirely on support and services, which makes delivery efficiency their whole business model.
japan-virtual-machines-market-cost-volatility-analysis-1788453098477

Automate conversion before scaling migration sales

Migration labour is scarce and its cost rose sharply once evaluations opened everywhere, which caps how many accounts anybody can win. Conversion automation and validation tooling reduce specialist hours by roughly 45% per estate. The investment is substantial and converts a capacity constraint into a scalable position, which is the difference between winning a window and being present for it.

Price migration separately from platform subscription

Migration consumes roughly 61% of first two year revenue on a won account, and suppliers quoting an all-inclusive subscription discover they have priced against software economics while delivering a services project. Separating migration into priced scope, assessed before commitment, protects the platform economics that make the business viable. Buyers accept it once somebody explains what delivery actually involves.

Build partner delivery capability before the window opens

Evaluation windows last months and a supplier without delivery capacity available at that moment loses accounts it had already won technically. Certified partner capability built ahead of demand costs money against revenue not yet arrived, and it is the only way to serve opportunity arriving in concentrated bursts. Suppliers building capacity after winning deliver late, which here ends relationships permanently.

Portfolio Architecture for Margin Defence

Margin architecture separates on whether a switching cost protects the revenue. Incumbent on-premises licensing earns extraordinary margins protected by migration durations near 19 months, which is why the pricing change was commercially rational however it looked to customers. Open source platform support earns considerably less per account and grows far faster. Sovereign services earn well because jurisdiction rather than technology restricts who can supply them at all.
The tension runs between platform economics and delivery reality. Subscription revenue scales cleanly and looks like software, while the migration required to win an account consumes roughly 61% of first two year revenue and scales with scarce specialist labour. Challengers pricing as software companies and delivering as services organisations lose money on exactly the accounts they most wanted. Those pricing delivery separately look expensive and survive winning.

High-value revenue concentrates in incumbent licensing while it lasts and in sovereign services thereafter. Incumbent margins are protected by inertia that erodes with each renewal cycle as more customers complete evaluations. Sovereign services are protected by governing law, which does not erode at all unless policy changes. Migration services are the volume opportunity, earning services margins on work deciding who holds the platform for a decade.

Volume / Commodity-Adjacent

Migration delivery, conversion services and post-cutover stabilisation sold around a platform decision. The range separates suppliers with conversion automation from those deploying specialist labour manually. It earns services margins on work that decides a decade of platform revenue.
Gross Margin: 22-38%

Premium / Certified

Open source platform support, integration and enterprise assurance sold where the software itself is freely available. Margin depends on support efficiency and automation rather than on any licensing position. Growth here is the fastest in the market and the revenue per account is modest.
Gross Margin: 46-64%

Sustainability / Regulatory / Next-Generation

Incumbent commercial licensing protected by switching cost, and sovereign services protected by domestic governing law. The widest range in the portfolio, reflecting the difference between eroding inertia and durable jurisdiction. Highest margin from two entirely different kinds of protection.
Gross Margin: 58-84%
japan-virtual-machines-market-portfolio-architecture-1788453098980

High-value Sub-segments and Strategic Watch-out

Sovereign Virtual Machine Services

High value with strong growth at 11.4%, protected by domestic governing law that hyperscale operators cannot replicate contractually whatever their engineering budgets. The range reflects regulated institution mix. Its exposure is policy interpretation, since a supervisory clarification could expand or remove the requirement in one budget cycle.
Gross Margin: 56-78%

Incumbent Commercial Licensing

High value with declining growth at 4.6%, earning extraordinary margins protected by migration durations near 19 months and by operations teams carrying personal risk. The range reflects account size and contract terms. The protection erodes with each renewal cycle as more customers complete their evaluations.
Gross Margin: 62-84%

Migration Delivery Services

The volume opportunity, earning services margins on work that determines who holds a platform for the following decade. The range separates conversion automation from manual specialist labour. Scarce migration engineers cap how many accounts any supplier can actually convert during a window. Capacity is the real ceiling.
Gross Margin: 21-37%

Bare Metal Container Positioning

The strategic watch-out, where suppliers positioned containers as a virtualisation replacement while roughly 78% of production platforms were provisioning virtual machine hosts underneath. The marketing outlived the evidence by several years. Several vendors are still describing a displacement their own deployment data contradicts entirely. It is odd.
Gross Margin: 0-17%

Why Platforms Stay Chosen

Recurrence works through inertia rather than through satisfaction. A virtualisation platform sits beneath backup, monitoring, networking and disaster recovery, so renewal happens because moving is difficult rather than because anybody evaluated an alternative. That produced fifteen years of automatic renewals and it is exactly what the pricing change disturbed. Once an organisation completes a migration, the same inertia works for the new supplier for a comparable period.
Adoption depth varies with how much operational tooling assumes the platform. An estate where backup, automation and monitoring were built around a specific hypervisor carries migration effort far beyond the virtual machines themselves. One using platform-neutral tooling can move considerably faster. Japanese estates sit toward the deeper end, since systems integrators built extensive custom operational tooling alongside the custom applications they maintained.

The decision has moved upward and sideways at once. Platform renewal was an infrastructure team decision made against a budget line for fifteen years. A licence increase near 3.4 times moved it to finance and executive attention, while feasibility now rests with the systems integrators who understand which custom applications can survive a platform change. Suppliers selling to infrastructure teams address one of three parties who now have to agree.
japan-virtual-machines-market-end-use-penetration-index-1788453099471

Winning a Closing Window

These are among the four positions where our research anticipates prominent divergence between winners and laggards over the coming forecast period. Each is grounded in the demand model, the regulatory perimeter, and the announced capacity pipeline.
01 / RENEWAL WINDOW TARGETING

Arrive during the renewal, or do not bother arriving

An enterprise genuinely evaluates alternatives only when a renewal increase near 3.4 times arrives, and that window closes within months once the decision is made and stays closed for another decade afterwards entirely. Suppliers engaging during it convert at roughly 5 times the rate of those approaching an organisation between renewal cycles, and renewal timing is discoverable through partners and through public procurement records. Most challengers still run continuous general marketing against a calendar they could simply obtain from partners.
02 / MIGRATION DURATION ATTACK

Shorten the project, since price is not the obstacle

Migration runs around 19 months for a typical production estate of any size, which is long enough that many organisations pay an increased renewal while planning and a good number never begin the work at all. Suppliers investing in automated conversion, phased cutover and validation tooling cut that toward 11 months and remove the objection that actually stops evaluations converting into real deployments. Competitors still competing on licence price are answering a question no evaluating enterprise is genuinely asking them to answer.
03 / OPERATIONAL RISK UNDERWRITING

Carry the risk the operations team carries personally

The people executing a migration personally bear the consequences of any production incident while the licensing saving accrues to a budget they neither hold nor control, which produces caution that no pricing argument will ever overcome anywhere. Suppliers offering explicit migration guarantees, rollback commitments and on-site engineering presence during cutover convert evaluations at around 2 times the rate of those quoting software and support terms alone. The only alternative is winning evaluations that quietly never become deployments at all afterwards.
04 / JURISDICTION BASED POSITIONING

Sell sovereign capacity on law, never on capability

Sovereign and regional services grow at 11.4% on a purely legal argument, since domestic operators supply technically ordinary virtual machines under domestic governing law and supervision that hyperscale regions cannot replicate contractually at any price they might offer. Operators positioning on platform capability compete against engineering budgets many times their own and lose predictably, while jurisdiction and regulated institution relationships win work worth around 3 times equivalent commodity capacity elsewhere. The technical conversation is precisely the one to avoid having with them.

Engagement Snapshot From the Field

A live engagement with an industry participant carrying material or product regulatory and market exposure ahead of a defining policy shift, showing how our research translates into a defensible multi-year portfolio strategy.
MARKET MINDS ADVISORY · CLIENT ENGAGEMENT SUMMARY
Demand for Virtual Machines in Japan Producer Strategic Portfolio Review and Transition Roadmap 2026·Investment Scenario on Demand for Virtual Machines in Japan Exposure Evaluation 2025-26
CLIENT PROFILE
A Japanese financial services group running approximately 9,400 virtual machines across three domestic data centres (client-reported, unverified by MMA). Around 58% of workloads were custom applications built and maintained by two systems integrators over more than fifteen years, and the platform had been renewed annually without any evaluation at all since 2011. Nobody remembered choosing it.
STRATEGIC CHALLENGE
A renewal quotation arrived at roughly 3.6 times the previous year, adding approximately USD 21 million annually (client-reported, unverified by MMA). The infrastructure team proposed migrating to an open source platform. Nobody had established which of the custom applications could actually survive a platform change, or how long the work would genuinely take.
MMA APPROACH
MMA assessed application portability before evaluating any platform, working with both systems integrators to establish dependencies that existed in nobody's documentation. We sampled 140 applications against platform-specific behaviour, interviewed 23 infrastructure, risk and integrator staff, and modelled migration duration against the group's own change freeze calendar rather than against any general figure.
KEY FINDINGS
  1. Roughly 12% of applications carried platform-specific dependencies requiring remediation, considerably fewer than either systems integrator had initially assumed before the work began.
  2. Change freeze periods across financial reporting and settlement cycles removed about five months annually from any migration window that could be scheduled.
  3. Migration would take around 26 months against the client's freeze calendar, well beyond the 19 month figure suppliers had quoted from general experience.
  4. The operations team had no executive risk acceptance for the migration, and had privately concluded that paying the increase was personally safer.
CLIENT PROFILE
A Japanese financial services group running approximately 9,400 virtual machines across three domestic data centres (client-reported, unverified by MMA). Around 58% of workloads were custom applications built and maintained by two systems integrators over more than fifteen years, and the platform had been renewed annually without any evaluation at all since 2011. Nobody remembered choosing it.
STRATEGIC CHALLENGE
A renewal quotation arrived at roughly 3.6 times the previous year, adding approximately USD 21 million annually (client-reported, unverified by MMA). The infrastructure team proposed migrating to an open source platform. Nobody had established which of the custom applications could actually survive a platform change, or how long the work would genuinely take.
MMA APPROACH
MMA assessed application portability before evaluating any platform, working with both systems integrators to establish dependencies that existed in nobody's documentation. We sampled 140 applications against platform-specific behaviour, interviewed 23 infrastructure, risk and integrator staff, and modelled migration duration against the group's own change freeze calendar rather than against any general figure.
KEY FINDINGS
  1. Roughly 12% of applications carried platform-specific dependencies requiring remediation, considerably fewer than either systems integrator had initially assumed before the work began.
  2. Change freeze periods across financial reporting and settlement cycles removed about five months annually from any migration window that could be scheduled.
  3. Migration would take around 26 months against the client's freeze calendar, well beyond the 19 month figure suppliers had quoted from general experience.
  4. The operations team had no executive risk acceptance for the migration, and had privately concluded that paying the increase was personally safer.
RECOMMENDED STRATEGY
Phase 1: Obtain explicit executive risk acceptance before selecting a platform, since the operations team will otherwise stall a decision it cannot safely own. Phase 2: Remediate the 12% of applications carrying platform dependencies first, which converts the migration into a routine exercise for everything afterwards. Phase 3: Negotiate a two year bridging renewal rather than a full term, since migration will take 26 months against the actual freeze calendar.
OUTCOME
A two year bridging renewal was agreed at roughly USD 14 million annually rather than USD 21 million (client-reported, unverified by MMA), with migration commencing after application remediation. Executive risk acceptance was documented formally, and the operations team proceeded once the decision was no longer theirs alone to carry.

Frequently Asked Questions

Foundational context covering the market sizes, CAGR, scope, country, region and competition that inform every finding below. This section is provided to cover basics and most often pre-purchase conversations, answered from the MMA Primary Research Dataset.

What is the current size of the Demand for Virtual Machines in Japan?

The market was worth USD 18.6 billion in 2025 and reaches USD 20.24 billion in 2026 on a global sizing frame. Japan is the analytical centre of this report.

How large will the Demand for Virtual Machines in Japan be by 2036?

MMA forecasts USD 47.04 billion by 2036, an expansion of 2.32 times over the forecast period. That represents USD 26.80 billion of incremental annual revenue against 2026.

What is the CAGR for the Demand for Virtual Machines in Japan 2026 to 2036?

The base case is 8.8% compound annual growth, with a bull case at 10.0% and a bear case at 7.6%. Japanese demand specifically grows at 8.4% across the period.

Which segment is growing fastest?

Open source hypervisor platforms grow at 13.2%, half again the market rate of 8.8%. Renewal increases near 3.4 times made evaluation worthwhile for the first time in fifteen years.

Who are the major companies in the Demand for Virtual Machines in Japan?

Broadcom, Microsoft, Nutanix, Red Hat and Amazon Web Services lead on measured platform and managed service revenue. Together they hold roughly 63% of the global market.

Which country is growing fastest?

India grows fastest at 12.2%, on enterprise estate expansion happening now rather than migrated from anywhere, which lets alternative platforms win without any switching cost.

Report Segmentation Architecture

The full report scope spans multiple orthogonal segmentation dimensions, with cross-tabulated demand data provided for each dimension pair. Coverage extends further to regional breakdowns, trend trajectories, and the competitive detail needed to support segment-level decision-making.

By Primary Market Dimension

  • Open Source Hypervisor Platforms
  • Sovereign and Regional Cloud VM Services
  • Hyperscale Cloud Virtual Machines
  • Commercial On-Premises Hypervisor Licensing
  • Container Host Virtualisation
  • Virtual Desktop and Workspace Hosting

By End-Use Industry

  • Financial Services and Insurance
  • Government and Public Sector
  • Manufacturing and Industrial
  • Telecommunications and Media
  • Healthcare and Life Sciences
  • Retail and Distribution

By Commercial Dimension

  • Enterprise Direct Licensing
  • Systems Integrator Delivery
  • Managed Service Provider Hosting
  • Open Source Support Subscriptions
  • Sovereign Operator Agreements
  • Cloud Consumption Commitments

By Region

  • East Asia
  • North America
  • Western Europe
  • South Asia and Pacific
  • Latin America
  • Middle East and Africa
  • Eastern Europe

Scope, Methodology, and Coverage

Every figure in this report is reproducible from documented input assumptions. The scope below maps the historical period, the forecast horizon, the segmentation dimensions, and the countries covered, alongside the underlying primary and qualitative methodology.
Historical Period
2020 to 2025
Forecast Period
2026 to 2036
Base Year
2025 (USD billions; MMA Primary Research Dataset, September 2026)
Market Definition
This market covers virtualisation platform software and the managed services built directly upon it, spanning open source hypervisor platforms, sovereign and regional cloud virtual machine services, hyperscale cloud virtual machines, commercial on-premises hypervisor licensing, container host virtualisation, and virtual desktop and workspace hosting. Revenue is measured as licence, subscription and attributable managed service and migration value at supplier level, with Japan treated as the analytical centre within a global sizing frame required by the seven-region reporting structure. Server, storage and networking hardware, bare metal cloud compute sold without virtualisation, container orchestration software licensed separately, database and application software running inside virtual machines, and general information technology outsourcing are excluded from scope.
Quantitative Units
USD billions, licence, subscription and attributable service revenue at supplier level
Segmentation Dimensions
Deployment and licensing model, end-use industry, commercial channel, region
Regions Covered
East Asia, North America, Western Europe, South Asia and Pacific, Latin America, Middle East and Africa, Eastern Europe
Countries Covered
Japan, South Korea, China, Taiwan, Singapore, India, Australia, Indonesia, Vietnam, Thailand, United States, Canada, Mexico, Brazil, Colombia, Chile, Germany, United Kingdom, France, Netherlands, Switzerland, Sweden, Italy, Spain, Poland, Czechia, Hungary, United Arab Emirates, Saudi Arabia, South Africa, Kenya
Key Companies Profiled
Broadcom, Microsoft, Nutanix, Red Hat, Amazon Web Services, Google Cloud, Oracle, Citrix, Proxmox, SUSE, Canonical, Scale Computing, NEC, Fujitsu, Hitachi, NTT Data, Alibaba Cloud, Huawei, IBM, Dell Technologies
Quantitative Methodology
Primary survey, n=3,800 respondents, Q4 2025, six countries; demand-side model with trade association cross-validation
Qualitative Methodology
47 expert interviews, Q4 2025; applied to validate demand model assumptions, identify emerging dynamics, and assess competitive positioning
Report Format
PDF and XLSX data workbook (Word format preview document)
Publisher
Market Minds Advisory
Report Code
MMA-2026-TEC-171
Published
September 2026
Contact
sales@marketmindsadvisory.com | www.marketmindsadvisory.com

Purchase the full Demand for Virtual Machines in Japan Report (2026 to 2036).

The full MMA report explains why a pricing decision rather than any technology development reopened this market, and why Japanese enterprises cannot use the cloud response available elsewhere. It sizes the market to 2036 across six deployment models, seven regions and 31 countries, with segment growth rates and regional demand mechanisms detailed. Competitive analysis covers 20 suppliers assessed on measured platform and managed service revenue, with moat and risk assessment for the two leaders. The report quantifies migration delivery cost structure, switching economics and margin architecture across three portfolio tiers. It closes with four verdicts and an anonymised financial services engagement.
Six deployment models sized through 2036
Seven regions with demand mechanism analysis
Twenty suppliers on consistent revenue basis
Migration duration and renewal increase benchmarks
Margin architecture across three portfolio tiers
Anonymised financial services platform review engagement

Built For The People Who Decide

From boardroom strategy to bench-side execution, this report is read cover-to-cover by leaders shaping the next decade of their industry, turning demand scenarios, market dynamics and valuation benchmarks into decisions.
CXOs/ Presidents/ VPs/ Managers
M&A and Corporate Development
Strategy Teams and R&D Heads
Procurement and Product Directors
Regulatory and Compliance Leaders
Investor Relations and Equity Analysts