Market Minds Advisory
Japan Industrial Electronics Packaging Market

Japan Industrial Electronics Packaging Market: Everything Exists to Keep One Clock Stopped

A moisture sensitivity clock starts the moment a barrier bag is opened and runs for one hundred and sixty-eight hours. Every component in this packaging system exists to keep that clock stopped.

Lead Analyst

Bilal Shaikh

Published

September 2026

Make Smarter Decisions with Customized Research Insights

Request a free sample report and evaluate market opportunities, growth trends, and competitive dynamics relevant to your business needs.

2025 MARKET VALUE$2.1BMarket Size 2025
2036 FORECAST VALUE$3.8BBase Case , 2026 to 2036
CAGR 2026 TO 20365.6 %Bull 6.8% / Bear 4.4%
INCREMENTAL OPPORTUNITY$1.6BNet 10- year value creation
EXPANSION MULTIPLE1.72x2036 value over 2026 base
Strategic Levers
M&A Pipeline
Regional Outlook
Country Rankings
Competitive Intelligence
Segmental Deep-dive
Call-Us : 91 93563 13602

Executive Snapshot and Market Trajectory

Surface mount components absorb atmospheric moisture, and that moisture flashes to steam during reflow soldering and delaminates the package from inside. The barrier bag, desiccant, indicator card, and vacuum seal all exist to prevent one failure nobody can see afterwards. The part often passes electrical test regardless.
Growth here comes from component miniaturisation and from placement automation rather than from Japanese electronics volume, which is flat. Carrier tape and reel systems grow fastest at 8.4%, exactly 1.50 times the market rate, because smaller passives demand tighter pocket tolerances than older tape can hold. Wafer and substrate carriers follow at 7.3% on domestic fabrication investment. Around 68% of packed output leaves Japan entirely. Packaging must survive sea freight and destination humidity.
Concentration reaches 42% across the top five measured on annual Japanese electronics packaging revenue, held by materials groups rather than by packaging converters. That matters because packaging here sits inside the quality system rather than inside procurement, and a moisture failure costs roughly thirty-four times the component value once board rework is counted. Quality engineering rather than procurement holds specification authority, which changes what a supplier has to prove.
Market Definition
This market covers protective and handling packaging supplied to electronic component, semiconductor, and industrial electronics manufacturers within Japan, spanning moisture barrier bag systems, carrier tape and reel, electrostatic discharge trays and magazines, wafer and substrate carriers, conductive foam and cushioning, and cleanroom outer packaging. Scope is measured at supplier realised prices. Finished consumer electronics retail packaging, distribution cartons and pallets, semiconductor encapsulation materials, and packaging supplied outside Japan are excluded.
Base Year Value
$2.1B in 2025 (MMA Primary Research Dataset, August 2026)
Forecast Period
2026 to 2036, eleven discrete annual values
CAGR
5.6% base case. Bull 6.8%. Bear 4.4%.
Fastest Growth Segment
Carrier Tape And Reel Systems: 8.4% CAGR
Fastest Growth Country
Japan: 5.6% CAGR
Fastest Growth Region
South Asia and Pacific: 7.7% CAGR
Largest Region
East Asia: 52% of 2025 global value
Market Leaders
Shin-Etsu Polymer. Sumitomo Bakelite. Denka. Achilles Corporation. Gunze. Source: MMA Analysis based on company annual reports.
Primary Survey
n=3,800 procurement and R&D decision-makers, Q4 2025, six countries
Methodology
Demand-side build-up, cross-validated against public data, 47 expert interviews

Japan Industrial Electronics Packaging Market Forecast Scenarios

japan-industrial-electronics-market-size-forecast-scenario-1787299383434
The 2020 to 2025 period reflected what Japanese electronics has become rather than what it once was. Finished goods manufacture continued moving offshore while high-value components, sensors, and semiconductor materials held and grew, which changed what needs packing entirely. Semiconductor shortage then inverted demand patterns twice inside three years. A 4.5% historical rate averages a shrinking finished goods base against genuine growth in component and materials packaging.
Three mechanisms carry the 5.6% base case. Component miniaturisation is the largest, since smaller passives need tighter carrier tape tolerances and more of them fit on a reel, which raises packaging value per component shipped. Semiconductor materials export is the second, requiring cleanroom outer packaging that ordinary electronics packaging simply cannot provide. And moisture sensitivity classification tightening is the third, steadily moving more component families into mandatory dry pack requirements.
The 6.8% bull case rests on domestic semiconductor fabrication investment reaching production scale, since new wafer capacity generates carrier, cleanroom, and materials packaging demand that Japan has not seen in decades. The 4.4% bear case is component manufacture following finished goods offshore, which would move packaging demand to the destination country and leave Japanese suppliers serving a shrinking domestic base.

The Clock That Governs Everything

Moisture sensitivity classification assigns a component a floor life, commonly one hundred and sixty-eight hours, that begins when its barrier bag is opened and runs until the part is soldered. Exceed it and the component must be baked out or scrapped. Everything in the dry pack system, meaning the aluminium barrier layer, the sized desiccant, the humidity indicator card, and the vacuum, exists to hold that clock at zero until the assembly line is ready.
TOP FIVE CONCENTRATION42%Concentrated among Japanese materials groups rather than packaging converters
MOISTURE FLOOR LIFE168 hoursPermitted exposure once a dry pack has been opened
DRY PACK REQUIREMENT SHARE71%Component shipments requiring barrier bag and desiccant systems
CARRIER TAPE TOLERANCE0.05 mmDimensional window before automated placement equipment begins rejecting
EXPORT SHARE OF SHIPMENTS68%Packed Japanese electronic components leaving the domestic market
PACKAGING FAILURE COST34xComponent value lost when moisture ingress causes reflow delamination
The consequence of failure is disproportionate and largely invisible. Absorbed moisture flashes to steam at reflow temperature and delaminates the package internally, and the part frequently passes electrical test before failing in the field. Total cost lands near thirty-four times component value once board rework, line stoppage, and warranty exposure are counted, which is why 71% of shipments carry dry pack.
Two things distinguish the Japanese market. Around 68% of packed output is exported, so packaging must survive sea freight and destination humidity rather than a short domestic journey. And packaging specification sits inside the quality system rather than inside procurement, which changes who decides and on what basis entirely.
"Western buyers ask us what the bag costs. Japanese quality engineers ask us to prove the desiccant is correctly sized for the internal volume at the destination humidity, and then they ask for the calculation. Those are different conversations, and only one of them is about packaging."
Director. Electronics Protection and Handling Systems Practice · MMA Packaging a

Market Trends

Component Miniaturisation Tightens Carrier Tape Tolerance Requirements

Passive components have shrunk continuously and the smallest chip capacitors and resistors now sit in carrier tape pockets whose dimensional window is around five hundredths of a millimetre. Outside that window, automated placement heads misfeed, the line stops, and the reject falls on the packaging rather than on the component. Older embossed tape tooling cannot hold those tolerances reliably. Suppliers who invested in precision forming and inline dimensional inspection are taking work from those who did not, and carrier tape grows at 8.4% against a market rate of 5.6%. Inline dimensional inspection is what separates them now.
Market Impact: Dry pack covers 71% of shipments

Semiconductor Materials Export Demands Cleanroom Outer Packaging

Japanese suppliers dominate several semiconductor materials categories including photoresists, specialty gases, and polishing slurries, and those products ship to fabrication plants in Taiwan. Korea, and increasingly the United States. Packaging must maintain particle control from the Japanese cleanroom to the destination cleanroom without any break, which means double bagging, class-rated films, and controlled outer handling. Ordinary electronics packaging cannot provide it. The requirement grows as materials export volumes rise and as fabrication plants tighten incoming particle specifications further. Ordinary electronics packaging cannot provide any of it, and fabrication plants keep tightening incoming specifications.
Market Impact: Wafer carriers grow at 7.3%

Market Opportunities and Growth Drivers

Moisture Classification Tightening Pushes More Parts Into Dry Pack

Component packages have grown thinner and more complex, and thinner packages absorb moisture faster and tolerate it worse during reflow. Successive revisions to moisture sensitivity standards have reclassified components into more demanding levels, which shortens floor life and mandates dry pack where none was previously required. Around 71% of Japanese component shipments now carry barrier bag and desiccant systems. Each reclassification converts an unpackaged shipment into a packaged one, which adds value without any change in component volume at all. Thinner packages absorb faster and tolerate reflow worse, which is why classifications keep tightening.
Market Impact: Failure costs 34 times component va

Domestic Semiconductor Fabrication Investment Creates New Demand

Japan has committed substantial public and private funding to rebuilding domestic semiconductor fabrication capacity, and new wafer plants generate packaging demand that the country has not seen for decades. Wafer carriers, front opening unified pods, cleanroom consumable packaging, and substrate handling all follow fabrication rather than assembly. This is genuine new demand rather than substitution, and it favours suppliers already qualified to semiconductor cleanliness standards over general electronics packaging converters who are not. Wafer carriers, pods, and cleanroom consumables all follow fabrication, rather than following assembly as before, and qualification favours those already certified.
Market Impact: Affects 68% of packed output

Market Restraints and Challenges

Floor Life Failures Are Invisible Until The Field

A component that exceeded its floor life and was soldered anyway frequently passes electrical test, because internal delamination does not always break a connection immediately. The failure appears months later in the field, by which point the board is in a customer's equipment. The root cause is that floor life is a cumulative clock nobody can read from the part itself once the bag is gone. Commercial impact reaches roughly thirty-four times component value. Participants are responding with barcode-linked exposure tracking, single-use bag designs, and indicator cards with finer humidity resolution.
Market Impact: Tolerance window reaches 0.05 milli

Export Transit Exposes Packaging To Conditions Japan Does Not Have

Around 68% of packed Japanese output is exported, and a barrier bag that performs perfectly through a domestic winter faces tropical humidity, container temperature cycling, and weeks at sea on the way to Southeast Asian assembly plants. The root cause is that desiccant sizing calculations are frequently done against domestic conditions rather than destination ones. Commercial impact is moisture indicator cards arriving pink and consignments requiring bake-out on receipt. Mitigation runs through destination-based desiccant calculation, higher barrier film specifications, and transit condition monitoring. Consignments then require bake-out at the customer's expense.
Market Impact: Export carries 68% of shipments
3 additional market trends, 2 additional growth drivers, and 4 additional restraints and challenges are covered in the full report. Contact sales@marketmindsadvisory.com to access the complete intelligence.

Segment CAGR and Growth Architecture

Segmentation follows the packaging system, because each system addresses a different physical threat and is specified by a different engineering function. Component category and destination market both cut across every system rather than separating them cleanly, so neither works as a workable primary dimension for this market. Six systems result, each addressing a different physical threat.
japan-industrial-electronics-market-market-share-analysis-1787299384020

Carrier Tape And Reel Systems

The fastest system at 8.4%, exactly 1.50 times the market rate, and its growth comes from component geometry rather than from volume. Passive components keep shrinking, and the smallest now require pocket tolerances near five hundredths of a millimetre before automated placement equipment begins misfeeding. Cover tape peel force sits in an equally narrow window, since too much force tears the tape mid-reel and too little releases components in transit. Older embossed tooling cannot hold either specification reliably. Precision forming and inline dimensional inspection separate suppliers who can serve the smallest component classes from those confined to larger legacy formats. Legacy formats remain available to everybody else, which is where price competition concentrates.
CAGR 8.4%

Wafer And Substrate Carriers

Second fastest at 7.3%, driven by domestic semiconductor fabrication investment on a scale Japan has not attempted in decades. Wafer carriers, front opening pods, and substrate handling trays all follow fabrication rather than assembly, and they demand particle control, outgassing performance, and dimensional stability that ordinary electronics packaging never approaches. Qualification with a fabrication plant is slow and thorough. That makes the supplier set small and the positions durable once established, since a fab that has qualified a carrier does not revisit the decision casually. Cleanroom moulding capability rather than packaging expertise is what determines who can compete here at all. Qualification with a fabrication plant is slow and thorough, and positions hold for years once established.
CAGR 7.3%
Full segment breakdown across 6 segments available in the complete report.

Regional Architecture and Country Demand Map

This is a single-country market, so the seven-region table cannot describe demand geography at all. It has been repurposed to show where packed Japanese electronic shipments actually travel, which places every share outside its normal framework band. Every share below should be read on that basis.

East Asia

Fifty-two percent of packed Japanese electronics shipments stay within East Asia, far above the framework band because this table shows destination rather than demand geography. Japanese domestic consumption accounts for a substantial part, and the remainder travels to Taiwanese and Korean semiconductor assembly. Chinese set manufacture, and materials customers across all three. Transit is short and climate broadly comparable, which makes desiccant calculation straightforward and moisture excursions rare. Growth at 6.4% runs above the market rate on semiconductor materials export and on domestic fabrication investment beginning to consume carriers and cleanroom packaging at scale. Transit is short and climate broadly comparable throughout, which makes desiccant calculation straightforward, Moisture excursions are consequently rare on these routes.
Share: 52% | CAGR: 6.4% (2026 to 2036)

South Asia and Pacific

Fifteen percent of shipments travel to South and Southeast Asia, above the framework band under this repurposed reading, principally to assembly and test operations across Malaysia, the Philippines. Thailand, and Vietnam. This is the destination that punishes packaging hardest, since tropical humidity, long sea transit, and warehouse conditions well outside Japanese norms all attack barrier performance simultaneously. Desiccant sized against Japanese conditions arrives inadequate. Growth at 7.7% is the highest of any destination, driven by assembly and test capacity continuing to concentrate across the region rather than by any change in Japanese output. This is the destination that punishes packaging hardest anywhere, and desiccant sized for Japan arrives inadequate, Assembly and test capacity keeps concentrating across the region.
Share: 15% | CAGR: 7.7% (2026 to 2036)
Regional intelligence for 5 additional markets available in the complete report: North America, Western Europe, Latin America, Middle East and Africa, Eastern Europe. Contact sales@marketmindsadvisory.com.
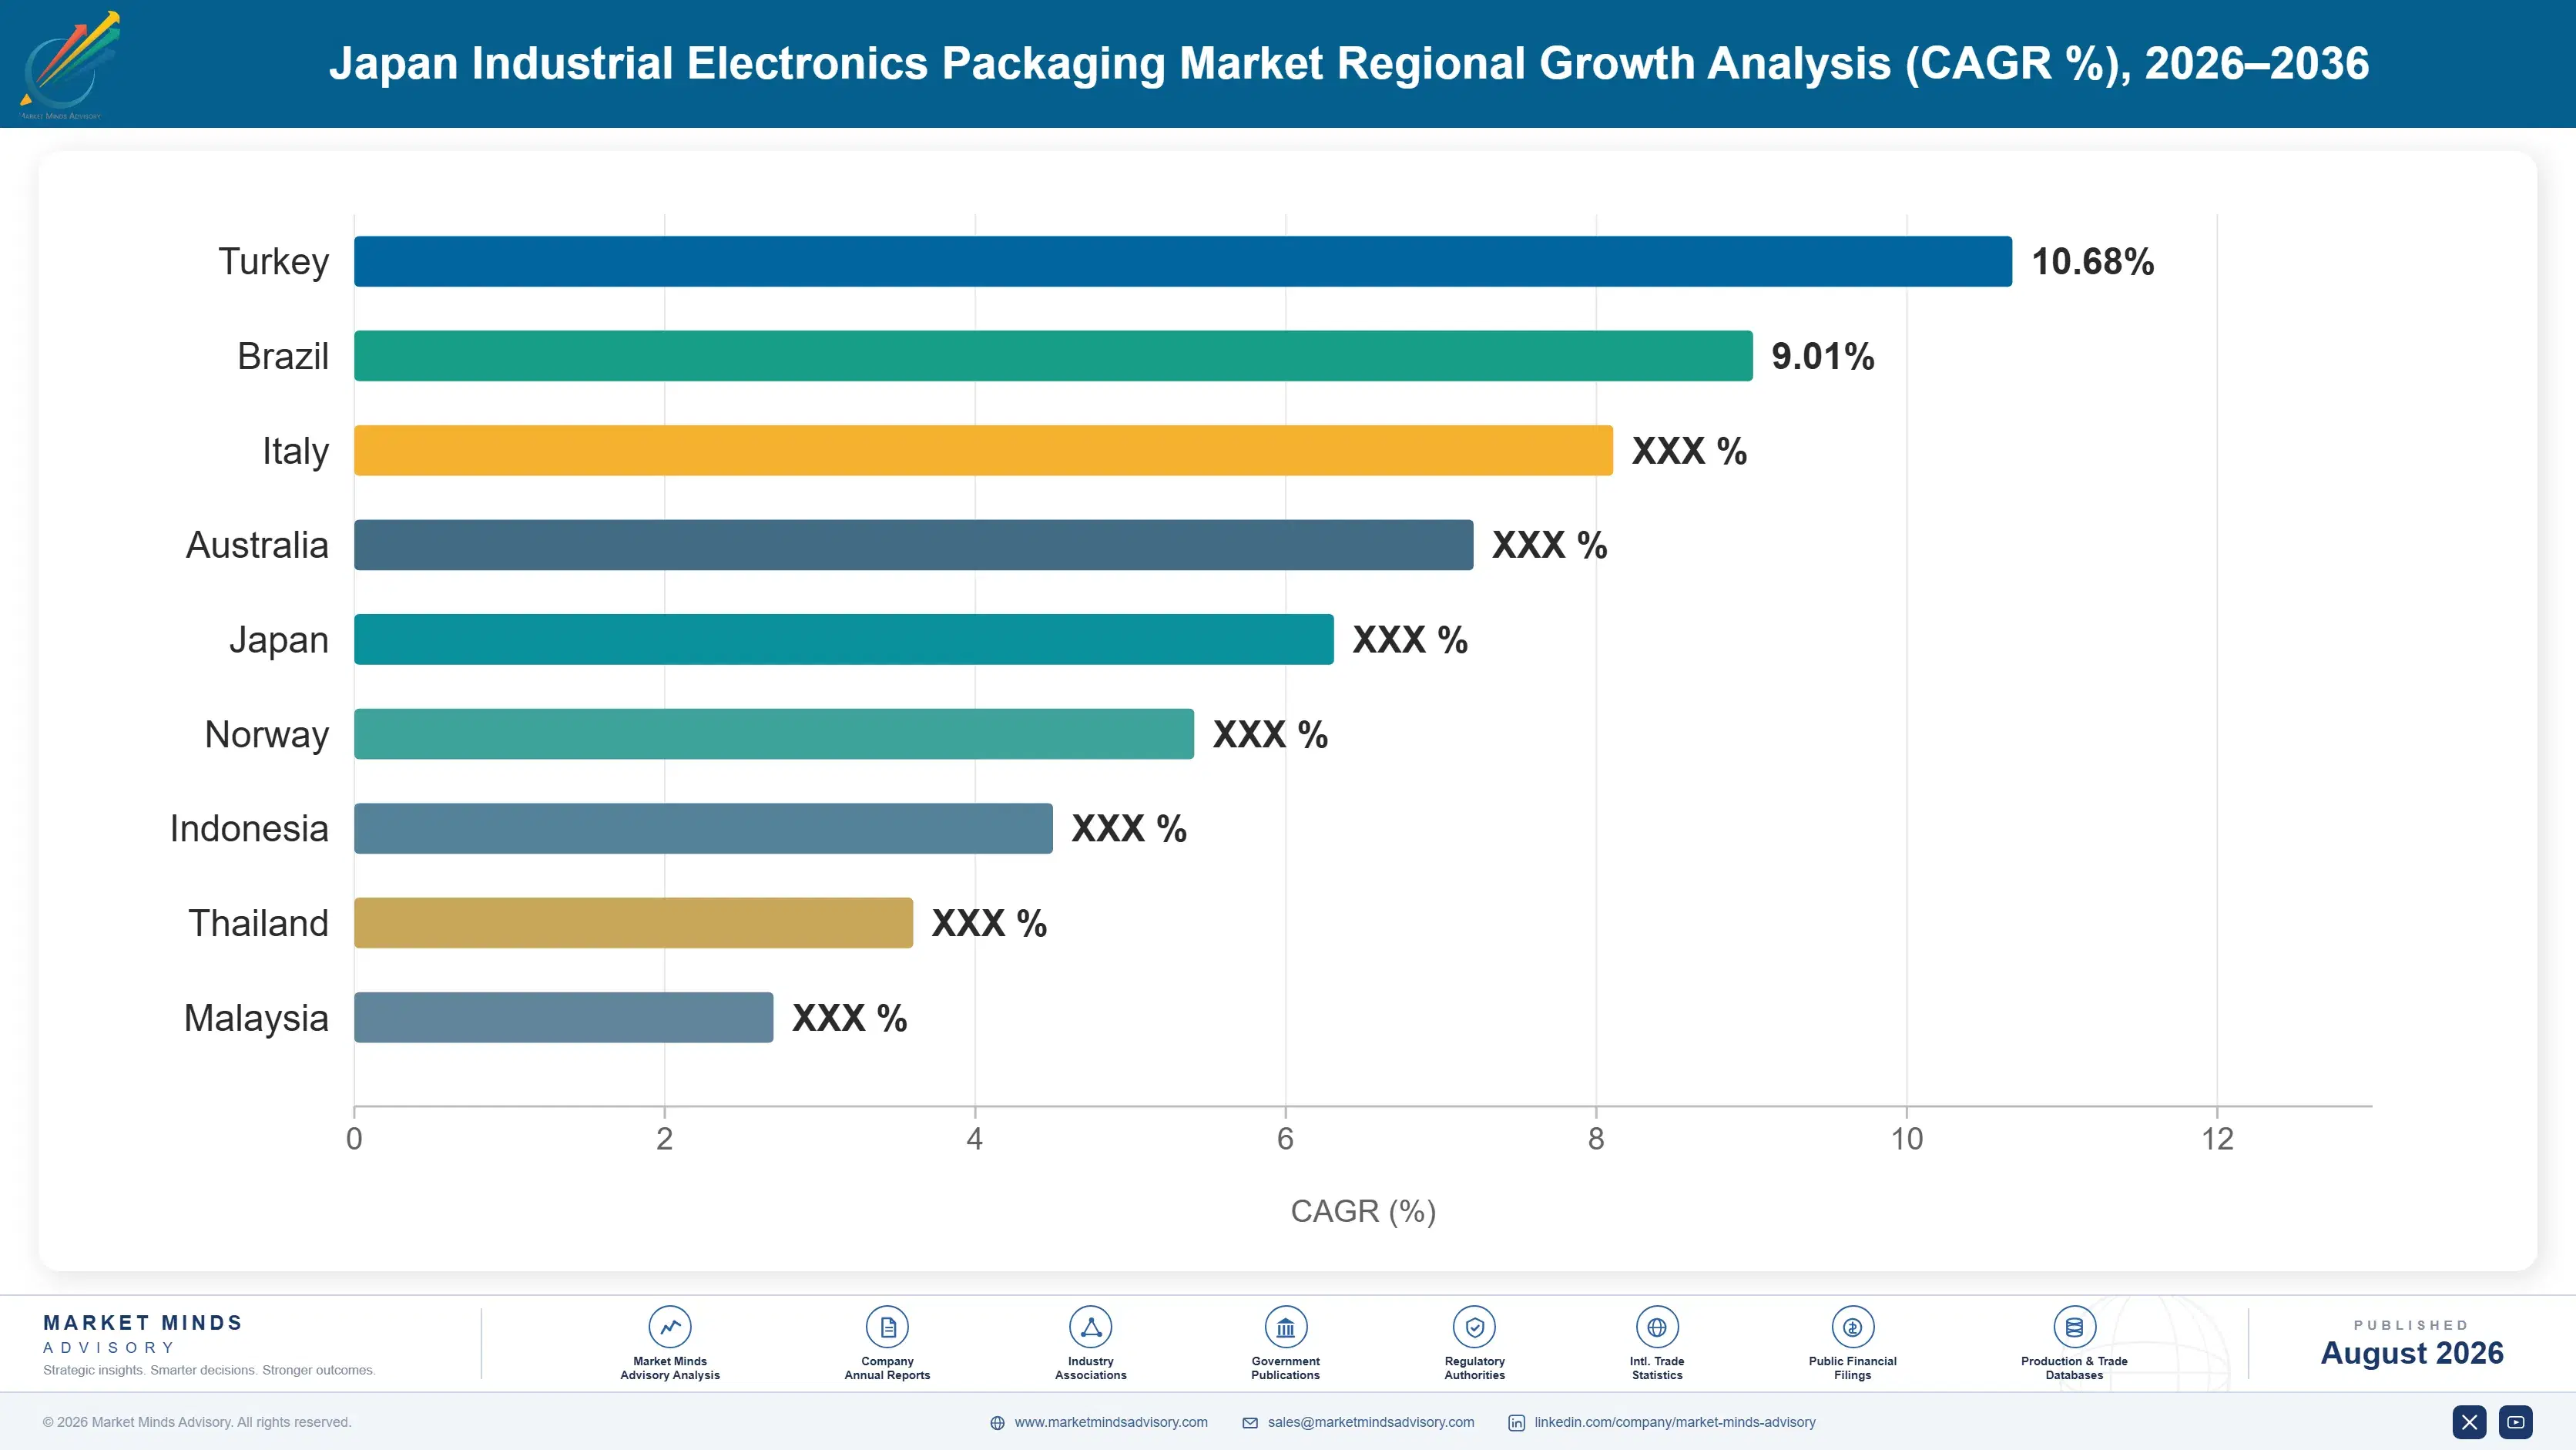
japan-industrial-electronics-market-country-cagr-analysis-1787299384591

Four Ways to Sell Protection Properly

Barrier film and embossed tape are available from several suppliers at similar prices, so nobody wins on material. Value comes from selling the floor life clock rather than the bag, from guaranteeing tape tolerance, from qualifying for cleanroom work, and from pricing against reject cost. Four levers follow, and none of them concerns the film.

Sell The Floor Life Clock Rather Than The Barrier Bag

A dry pack exists to hold a component at zero exposure until the assembly line opens it, and everything about that system is a calculation rather than a product: desiccant quantity against internal volume, barrier film performance against transit duration, indicator card resolution against the sensitivity level. Suppliers who present the calculation win specification with quality engineers who cannot evaluate a bag price. Building that calculation capability costs around 600,000 dollars and moves the conversation entirely away from procurement comparison. Quality engineers cannot evaluate a bag price at all, and they hold the authority.
Market Impact: Calculation capability costs roughl

Guarantee Carrier Tape Tolerance Instead Of Quoting It

Pocket dimensions outside a window near five hundredths of a millimetre cause placement misfeeds, and a stopped assembly line costs the customer far more than any tape price difference. Suppliers who guarantee tolerance with inline dimensional inspection data attached to every reel convert a commodity comparison into a reliability one. Inspection capability costs roughly 2 million dollars across a tape line set. Customers running the smallest component classes cannot use tape that has not been measured, which narrows their supplier options considerably. A stopped line costs far more than any tape difference.
Market Impact: Inspection capability costs roughly

Qualify For Cleanroom Semiconductor Materials Packaging

Japanese photoresists, gases, and polishing slurries ship to fabrication plants that specify incoming particle counts, and packaging must maintain cleanroom conditions from origin to destination without any break. Qualifying to that standard requires cleanroom moulding and packing capability rather than any packaging expertise, and it costs around 12 million dollars to establish. The reward is a supplier set small enough that qualified positions hold for years, since a fabrication plant does not requalify incoming packaging without a genuine reason to. Fabrication plants do not requalify packaging without reason, which makes qualified positions durable.
Market Impact: Cleanroom qualification costs rough

Price Against Reject Cost Rather Than Packaging Cost

A moisture failure costs roughly 34 times component value once board rework, line stoppage, and field exposure are counted, and none of that appears in a packaging quotation. Presenting the comparison in reject cost terms reframes a decision that procurement would otherwise make on unit price alone. Japanese quality functions respond to this framing far more readily than purchasing does, and they hold the specification authority. Suppliers still quoting bags against bags are addressing the department that does not decide. None of that appears anywhere in a packaging quotation, and quality functions hold the specification authority.
Market Impact: Failures cost 34 times the full com

Who Controls the Margin Pool

Concentration reaches 42% across the top five measured on annual Japanese electronics packaging revenue, and the composition is unusual because the leaders are chemical and materials groups rather than packaging converters. That reflects what the products actually are: barrier films, precision-formed polymer tape, and cleanroom-grade mouldings are materials science problems that happen to be sold as packaging. Packaging converters rarely hold the underlying materials science.
Competition runs on three fronts. Precision forming capability is the first, and it decides who can serve the smallest component classes at all. Cleanroom qualification is the second, restricting the supplier set for semiconductor materials work to a handful of companies. Application engineering is the third, meaning the desiccant and barrier calculations that Japanese quality functions actually evaluate. Price competition sits almost entirely in the standard tier.

Pressure comes from two directions. Taiwanese and Korean packaging suppliers have built capability alongside their own semiconductor industries and now compete on export routes. And component manufacture continuing to move offshore would relocate demand to destination countries entirely. Neither pressure can be answered from within Japan alone, which is uncomfortable for domestically concentrated suppliers.
japan-industrial-electronics-market-company-positioning-matrix-1787299385164

Competitive Moat and Risk Dimensions

SHIN-ETSU POLYMER

Moat: Precision forming and cleanroom capability

Holding both precision carrier tape forming and cleanroom-grade wafer carrier moulding covers the two technically hardest positions in this market from a single materials base. Neither capability transfers easily from general packaging converting, and both require qualification processes measured in years rather than months. Semiconductor customers who have qualified a carrier rarely revisit that decision without a compelling reason to.
SHIN-ETSU POLYMER

Risk: Tied to Japanese manufacturing base

Capability is concentrated in Japan while component manufacture has been moving offshore for two decades, which means the addressable base at home could keep shrinking regardless of how strong the technical position is. Serving destination markets means building capability there and competing against local suppliers already established. Domestic fabrication investment offsets this partially and does not reverse the longer trend.
SUMITOMO BAKELITE

Moat: Materials science across electronics packaging

Deep polymer and barrier materials capability developed across semiconductor encapsulation transfers directly into protective packaging, where the questions are about permeability, outgassing, and particle generation rather than about converting at all. Customers evaluating packaging as a materials problem find a materials company the natural counterparty here.
SUMITOMO BAKELITE

Risk: Packaging competes for internal capital

Electronics packaging sits inside a chemicals portfolio where capital competes against semiconductor materials businesses with considerably larger addressable markets and better growth. Specialist packaging suppliers concentrating exclusively on protection systems move faster on carrier tolerance and dry pack engineering. Breadth funds the science and can slow the commercial response to a specific customer requirement.

Players Tracked

Prominent Players

Shin-Etsu Polymer
Sumitomo Bakelite
Denka
Achilles Corporation
Gunze

Other Key Players

Toray
Asahi Kasei
Kyodo Printing
Dai Nippon Printing
Toppan
Sekisui Chemical
Entegris
Miraial
Nitto Denko
Oji Holdings
Rengo
Zeon Corporation
JSR Corporation
Kaneka
Teijin

Recent Developments

FEBRUARY 2025

Japanese supplier adds inline dimensional inspection across carrier tape lines

A carrier tape manufacturer installed inline dimensional measurement across its embossed tape production, generating pocket tolerance data attached to individual reels for customers running the smallest component classes. The investment was organic capital expenditure rather than any partnership with a placement equipment manufacturer or component maker.
Signal: Measured tolerance data turns a commodity
MAY 2025

Domestic fabrication project begins qualifying cleanroom packaging suppliers

A semiconductor fabrication project under construction in Japan began qualifying suppliers for wafer carriers, cleanroom consumable packaging, and substrate handling systems ahead of production start. The qualification was an internal procurement process rather than any joint venture, and it covers several supplier categories simultaneously. Production start dates were not published.
Signal: Domestic fabrication generates packaging d
SEPTEMBER 2025

Component maker adopts destination-based desiccant calculation across export packing

A Japanese passive component manufacturer revised its dry pack specification to calculate desiccant quantity against destination climate and transit duration rather than against domestic conditions, following moisture indicator excursions on Southeast Asian consignments. The change was an internal quality decision rather than any supplier initiative.
Signal: Desiccant sized for a Japanese winter arri

Films. Polymer, and Cleanroom Overhead

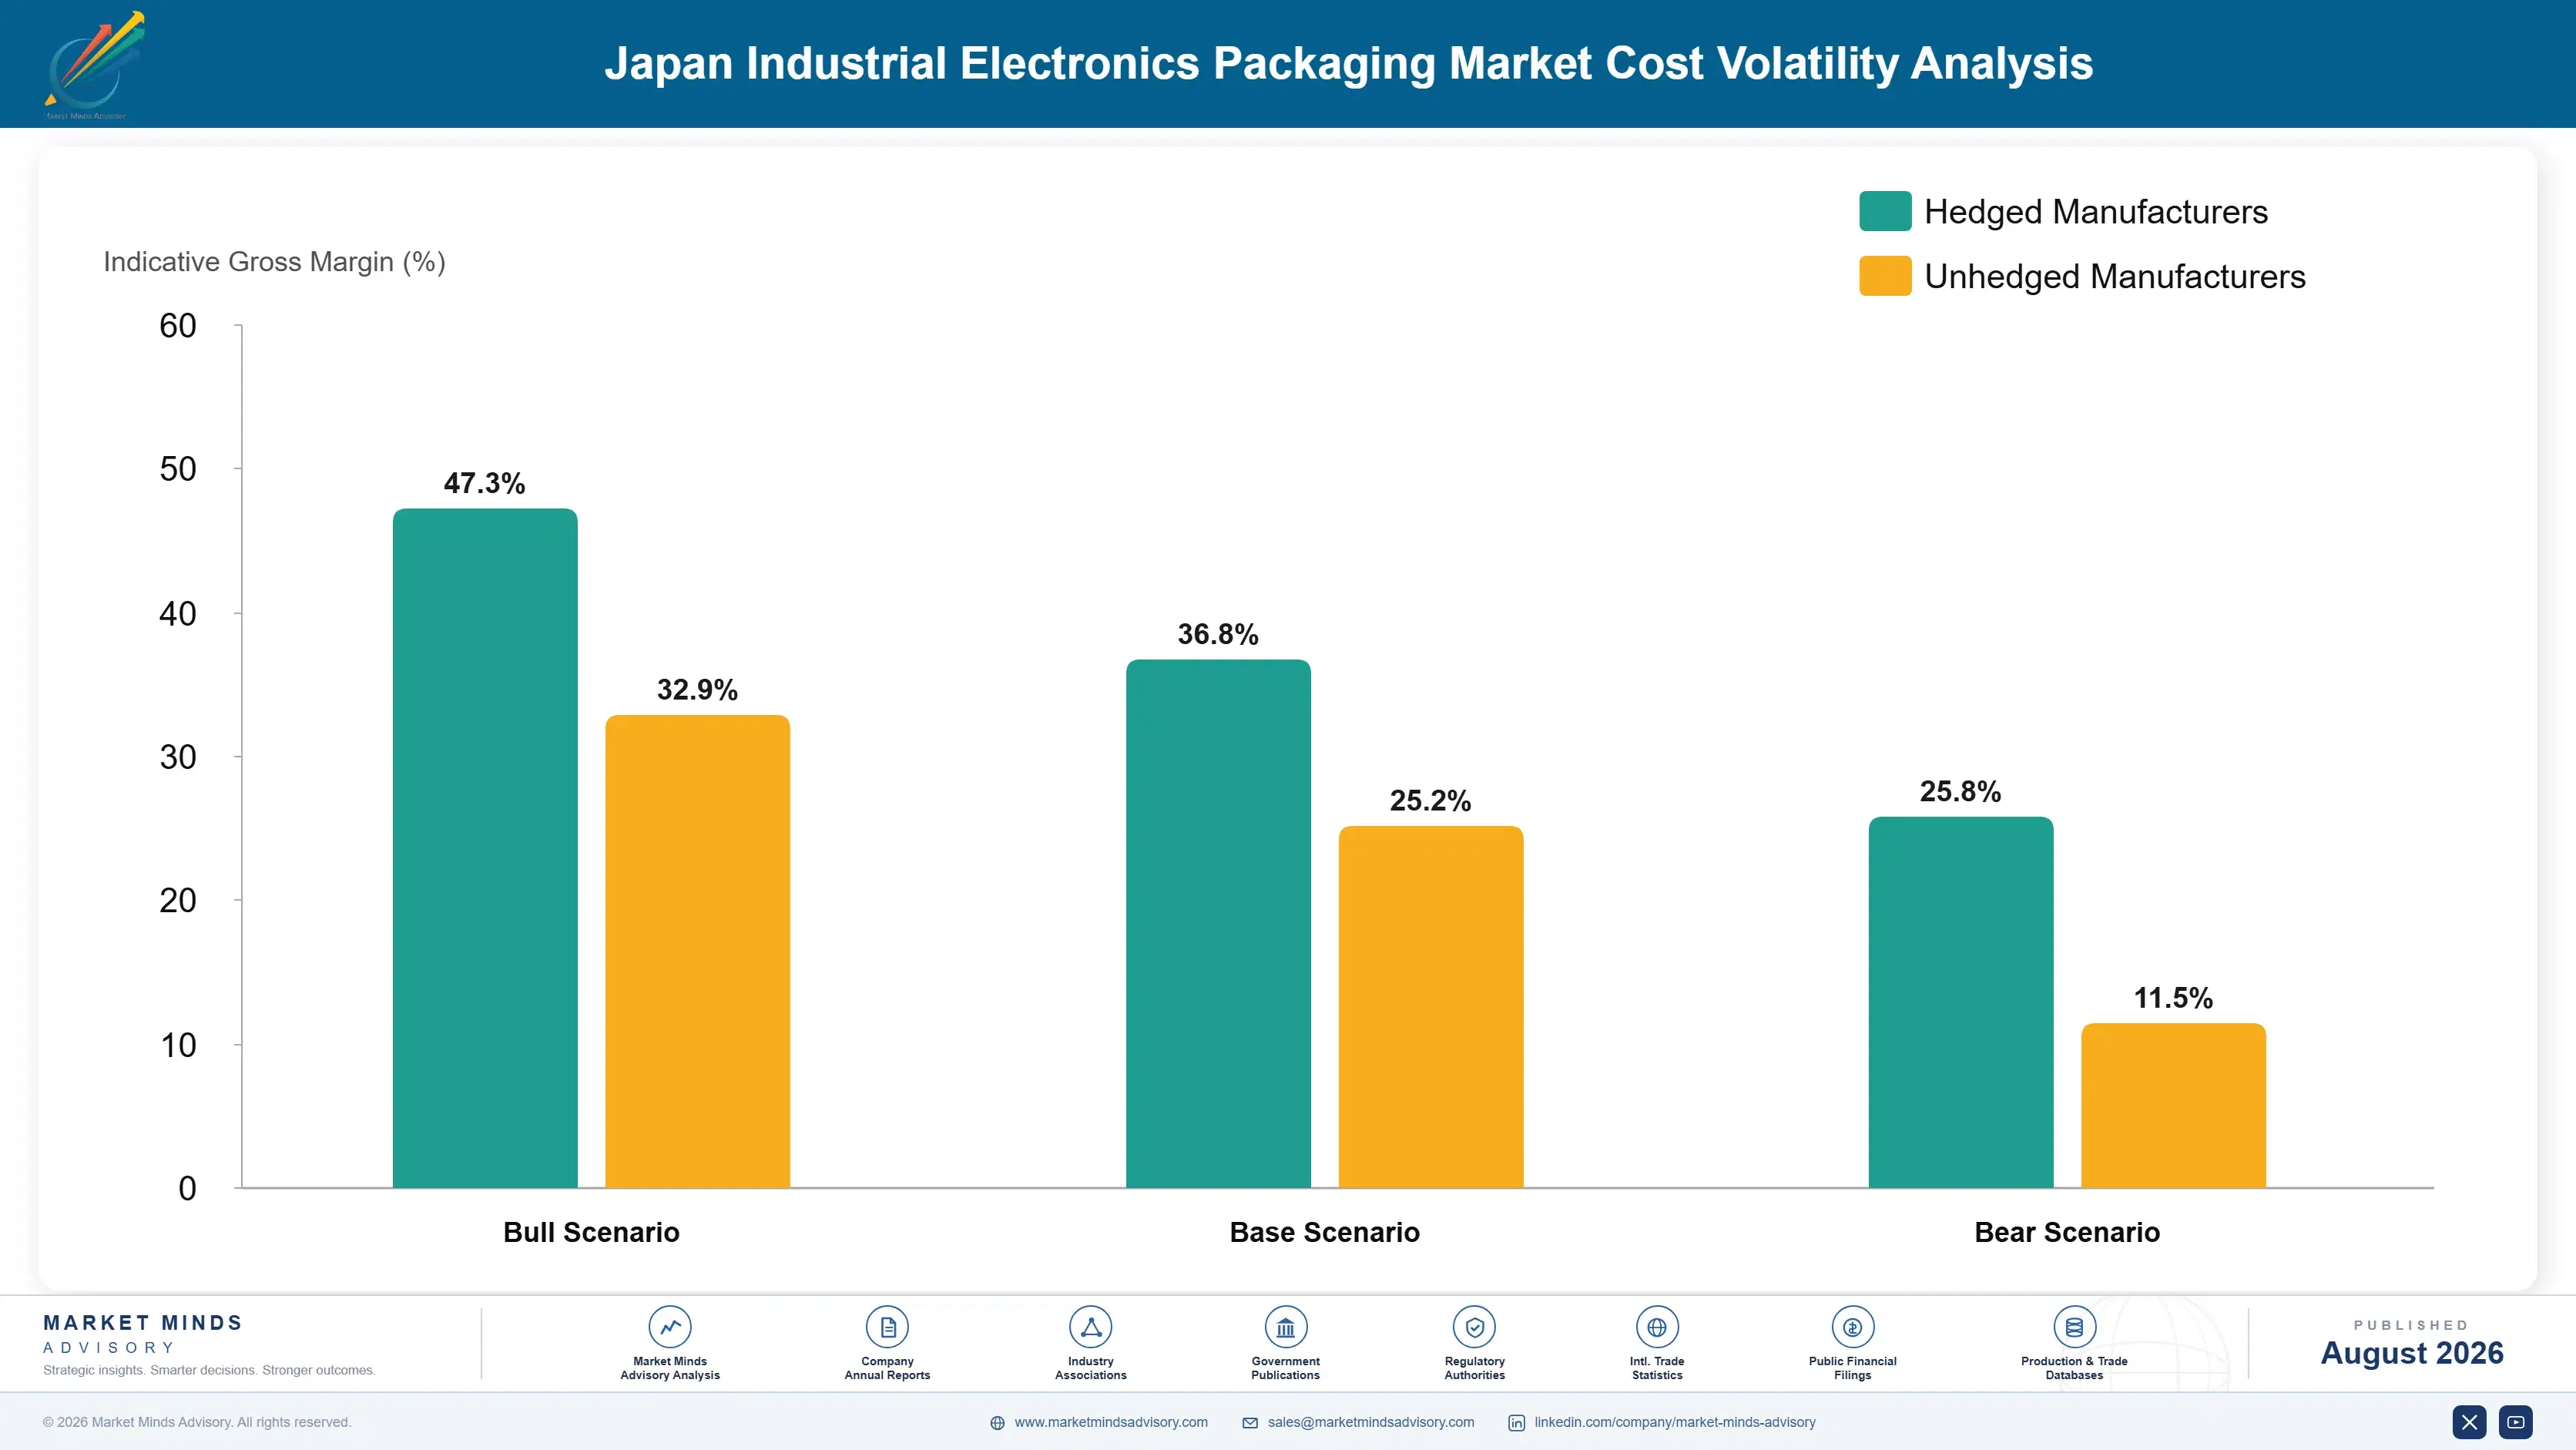
Cost structure differs sharply by system. For moisture barrier bags, aluminium foil laminate film runs about 51% of cost with desiccant and indicator cards adding a further 19%. For carrier tape, polystyrene and polycarbonate sheet accounts for roughly 44%, with precision forming energy and tooling amortisation carrying most of the remainder. Cleanroom systems add facility overhead that dominates everything else.
Aluminium laminate and specialty polymer were the exposures that mattered. Barrier film pricing moved on metal and conversion costs through the recent period, and antistatic polymer grades tightened as additive supply constrained. Company annual reports across Japanese materials manufacturers describe both effects in consistent terms. Cleanroom facility energy also rose materially, and unlike other overhead it cannot be reduced by running fewer shifts because the environment must be maintained continuously.

The competitive disadvantage mechanism runs through cleanroom utilisation rather than material purchasing. A supplier running cleanroom capacity below efficient loading carries facility cost across fewer parts, and that environment costs the same whether it produces anything or not. Barrier film exposure is broadly shared. Suppliers holding cleanroom capability without sufficient qualified volume to fill it are worst placed, and several have withdrawn from semiconductor work rather than continue.
japan-industrial-electronics-market-cost-volatility-analysis-1787299385366

Load cleanroom capacity before adding any further class-rated space

A cleanroom costs the same to maintain whether it produces anything or not, so utilisation dominates cost per part far more than material choice ever does. Filling existing class-rated capacity with qualified work matters more than expanding it, and suppliers routinely build ahead of qualified demand. Qualification timelines with semiconductor customers run years, which makes speculative capacity genuinely dangerous.

Contract aluminium barrier laminate annually with index review

Barrier film carries around half of moisture bag cost and moves on both metal and conversion pricing, which a supplier quoting fixed annual packaging prices absorbs directly. Annual volume commitments with quarterly index review convert that into a known exposure. Film producers accept these readily, and smaller packaging suppliers frequently fail to negotiate them at all.

Qualify a second antistatic polymer grade for tape production

Carrier tape requires controlled surface resistivity, which depends on specific antistatic additive systems that tightened in availability during recent supply disruption. Qualifying an alternative grade within the same resistivity band takes testing time and customer notification that cannot be found during a shortage. The work is inexpensive in advance and impossible to compress once availability has already become the problem.

Portfolio Architecture for Margin Defence

Three tiers describe this business and the margin spread reflects qualification burden rather than material content. Standard antistatic bags, trays, and cushioning sit at the bottom, competing on price against regional suppliers across Asia. Engineered dry pack systems and precision carrier tape sit considerably higher, protected by calculation capability and dimensional control. And cleanroom-qualified semiconductor packaging occupies a third tier where the supplier set is genuinely small. Mat
The tension is that standard work funds the qualification infrastructure. Maintaining measurement capability, application engineering, and cleanroom environments is expensive fixed cost, and it needs volume underneath it. Several suppliers moved toward semiconductor work exclusively and found cleanroom utilisation falling below the level where facility cost per part remains tolerable. Cleanroom overhead does not fall when volume does.

High-value pools concentrate where the supplier answers a question the customer's quality function is asking. Desiccant calculation and measured tape tolerance both do exactly that, and neither is available from a supplier competing on unit price. Neither is available from anybody competing on unit price, which is precisely what protects them.

Volume / Commodity-Adjacent Tier

Standard antistatic bags, general purpose trays, conductive foam, and cushioning supplied against straightforward specifications. Thin margin under regional Asian competition, and the volume that funds application engineering and measurement capability across everything above it.
Gross Margin: 16-24%

Premium / Certified Tier

Engineered dry pack systems with documented desiccant calculation and precision carrier tape supplied with dimensional inspection data. Margin reflects application engineering and measurement capability rather than any difference in the films or polymers used.
Gross Margin: 28-39%

Sustainability / Regulatory / Next-Generation Tier

Cleanroom-qualified wafer carriers, semiconductor materials packaging, and particle-controlled outer systems maintained from origin cleanroom to destination. Best margin because qualification takes years and the resulting supplier set stays genuinely small.
Gross Margin: 34-48%
japan-industrial-electronics-market-portfolio-architecture-1787299385893

High-value Sub-segments and Strategic Watch-out

Cleanroom Semiconductor Packaging

Best margin in the category and protected by qualification timelines measured in years rather than months, which keeps the supplier set very small. Domestic fabrication investment is creating demand Japan has not needed to supply for decades. Cleanroom moulding capability rather than packaging expertise decides entry.
Gross Margin: 34-48%

Precision Carrier Tape Systems

Strong margin and the fastest growth at 8.4%, since the smallest component classes need pocket tolerances that older embossed tooling cannot hold reliably. Measured tolerance data attached to each reel is what converts the commodity comparison. Cover tape peel force sits in an equally narrow window.
Gross Margin: 28-39%

Standard Antistatic Bags And Trays

The volume core at thin margin under competition from regional Asian suppliers, and the loading that funds measurement and engineering capability elsewhere. Suppliers who abandoned it found cleanroom and inspection overhead spread across too little volume. Regional Asian suppliers compete hard on this tier constantly.
Gross Margin: 16-24%

Export Dry Pack Systems

The strategic watch-out, covering 68% of packed output while desiccant is frequently calculated against Japanese rather than destination conditions. Indicator cards arriving pink at tropical assembly plants is a recurring and entirely avoidable failure. Destination-based calculation removes the failure entirely, and costs only engineering attention.
Gross Margin: 26-37%

How Component Packaging Demand Repeats

Packaging demand here tracks component shipment volume exactly, because every reel, tray, and bag corresponds to a defined quantity of parts leaving the factory. Once a packaging specification is written into a component's quality documentation it stays there for the product's life, since changing it means requalification with every customer who receives that part. That makes specification the moment of competition and everything afterwards a matter of production scheduling rather than selling.
Depth of relationship varies by customer type. Passive component makers ship enormous reel volumes on tightly controlled specifications and audit suppliers rigorously. Semiconductor materials producers demand cleanroom qualification and hold suppliers for years afterwards. Industrial electronics manufacturers buy smaller volumes across more variants and value flexibility. Contract assemblers receiving packed components have no supplier relationship at all, yet they are the ones who discover packaging failures.

Buyer profiles are unusual here and have not changed much. Quality engineering rather than procurement holds specification authority in most Japanese component makers, which is why calculation and documentation matter more than price. Calculation and documentation matter far more than price does, which is unusual across packaging generally.
japan-industrial-electronics-market-end-use-penetration-index-1787299386400

What We Would Tell a Board

These are among the four positions where our research anticipates prominent divergence between winners and laggards over the coming forecast period. Each is grounded in the demand model, the regulatory perimeter, and the announced capacity pipeline.
01 / APPLICATION ENGINEERING INVESTMENT

Sell the calculation, because the bag is not the product

Every element of a dry pack is a calculation rather than an item: desiccant quantity against internal volume, barrier performance against transit duration, indicator resolution against sensitivity level. Japanese quality engineers evaluate those calculations closely and cannot meaningfully evaluate a bag price at all, which is precisely why suppliers presenting the working tend to win the specification. Building that capability costs around 600,000 dollars, and it moves the entire conversation away from a procurement comparison that the supplier is fairly unlikely to win anyway.
02 / MEASUREMENT AS DIFFERENTIATION

Guarantee the tolerance and attach the data

Carrier tape pocket dimensions outside a window near five hundredths of a millimetre cause placement misfeeds, and a stopped assembly line costs the customer orders of magnitude more than any tape price difference could recover. Inline dimensional inspection across a tape line set costs roughly 2 million dollars and produces data that can be attached to every reel shipped. Customers running the smallest component classes cannot responsibly use tape that nobody has measured, which removes unmeasured competitors from consideration entirely.
03 / DESTINATION CONDITION DISCIPLINE

Size the desiccant for where it lands, not where it ships

Around 68% of packed Japanese output is exported, much of it to Southeast Asian assembly plants where humidity, transit duration, and warehouse conditions bear no resemblance at all to Japanese norms. Desiccant calculated against domestic conditions arrives inadequate, indicator cards read pink on opening, and consignments then require bake-out on receipt at the customer's own expense. Recalculating against destination climate and transit duration costs nothing beyond engineering attention, and it removes a failure mode that recurs constantly right across this industry.
04 / CLEANROOM UTILISATION DISCIPLINE

Fill the clean space before building any more

A cleanroom costs exactly the same to maintain whether it produces anything or not, so utilisation dominates cost per part far more than any material choice ever will. Qualification with semiconductor customers takes several years, which makes capacity built ahead of qualified demand genuinely dangerous rather than merely a little early. Several suppliers moved toward semiconductor work before securing any qualified volume at all, and then found facility cost per part rising to levels that made the premium tier entirely unprofitable.

Engagement Snapshot From the Field

A live engagement with an industry participant carrying material or product regulatory and market exposure ahead of a defining policy shift, showing how our research translates into a defensible multi-year portfolio strategy.
MARKET MINDS ADVISORY · CLIENT ENGAGEMENT SUMMARY
Japan Industrial Electronics Packaging Producer Strategic Portfolio Review and Transition Roadmap 2026·Investment Scenario on Japan Industrial Electronics Packaging Exposure Evaluation 2025-26
CLIENT PROFILE
A Japanese electronics packaging manufacturer with approximately 180 million dollars in annual revenue (client-reported, unverified by MMA), supplying moisture barrier bags, carrier tape, and antistatic trays to component makers across Japan. The company quoted on unit price, calculated desiccant against domestic ambient conditions, and had recently commissioned cleanroom capacity ahead of any qualified semiconductor volume.
STRATEGIC CHALLENGE
Margin had declined for two years while volumes held steady, cleanroom utilisation sat well below fifty percent, and two component customers had reported moisture indicator excursions on Southeast Asian consignments. Management proposed further cleanroom expansion. The board wanted an independent view before approving additional facility capital. Nobody had connected the three observations.
MMA APPROACH
We recalculated desiccant requirements for the client's principal export routes using destination climate and transit duration data, benchmarked carrier tape dimensional capability against the smallest component classes in production, and modelled cleanroom cost per part across utilisation scenarios. Customer quality functions were interviewed across six accounts on how packaging specifications are actually decided.
KEY FINDINGS
  1. Desiccant quantities on Southeast Asian routes were undersized by a wide margin against destination humidity and transit duration, which explained both reported excursions completely.
  2. Quality engineering rather than procurement held specification authority at all six customers interviewed, and none had ever been shown the client's desiccant calculations.
  3. Carrier tape produced without inline dimensional measurement could not be qualified for the smallest component classes, excluding the client from the fastest-growing volume entirely.
  4. Cleanroom cost per part at current utilisation exceeded what any semiconductor qualification would recover, and further expansion would have worsened the position considerably.
CLIENT PROFILE
A Japanese electronics packaging manufacturer with approximately 180 million dollars in annual revenue (client-reported, unverified by MMA), supplying moisture barrier bags, carrier tape, and antistatic trays to component makers across Japan. The company quoted on unit price, calculated desiccant against domestic ambient conditions, and had recently commissioned cleanroom capacity ahead of any qualified semiconductor volume.
STRATEGIC CHALLENGE
Margin had declined for two years while volumes held steady, cleanroom utilisation sat well below fifty percent, and two component customers had reported moisture indicator excursions on Southeast Asian consignments. Management proposed further cleanroom expansion. The board wanted an independent view before approving additional facility capital. Nobody had connected the three observations.
MMA APPROACH
We recalculated desiccant requirements for the client's principal export routes using destination climate and transit duration data, benchmarked carrier tape dimensional capability against the smallest component classes in production, and modelled cleanroom cost per part across utilisation scenarios. Customer quality functions were interviewed across six accounts on how packaging specifications are actually decided.
KEY FINDINGS
  1. Desiccant quantities on Southeast Asian routes were undersized by a wide margin against destination humidity and transit duration, which explained both reported excursions completely.
  2. Quality engineering rather than procurement held specification authority at all six customers interviewed, and none had ever been shown the client's desiccant calculations.
  3. Carrier tape produced without inline dimensional measurement could not be qualified for the smallest component classes, excluding the client from the fastest-growing volume entirely.
  4. Cleanroom cost per part at current utilisation exceeded what any semiconductor qualification would recover, and further expansion would have worsened the position considerably.
RECOMMENDED STRATEGY
Phase 1: Phase 1 (months one to six): halt cleanroom expansion, recalculate all export desiccant specifications against destination conditions, and present the working to customer quality functions. Phase 2: Phase 2 (months six to eighteen): install inline dimensional inspection across carrier tape lines to access the smallest component classes. Phase 3: Phase 3 (months eighteen to thirty): pursue semiconductor qualification only against volume commitments sufficient to load the existing cleanroom capacity.
OUTCOME
The client suspended cleanroom expansion and revised export desiccant specifications across all routes. Moisture excursions ceased within two quarters, dimensional inspection opened access to the smallest component classes, and margin recovered without any price increase (client-reported, unverified by MMA), and cleanroom utilisation improved as qualified work arrived.

Frequently Asked Questions

Foundational context covering the market sizes, CAGR, scope, country, region and competition that inform every finding below. This section is provided to cover basics and most often pre-purchase conversations, answered from the MMA Primary Research Dataset.

What is the current size of the Japan Industrial Electronics Packaging Market?

The market is valued at USD 2.1 billion in 2025, rising to USD 2.22 billion in 2026. Around 71% of component shipments require dry pack systems.

How large will the Japan Industrial Electronics Packaging Market be by 2036?

MMA forecasts USD 3.82 billion by 2036, an increase of USD 1.60 billion over the 2026 base. That represents an expansion multiple of 1.72 times.

What is the CAGR for the Japan Industrial Electronics Packaging Market 2026 to 2036?

The base case CAGR is 5.6%, with a bull case of 6.8% and a bear case of 4.4%. The historical rate from 2020 to 2025 was 4.5%.

Which segment is growing fastest?

Carrier tape and reel systems at 8.4%, exactly 1.50 times the market rate. Component miniaturisation demands pocket tolerances near five hundredths of a millimetre that older tooling cannot hold.

Who are the major companies in the Japan Industrial Electronics Packaging Market?

Shin-Etsu Polymer, Sumitomo Bakelite, Denka, Achilles Corporation, and Gunze lead on annual Japanese electronics packaging revenue. The top five together hold 42% of the market.

Which country is growing fastest?

This is a single-country market, so the growth rate for Japan matches the market rate of 5.6%. Within it, carrier tape and wafer carriers grow considerably faster than the average.

Report Segmentation Architecture

The full report scope spans multiple orthogonal segmentation dimensions, with cross-tabulated demand data provided for each dimension pair. Coverage extends further to regional breakdowns, trend trajectories, and the competitive detail needed to support segment-level decision-making.

By Packaging System

  • Moisture Barrier Bag Systems
  • Carrier Tape And Reel Systems
  • ESD Trays And Magazines
  • Wafer And Substrate Carriers
  • Conductive Foam And Cushioning
  • Cleanroom Outer Packaging Systems

By End-Use Industry

  • Passive Component Manufacturing
  • Semiconductor Devices And Materials
  • Display And Optical Components
  • Automotive And Industrial Electronics
  • Connector And Electromechanical Parts

By Shipment Destination

  • Domestic Japanese Assembly
  • Regional East Asian Assembly And Test
  • Southeast Asian Assembly Operations
  • Long-Haul Export To Western Markets

By Region

  • East Asia
  • South Asia and Pacific
  • North America
  • Western Europe
  • Latin America
  • Middle East and Africa
  • Eastern Europe

Scope, Methodology, and Coverage

Every figure in this report is reproducible from documented input assumptions. The scope below maps the historical period, the forecast horizon, the segmentation dimensions, and the countries covered, alongside the underlying primary and qualitative methodology.
Historical Period
2020 to 2025
Forecast Period
2026 to 2036
Base Year
2025 (USD billions; MMA Primary Research Dataset, August 2026)
Market Definition
This market comprises protective and handling packaging supplied to electronic component, semiconductor, display, and industrial electronics manufacturers located within Japan, measured at supplier realised prices for all systems shipped from Japanese operations. System coverage spans moisture barrier bag systems with desiccant and indicator cards, carrier tape and reel, electrostatic discharge trays and magazines, wafer and substrate carriers, conductive foam and cushioning, and cleanroom outer packaging. Finished consumer electronics retail packaging, distribution cartons and pallets, semiconductor encapsulation compounds and die attach materials, assembly equipment, and packaging manufactured and supplied entirely outside Japan fall outside scope.
Quantitative Units
USD billions (current prices); million packaging units shipped; realised price per unit
Segmentation Dimensions
By Packaging System; By End-Use Industry; By Shipment Destination; By Region
Regions Covered
East Asia, South Asia and Pacific, North America, Western Europe, Latin America, Middle East and Africa, Eastern Europe
Countries Covered
Japan as the market geography, with shipment destination coverage spanning Taiwan, China, South Korea, Malaysia, Philippines, Thailand, Vietnam, Singapore, India, USA, Canada, Mexico, Germany, Italy, France, UK, Netherlands, Czechia, Hungary, Poland, Slovakia, Israel, Turkey, Brazil, Morocco, Saudi Arabia, UAE, South Africa, and additional destinations relevant to this supply chain
Key Companies Profiled
Shin-Etsu Polymer, Sumitomo Bakelite, Denka, Achilles Corporation, Gunze, Toray, Asahi Kasei, Kyodo Printing, Dai Nippon Printing, Toppan, Sekisui Chemical, Entegris, Miraial, Nitto Denko, Oji Holdings, Rengo, Zeon Corporation, JSR Corporation, Kaneka, Teijin
Quantitative Methodology
Primary survey, n=3,800 respondents, Q4 2025, six countries; demand-side model with trade association cross-validation
Qualitative Methodology
47 expert interviews, Q4 2025; applied to validate demand model assumptions, identify emerging dynamics, and assess competitive positioning
Report Format
PDF and XLSX data workbook (Word format preview document)
Publisher
Market Minds Advisory
Report Code
MMA-2026-PAC-350
Published
August 2026
Contact
sales@marketmindsadvisory.com | www.marketmindsadvisory.com

Purchase the full Japan Industrial Electronics Packaging Market Report (2026 to 2036).

The full report sizes Japanese industrial electronics packaging across six packaging systems, five end-use industries, four shipment destinations, and seven destination regions, treating Japan as the single market geography throughout. Moisture sensitivity requirements are mapped by component class against dry pack specification and floor life, since that clock governs the whole category. Desiccant sizing is modelled against destination climate and transit duration across principal export routes. Competitive profiling covers twenty suppliers on Japanese electronics packaging revenue. Carrier tape dimensional capability is benchmarked against the smallest component classes in production.
Moisture sensitivity requirements mapped by component class
Desiccant sizing modelled against destination climate and transit
Carrier tape dimensional capability benchmarked by component class
Cleanroom qualification status and utilisation assessed by supplier
Shipment destination flows tracked across seven receiving regions
Reject cost quantified against packaging cost by failure mode

Built For The People Who Decide

From boardroom strategy to bench-side execution, this report is read cover-to-cover by leaders shaping the next decade of their industry, turning demand scenarios, market dynamics and valuation benchmarks into decisions.
CXOs/ Presidents/ VPs/ Managers
M&A and Corporate Development
Strategy Teams and R&D Heads
Procurement and Product Directors
Regulatory and Compliance Leaders
Investor Relations and Equity Analysts