Market Minds Advisory
Japan Defense Market

Japan Defense Market: Budget Arrived Before Capacity, Export Liberalisation and A Supplier Base That Left

A country doubling defence output using an industry built across seventy years never to export and never to scale, where roughly a hundred suppliers quietly left the sector because it did not pay.

Lead Analyst

Published

September 2026

Make Smarter Decisions with Customized Research Insights

Request a free sample report and evaluate market opportunities, growth trends, and competitive dynamics relevant to your business needs.

2025 MARKET VALUE$42.5BMarket Size 2025
2036 FORECAST VALUE$95.1BBase Case , 2026 to 2036
CAGR 2026 TO 20367.6 %Bull 8.8% / Bear 6.4%
INCREMENTAL OPPORTUNITY$49.4BNet 10- year value creation
EXPANSION MULTIPLE2.08x2036 value over 2026 base
Strategic Levers
M&A Pipeline
Regional Outlook
Country Rankings
Competitive Intelligence
Segmental Deep-dive
Call-Us : 91 93563 13602

Executive Snapshot and Market Trajectory

The money arrived before the capacity did. Japan committed to raising defence spending toward 2% of national output under a five-year buildup programme, and the constraint since has not been appropriation but an industrial base that spent decades being told it would never need to grow.
That base is unusual and its unusual features are now the problem. Defence sits as a modest division inside very large commercial companies, production lines are sized for annual orders of a few units, and roughly a hundred suppliers have withdrawn from defence work across two decades because margins near 8% did not justify the compliance burden. Allowable contractor profit was raised toward 15% specifically to stop that from happening any further at all.
Exports are the second change and the more consequential one. Transfer principles were revised during 2023, and an Australian frigate selection in August 2025 gave a Japanese prime the largest defence export in the country's postwar history. Space, cyber and electromagnetic capability grows fastest at 11.4%, because it is the one area where nothing had to be rebuilt first at all. Machine tools were never the constraint there.
Market Definition
Japanese Ministry of Defense spending on equipment procurement, research and development, and sustainment, awarded to domestic and foreign suppliers across all capability areas. Excludes personnel costs, provisions and allowances, base realignment payments to host communities, and host nation support for foreign forces stationed in Japan.
Base Year Value
$42.5B in 2025 (MMA Primary Research Dataset, August 2026)
Forecast Period
2026 to 2036, eleven discrete annual values
CAGR
7.6% base case. Bull 8.8%. Bear 6.4%.
Fastest Growth Segment
Space, Cyber and Electromagnetic Domains: 11.4% CAGR
Fastest Growth Country
Australia: 9.6% CAGR
Fastest Growth Region
South Asia and Pacific: 9.6% CAGR
Largest Region
East Asia: 86% of 2025 global value
Market Leaders
Mitsubishi Heavy Industries, Kawasaki Heavy Industries, Mitsubishi Electric, IHI Corporation and NEC Corporation lead on contract award value. Source: company annual reports and MMA Primary Research Dataset, July 2026.
Primary Survey
n=3,800 procurement and R&D decision-makers, Q4 2025, six countries
Methodology
Demand-side build-up, cross-validated against public data, 47 expert interviews

Japan Defense Market Forecast Scenarios

japan-defense-market-size-forecast-scenario-1787982875055
The 2020 to 2025 period contained the sharpest policy reversal in Japanese defence since the postwar settlement. Three security documents published in December 2022 committed roughly 43 trillion yen across five years and endorsed counterstrike capability that had been constitutionally contested for decades. Spending compounded near 6.4% across the period, with most of the acceleration concentrated in the final three years rather than spread evenly.
Three mechanisms carry the base case. The buildup programme runs through to its final year and successor planning is already assuming a higher baseline rather than a return to previous levels. Munitions stockpiling continues, because holdings measured against assessed wartime consumption remain well short and rebuilding them takes years. And export liberalisation converts domestic production runs into longer ones, which improves unit economics on programmes never viable at Japanese volumes alone.
The bull catalyst is further export success following the Australian frigate selection, since one reference customer changes how every other buyer assesses Japanese suppliers. The bear risk is capacity rather than budget: if production lines and the supplier base cannot expand fast enough, appropriated money goes unspent or flows to foreign suppliers, and the industrial policy behind it fails on its own terms.

Appropriation Was The Easy Part

Japanese defence industry was built for domestic requirements at low volume and never to sell abroad, producing companies with excellent engineering and lines sized for orders of a few units annually. That structure was rational under the constraints that created it. It is a problem when a government decides to roughly double procurement across five years and discovers the limiting factor is machine tools, floor space and people rather than money.
MARKET CONCENTRATION CR561%Share of contract value held by the largest suppliers
FOREIGN SOURCED SHARE38%Procurement value bought from suppliers outside the country
ALLOWABLE PROFIT RATE15%Maximum contractor margin permitted under the reformed rules
SUPPLIER EXIT COUNT100Companies withdrawn from defence work over two decades
MUNITIONS STOCK COVERAGE62%Holdings measured against the assessed wartime consumption requirement
PROGRAMME AWARD CYCLE27 monthsElapsed period from requirement approval to contract signature
The supplier base beneath the primes deteriorated quietly for twenty years. Around a hundred companies withdrew from defence work, not through any dramatic decision but because allowable margins near 8% did not compensate for the documentation, audit and single-customer risk that defence contracting carries. Raising the permitted profit rate toward 15% was an explicit attempt to reverse that, and reversing an exit is slower than causing one.
Foreign purchase fills the gap where domestic capacity cannot. Roughly 38% of procurement value goes to suppliers outside Japan, concentrated in areas where capability was needed immediately rather than eventually: standoff missiles, fifth generation aircraft and integrated air defence. That share is politically uncomfortable and operationally necessary, and it will fall only as fast as domestic production capacity is actually built.
"Tokyo solved the budget problem in a single December and then discovered the harder one. You cannot appropriate a supply chain, and the companies that left this sector did so for reasons that took twenty years to accumulate."
Director, Asia Pacific Defence Programmes Practice · MMA Aerospace and Defence Programmes Practice · August 2026

Market Trends

Export Liberalisation Changes Domestic Programme Economics

Revised transfer principles adopted during 2023 allowed categories of equipment export that had been prohibited for decades, and an Australian frigate selection in August 2025 converted that policy change into the largest defence export in Japan's postwar history. The commercial consequence matters more than the symbolism. A production run sized for a domestic order of a few hulls becomes viable at considerably better unit cost when a second customer joins it, and programmes previously rejected as uneconomic at Japanese volumes alone start to work. That change is larger than it looks from outside.
Market Impact: Commits 43 trillion yen programme

Contractor Margins Raised To Reverse Supplier Withdrawal

Allowable profit on defence contracts was raised toward 15% from levels near 8%, under legislation intended explicitly to keep suppliers in the sector rather than to reward the primes. The reasoning is that a component maker with a profitable commercial business had no reason to accept defence documentation, audit and single-customer exposure for a thinner margin. Whether the change reverses two decades of exits remains genuinely uncertain, since re-entering requires requalification, tooling and people that departing firms disposed of years ago. Tooling, people and qualification all had to be disposed of before they could be missed.
Market Impact: Covers 62% of assessed requirement

Market Opportunities and Growth Drivers

Buildup Programme Commits Spending Across Five Years

The defence buildup programme published in December 2022 committed roughly 43 trillion yen across five fiscal years, which converted procurement from an annual budget argument into a planned trajectory suppliers could invest against. That distinction matters more to industrial capacity than the total does, because a company will not install production capability against a single year's order. Successor planning already assumes a higher baseline rather than reversion. Suppliers are finally building capacity rather than merely bidding for work. A planned trajectory buys industrial capacity that an annual appropriation never could have done.
Market Impact: Delays 27 months to award

Munitions Stockpiling Rebuilds Holdings From Well Below Requirement

Assessed wartime consumption requirements exceed current holdings substantially, with coverage near 62%, and the shortfall covers guided munitions, artillery ammunition and the storage facilities to hold them. Closing it requires sustained production over years rather than a single large order, because propellant, energetics and precision component capacity all constrain output independently. Depot construction runs alongside. This is unglamorous procurement that attracts little attention and generates steady multi-year revenue for suppliers positioned to take it. Nobody ever writes about ammunition depots, and the revenue arrives every single year regardless of that.
Market Impact: Competes against 8% legacy margins

Market Restraints and Challenges

Production Capacity Cannot Expand At Appropriation Speed

Machine tools, qualified floor space and skilled technicians all take years to add, and the buildup programme assumed capacity that did not exist when it was written. The root cause is decades of production lines sized deliberately for low annual volumes because no export market was permitted. Money appropriated against capacity that cannot be built either goes unspent or flows to foreign suppliers instead. Mitigation runs through multi-year contracts that justify capital investment, government-funded tooling, and second-sourcing arrangements with commercial manufacturers entering defence work. Capacity is measured in years, not in budget lines.
Market Impact: Adds 11 hulls to production

Defence Sits Inside Companies With Better Alternatives

Japanese defence primes run defence as a modest division within very large commercial engineering groups, so defence competes internally for capital against businesses that are frequently more profitable and considerably less regulated. The root cause is that no company in Japan depends on defence for survival. Boards therefore allocate carefully rather than enthusiastically. Mitigation has run through raising allowable margins toward 15%, longer contract terms that improve return on invested capital, and export permission that widens the addressable market beyond one customer. Enthusiasm is not something a board allocates capital against.
Market Impact: Raises allowable margin to 15%
3 additional market trends, 4 additional growth drivers, and 2 additional restraints and challenges are covered in the full report. Contact sales@marketmindsadvisory.com to access the complete intelligence.

Segment CAGR and Growth Architecture

Segmentation follows capability area, since that determines which suppliers compete, whether domestic capacity exists and how much of the requirement must be bought abroad. Six capability areas describe the market completely, from standoff strike where capability was needed immediately through to the sustainment and munitions work that quietly absorbs a growing share of every budget.
japan-defense-market-market-share-analysis-1787982875649

Space, Cyber and Electromagnetic Domains

The fastest capability area grows at 11.4%, half again the market rate of 7.6%, and it grows fastest partly because nothing had to be rebuilt before it could start. Space situational awareness, satellite communications, cyber defence force expansion and electromagnetic spectrum capability all draw on Japanese commercial technology strength rather than on defence production lines that were deliberately sized small. Suppliers here include electronics and information technology companies with no heritage in traditional defence manufacture. Procurement cycles are shorter, capital intensity is lower, and the constraint is cleared personnel rather than machine tools, which is a considerably easier constraint to solve quickly. Commercial technology companies can enter here, and several already have done.
CAGR 11.4%

Standoff Strike and Missiles

Standoff strike grows at 10.2% and represents the sharpest policy break in the entire buildup. Counterstrike capability was constitutionally contested for decades and is now funded, covering foreign missile purchases delivered from the middle of this decade alongside upgraded domestic surface-to-ship missiles with extended range. The domestic and foreign elements serve different purposes: purchase delivers capability quickly while domestic development builds an industrial position that lasts. Production capacity for energetics, propellant and precision guidance components constrains the domestic path independently of funding, and closing those constraints is measured in years rather than in budget cycles. Purchase delivers capability now and domestic development delivers a position later, and Japan is deliberately funding both at once.
CAGR 10.2%
Full segment breakdown across 6 segments available in the complete report.

Regional Architecture and Country Demand Map

This is a Japanese market and effectively all spending is appropriated and awarded domestically. Other regions appear as suppliers of equipment Japan buys, as co-development partners, and now as export customers, none of which represent Ministry of Defense spending counted anywhere within this scope at all.

North America

Share sits below the standard band because this report measures Japanese Ministry of Defense spending, though the American connection is by far the strongest of any non-domestic region. Roughly 38% of procurement value goes abroad and the overwhelming majority of that reaches American suppliers, covering fifth generation aircraft, standoff missiles, integrated air defence and the interceptors underpinning it. Interoperability requirements shape Japanese architectural choices well beyond what is purchased. Licensed production arrangements also transfer manufacturing work into Japan under American designs, which counts domestically while depending on foreign intellectual property. No amount of domestic content preference changes that dependency quickly, and every buildup document acknowledges it while committing to reduce it.
Share: 6% | CAGR: 7.0% (2026 to 2036)

Western Europe

Share falls below the standard band on the same definitional basis, but the relationship changed fundamentally with the combat air programme agreed with the United Kingdom and Italy. That arrangement gives Japan an equal partnership in a next generation aircraft rather than a licensed production role, which is a position it has never previously held with any European partner. European suppliers also compete in areas where American alternatives are politically or commercially awkward. The programme's significance sits in what it teaches Japanese industry about international co-development rather than in the procurement value alone. Learning how to co-develop as an equal partner is worth more to Japanese industry than the aircraft itself will be.
Share: 3% | CAGR: 6.2% (2026 to 2036)
Regional intelligence for 5 additional markets available in the complete report: East Asia, South Asia and Pacific, Latin America, Middle East and Africa, Eastern Europe. Contact sales@marketmindsadvisory.com.
japan-defense-market-country-cagr-analysis-1787982876172

Where Japanese Defence Margin Now Sits

Four levers here work on capacity, export access and contract structure rather than on technology, which Japanese suppliers already hold in considerable depth. Multi-year capacity commitment, export programme participation, munitions position building and commercial technology entry each address something a supplier controls under the reformed procurement rules. Technology is not the constraint anywhere here.

Commit Capacity Against Multi-Year Contracts Not Annual Orders

Production lines sized for a few units annually cannot absorb a doubled procurement budget, and no board will install capacity against a single year of orders. Multi-year contracting under the buildup programme changes that calculation, and suppliers committing capital early capture 20% to 30% more of the available work than those waiting for demand to prove itself. The reformed profit rules improve return on invested capital enough to justify it. Suppliers still treating defence as an annual bidding exercise will find the capacity question settled by competitors. The question settles itself either way.
Market Impact: Captures around 25% more of the available work

Join Export Programmes To Extend Domestic Production Runs

A programme sized for a domestic order alone carries fixed development and tooling cost across very few units, which is why several Japanese capabilities were rejected historically as uneconomic. Export permission changes the arithmetic directly: an Australian frigate selection roughly doubles the production run behind a single design and improves unit cost by an estimated 18% to 24%. Suppliers positioned on exportable programmes benefit whether or not they lead them. Those confined to domestic-only capability carry the old economics indefinitely and cannot escape them. That arithmetic was never available before 2023.
Market Impact: Improves the programme unit cost by around 21%

Take Munitions Work Nobody Finds Interesting

Munitions holdings sit near 62% of assessed wartime requirement, and closing that gap needs sustained production across years rather than a single large order. Propellant, energetics, precision components and depot construction all constrain output independently, so the work is distributed widely and attracts limited competition because it is unglamorous. Margins under the reformed rules are comparable to platform work with considerably lower programme risk. Suppliers chasing headline platforms consistently overlook a revenue stream that runs steadily for a decade at least. Steady revenue for a decade is worth more than a headline.
Market Impact: Closes part of a 38% munitions coverage gap

Enter Through Space Cyber And Electromagnetic Domains

Space, cyber and electromagnetic capability grows at 11.4% against a market rate of 7.6%, and it draws on Japanese commercial electronics and software strength rather than on defence production lines that were deliberately kept small. Capital intensity is low, procurement cycles run roughly 40% shorter than platform programmes, and the binding constraint is cleared personnel rather than machine tools. This is the only realistic entry route for a commercial technology company with no defence heritage, and several have already used it successfully. Cleared people can be recruited considerably faster than machine tools arrive.
Market Impact: Cuts the procurement cycle by around 40% overall

Who Controls the Margin Pool

Concentration is high at around 61% across the five largest suppliers, and it reflects an industrial structure rather than any competitive outcome. The five each run defence as one division inside a large commercial group, which shapes how much capacity any will commit. Foreign primes hold substantial positions in aircraft, missiles and air defence where domestic capability could not deliver on the required timescale.
Competition runs on three dimensions. Installed capacity is first and now decisive, since a supplier that cannot produce at rate loses work regardless of merit. Export eligibility is the second, because a programme with an overseas customer carries unit economics a domestic-only one cannot match. Commercial technology depth is third, favouring electronics and software companies entering through space and cyber.

Pressure arrives from two unfamiliar directions. Commercial technology companies with no defence heritage are winning space and cyber work primes assumed was theirs. Meanwhile foreign suppliers hold roughly 38% of procurement value and will keep it wherever domestic capacity remains short. Rankings shift against suppliers that neither expand capacity nor secure export participation, since both decide whether a programme is worth having.
japan-defense-market-company-positioning-matrix-1787982876694

Competitive Moat and Risk Dimensions

MITSUBISHI HEAVY INDUSTRIES

Moat: Platform breadth and export position

Mitsubishi Heavy Industries builds across naval vessels, missiles, armoured vehicles and aircraft, holding the widest platform position of any Japanese supplier. The Australian frigate selection during 2025 gave it the country's first major export reference, which changes how subsequent international buyers assess it. Assembling comparable breadth would take decades of awards nobody has.
MITSUBISHI HEAVY INDUSTRIES

Risk: Capacity against doubled demand

Production lines sized across decades for low annual volumes now face a procurement budget roughly twice their design assumption, plus export commitments on top. Adding machine tools, qualified floor space and skilled technicians takes years that the buildup schedule does not allow. Capacity rather than capability is now the binding constraint, and capital competes internally against more profitable divisions.
MITSUBISHI ELECTRIC

Moat: Radar sensors and missile electronics

Mitsubishi Electric holds established positions in radar, missile seekers, satellite systems and defence electronics, drawing on commercial semiconductor and electronics capability that scales far more readily than heavy manufacturing does. That gives it strong exposure to the space, cyber and electromagnetic areas growing fastest in this market. Capital intensity per unit of revenue is far lower than platform builders carry.
MITSUBISHI ELECTRIC

Risk: Competition from commercial entrants

The low capital intensity that advantages this business also lowers barriers for commercial electronics and software companies entering defence through the same space and cyber route, and several have done so successfully. Defence heritage matters less in these areas than in platform work. Competing on delivery cadence against companies with no legacy obligations is unfamiliar.

Players Tracked

Prominent Players

Mitsubishi Heavy Industries
Kawasaki Heavy Industries
Mitsubishi Electric
IHI Corporation
NEC Corporation

Other Key Players

Toshiba Infrastructure Systems
Fujitsu
Subaru Corporation
ShinMaywa Industries
Japan Steel Works
Daikin Industries
Komatsu
Japan Marine United
Sumitomo Heavy Industries
Hitachi
Lockheed Martin
RTX
Boeing Defense Space and Security
BAE Systems
Leonardo

Recent Developments

DECEMBER 2023

Equipment transfer principles revised to permit wider export

Japan revised its principles governing defence equipment transfer, permitting export of certain licence-produced items and widening the categories of equipment eligible for overseas sale. This was a policy revision by the government rather than any commercial transaction, and it changed the addressable market for domestic production programmes.
Signal: Programme economics that never worked at domestic volumes alone became viable once a second customer was permitted.
JUNE 2023

Industrial base legislation raised allowable contractor margins

Legislation strengthening defence production and technology bases raised permitted contractor profit rates toward 15% from levels near 8%, alongside provisions for government investment in production facilities. This was national legislation rather than any commercial agreement, and it responded directly to two decades of supplier withdrawal from the sector.
Signal: Margin was identified as the reason suppliers left, and raising it is slower to work than lowering it was.
AUGUST 2025

Australia selected a Japanese frigate design for its future fleet

Australia selected an upgraded Japanese frigate design for its general purpose frigate programme, the largest defence export in Japan's postwar history. This was a competitive selection decision by a foreign government rather than any merger, acquisition or joint venture between any of the shipbuilders involved.
Signal: A first major export reference changes how every subsequent international buyer assesses a Japanese supplier entirely.

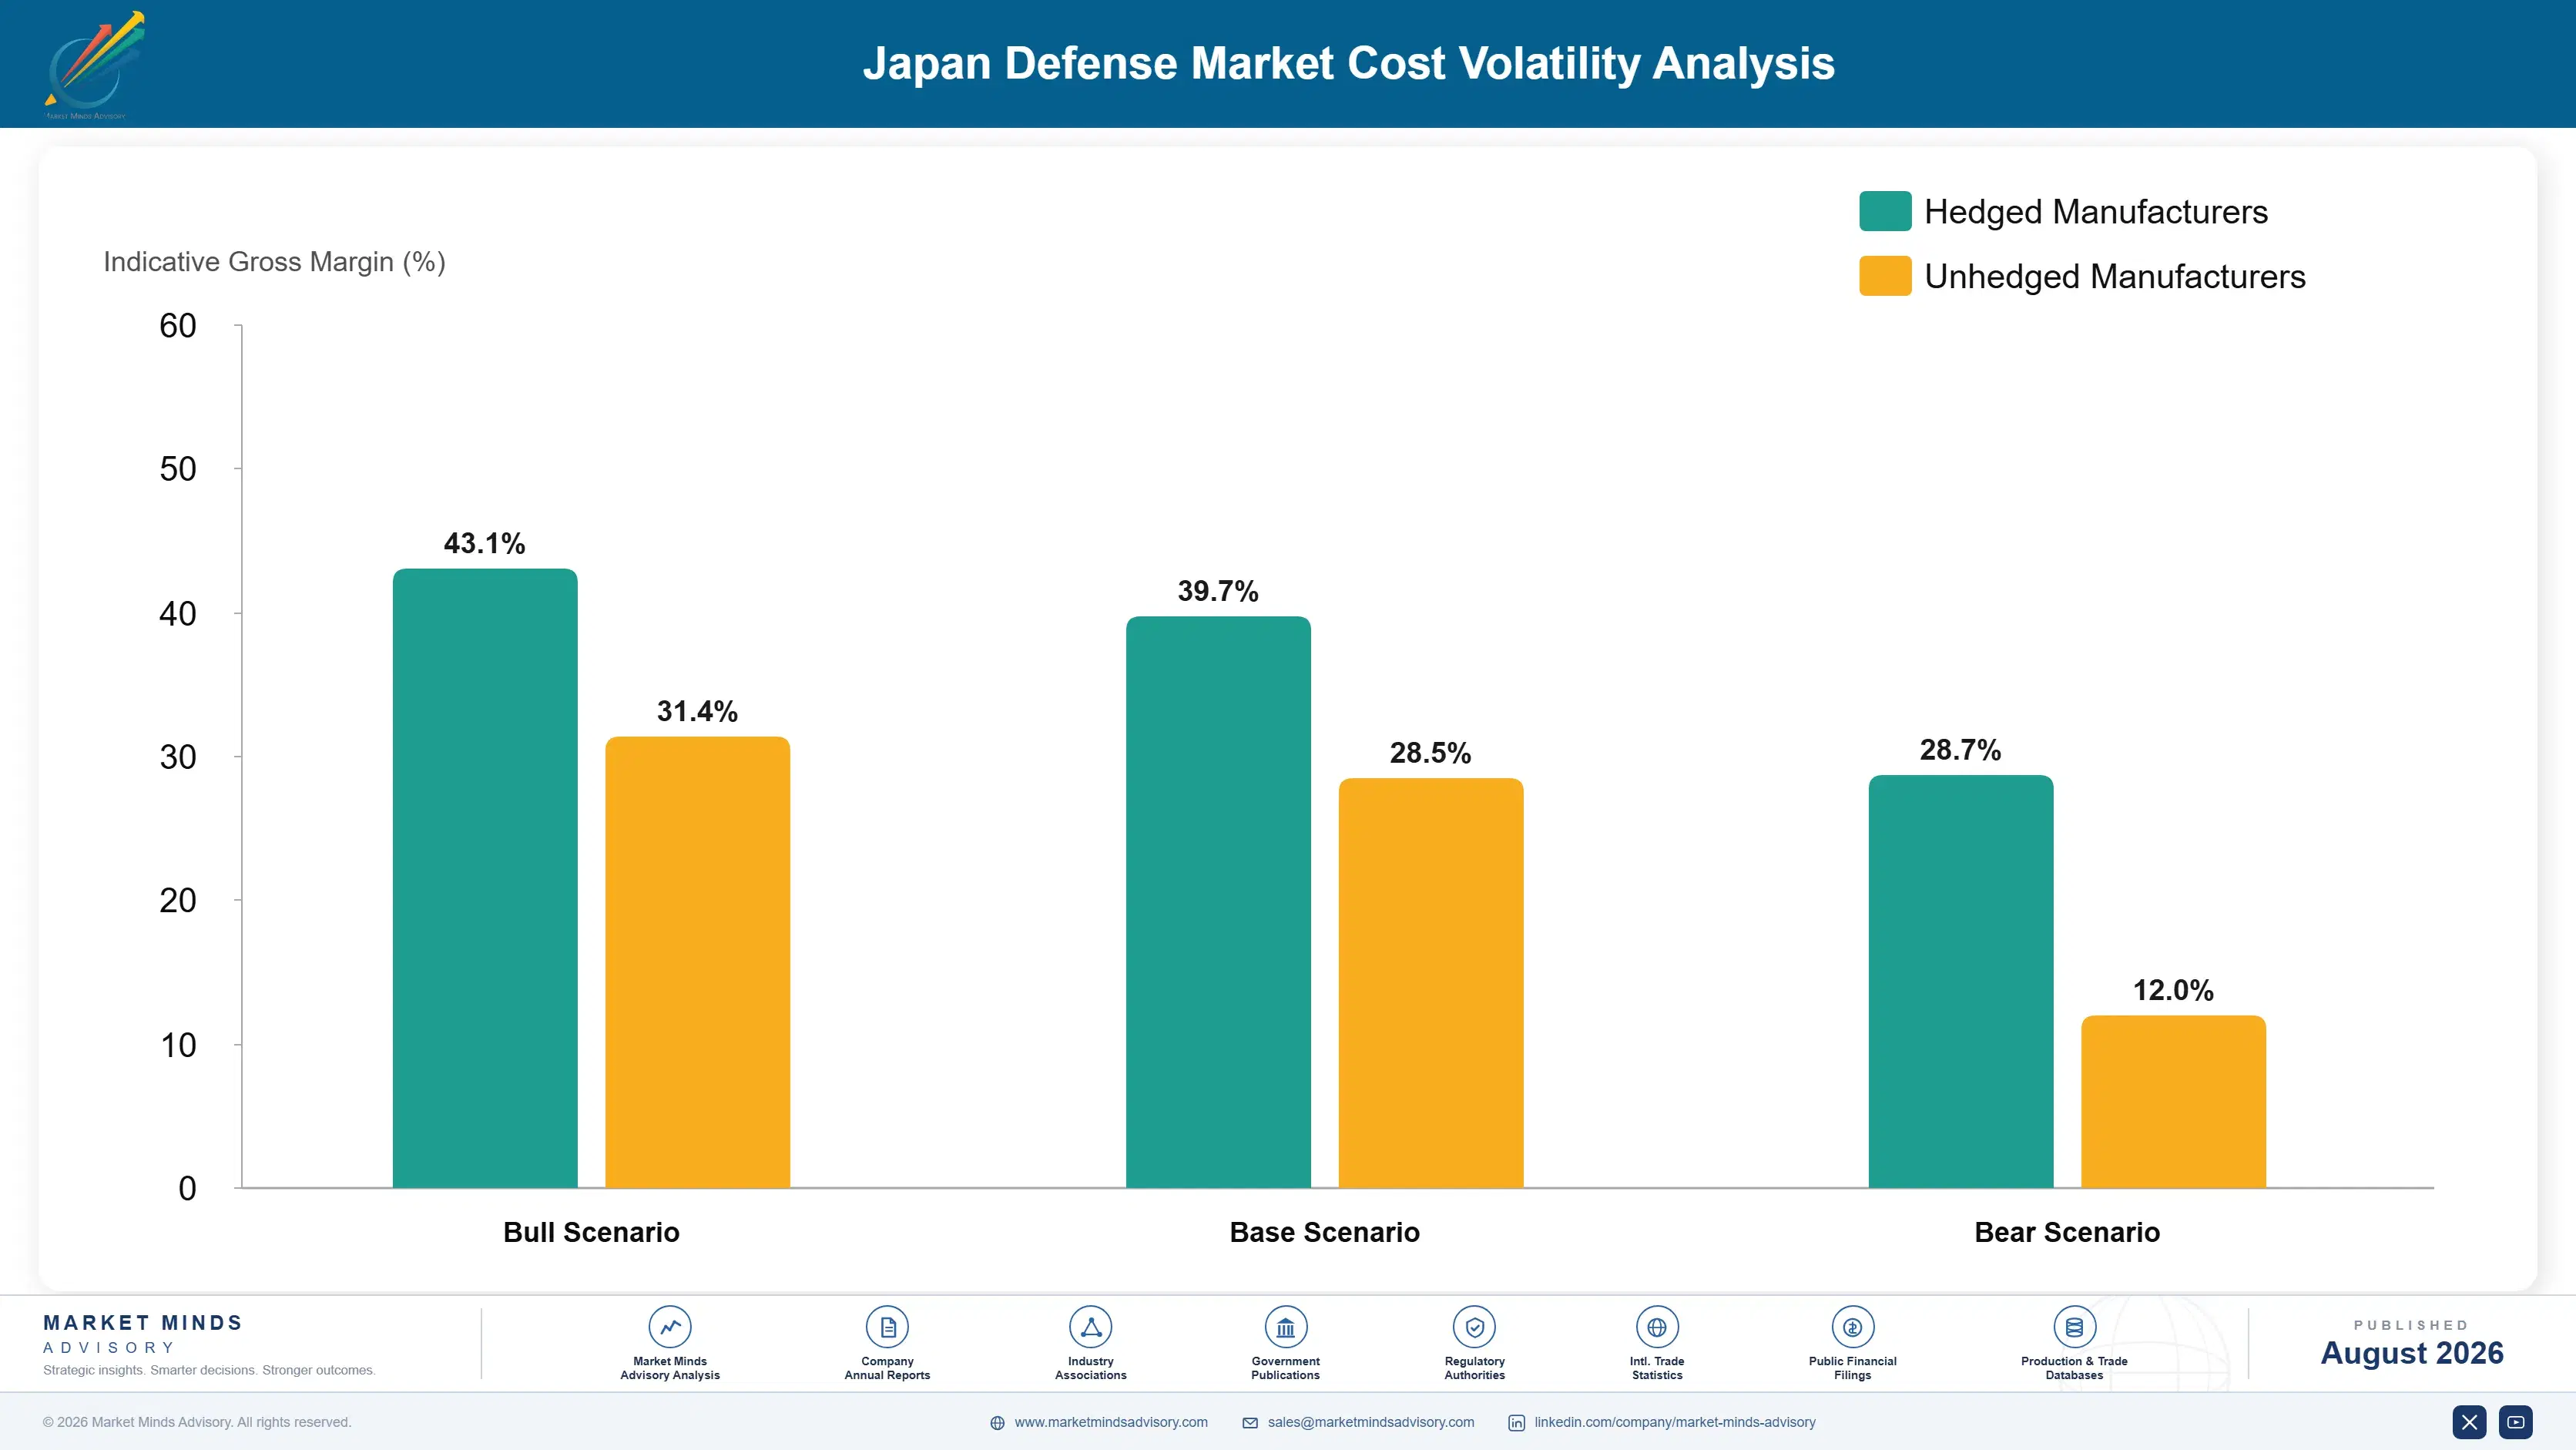
What Japanese Defence Production Costs

Programme cost divides into four components behaving very differently under expansion. Materials and purchased components absorb roughly 39% of production cost and depend on a supplier base that shrank for twenty years. Manufacturing labour and facility cost run near 27%, engineering and development near 22%, and compliance with audit and documentation obligations accounts for the remaining 12% across a typical domestic programme.
Currency movement demonstrated how exposed the foreign-sourced portion is. Yen weakness through 2022 and 2024 raised the domestic cost of the roughly 38% of procurement value bought abroad, without any change in the equipment or the quantities ordered. Mitsubishi Heavy Industries and Kawasaki Heavy Industries both discussed input cost and exchange rate pressure across those periods in their annual reporting. Budget appropriated in yen bought materially less capability than the planning assumed it would.

Exposure varies sharply by where a supplier sits in the structure. Primes carry currency risk on imported content and capacity risk on domestic production simultaneously. Component suppliers carry documentation and audit obligations that were the stated reason a hundred firms left the sector. Foreign suppliers carry none of the Japanese capacity constraint and political exposure to the domestic content preference every buildup document expresses.
japan-defense-market-cost-volatility-analysis-1787982876896

Multi-year contracts justifying capital investment

A production line cannot be expanded against a single year of orders, so multi-year contracting under the buildup programme is the mechanism that makes capacity investment financeable at all. Suppliers committing early capture disproportionate work. Those waiting for demand to prove itself find the capacity question already settled by whoever happened to move first.

Government funded tooling for constrained production

Industrial base legislation provides for public investment in production facilities where private capital will not move quickly enough, particularly for munitions, energetics and precision components. That removes the return on capital objection a commercial board would otherwise raise. The mechanism is new enough that its practical effectiveness remains genuinely untested at any real scale.

Export participation spreading fixed development cost

Development and tooling cost carried across a domestic order of a few units produces unit prices that no competitive export market would accept. Adding an overseas customer spreads that cost meaningfully, improving unit economics by a fifth or more. The Australian frigate selection is the first demonstration at scale, and its effect on programme economics will be visible for years.

Portfolio Architecture for Margin Defence

The portfolio separates by whether domestic capacity exists at the rate required. Sustainment, munitions and ground systems form the volume layer: unglamorous, steady, distributed across many suppliers, and constrained by propellant and precision component capacity rather than by anything technical. Margins under the reformed rules are comparable to platform work at considerably lower programme risk, which very few suppliers seem to have noticed properly.
Platform programmes across naval, air and air defence carry the bulk of contract value and the sharpest capacity constraint. These are the programmes the buildup was written around, and they depend on production lines designed for a fraction of the required rate. Export participation is what changes their economics, since a domestic order alone spreads development and tooling cost across too few units to compete internationally on price at any point.

The best returns sit in space, cyber and electromagnetic work, where capital intensity is low and the constraint is cleared people rather than machine tools. That is also where commercial technology companies without defence heritage can enter, which makes it the most contested area in the market despite being the newest one.

Volume / Commodity-Adjacent

Sustainment, munitions production, depot work and ground systems distributed across many suppliers. Range spans five points because reformed profit rules apply unevenly depending on when a contract was awarded and under which framework.
Gross Margin: 6-11%

Premium / Certified

Naval vessels, aircraft, integrated air defence and major platform programmes. Range spans six points because export participation changes unit economics substantially on otherwise comparable domestic production programmes across the board.
Gross Margin: 9-15%

Sustainability / Regulatory / Next-Generation

Space, cyber, electromagnetic and standoff strike capability. Range spans seven points because capital intensity differs enormously between software-led work and the energetics production that standoff capability actually requires behind it.
Gross Margin: 12-19%
japan-defense-market-portfolio-architecture-1787982877395

High-value Sub-segments and Strategic Watch-out

Space, Cyber and Electromagnetic Domains

High value and high growth at 11.4%, drawing on commercial electronics strength rather than defence production lines. The six point range separates software-led work from the harder engineering, and commercial entrants compete here directly. Cleared personnel rather than machine tools are the binding constraint here.
Gross Margin: 13-19%

Standoff Strike and Missiles

High value with moderate growth at 10.2%, representing the sharpest policy break in the entire buildup programme. The five point range reflects the gap between foreign purchase pass-through and genuine domestic development with energetics capacity behind it. Both of those paths are being funded at once.
Gross Margin: 11-16%

Maritime Systems and Shipbuilding

The volume core of contract value and the area where export participation now changes the economics most. The Australian selection roughly doubles a production run that was previously sized for a domestic order alone. Nothing else in this whole market has changed quite that quickly.
Gross Margin: 9-14%

Legacy Ground Systems Sustainment

The strategic watch-out rather than a growth pool. Several suppliers withdrew from armoured vehicle and small arms work entirely across the past two decades, leaving sustainment obligations against a supplier base that no longer manufactures. Sustaining equipment that nobody still manufactures is a genuine problem.
Gross Margin: Variable

Why Programmes Never Change Hands

Japanese defence programmes produce annuity economics through supplier continuity rather than through any contractual mechanism. A company that built a platform sustains it for thirty years, supplies the upgrades, and is the only realistic bidder for the successor because nobody else holds the drawings, the tooling or the cleared engineers. Procurement is competitive on paper and continuous in practice, which suits both parties and produces predictable revenue for whoever won the original award.
Depth varies by capability area rather than by customer service. Naval and aircraft programmes are effectively permanent, since the industrial base for each contains one or two credible suppliers and switching would mean rebuilding capability the country does not have spare. Munitions and sustainment work distributes more widely. Space and cyber capability changes hands most readily, because commercial entrants can compete without the heritage that platform work demands.

The customer itself is changing in a way suppliers have not fully absorbed. A ministry accustomed to buying small quantities from established partners is now buying at twice the rate, with export obligations attached and foreign co-development partners involved. That requires commercial behaviour Japanese defence divisions have never needed, and those adapting fastest have substantial commercial businesses alongside.
japan-defense-market-end-use-penetration-index-1787982877882

Where Japanese Suppliers Should Commit

These are among the four positions where our research anticipates prominent divergence between winners and laggards over the coming forecast period. Each is grounded in the demand model, the regulatory perimeter, and the announced capacity pipeline.
01 / PRODUCTION CAPACITY COMMITMENT

Install capacity now or lose the programme entirely

Production lines sized across decades for a few units annually cannot absorb a procurement budget roughly twice their design assumption, and no board installs capacity against a single year of orders. Multi-year contracting under the buildup programme changes that calculation directly, and suppliers committing capital early capture 20% to 30% more of the available work than those waiting for demand to prove itself first. Reformed profit rules improve return on invested capital enough to justify making that commitment right now.
02 / EXPORT PROGRAMME PARTICIPATION

One overseas customer fixes the unit economics

A programme sized for a domestic order alone spreads development and tooling cost across too few units to compete internationally, which is precisely why several Japanese capabilities were historically rejected as uneconomic. Export permission changes that arithmetic, and the Australian frigate selection roughly doubles a production run while improving unit cost by an estimated 18% to 24%. Suppliers positioned on exportable programmes benefit whether or not they lead them, and those confined to domestic-only work carry the old economics permanently.
03 / MUNITIONS POSITION BUILDING

The unglamorous work runs steadily for a decade

Munitions holdings sit near just 62% of the assessed wartime requirement, and closing that gap needs sustained production across many years rather than any single large order anybody could win. Propellant, energetics, precision components and depot construction all constrain output quite independently, so the work distributes widely and attracts limited competition, largely because nobody finds it interesting. Margins under reformed rules match platform work at considerably lower programme risk, which surprisingly few suppliers appear to have noticed properly at all.
04 / COMMERCIAL DOMAIN ENTRY

Space and cyber need people, not machine tools

Space, cyber and electromagnetic capability grows at 11.4%, half again the market rate of 7.6%, drawing on Japanese commercial electronics and software strength instead rather than defence production lines deliberately kept small for decades. Capital intensity is low, procurement cycles run roughly 40% shorter than platform programmes, and the binding constraint is cleared personnel rather than machine tools or floor space. This is the only realistic entry route for a commercial technology company that holds no defence heritage at all.

Engagement Snapshot From the Field

A live engagement with an industry participant carrying material or product regulatory and market exposure ahead of a defining policy shift, showing how our research translates into a defensible multi-year portfolio strategy.
MARKET MINDS ADVISORY · CLIENT ENGAGEMENT SUMMARY
Japan Defense Producer Strategic Portfolio Review and Transition Roadmap 2026·Investment Scenario on Japan Defense Exposure Evaluation 2025-26
CLIENT PROFILE
The defence division of a large Japanese industrial group, supplying subsystems and components across naval, aircraft and ground programmes, representing a modest share of group revenue and competing internally for capital against more profitable commercial businesses. Order intake had risen sharply following the buildup programme while the division declined to expand capacity, on the reasoning that the demand might not persist beyond the five-year plan.
STRATEGIC CHALLENGE
The board needed to decide whether to commit capital to production capacity against a programme that ran only to its final year, knowing that competitors were making the opposite choice. It also had no view on export participation, having never sold defence equipment abroad and having no assessment of whether its subsystems were eligible under the revised transfer principles adopted during 2023.
MMA APPROACH
MMA modelled return on invested capital for capacity expansion under the reformed profit rules across several demand scenarios, including successor programme continuation at a lower baseline. Expert interviews with ministry acquisition staff, prime contractors and export control authorities established what multi-year contracting was actually obtainable and which of the division's products fell within the revised transfer categories.
KEY FINDINGS
  1. Return on invested capital for capacity expansion exceeded the group hurdle rate under every scenario tested, including one assuming procurement fell 30% after the buildup programme ended.
  2. Two competitors had already committed capacity and secured multi-year contracts covering the majority of forecast demand in one of the division's three main product areas.
  3. Four of the division's product lines were eligible for export under the revised principles, and no assessment had ever been undertaken because the possibility had not previously existed.
  4. Compliance and audit cost consumed 14% of divisional cost, above the market pattern near 12%, because processes had never been rationalised after margin reform changed the economics.
CLIENT PROFILE
The defence division of a large Japanese industrial group, supplying subsystems and components across naval, aircraft and ground programmes, representing a modest share of group revenue and competing internally for capital against more profitable commercial businesses. Order intake had risen sharply following the buildup programme while the division declined to expand capacity, on the reasoning that the demand might not persist beyond the five-year plan.
STRATEGIC CHALLENGE
The board needed to decide whether to commit capital to production capacity against a programme that ran only to its final year, knowing that competitors were making the opposite choice. It also had no view on export participation, having never sold defence equipment abroad and having no assessment of whether its subsystems were eligible under the revised transfer principles adopted during 2023.
MMA APPROACH
MMA modelled return on invested capital for capacity expansion under the reformed profit rules across several demand scenarios, including successor programme continuation at a lower baseline. Expert interviews with ministry acquisition staff, prime contractors and export control authorities established what multi-year contracting was actually obtainable and which of the division's products fell within the revised transfer categories.
KEY FINDINGS
  1. Return on invested capital for capacity expansion exceeded the group hurdle rate under every scenario tested, including one assuming procurement fell 30% after the buildup programme ended.
  2. Two competitors had already committed capacity and secured multi-year contracts covering the majority of forecast demand in one of the division's three main product areas.
  3. Four of the division's product lines were eligible for export under the revised principles, and no assessment had ever been undertaken because the possibility had not previously existed.
  4. Compliance and audit cost consumed 14% of divisional cost, above the market pattern near 12%, because processes had never been rationalised after margin reform changed the economics.
RECOMMENDED STRATEGY
Phase 1: Phase one: commit capacity investment in the two product areas where multi-year contracting remains available, before competitors secure the remaining forecast demand. Phase 2: Phase two: complete export eligibility assessment across all product lines and approach primes participating in exportable programmes as a qualified subsystem supplier. Phase 3: Phase three: rationalise compliance and audit processes against the reformed margin rules rather than continuing arrangements designed for the previous framework.
OUTCOME
The client reported securing multi-year contracts covering 61% of forecast demand in one product area within four quarters (client-reported, unverified by MMA), having previously held annual awards only. Export eligibility was confirmed for three product lines. Compliance cost fell to 11% of divisional cost after process rationalisation was completed.

Frequently Asked Questions

Foundational context covering the market sizes, CAGR, scope, country, region and competition that inform every finding below. This section is provided to cover basics and most often pre-purchase conversations, answered from the MMA Primary Research Dataset.

What is the current size of the Japan Defense Market?

The market is valued at USD 42.5 billion in 2025, measured as Ministry of Defense spending on equipment procurement, research and development, and sustainment awarded to domestic and foreign suppliers.

How large will the Japan Defense Market be by 2036?

MMA forecasts USD 95.12 billion by 2036, up from USD 45.73 billion in 2026. That represents incremental spending of USD 49.39 billion and an expansion multiple of 2.08 times.

What is the CAGR for the Japan Defense Market 2026 to 2036?

The base case CAGR is 7.6%, with a bull case of 8.8% and a bear case of 6.4%. The buildup programme and munitions stockpiling supply most of that growth.

Which segment is growing fastest?

Space, cyber and electromagnetic domains grow at 11.4%, half again the market rate of 7.6%. Nothing there had to be rebuilt before spending could actually begin.

Who are the major companies in the Japan Defense Market?

Mitsubishi Heavy Industries, Kawasaki Heavy Industries, Mitsubishi Electric, IHI Corporation and NEC Corporation lead on contract award value, holding around 61% of the total between them.

Which country is growing fastest?

Australia grows fastest at 9.6%, reflecting its 2025 selection of a Japanese frigate design, the largest defence export in Japan's postwar history by a wide margin.

Report Segmentation Architecture

The full report scope spans multiple orthogonal segmentation dimensions, with cross-tabulated demand data provided for each dimension pair. Coverage extends further to regional breakdowns, trend trajectories, and the competitive detail needed to support segment-level decision-making.

By Capability Area

  • Standoff Strike and Missiles
  • Integrated Air and Missile Defence
  • Maritime Systems and Shipbuilding
  • Aircraft and Air Systems
  • Space, Cyber and Electromagnetic Domains
  • Sustainment and Munitions Stockpiling

By End-Use Industry

  • Ground Self-Defense Force
  • Maritime Self-Defense Force
  • Air Self-Defense Force
  • Joint and Space Commands
  • Cyber Defence Command
  • Coast Guard and Civil Agencies

By Commercial Dimension

  • Domestic Prime Contracting
  • Licensed Production
  • Foreign Military Sales
  • International Co-Development
  • Component and Subsystem Supply
  • Sustainment and Depot Service

By Region

  • North America
  • Western Europe
  • East Asia
  • South Asia and Pacific
  • Latin America
  • Middle East and Africa
  • Eastern Europe

Scope, Methodology, and Coverage

Every figure in this report is reproducible from documented input assumptions. The scope below maps the historical period, the forecast horizon, the segmentation dimensions, and the countries covered, alongside the underlying primary and qualitative methodology.
Historical Period
2020 to 2025
Forecast Period
2026 to 2036
Base Year
2025 (USD billions; MMA Primary Research Dataset, August 2026)
Market Definition
Japanese Ministry of Defense spending on equipment procurement, research and development, and sustainment, spanning standoff strike and missiles, integrated air and missile defence, maritime systems and shipbuilding, aircraft and air systems, space, cyber and electromagnetic domains, and sustainment with munitions stockpiling. Awards to domestic primes, licensed production, foreign military sales and international co-development are all included. Personnel costs, provisions and allowances, base realignment payments to host communities, and host nation support for foreign forces stationed in Japan are excluded.
Quantitative Units
USD billions, contract award value
Segmentation Dimensions
Capability area, end-use service branch, commercial contracting dimension, region
Regions Covered
North America, Western Europe, East Asia, South Asia and Pacific, Latin America, Middle East and Africa, Eastern Europe
Countries Covered
Japan, with supplier and co-development exposure across the United States, United Kingdom, Italy and Australia
Key Companies Profiled
Mitsubishi Heavy Industries, Kawasaki Heavy Industries, Mitsubishi Electric, IHI Corporation, NEC Corporation, Subaru Corporation, Japan Marine United, Lockheed Martin, RTX, BAE Systems
Quantitative Methodology
Primary survey, n=3,800 respondents, Q4 2025, six countries; demand-side model with trade association cross-validation
Qualitative Methodology
47 expert interviews, Q4 2025; applied to validate demand model assumptions, identify emerging dynamics, and assess competitive positioning
Report Format
PDF and XLSX data workbook (Word format preview document)
Publisher
Market Minds Advisory
Report Code
MMA-2026-CON-211
Published
August 2026
Contact
sales@marketmindsadvisory.com | www.marketmindsadvisory.com

Purchase the full Japan Defense Market Report (2026 to 2036).

The full report treats Japanese defence as a capacity problem rather than a budget one, and shows where the constraint actually binds. It quantifies the gap between appropriated spending and installed production capability, traces two decades of supplier withdrawal against the margin reform intended to reverse it, and models what export participation does to unit economics on domestically sized production runs. Segment analysis covers all six capability areas, with particular attention to space and cyber work as the only route open to commercial technology entrants. Competitive assessment ranks twenty suppliers on contract award value across domestic and foreign participants.
Six capability area segmentation with growth rates
Appropriated spending against installed production capacity
Twenty supplier assessment on contract award value
Supplier withdrawal traced against margin reform
Export participation impact on unit economics modelled
Munitions coverage gap by category and constraint

Built For The People Who Decide

From boardroom strategy to bench-side execution, this report is read cover-to-cover by leaders shaping the next decade of their industry, turning demand scenarios, market dynamics and valuation benchmarks into decisions.
CXOs/ Presidents/ VPs/ Managers
M&A and Corporate Development
Strategy Teams and R&D Heads
Procurement and Product Directors
Regulatory and Compliance Leaders
Investor Relations and Equity Analysts