Market Minds Advisory
Demand for Chemical Mechanical Planarization in Japan

Demand for Chemical Mechanical Planarization in Japan: Demand for Chemical Mechanical Planarization in Japan: Nobody Changes a Working Slurry, So the Contest Happens Years Earlier

Requalifying a consumable at a running fab takes around 14 months and risks yield on a production line, which is why positions here are decided during process development years beforehand instead.

Lead Analyst

Published

September 2026

Make Smarter Decisions with Customized Research Insights

Request a free sample report and evaluate market opportunities, growth trends, and competitive dynamics relevant to your business needs.

2025 MARKET VALUE$6.4BMarket Size 2025
2036 FORECAST VALUE$17.5BBase Case , 2026 to 2036
CAGR 2026 TO 20369.6 %Bull 10.8% / Bear 8.4%
INCREMENTAL OPPORTUNITY$10.5BNet 10- year value creation
EXPANSION MULTIPLE2.50x2036 value over 2026 base
Strategic Levers
M&A Pipeline
Regional Outlook
Country Rankings
Competitive Intelligence
Segmental Deep-dive
Call-Us : 91 93563 13602

Executive Snapshot and Market Trajectory.

Planarisation consumables are among the stickiest positions in semiconductor manufacturing, because requalifying one takes around 14 months and risks yield on a line that is currently working. Nobody does it voluntarily. The competitive contest happens during process development instead. Three years before a wafer ships, in fact.
Advanced node slurries grow at 14.4%, half again the market rate of 9.6%, because leading logic now runs about 32 planarisation steps per wafer against roughly a third of that a decade ago. Polishing pads and conditioners follow at 10.6%. East Asia takes 68% of value, and Japan is the supply base for much of what the rest of the world consumes. Post-CMP cleaning chemistry follows at 9.2% behind both of those.
Concentration sits near 71% across the top five on measured equipment and consumable revenue, with roughly 68% of that value in materials rather than in polishing machines. The uncomfortable development is sustainability: fabs consuming about 1,100 litres of ultrapure water per wafer now want suppliers to help them use less of everything. Reduced consumption means reduced supplier revenue on identical wafer output, which nobody discusses openly.
Market Definition
This market covers chemical mechanical planarisation equipment, consumables and associated process materials used in semiconductor manufacturing, spanning advanced node slurries, polishing pads and conditioners, CMP polishing equipment, post-CMP cleaning chemistry, mature node and legacy slurries, and slurry delivery and filtration systems. Revenue is measured as equipment, consumable and attributable process material value at supplier level, with Japan treated as the analytical centre within a global sizing frame. Wafer substrates, photolithography and deposition equipment, general fab facility systems, metrology tools, and wafer polishing performed by substrate manufacturers are excluded.
Base Year Value
$6.4B in 2025 (MMA Primary Research Dataset, September 2026)
Forecast Period
2026 to 2036, eleven discrete annual values
CAGR
9.6% base case. Bull 10.8%. Bear 8.4%.
Fastest Growth Segment
Advanced Node Slurries: 14.4% CAGR
Fastest Growth Country
India: 12.6% CAGR
Fastest Growth Region
South Asia and Pacific: 11.8% CAGR
Largest Region
East Asia: 68% of 2025 global value
Market Leaders
Applied Materials, Ebara, Entegris, Fujimi and Resonac lead on measured equipment and consumable revenue. Source: MMA Primary Research Dataset, July 2026.
Primary Survey
n=3,800 procurement and R&D decision-makers, Q4 2025, six countries
Methodology
Demand-side build-up, cross-validated against public data, 47 expert interviews

Demand for Chemical Mechanical Planarization in Japan Market Forecast Scenarios

japan-chemical-mechanical-planarization-market-size-forecast-scenario-1788452990253
Growth ran at 8.2% from 2020 to 2025 and it outpaced wafer start growth throughout, which is the pattern worth understanding here. Advanced logic and three dimensional memory kept adding planarisation steps as device architectures grew vertically, so consumable consumption per wafer rose independently of how many wafers were being made. Capacity investment cycles moved equipment revenue up and down while consumable demand stayed comparatively steady.
The base case at 9.6% rests on three mechanisms. Planarisation step counts near 32 per wafer in leading logic continue rising as device stacks grow, which compounds consumable demand faster than wafer volume alone. Requalification durations around 14 months make positions extremely durable once won, so revenue from existing nodes persists for a decade. Third, new fab construction across several countries adds consumption at nodes where suppliers are competing for qualification now.
The bull case at 10.8% assumes advanced packaging adds planarisation steps at the same pace device scaling has, which several roadmaps imply. The bear case at 8.4% is that fab sustainability programmes cut slurry consumption per wafer materially, which would reduce supplier revenue on identical wafer volumes and is the one demand risk this industry rarely discusses openly.

Qualified Once, Supplied for Years

The commercial character of this market is set by one fact. Requalifying a consumable at a running fab takes around 14 months and risks yield on a line generating revenue hourly, so no process engineer proposes it lightly. A qualified slurry supplies that step for as long as the node runs, which can be a decade. Competition therefore happens at process development, three years before a wafer ships.
TOP FIVE CONCENTRATION71%Highly concentrated among equipment and consumable suppliers globally
CMP STEPS PER WAFER32Planarisation steps in a leading logic process flow
REQUALIFICATION DURATION14 monthsPeriod to qualify an alternative consumable at a fab
SLURRY COST PER WAFERUSD 41Consumable spend attributable to planarisation on each wafer
WATER USE PER WAFER1,100 litresUltrapure water consumed across planarisation and cleaning steps
CONSUMABLE SHARE OF REVENUE68%Market value in materials rather than in polishing equipment
Demand grows faster than wafer volume because step counts keep rising. Leading logic now runs about 32 planarisation steps per wafer against roughly a third of that ten years ago, as architectures grew vertically and every added layer needs a flat surface beneath the next. Consumable spend runs near USD 41 per wafer. Step multiplication rather than wafer volume has carried this market.
Japan's position here is supply rather than demand. Japanese producers hold leading positions in slurries, pads and polishing equipment, and much of what fabs in Taiwan, Korea and the United States consume was developed and made here. Domestic wafer production is modest against that supply base. Anyone treating Japanese CMP as a demand market has the trade reversed, which matters because the exposures differ entirely.
"Nobody changes a working slurry, which sounds like a comfortable position until you realise the corollary. Every position you do not already hold was decided during somebody's process development three years ago, and you were not invited. This industry competes on a calendar, not on a product."
Director, Semiconductor Materials and Process Chemicals Practice · MMA Chemicals and Materials Practice · September 2026

Market Trends

Step Counts Rise Faster Than Wafer Volumes

Leading logic now runs about 32 planarisation steps per wafer against roughly a third of that a decade ago, because device architectures grew vertically and every additional layer requires a flat surface beneath the one above it. Consumable consumption therefore rises even when wafer starts do not, which decouples this market from semiconductor unit cycles in a way most equipment categories never manage. Advanced node slurries grow at 14.4% on that compounding. Three dimensional memory follows identical logic with different chemistry entirely. Nobody is making dramatically more wafers, and consumption rose regardless of that.
Market Impact: Holds positions for 10 years
Sustainability Targets Ask Suppliers to Sell Less

Fabs consuming around 1,100 litres of ultrapure water per wafer across planarisation and cleaning now carry water and chemical reduction targets, and they are asking consumable suppliers to help them use less of exactly what those suppliers sell. Reduced slurry consumption per wafer is a direct revenue reduction on identical wafer volumes. Suppliers who engage keep the relationship and lose some volume; those who resist find the reduction happens without them. It is the demand risk this industry discusses least openly. Suppliers are being asked to help customers buy less of what they sell.
Market Impact: Grows fastest at 12.6% India

Market Opportunities and Growth Drivers

Qualification Locks a Supplier In for a Node's Life

Requalifying a consumable takes around 14 months and risks yield on a running production line, so a qualified supplier holds that step for as long as the node operates, frequently a decade or more. That is unusually durable for a materials position and it is why concentration sits near 71%. The corollary is uncomfortable: every position a supplier does not already hold was decided during a process development programme it was not part of. Winning requires presence years before volume. Technical presence years before any volume is the entire commercial requirement. Sales coverage will not do.
Market Impact: Requires 14 months to requalify

New Fab Construction Opens Qualification Windows

Fab construction across the United States, Japan, India and several European locations creates process development programmes where consumable selection is genuinely open, which happens rarely in an industry where existing positions almost never move. Suppliers present during those programmes win supply for the facility's operating life. India is the fastest-growing country at 12.6% on exactly this construction. The windows are short, well publicised and require technical presence rather than commercial effort, which suits some suppliers considerably better than others. These windows close permanently once the process flow freezes for production release. Nobody reopens them.
Market Impact: Cuts revenue on USD 41 spend

Market Restraints and Challenges

Positions Cannot Be Won Between Qualification Windows

Requalification takes around 14 months and risks yield on a line already producing, so a fab will not evaluate an alternative consumable without a genuine problem or a new process to develop. The root cause is that the downside of a failed change vastly exceeds any supply saving available. Commercially this means a supplier without a position at a given step cannot buy one at any price. Mitigation runs through process development engagement years ahead, which requires technical staff embedded rather than sales coverage. Price is simply not a variable in that decision at all.
Market Impact: Runs 32 steps per wafer

Customers Are Asking for Lower Consumption

Fab water and chemical reduction targets translate directly into requests that suppliers help cut slurry volume per wafer, against consumption near 1,100 litres of ultrapure water and USD 41 of consumable spend on each one. The root cause is that sustainability commitments landed on operations teams who then looked at their largest chemical consumers. Commercially this reduces revenue on unchanged wafer volumes. Suppliers mitigate by pricing on performance delivered rather than volume supplied, which very few have actually restructured toward. The request comes from customers rather than from regulators, which makes refusing it commercially awkward.
Market Impact: Consumes 1,100 litres per wafer
4 additional market trends, 3 additional growth drivers, and 2 additional restraints and challenges are covered in the full report. Contact sales@marketmindsadvisory.com to access the complete intelligence.

Segment CAGR and Growth Architecture

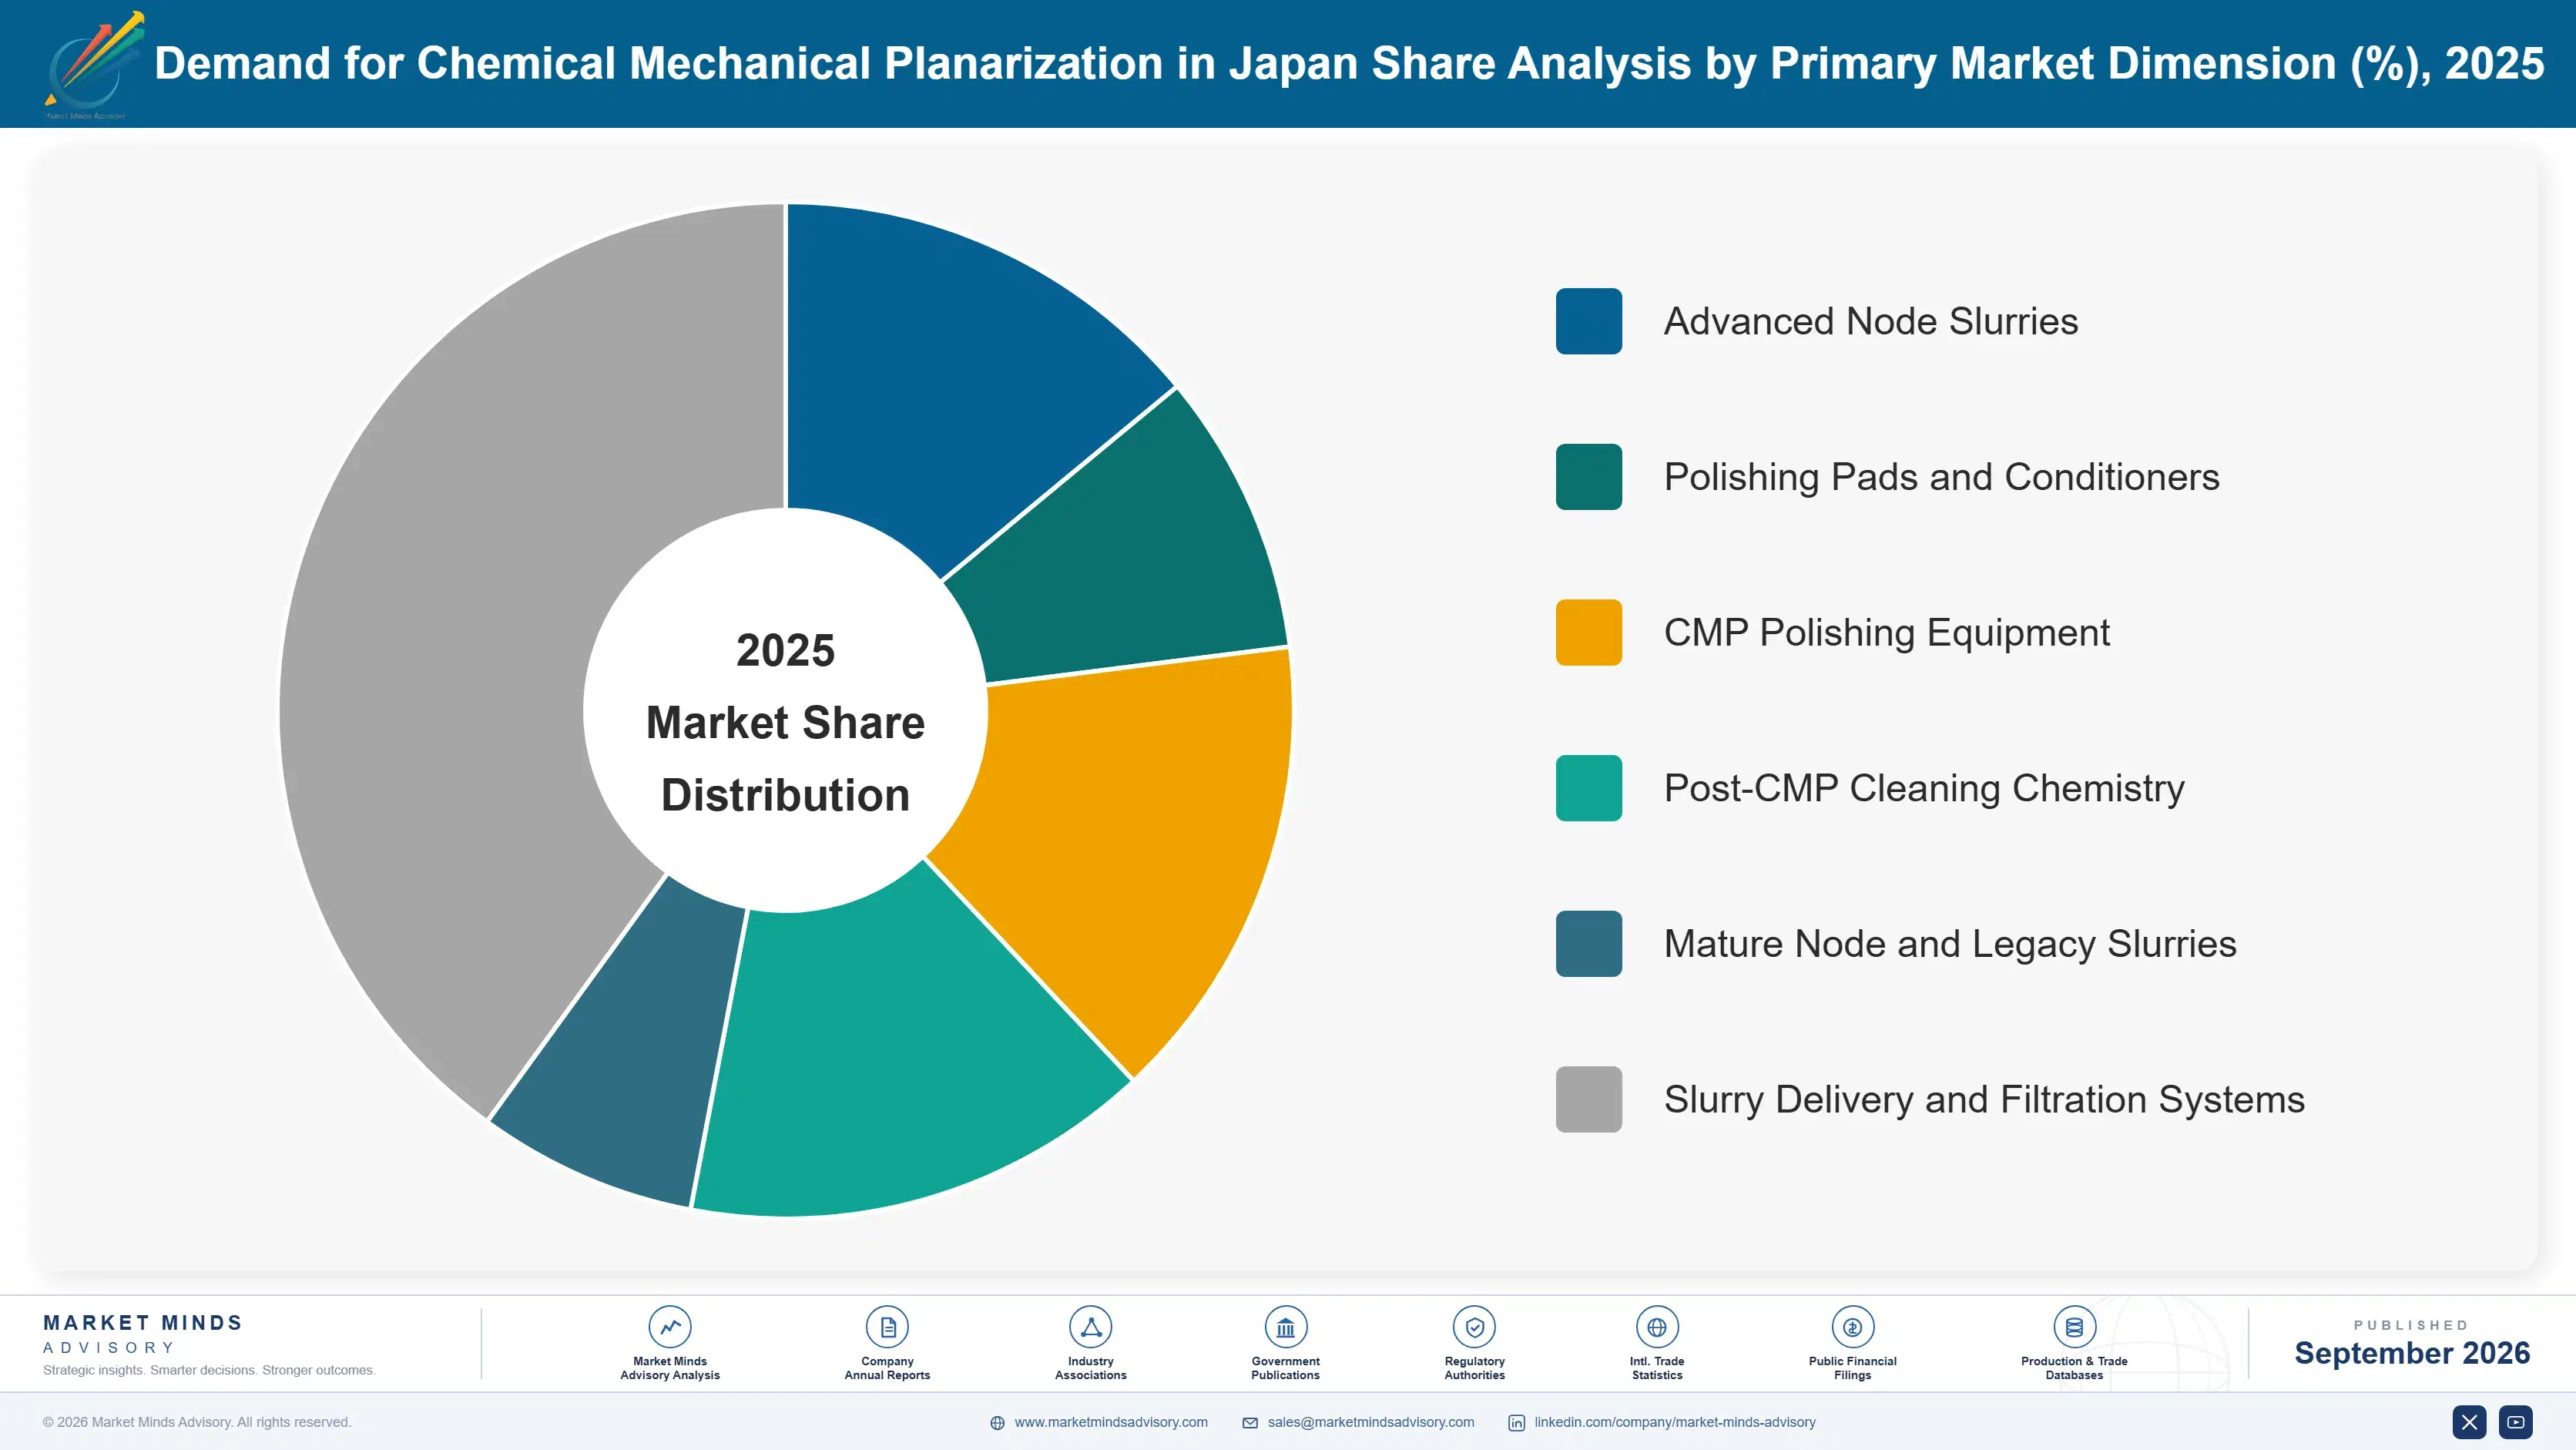
Segmentation follows the material or equipment class, because each carries a different qualification burden and a different replacement rhythm. A slurry is qualified into a specific step and stays for the node's life. A pad wears out and is replaced continuously. Equipment is bought once per tool and then consumes both for a decade afterwards.
japan-chemical-mechanical-planarization-market-market-share-analysis-1788452990787

Advanced Node Slurries

Advanced node slurries grow at 14.4%, half again the market rate of 9.6%, because leading logic now runs about 32 planarisation steps per wafer and each one consumes a chemistry formulated for that specific film stack. Step count growth compounds independently of wafer volume, which is what decouples this segment from semiconductor unit cycles. Qualification takes around 14 months and then holds for the node's operating life, so positions are extraordinarily durable and extraordinarily difficult to take. Japanese producers hold leading positions in the most demanding chemistries, developed alongside customers whose process teams they have worked with for decades. Chemistry difficulty rather than manufacturing scale decides who holds the most demanding steps.
CAGR 14.4%

Polishing Pads and Conditioners

Pads and conditioners grow at 10.6% because they are consumed continuously rather than qualified once, wearing out over hundreds of wafers and requiring replacement on a schedule that scales directly with planarisation step count. That gives the segment a genuine consumable rhythm the slurry business only partly shares. Pad and slurry performance are coupled, so a change in either requires revalidating both, which reinforces incumbent positions on each side. Japanese and American producers dominate, and material science rather than manufacturing scale determines who holds the demanding applications. Replacement scheduling gives this segment revenue visibility that slurry positions only partly provide, since consumption follows wafers processed rather than any purchasing decision at all.
CAGR 10.6%
Full segment breakdown across 6 segments available in the complete report.

Regional Architecture and Country Demand Map

This report is Japan-centred within a global sizing frame, so regional shares describe where planarisation value is consumed worldwide. Wafer fabrication location explains almost all of it, and it bears no relation to where the materials were developed. Development location and consumption location diverge completely in this market.

East Asia

East Asia holds 68%, far above the regional band, because wafer fabrication is concentrated here to a degree no other manufacturing activity approaches and planarisation consumables are used where wafers are made. Taiwanese and Korean fabs consume the largest volumes and run the highest step counts. Japan's position is different and frequently misread: domestic wafer production is modest while Japanese producers supply slurries, pads and polishing equipment consumed across the whole region and beyond. Chinese fab construction adds qualification windows at nodes where domestic suppliers are competing seriously for the first time. Requalification durations mean the qualification decisions taken at fabs under construction across the region now will determine supply positions for the whole of the next decade.
Share: 68% | CAGR: 10.6% (2026 to 2036)

North America

American demand is expanding through fab construction under domestic capacity programmes, which creates process development activity and therefore genuine qualification opportunities that rarely appear in established facilities. Advanced logic and memory fabs run the highest step counts outside East Asia. Equipment and consumable suppliers headquartered here hold strong positions built through decades of process co-development with domestic customers. Growth at 10.4% runs ahead of the market on construction rather than on any change in how existing fabs operate. Requalification durations mean decisions taken at those new facilities now will set supply positions for a decade, and suppliers absent from those development programmes cannot enter afterwards at any price. Consumable suppliers headquartered here are resourcing heavily against those programmes.
Share: 17% | CAGR: 10.4% (2026 to 2036)
Regional intelligence for 5 additional markets available in the complete report: Western Europe, South Asia and Pacific, Middle East and Africa, Latin America, Eastern Europe. Contact sales@marketmindsadvisory.com.
japan-chemical-mechanical-planarization-market-country-cagr-analysis-1788452991312

Winning Before the Wafer Exists

A supplier without a position at a given step cannot buy one, because requalification costs more risk than any price can offset. Everything commercially decisive happens during process development years before production. The levers that matter are about presence at that moment, and about surviving what sustainability targets are going to do to volume.

Embed Technical Staff in Process Development

Consumable selection is decided during process development two to three years before volume production, and a supplier absent from that work cannot enter afterwards because requalification takes around 14 months and risks yield nobody will risk. Suppliers embedding process engineers with development teams win qualifications at roughly 4 times the rate of those engaging commercially. It costs scarce technical staff deployed against revenue that arrives years later. Competitors treating this as a sales activity are consistently absent when the decision happens. Revenue arriving three years after the effort is a difficult internal argument.
Market Impact: Wins at roughly 4 times the usual rate

Chase New Fab Construction Windows Deliberately

Existing fab positions almost never move, so qualification windows open principally at new facilities, and construction across the United States, Japan, India and Europe has created more of them simultaneously than the industry has seen in twenty years. Suppliers who resourced against that construction schedule hold positions worth a decade of supply each. India grows fastest at 12.6% on exactly this. The windows close when process flows freeze, and several suppliers are still deciding whether to staff for them. The construction schedule is entirely public and the staffing decision is still not being made.
Market Impact: Secures roughly 10 years of supply each time

Price on Performance Rather Than Volume Supplied

Fab sustainability targets translate into requests for lower slurry consumption per wafer, and a supplier paid by volume is being asked to reduce its own revenue on unchanged wafer output. Pricing against planarisation performance delivered rather than litres consumed aligns both parties and protects roughly 25% of revenue that volume reduction would otherwise remove. Restructuring commercial terms is difficult and the alternative is worse. Very few suppliers have actually attempted it despite the direction being entirely clear. A supplier paid by the litre is directly opposed to its own customer's stated objectives. That cannot hold.
Market Impact: Protects roughly 25% of total consumable revenue overall

Follow Planarisation Into Advanced Packaging Facilities

Hybrid bonding and redistribution layers require surface quality comparable to front end processing, which introduces planarisation into packaging facilities that previously performed none and therefore hold no incumbent supplier at all. Those qualification windows are open now and sit with buyers most consumable suppliers have never called on. Positions won at packaging houses carry the same durability as fab positions once qualified. Suppliers organised entirely around front end customers reach these buyers late or fail to reach them. Hybrid bonding introduces around 3 planarisation stages into facilities that previously ran none, and each qualifies independently.
Market Impact: Opens roughly 3 entirely new qualification stages each

Who Controls the Margin Pool

Concentration sits near 71% across the top five on measured equipment and consumable revenue, among the highest in semiconductor materials, and it is sustained by qualification durability rather than by any technical barrier competitors could not eventually cross. Roughly 68% of market value sits in consumables rather than equipment, which means the recurring position matters more than the tool sale. Japanese producers hold disproportionate strength in the consumable half.
Competition runs on three dimensions. Process development presence is first and effectively decisive, since consumable selection happens years before production and cannot be revisited economically afterwards. Second is chemistry depth for specific film stacks, which is where Japanese producers have built positions through decades of co-development. Third is equipment installed base, because a polishing tool consumes both slurry and pads for a decade after purchase.

Two pressures will move positions. Fab construction across several countries has opened more qualification windows simultaneously than the industry has seen in twenty years, which rewards suppliers who resourced ahead of it. Meanwhile Chinese consumable producers are qualifying into domestic fabs at nodes where international suppliers previously faced no competition, and those positions will hold for the same decade everybody else's do.
japan-chemical-mechanical-planarization-market-company-positioning-matrix-1788452991836

Competitive Moat and Risk Dimensions

APPLIED MATERIALS

Moat: Equipment and process integration

Applied Materials supplies polishing equipment alongside adjacent process tools, which places it inside process development conversations where consumable and equipment decisions are taken together rather than separately. Installed tools consume slurry and pads for a decade after purchase. Its presence across multiple process steps gives visibility into customer roadmaps that consumable specialists reach considerably later.
APPLIED MATERIALS

Risk: Consumable value concentration

Roughly 68% of market value sits in consumables rather than equipment, and Japanese chemistry producers hold the strongest positions in the most demanding formulations through decades of co-development. Equipment revenue also follows capacity investment cycles that move sharply while consumable demand stays steady. Competing on chemistry means entering positions qualified into nodes running for another decade.
FUJIMI

Moat: Slurry chemistry depth

Fujimi holds slurry formulations qualified into demanding film stacks through co-development relationships with fab process teams built over decades, which is precisely the position requalification durations make almost impossible to displace. Its chemistry capability spans the film transitions that advanced nodes introduce. Japanese proximity to equipment and materials suppliers supports development cycles that geographically distant competitors run more slowly.
FUJIMI

Risk: Consumption reduction exposure

Fab sustainability targets translate directly into lower slurry volume per wafer, and a producer paid by volume faces revenue reduction on unchanged wafer output. Restructuring toward performance-based pricing requires commercial terms the industry has not established. Chinese producers qualifying into domestic fabs also occupy positions that will hold for a decade and cannot be contested afterwards.

Players Tracked

Prominent Players

Applied Materials
Ebara
Entegris
Fujimi
Resonac

Other Key Players

DuPont
Fujibo
JSR
AGC
Tokuyama
Merck
Soulbrain
KC Tech
ACM Research
Revasum
Axus Technology
Nitta DuPont
Ferro
Saint-Gobain
Tokyo Seimitsu

Recent Developments

FEBRUARY 2025

New fab construction opens simultaneous consumable qualification windows

Process development programmes at facilities under construction across several countries began selecting planarisation consumables, creating more open qualification opportunities at once than the industry had seen in two decades. Suppliers without technical staff available at those programmes were absent from the decisions entirely. Process flows freeze shortly afterwards.
Signal: Qualification windows open at new facilities and almost nowhere else, which makes construction schedules the sales calendar.
JULY 2025

Fabs request consumption reduction from planarisation material suppliers

Manufacturers carrying water and chemical reduction commitments asked slurry and cleaning chemistry suppliers to help lower consumption per wafer, which reduces supplier revenue on unchanged wafer output. Suppliers who engaged retained relationships while those who resisted found reductions proceeding without them. Volume-based pricing made the request commercially awkward.
Signal: Suppliers are being asked to help customers buy less, and refusing does not prevent the reduction happening.
NOVEMBER 2025

Hybrid bonding introduces planarisation into packaging facilities

Advanced packaging operations adopting hybrid bonding began requiring surface quality comparable to front end processing, introducing planarisation steps into facilities that had never performed any. Consumable selection at those sites was open, with no incumbent supplier positions to displace at all. Front end suppliers had never called on these facilities.
Signal: Packaging houses are a new buyer group with open qualification windows and no established supplier relationships.

What a Qualified Slurry Costs

Cost structure is dominated by raw abrasive materials and qualification effort rather than by formulation manufacturing. Ceria, silica and alumina abrasives together account for roughly 44% of slurry cost, with dispersion chemistry, filtration, packaging and quality control absorbing most of the remainder. Qualification support consumes process engineering time that behaves like investment rather than cost, incurred years before any revenue arrives.
Ceria abrasive supply has been the sharpest pressure. High purity ceria comes from a concentrated rare earth processing base and its pricing moved unfavourably through 2024 and 2025 as demand from planarisation and adjacent polishing applications tightened availability. Fujimi and Resonac both referenced raw material and production cost conditions in recent annual reporting. Suppliers absorbed most of it, since a qualified slurry cannot change abrasive source without triggering requalification at every fab using it.

Exposure varies by abrasive dependency rather than by scale. Producers with formulations across ceria, silica and alumina chemistries can shift emphasis when one abrasive tightens. Those concentrated in a single abrasive family carry the full exposure on positions they cannot reformulate without requalification. Equipment suppliers carry no abrasive exposure and face capacity cycles that move revenue far more sharply than consumable demand does.
japan-chemical-mechanical-planarization-market-cost-volatility-analysis-1788452992034

Qualify multiple abrasive sources within one formulation

A qualified slurry cannot change abrasive supplier without triggering requalification at every fab using it, which turns a raw material shortage into a supply failure. Qualifying alternate sources within the original formulation costs validation effort and removes an exposure lasting the node's life. It must happen during original qualification, which is precisely when it looks like effort nobody asked for.

Restructure pricing toward performance not volume

Fab sustainability targets reduce slurry consumption per wafer, and a supplier paid by litre is being asked to shrink its own revenue on unchanged output. Pricing against planarisation performance delivered aligns both parties and protects roughly 25% of revenue that volume reduction would otherwise remove. The restructuring is difficult and delaying it only weakens the negotiating position later.

Deploy process engineers against construction schedules

Qualification windows open at new facilities and almost nowhere else, which makes fab construction timetables the only sales calendar worth maintaining in this business. Positioning scarce process engineers against those schedules rather than existing accounts wins positions worth a decade each. It means moving technical staff away from customers generating revenue now, which is why few do it.

Portfolio Architecture for Margin Defence

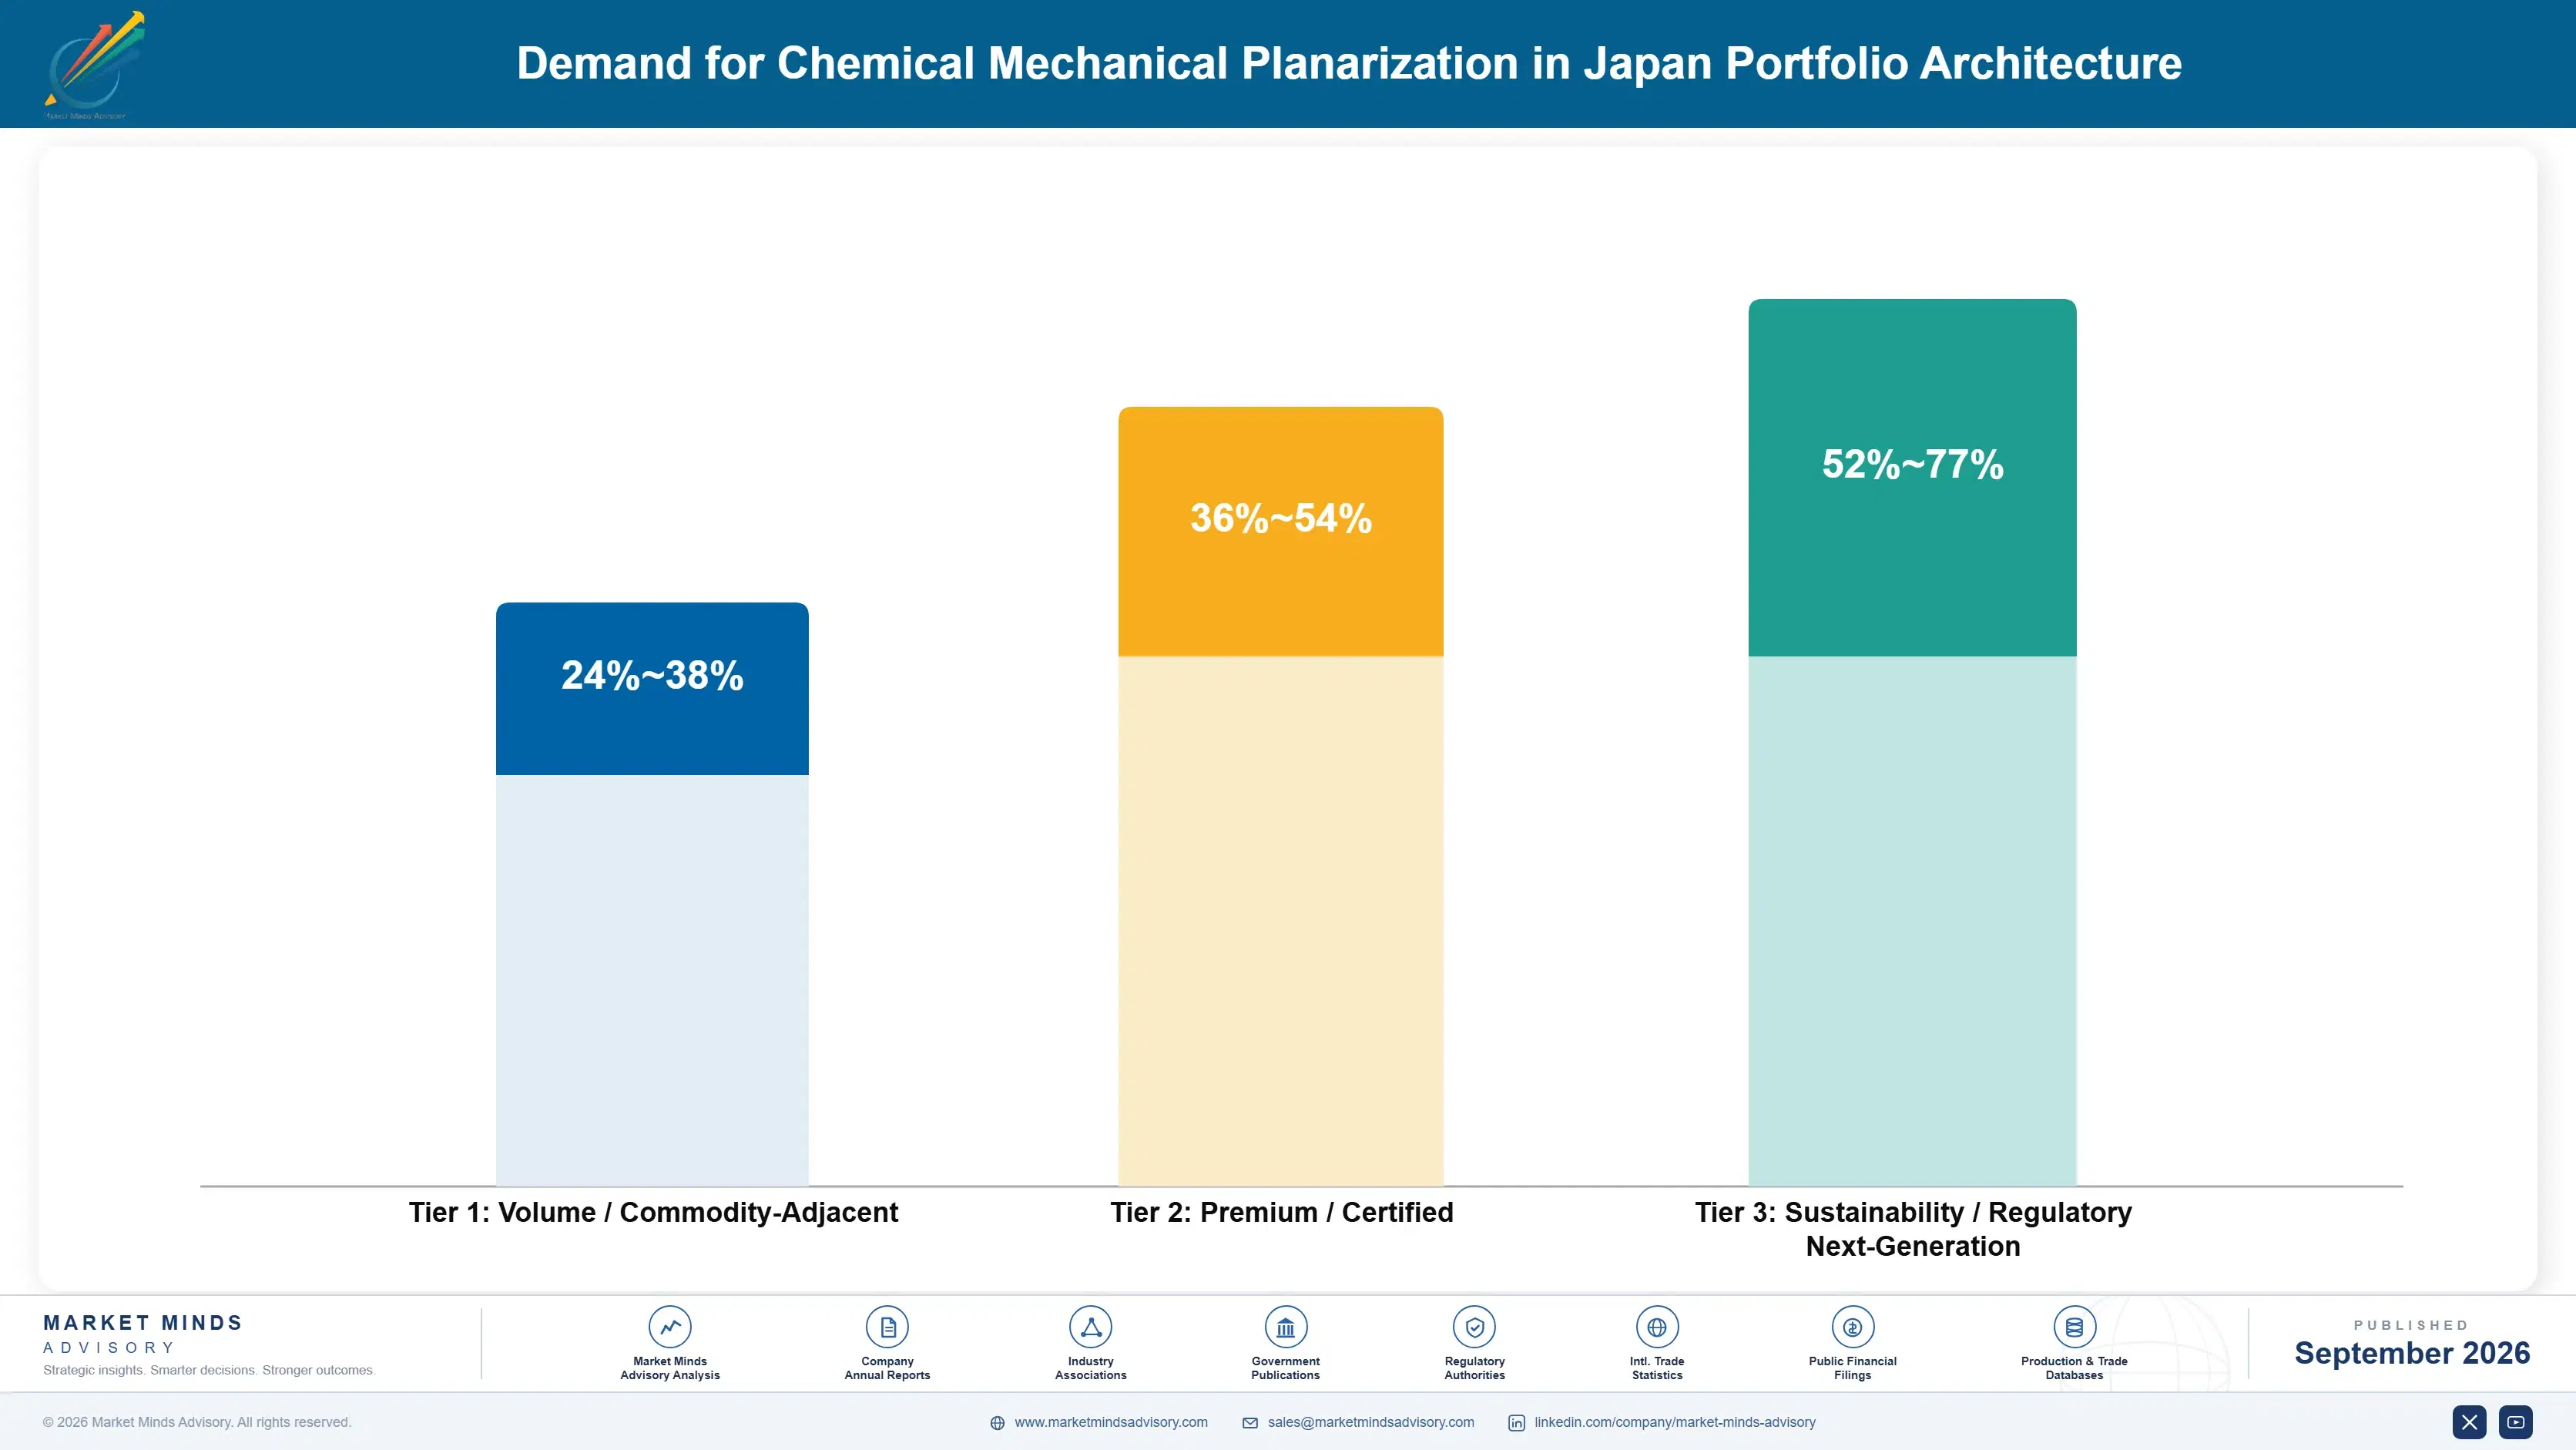
Margin architecture separates on chemistry difficulty rather than on volume. Mature node slurries polish well-understood films where several suppliers qualify and pricing reflects that, so margins are ordinary and positions are contested at each new fab. Advanced node chemistries formulated for specific film stacks earn considerably more, because the qualified supplier list at those steps is frequently one name long and requalification is not commercially available.
The tension runs between recurring consumables and cyclical equipment. Consumables at roughly 68% of market value recur with wafer production and grow with step counts regardless of capacity investment. Equipment revenue swings sharply with fab construction cycles and then seeds a decade of consumable consumption on every tool sold. Suppliers holding only consumables miss the tool-driven qualification moment; those holding only equipment miss the recurring revenue their own machines generate.

High-value revenue concentrates in advanced node slurries and in qualification positions at newly constructed fabs. Both are defended by requalification durations rather than by anything a competitor could out-engineer. Pads and conditioners provide the continuous consumption rhythm, and equipment provides the installed base that determines whose consumables get used for the following decade.

Volume / Commodity-Adjacent

Mature node slurries and general polishing consumables where several suppliers hold qualifications and pricing is genuinely contested. The range separates producers with abrasive flexibility from those exposed to a single chemistry. Volume here funds development for more demanding applications.
Gross Margin: 24-38%

Premium / Certified

Polishing pads, conditioners, cleaning chemistry and slurry delivery systems consumed continuously alongside qualified slurries. Margin reflects material science depth rather than manufacturing scale. Pad and slurry coupling reinforces incumbent positions on both sides simultaneously.
Gross Margin: 36-54%

Sustainability / Regulatory / Next-Generation

Advanced node slurries formulated for specific film stacks, and planarisation materials for hybrid bonding in advanced packaging. The widest range in the portfolio, reflecting chemistry difficulty and how short the qualified supplier list actually is. Highest margin and most durable.
Gross Margin: 52-77%
japan-chemical-mechanical-planarization-market-portfolio-architecture-1788452992541

High-value Sub-segments and Strategic Watch-out

Advanced Node Slurry Positions

High value with the fastest growth at 14.4%, protected by requalification durations near 14 months and by qualified supplier lists frequently one name long. The range reflects chemistry difficulty by film stack. Step counts near 32 per wafer compound demand independently of whether wafer volumes grow at all.
Gross Margin: 54-77%

Advanced Packaging Planarisation

High value with strong growth, opening at packaging facilities that never performed planarisation and therefore hold no incumbent supplier positions to displace. The range reflects bonding technology and surface requirements. The buyers are packaging houses most consumable suppliers have simply never called on before at all.
Gross Margin: 48-72%

Pads and Continuous Consumables

The volume core in recurring terms, consumed continuously and replaced on a schedule scaling directly with step count. The range reflects material science depth in demanding applications. Pad and slurry coupling means a change in either requires revalidating both, which protects everybody incumbent on either side. That suits them.
Gross Margin: 34-52%

Volume Priced Slurry Supply

The strategic watch-out, where suppliers paid by litre face sustainability targets designed to reduce exactly what they sell. Revenue falls on unchanged wafer output and no product improvement addresses it. Restructuring toward performance pricing is difficult, and delaying it weakens the negotiating position further every year.
Gross Margin: 0-22%

How Positions Persist

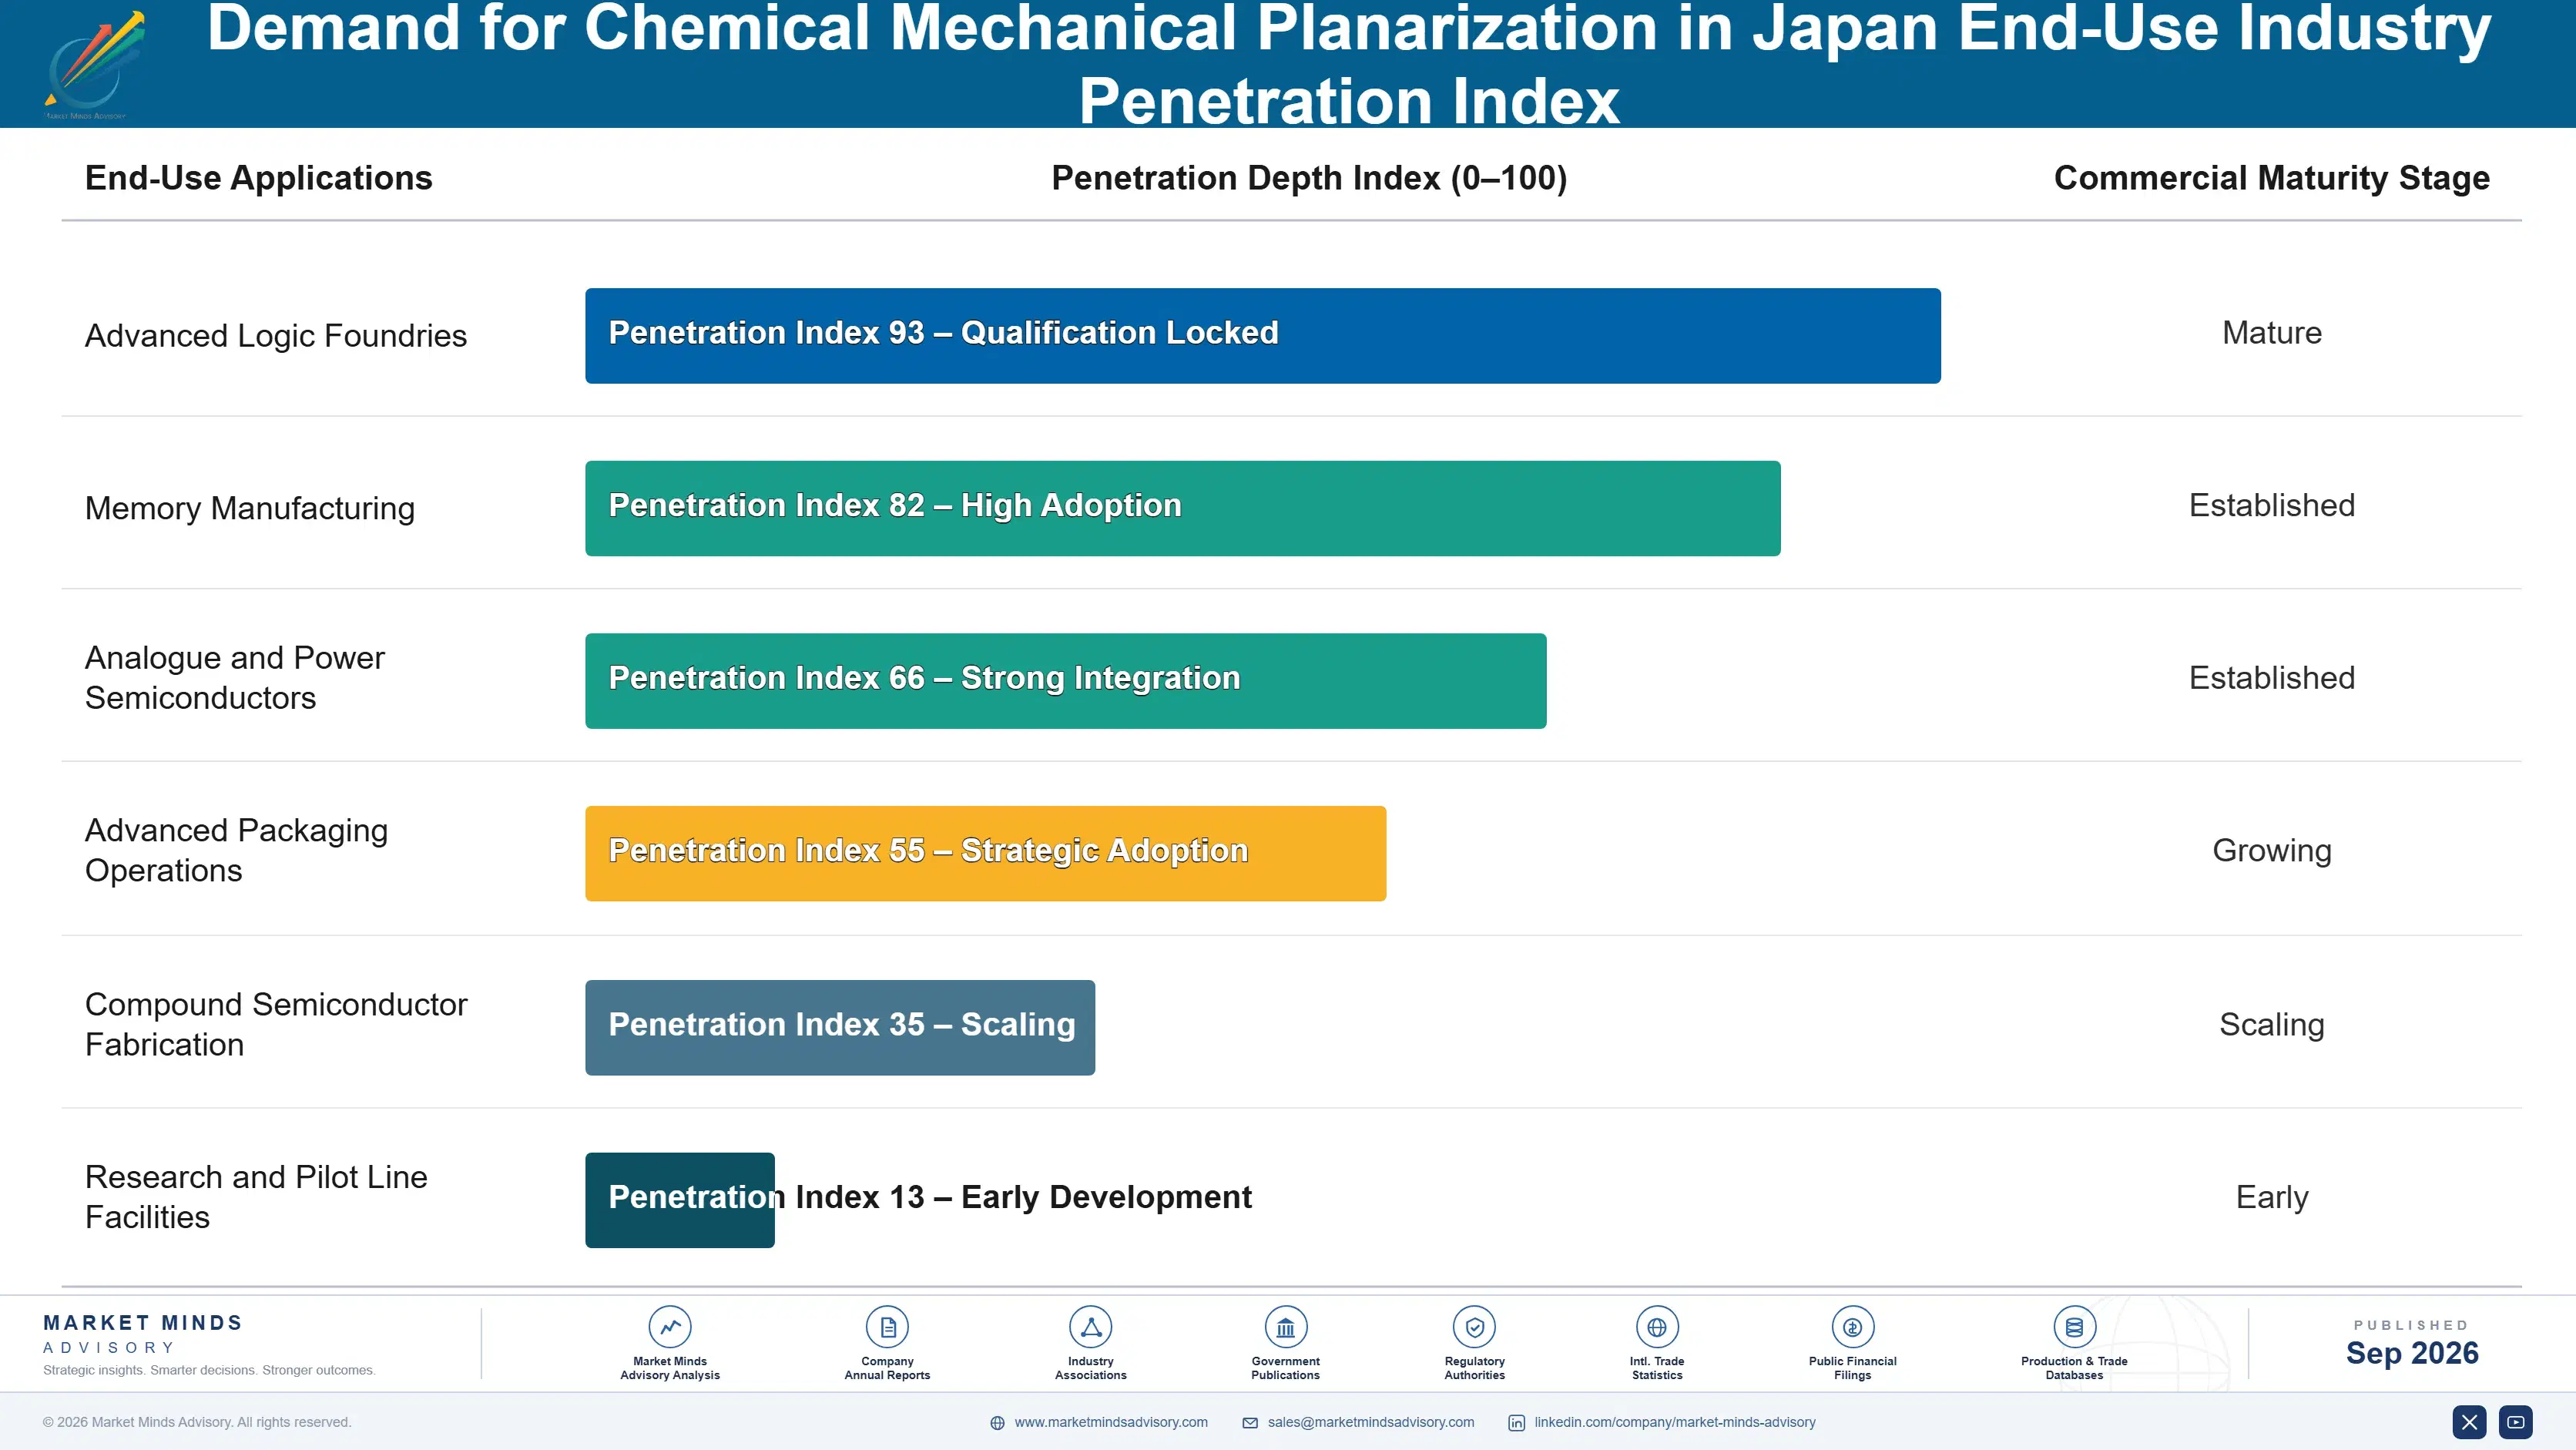
Recurrence works through qualification rather than through selling. A slurry qualified into a process step supplies it for as long as the node runs, which is frequently a decade, and nobody revisits the decision because requalification takes around 14 months and risks yield. Pads and conditioners recur continuously as they wear. Equipment recurs only with capacity investment, and each tool then determines whose consumables run beneath it.
Adoption depth varies with how specific the chemistry is to the customer's process. A slurry co-developed against a particular film stack is effectively unmovable, since no alternative has been characterised against that process at all. A general purpose consumable at a mature node can be dual-sourced and periodically is. Japanese producers hold disproportionate depth in the first category, built through co-development relationships spanning decades of node transitions.

The buyer is a process engineer and has always been. Consumable selection is a technical decision made during development against yield, defectivity and removal rate data, with procurement negotiating terms on a choice already settled. That structure has not changed and shows no sign of changing. Suppliers organised around account coverage rather than process engineering presence address the function documenting the decision rather than making it.
japan-chemical-mechanical-planarization-market-end-use-penetration-index-1788452993035

Where Qualification Decides Everything

These are among the four positions where our research anticipates prominent divergence between winners and laggards over the coming forecast period. Each is grounded in the demand model, the regulatory perimeter, and the announced capacity pipeline.
01 / DEVELOPMENT STAGE PRESENCE

Embed engineers where the decision actually happens

Consumable selection is settled during process development two to three years before volume production, and a supplier absent from that work cannot enter afterwards because requalification takes around 14 months and risks yield nobody is willing to gamble on a running line. Suppliers embedding process engineers alongside development teams win qualifications at roughly 4 times the rate of those engaging commercially through account managers. Competitors treating this as a sales activity are reliably reliably absent at the moment the decision is actually taken.
02 / CONSTRUCTION WINDOW TARGETING

Resource against fab construction, not existing accounts

Existing fab positions almost never move, so qualification windows open principally at new facilities, and simultaneous construction across the United States, Japan, India and Europe has created more of them at once than this industry has seen in twenty years. Suppliers who resourced against that construction schedule hold positions worth roughly a decade of supply each, since a qualified consumable runs for the node's operating life. Several suppliers are still deciding whether to staff for windows that close when process flows freeze.
03 / CONSUMPTION PRICING REFORM

Get paid for performance before volume falls

Fab sustainability targets translate into direct and specific requests for lower slurry consumption per wafer, which means a supplier paid by litre is being asked to reduce its own revenue on entirely unchanged wafer output volumes. Pricing against planarisation performance delivered rather than volume consumed aligns both parties and protects roughly 25% of revenue that consumption reduction would otherwise remove permanently from the business. Very few suppliers have restructured despite the direction being obvious, and delay only weakens the negotiating position later on.
04 / PACKAGING CHANNEL ENTRY

Follow planarisation into facilities that never had it

Hybrid bonding and redistribution layers demand surface quality broadly comparable to front end processing, which introduces planarisation into packaging facilities that performed none previously and therefore hold no incumbent supplier positions at all to displace or negotiate around. Those qualification windows are open right now and sit with buyers most consumable suppliers have simply never called on at any point. Positions won at packaging houses carry the same decade-long durability that fab positions do once they are qualified into the process.

Engagement Snapshot From the Field

A live engagement with an industry participant carrying material or product regulatory and market exposure ahead of a defining policy shift, showing how our research translates into a defensible multi-year portfolio strategy.
MARKET MINDS ADVISORY · CLIENT ENGAGEMENT SUMMARY
Demand for Chemical Mechanical Planarization in Japan Producer Strategic Portfolio Review and Transition Roadmap 2026·Investment Scenario on Demand for Chemical Mechanical Planarization in Japan Exposure Evaluation 2025-26
CLIENT PROFILE
A planarisation consumable producer with annual revenue near USD 240 million (client-reported, unverified by MMA), holding qualified positions at eleven fabs across mature and mid-range nodes. Advanced node share had been declining for six years, and the technical organisation was deployed almost entirely on supporting existing qualified positions. Nobody at all was deployed anywhere else.
STRATEGIC CHALLENGE
The board had approved USD 22 million of formulation development to win advanced node business (client-reported, unverified by MMA), assuming the barrier was chemistry performance. Nobody had examined when advanced node consumable decisions were actually taken, or whether the company had actually been present at any single one of them.
MMA APPROACH
MMA traced 23 advanced node qualification decisions to the moment and the forum in which each was made, rather than benchmarking formulation performance, which the client had done extensively. We interviewed 19 process engineers at seven fabs, reviewed development programme timelines, and mapped the client's technical deployment against those timelines directly.
KEY FINDINGS
  1. All 23 advanced node decisions were taken during process development between two and three years before production, and the client attended none of them.
  2. Formulation performance had not been the deciding factor in any traced case, since competing chemistries all met the technical threshold that had been set.
  3. The client's process engineers were fully committed to supporting existing qualified positions, leaving nobody available for development programmes at facilities under construction.
  4. Four fabs under construction had development programmes opening within eighteen months, and the client had no plan to attend any of them.
CLIENT PROFILE
A planarisation consumable producer with annual revenue near USD 240 million (client-reported, unverified by MMA), holding qualified positions at eleven fabs across mature and mid-range nodes. Advanced node share had been declining for six years, and the technical organisation was deployed almost entirely on supporting existing qualified positions. Nobody at all was deployed anywhere else.
STRATEGIC CHALLENGE
The board had approved USD 22 million of formulation development to win advanced node business (client-reported, unverified by MMA), assuming the barrier was chemistry performance. Nobody had examined when advanced node consumable decisions were actually taken, or whether the company had actually been present at any single one of them.
MMA APPROACH
MMA traced 23 advanced node qualification decisions to the moment and the forum in which each was made, rather than benchmarking formulation performance, which the client had done extensively. We interviewed 19 process engineers at seven fabs, reviewed development programme timelines, and mapped the client's technical deployment against those timelines directly.
KEY FINDINGS
  1. All 23 advanced node decisions were taken during process development between two and three years before production, and the client attended none of them.
  2. Formulation performance had not been the deciding factor in any traced case, since competing chemistries all met the technical threshold that had been set.
  3. The client's process engineers were fully committed to supporting existing qualified positions, leaving nobody available for development programmes at facilities under construction.
  4. Four fabs under construction had development programmes opening within eighteen months, and the client had no plan to attend any of them.
RECOMMENDED STRATEGY
Phase 1: Redeploy a third of process engineering capacity onto construction stage development programmes, accepting reduced support on stable qualified positions that rarely need it. Phase 2: Defer the formulation development programme, since chemistry performance was not the barrier in any single traced qualification decision at all. Phase 3: Build technical presence at the four fabs under construction now, since those windows close permanently when the process flows freeze.
OUTCOME
The client redeployed technical staff and won two advanced node qualifications within fourteen months at the fabs under construction (client-reported, unverified by MMA). The USD 22 million formulation programme was reduced to USD 6 million of targeted work, and existing positions suffered no measurable degradation from the reduced support.

Frequently Asked Questions

Foundational context covering the market sizes, CAGR, scope, country, region and competition that inform every finding below. This section is provided to cover basics and most often pre-purchase conversations, answered from the MMA Primary Research Dataset.

What is the current size of the Demand for Chemical Mechanical Planarization in Japan?

The market was worth USD 6.4 billion in 2025 and reaches USD 7.01 billion in 2026 on a global sizing frame. Japan is the analytical centre of this report.

How large will the Demand for Chemical Mechanical Planarization in Japan be by 2036?

MMA forecasts USD 17.53 billion by 2036, an expansion of 2.50 times over the forecast period. That represents USD 10.52 billion of incremental annual revenue against 2026.

What is the CAGR for the Demand for Chemical Mechanical Planarization in Japan 2026 to 2036?

The base case is 9.6% compound annual growth, with a bull case at 10.8% and a bear case at 8.4%. Fab consumption reduction targets separate the scenarios most clearly.

Which segment is growing fastest?

Advanced node slurries grow at 14.4%, half again the market rate of 9.6%. Leading logic now runs about 32 planarisation steps per wafer against a third of that a decade ago.

Who are the major companies in the Demand for Chemical Mechanical Planarization in Japan?

Applied Materials, Ebara, Entegris, Fujimi and Resonac lead on measured equipment and consumable revenue. Together they hold roughly 71%, among the highest concentration in semiconductor materials.

Which country is growing fastest?

India grows fastest at 12.6%, on fab construction creating consumable qualification windows in a market that had previously offered essentially none of them at all.

Report Segmentation Architecture

The full report scope spans multiple orthogonal segmentation dimensions, with cross-tabulated demand data provided for each dimension pair. Coverage extends further to regional breakdowns, trend trajectories, and the competitive detail needed to support segment-level decision-making.

By Primary Market Dimension

  • Advanced Node Slurries
  • Polishing Pads and Conditioners
  • CMP Polishing Equipment
  • Post-CMP Cleaning Chemistry
  • Mature Node and Legacy Slurries
  • Slurry Delivery and Filtration Systems

By End-Use Industry

  • Advanced Logic Foundries
  • Memory Manufacturing
  • Analogue and Power Semiconductors
  • Advanced Packaging Operations
  • Compound Semiconductor Fabrication
  • Research and Pilot Line Facilities

By Commercial Dimension

  • Qualified Consumable Supply
  • Process Development Partnerships
  • Equipment Capital Purchase
  • Distribution and Regional Supply
  • Sustainability Reduction Programmes
  • Packaging Facility Qualification

By Region

  • East Asia
  • North America
  • Western Europe
  • South Asia and Pacific
  • Middle East and Africa
  • Latin America
  • Eastern Europe

Scope, Methodology, and Coverage

Every figure in this report is reproducible from documented input assumptions. The scope below maps the historical period, the forecast horizon, the segmentation dimensions, and the countries covered, alongside the underlying primary and qualitative methodology.
Historical Period
2020 to 2025
Forecast Period
2026 to 2036
Base Year
2025 (USD billions; MMA Primary Research Dataset, September 2026)
Market Definition
This market covers chemical mechanical planarisation equipment, consumables and associated process materials used in semiconductor wafer manufacturing and advanced packaging, spanning advanced node slurries, polishing pads and conditioners, CMP polishing equipment, post-CMP cleaning chemistry, mature node and legacy slurries, and slurry delivery and filtration systems. Revenue is measured as equipment, consumable and attributable process material and qualification support value at supplier level, with Japan treated as the analytical centre within a global sizing frame required by the seven-region reporting structure. Wafer substrates and their manufacture, photolithography, deposition and etch equipment, general fab facility and water treatment systems, process metrology tools, and substrate polishing performed by wafer manufacturers are excluded from scope.
Quantitative Units
USD billions, equipment, consumable and attributable process material revenue at supplier level
Segmentation Dimensions
Material and equipment class, end-use manufacturing type, commercial channel, region
Regions Covered
East Asia, North America, Western Europe, South Asia and Pacific, Middle East and Africa, Latin America, Eastern Europe
Countries Covered
Japan, Taiwan, South Korea, China, Singapore, Malaysia, India, Vietnam, Australia, United States, Canada, Mexico, Brazil, Costa Rica, Germany, Ireland, France, Netherlands, Italy, Austria, United Kingdom, Poland, Czechia, Hungary, Israel, United Arab Emirates, Saudi Arabia, South Africa, Morocco
Key Companies Profiled
Applied Materials, Ebara, Entegris, Fujimi, Resonac, DuPont, Fujibo, JSR, AGC, Tokuyama, Merck, Soulbrain, KC Tech, ACM Research, Revasum, Axus Technology, Nitta DuPont, Ferro, Saint-Gobain, Tokyo Seimitsu
Quantitative Methodology
Primary survey, n=3,800 respondents, Q4 2025, six countries; demand-side model with trade association cross-validation
Qualitative Methodology
47 expert interviews, Q4 2025; applied to validate demand model assumptions, identify emerging dynamics, and assess competitive positioning
Report Format
PDF and XLSX data workbook (Word format preview document)
Publisher
Market Minds Advisory
Report Code
MMA-2026-CHM-161
Published
September 2026
Contact
sales@marketmindsadvisory.com | www.marketmindsadvisory.com

Purchase the full Demand for Chemical Mechanical Planarization in Japan Report (2026 to 2036).

The full MMA report explains why planarisation positions are decided years before production and cannot be bought afterwards at any price, and why Japan is the supply base rather than the demand market. It sizes the market to 2036 across six material and equipment classes, seven regions and 29 countries, with segment growth rates and regional demand mechanisms detailed. Competitive analysis covers 20 suppliers assessed on measured equipment and consumable revenue, with moat and risk assessment for the two leaders. The report quantifies abrasive cost structure, consumption reduction exposure and margin architecture across three portfolio tiers. It closes with four verdicts and an anonymised consumable producer engagement.
Six material classes sized through 2036
Seven regions with demand mechanism analysis
Twenty suppliers on consistent revenue basis
Step count and requalification duration benchmarks
Margin architecture across three portfolio tiers
Anonymised consumable qualification strategy review engagement

Built For The People Who Decide

From boardroom strategy to bench-side execution, this report is read cover-to-cover by leaders shaping the next decade of their industry, turning demand scenarios, market dynamics and valuation benchmarks into decisions.
CXOs/ Presidents/ VPs/ Managers
M&A and Corporate Development
Strategy Teams and R&D Heads
Procurement and Product Directors
Regulatory and Compliance Leaders
Investor Relations and Equity Analysts