Market Minds Advisory
IP TCG Market

IP TCG Market: Licensed Trading Card Games: The Property Sells the First Box and Organised Play Sells the Next Thirty

A licence brings an audience to one purchase and does nothing to bring them back, which is why second year retention sits near 31% and organised play is the only real defence.

Lead Analyst

Published

September 2026

Make Smarter Decisions with Customized Research Insights

Request a free sample report and evaluate market opportunities, growth trends, and competitive dynamics relevant to your business needs.

2025 MARKET VALUE$8.4BMarket Size 2025
2036 FORECAST VALUE$23.5BBase Case , 2026 to 2036
CAGR 2026 TO 20369.8 %Bull 11.0% / Bear 8.6%
INCREMENTAL OPPORTUNITY$14.3BNet 10- year value creation
EXPANSION MULTIPLE2.55x2036 value over 2026 base
Strategic Levers
M&A Pipeline
Regional Outlook
Country Rankings
Competitive Intelligence
Segmental Deep-dive
Call-Us : 91 93563 13602

Executive Snapshot and Market Trajectory.

A licensed property does the customer acquisition and the game design does the retention, and almost every failed launch confused the two. Second year retention sits near 31%, which tells you how much of a purchase a famous name actually buys after the first box has been opened.
Premium collector products grow at 14.7%, half again the market rate of 9.8%, as publishers chase margin that royalty rates near 14% of wholesale otherwise take away from them. Digital and hybrid play follows at 12.6%. East Asia takes 42% of value, because the properties, the publishers and the deepest player bases all originate there. Core booster lines grow at 8.4% and remain where the player base actually gets built over time.
Concentration sits near 68% across the top five on measured publisher revenue, among the highest in consumer products. Organised play consumes about 6% of revenue and is the only thing converting a licence buyer into a player, which is why cutting it to protect margin has ended more games than any competitor ever has. Nobody has ever recovered a player community faster than they lost it.
Market Definition
This market covers trading card games built on licensed entertainment properties, spanning premium collector products, digital and hybrid play products, core booster product lines, starter and entry products, organised play and event programmes, and graded and authenticated secondary support. Revenue is measured at publisher level including attributable organised play and digital revenue. Original intellectual property card games, collectible sports cards without game mechanics, board and tabletop games, secondary market transaction value between collectors, and licensed merchandise outside card products are excluded.
Base Year Value
$8.4B in 2025 (MMA Primary Research Dataset, September 2026)
Forecast Period
2026 to 2036, eleven discrete annual values
CAGR
9.8% base case. Bull 11.0%. Bear 8.6%.
Fastest Growth Segment
Premium Collector Products: 14.7% CAGR
Fastest Growth Country
Indonesia: 13.2% CAGR
Fastest Growth Region
South Asia and Pacific: 12.0% CAGR
Largest Region
East Asia: 42% of 2025 global value
Market Leaders
The Pokemon Company, Bandai Namco, Konami, Ravensburger and Wizards of the Coast lead on measured publisher revenue. Source: MMA Primary Research Dataset, July 2026.
Primary Survey
n=3,800 procurement and R&D decision-makers, Q4 2025, six countries
Methodology
Demand-side build-up, cross-validated against public data, 47 expert interviews

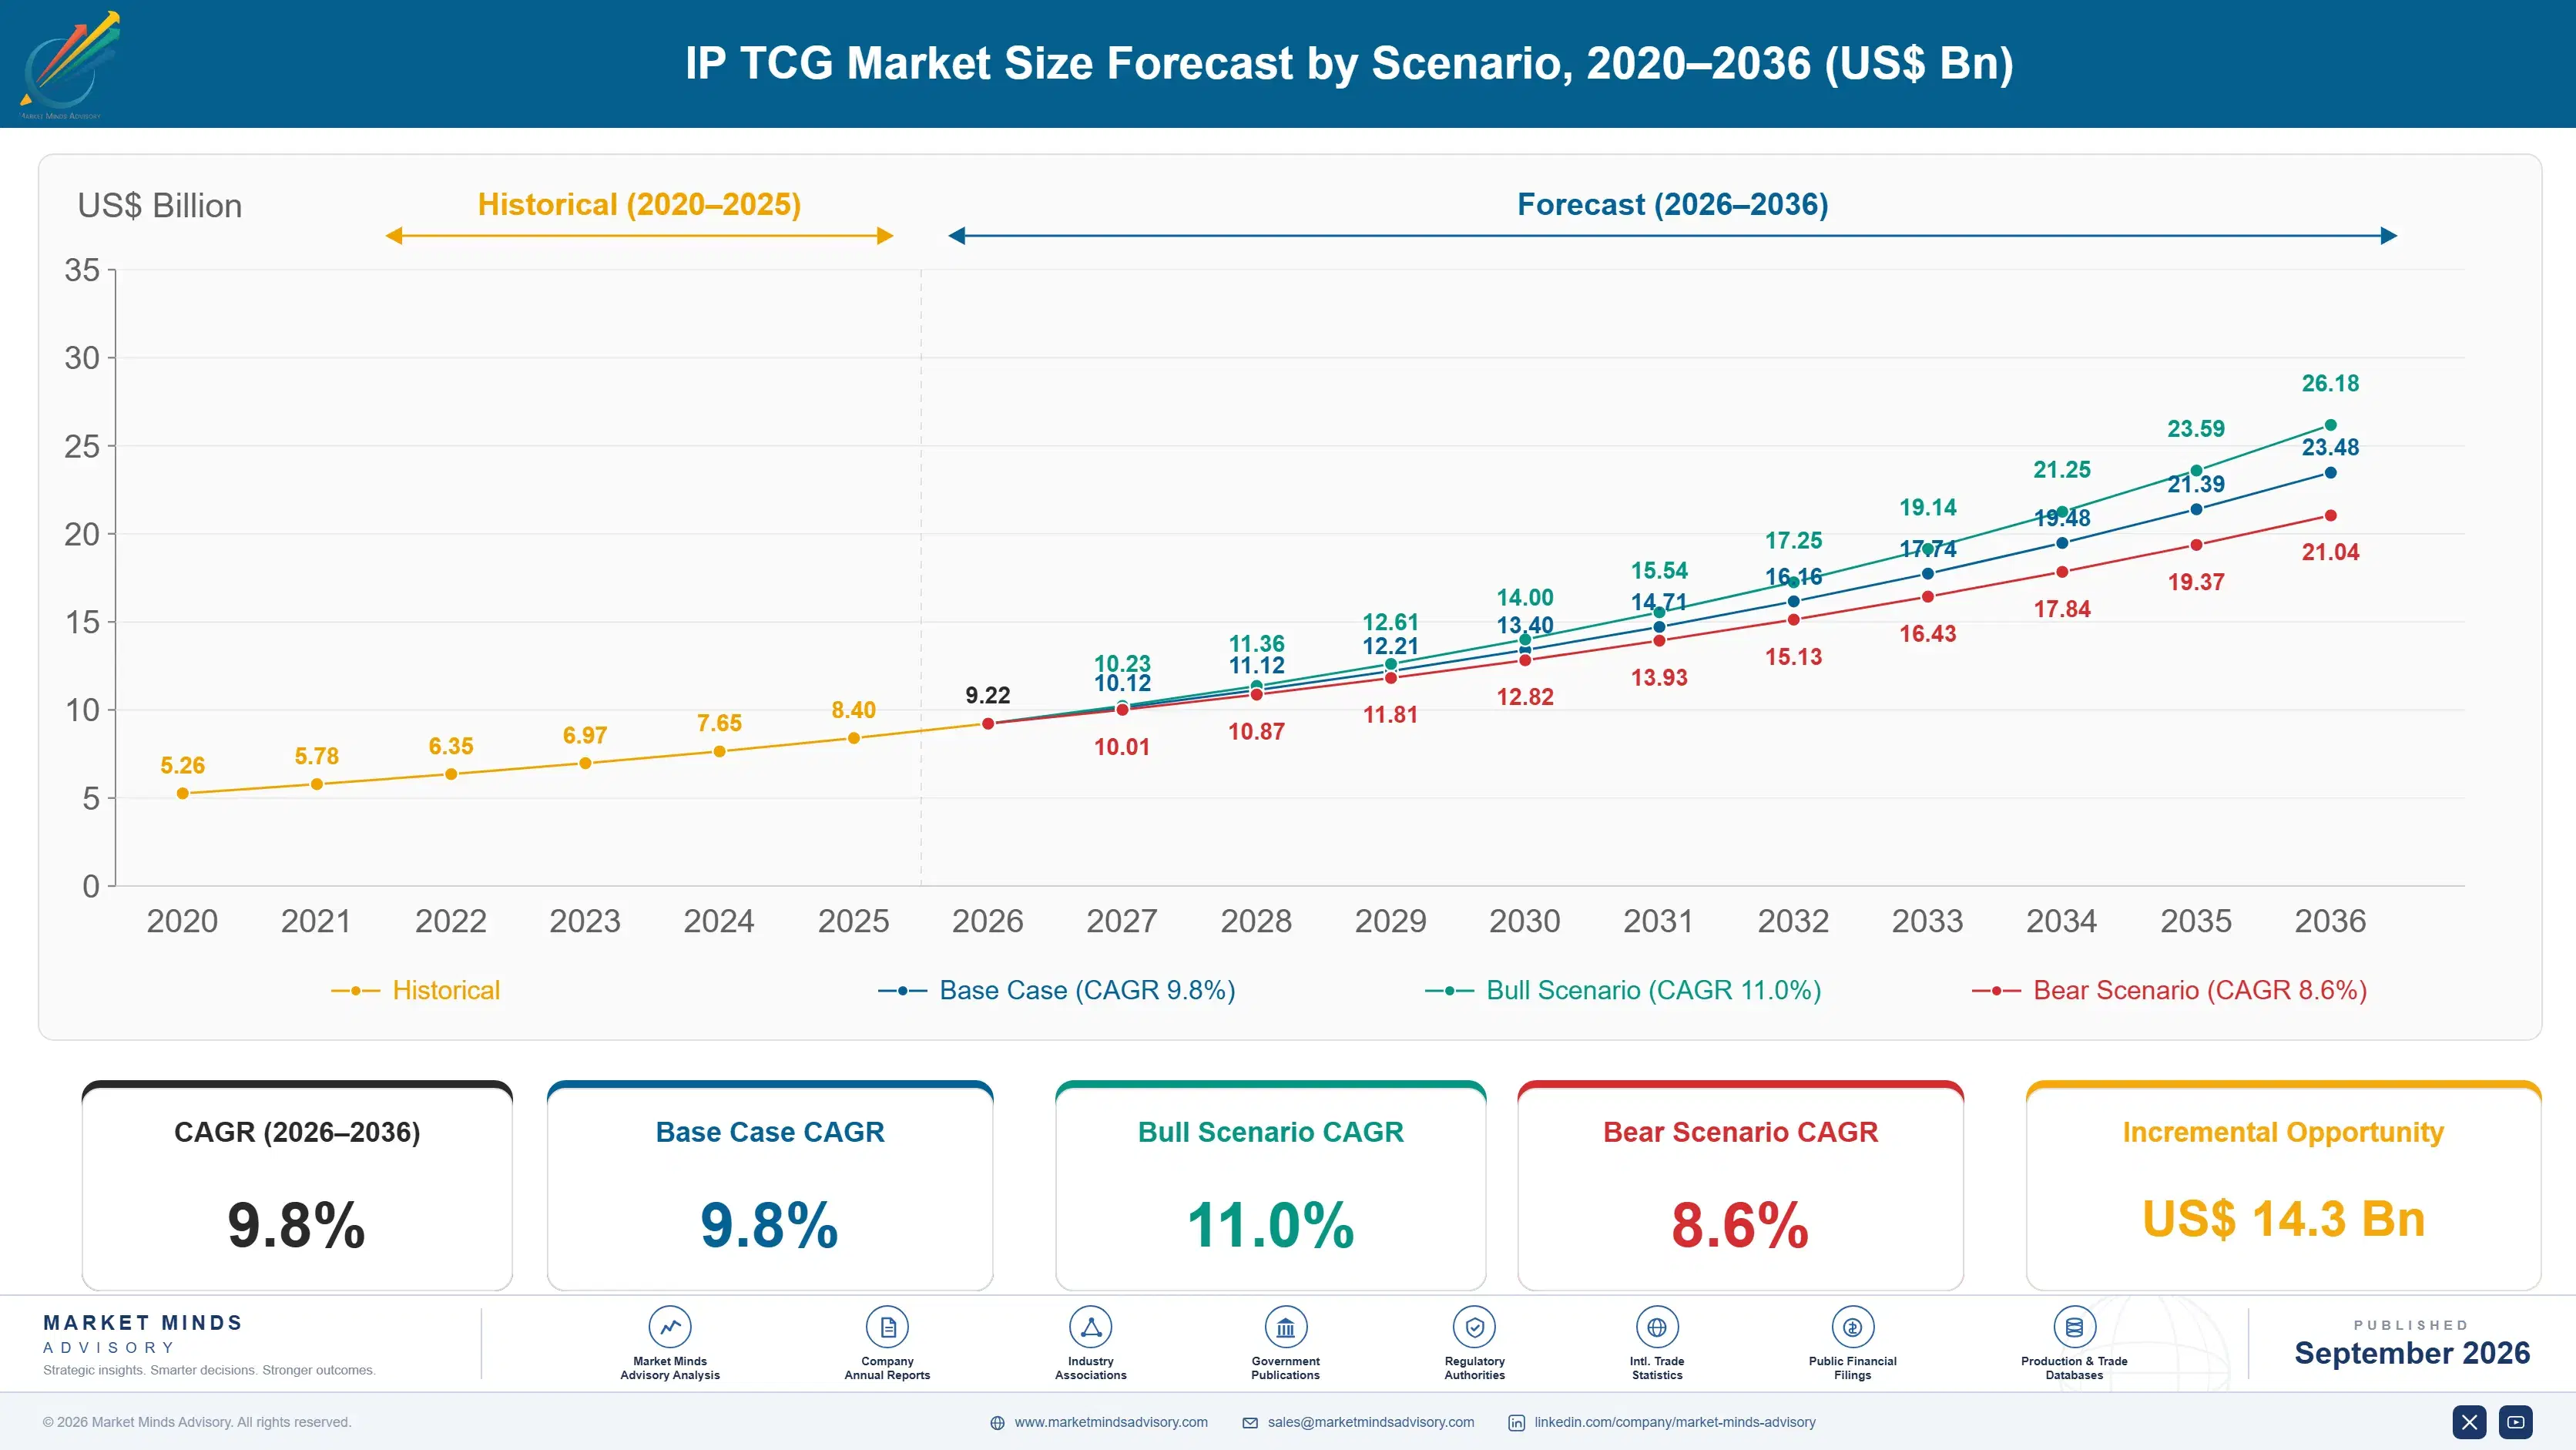
IP TCG Market Forecast Scenarios

ip-tcg-market-size-forecast-scenario-1788454996478
Growth ran at 8.4% from 2020 to 2025 across a period containing a speculative surge and a correction the industry has not finished absorbing. Scarcity chasing during the surge damaged retailer relationships badly, since stores allocated shelf space to product they could not obtain and then held product nobody wanted. Several licensed launches arrived during that window with enormous properties and no organised play.
The base case at 9.8% rests on three mechanisms. New properties continue entering the category because a card game monetises an audience without the production cost of a film, and licensors noticed. Premium collector products carry margin that royalties near 14% of wholesale otherwise remove. Third, organised play investment among the publishers who maintained it is producing the retention that separates a durable game from a licensed product with a good first quarter.
The bull case at 11.0% assumes several current launches establish competitive communities rather than remaining collectibles, which would extend their revenue by years. The bear case at 8.6% is that publishers continue treating organised play as a discretionary cost, at which point second year retention near 31% falls further and the category becomes a sequence of launches rather than a set of games.

What the Licence Cannot Do

A famous property brings people to a first purchase and does nothing afterwards. Second year retention across licensed card games sits near 31%, which is the clearest statement available about what a licence actually delivers. The games that endured built competitive structure, organised play and a reason to buy the next set. The others became a shelf of product with a beloved character on the front.
TOP FIVE CONCENTRATION68%Highly concentrated among established card game publishers globally
LICENCE ROYALTY RATE14%Share of wholesale value paid to the property owner
ORGANISED PLAY COST SHARE6%Publisher revenue spent supporting store level tournament play
SECOND YEAR RETENTION31%First year buyers still purchasing product twelve months later
PRINT RUN LEAD TIME9 monthsPeriod between print decision and product reaching shelves
SECONDARY PRICE VOLATILITY42%Typical annual swing in aftermarket value per set
The commercial arithmetic makes this harder than it looks. Royalties near 14% of wholesale plus minimum guarantees mean a licensed game must reach substantial volume before it earns anything, which pushes publishers toward premium products for margin and away from organised play. That is precisely backwards, since organised play at around 6% of revenue is the mechanism that produces the volume the royalty structure demands in the first place.
Print runs make everything worse. The gap between deciding to print and product reaching shelves runs about 9 months, so a publisher commits volume against demand it cannot yet observe. Under-printing creates scarcity, drives secondary prices, attracts speculators and inflates apparent sell-through. Over-printing collapses secondary value and the collectible premise with it. Aftermarket swings near 42% annually result from decisions taken three quarters earlier.
"The licence sells the first box and organised play sells the next thirty. Publishers keep funding the first and cutting the second, then express surprise when a game with a globally famous property behind it stops selling in its eighteenth month."
Director, Interactive Entertainment and Collectibles Practice · MMA Packaging Practice · September 2026

Market Trends

Licensors Discover Cards Monetise Without Production Cost

A card game turns an existing audience into recurring revenue without the production expense of a film, a series or a game development studio, which is an unusually attractive proposition for a property owner with an established fan base and no obvious next release. New licensed entries continue arriving on that reasoning. The consequence is a category where properties are plentiful and the design and organised play capability to sustain them is genuinely scarce. Licensors are learning that the second part is not purchasable. Design capability and store networks are not available on a licence.
Market Impact: Costs around 6% of revenue
Premium Products Absorb Margin the Royalty Removes

Royalty rates near 14% of wholesale plus minimum guarantees leave a licensed game earning considerably less per unit than an original property, which pushes publishers toward premium collector products where price supports the structure. Those products grow at 14.7%, faster than anything else here. The risk is that premium products serve collectors rather than players, and a game whose revenue tilts toward collectors loses the competitive community that gave the cards value. Several publishers are drifting in that direction without noticing. Nobody decided to become a collectibles business, and the arithmetic decided it for them.
Market Impact: Advantage expires within 1 year

Market Opportunities and Growth Drivers

Organised Play Converts Buyers Into Players

A person who buys a box because they love the property becomes a customer for years only if they start playing, and playing requires somewhere to play with other people who also learned the rules. Store level tournament support costing around 6% of publisher revenue is the mechanism that produces that, and there is no substitute for it. Publishers maintaining organised play show second year retention far above the 31% category figure. It is the least glamorous line in the budget and the one that decides everything. The retention curve is the only honest scoreboard here.
Market Impact: Commits volume 9 months early

Established Properties Reduce Launch Risk Substantially

Introducing a new card game normally requires teaching an audience both a fictional world and a rule set simultaneously, and a licensed property removes half of that entirely. Players arrive already knowing who the characters are and why they should care, which shortens the learning curve and improves first purchase conversion considerably. That advantage is real and it expires within about a year. What happens after depends entirely on whether the game underneath was worth learning properly. Publishers frequently mistake that first year advantage for evidence the game is working. It is not.
Market Impact: Takes 14% before any margin

Market Restraints and Challenges

Print Decisions Precede Demand by Three Quarters

About 9 months separate a print commitment from product reaching shelves, so a publisher chooses volume against demand it cannot observe and will not observe until the decision is irreversible. The root cause is manufacturing lead time in a category where card stock, foiling and packaging all run on scheduled capacity. Commercially this produces either scarcity that attracts speculators or surplus that destroys secondary value. Mitigation runs through staged printing and reprint commitments, which reduce the error without removing it. Nobody in this industry has solved the forecast, and the good publishers hedge it.
Market Impact: Royalties near 14% of wholesale

Royalties Consume Margin Before Anything Else Does

Rates near 14% of wholesale plus minimum guarantees mean a licensed game must reach substantial volume before it earns, which changes every subsequent decision the publisher makes. The root cause is that property owners price against the audience they bring rather than against the risk the publisher carries. Commercially this pushes publishers toward premium products and away from organised play investment. Mitigation runs through structures tying royalty to sustained performance rather than to volume, which few licensors currently accept. The licensor prices the audience it brings and the publisher carries everything that happens afterwards.
Market Impact: Fastest segment at 14.7% growth
4 additional market trends, 3 additional growth drivers, and 2 additional restraints and challenges are covered in the full report. Contact sales@marketmindsadvisory.com to access the complete intelligence.

Segment CAGR and Growth Architecture

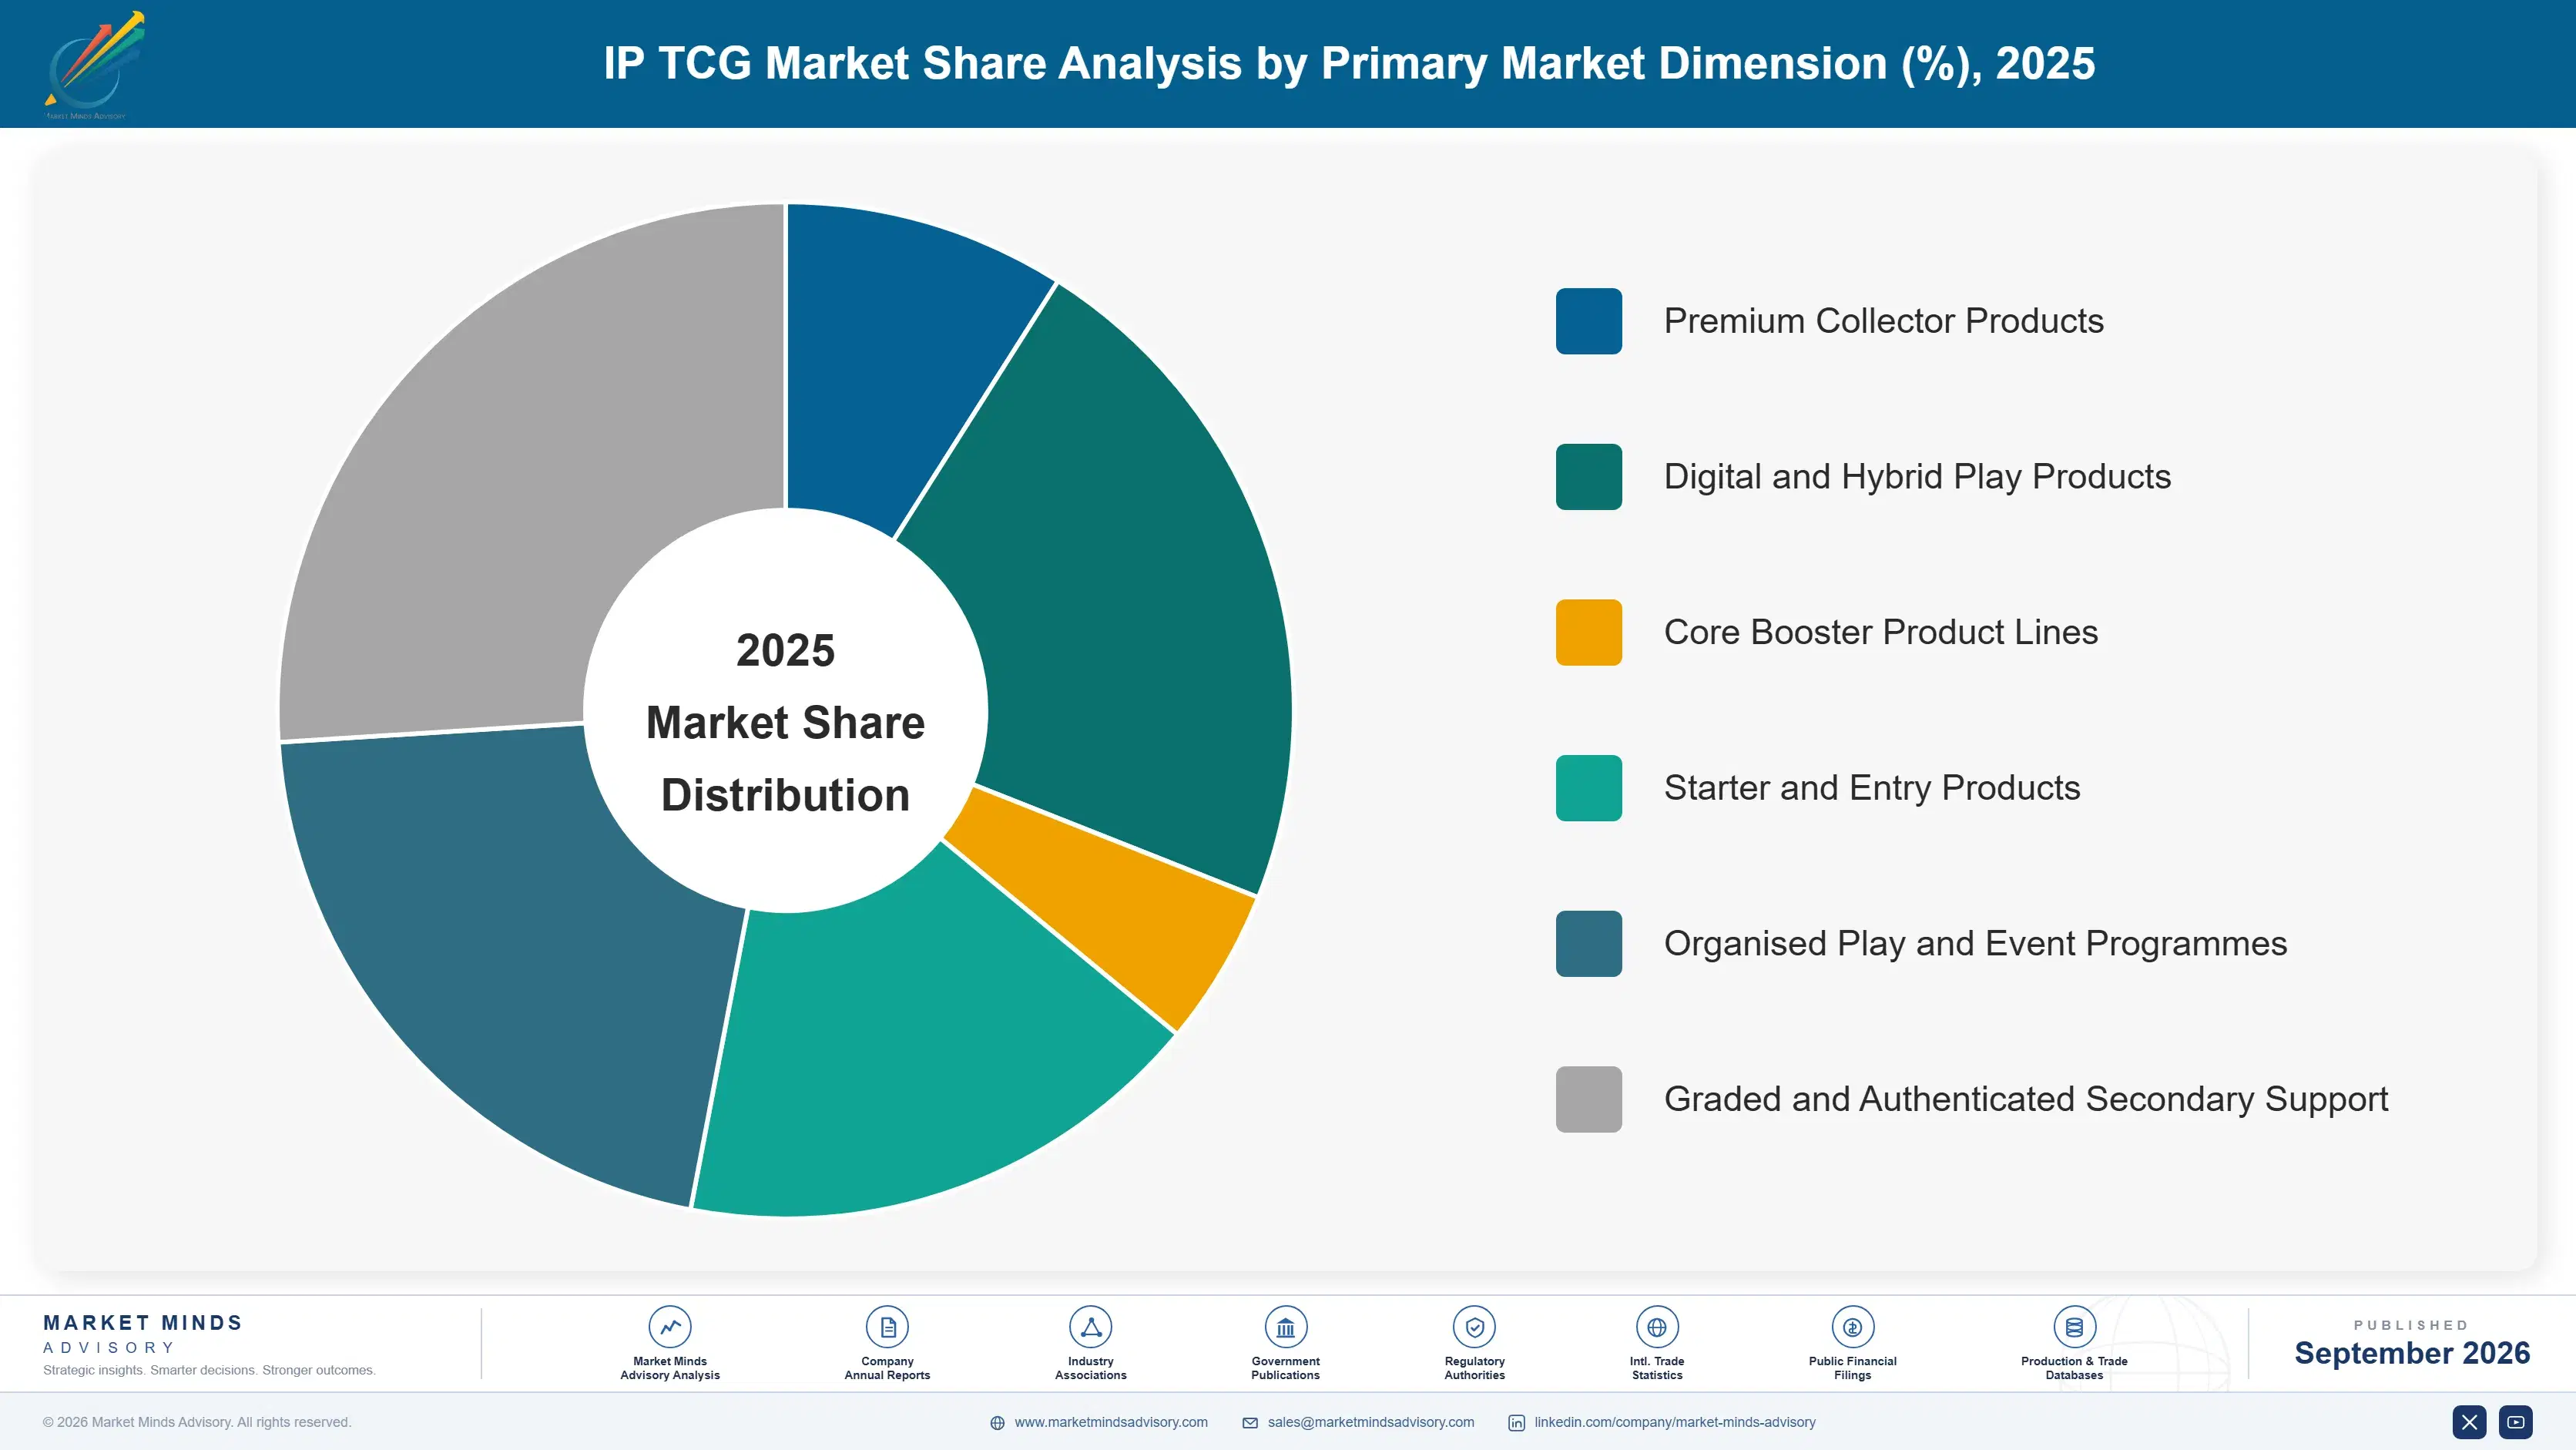
Segmentation follows product type, because product type determines whether the buyer is a player or a collector and those two behave nothing alike. A player buys repeatedly at modest value and needs somewhere to play. A collector buys occasionally at high value and needs to believe the secondary market will hold, which is a considerably more fragile arrangement.
ip-tcg-market-market-share-analysis-1788454997047

Premium Collector Products

Premium collector products grow at 14.7%, half again the market rate of 9.8%, principally because royalty rates near 14% of wholesale leave publishers hunting margin that ordinary boosters cannot provide. High value sets, alternate art treatments and limited configurations carry price points that absorb the licensing structure comfortably. The commercial danger is that these products serve collectors rather than players, and a game whose revenue tilts toward collectors gradually loses the competitive community that made the cards worth collecting. Several publishers are drifting that way without any deliberate decision having been taken. Collectors also buy on secondary market perception rather than on play value, which makes premium revenue considerably more volatile than player revenue ever is.
CAGR 14.7%

Digital and Hybrid Play Products

Digital and hybrid products grow at 12.6% by solving the problem that a physical card game requires another person in the same room, which is the single largest obstacle to a new player continuing past their first purchase. Digital play teaches rules, provides opponents at any hour and returns players to physical product once they are committed. It also cannibalises nothing, since digital and physical audiences overlap heavily rather than substituting. The execution difficulty is that a good digital client is a substantial software product, and publishers keep underestimating what building one properly involves. A poor client damages the game's reputation more than having no client at all does, which several publishers have demonstrated at their own expense.
CAGR 12.6%
Full segment breakdown across 6 segments available in the complete report.

Regional Architecture and Country Demand Map

Demand follows where the properties originate and where card game culture is established, which are largely the same places. Player base depth rather than population or income explains almost all of the distribution here. Nothing about income or population predicts where these games take hold anywhere.

East Asia

East Asia holds 42%, above the regional band, because the properties, the publishers and the deepest player communities all originate here and have done for three decades. Japanese card game culture supports store level organised play at a density no other market approaches, with dedicated venues in most urban districts. Chinese demand has grown quickly through domestic properties alongside imported ones, and regulatory treatment of random pack purchasing shapes product design there in ways it does not elsewhere. Korean and Taiwanese communities are smaller and unusually competitive in tournament participation. Second year retention across the region runs well above the category figure near 31%, which reflects organised play density rather than any difference in how the properties are marketed.
Share: 42% | CAGR: 10.8% (2026 to 2036)

North America

American demand is the largest single national market outside Japan and behaves differently, with collector and investment purchasing weighted more heavily than player purchasing than anywhere else. That produced the sharpest speculative surge and the most painful correction, and retailer relationships damaged during it are still being repaired. Organised play density is good in urban areas and thin elsewhere, which shows in retention. Growth at 10.6% runs ahead of the market on new licensed entries and on premium products serving a collector base with genuine spending capacity. Second year retention sits close to the category figure near 31%, held down by collector weighting and organised play that is thin outside major metropolitan areas. Premium product mix is the highest anywhere.
Share: 26% | CAGR: 10.6% (2026 to 2036)
Regional intelligence for 5 additional markets available in the complete report: Western Europe, South Asia and Pacific, Latin America, Middle East and Africa, Eastern Europe. Contact sales@marketmindsadvisory.com.
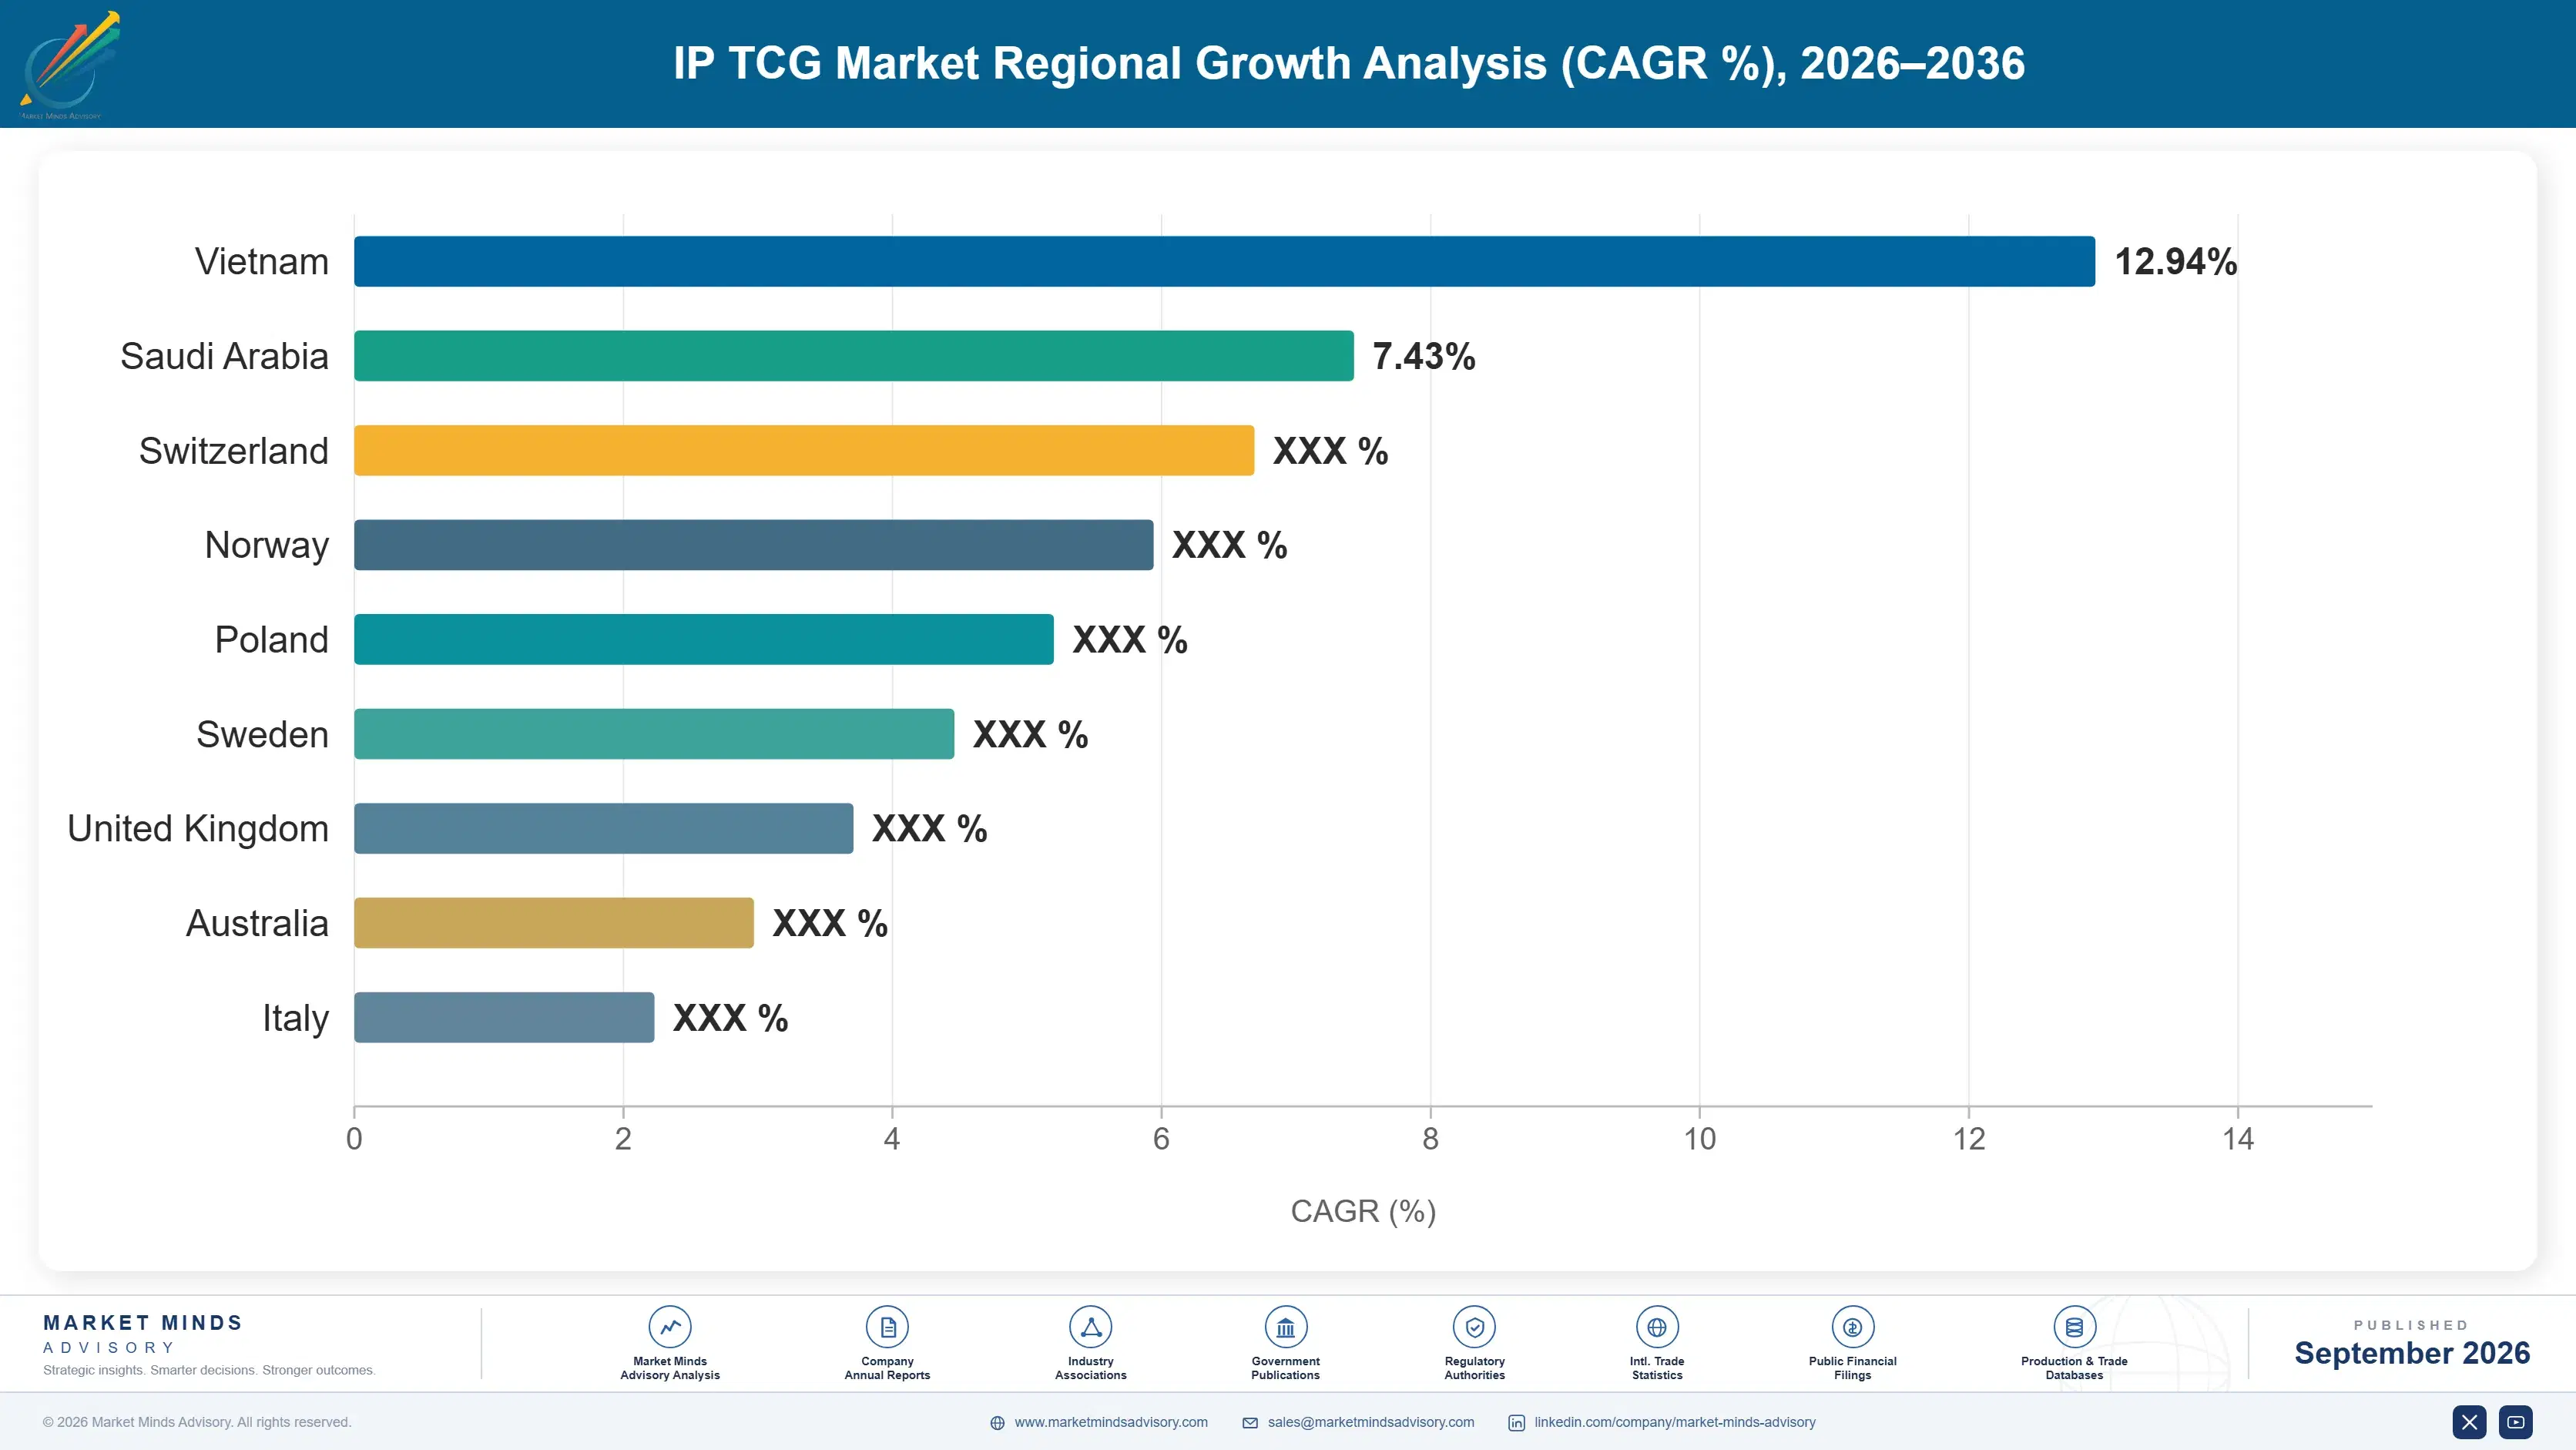
ip-tcg-market-country-cagr-analysis-1788454997563

Funding the Part That Retains

Royalty structures push publishers toward premium products and away from organised play, which is exactly the wrong direction because organised play produces the volume the royalty demands. Everything worth doing here protects the community, manages print risk honestly and treats the licence as an introduction rather than as a business model in and of itself.

Protect Organised Play Before Protecting Margin

Store level tournament support costs around 6% of publisher revenue and is the only mechanism converting a licence buyer into a player who purchases for years rather than months. Publishers maintaining it show second year retention far above the 31% category figure, and the ones who cut it to protect margin watched their game become a collectible with no floor beneath it. Retention differences of roughly 2 times are attributable to organised play investment alone. It is the cheapest line in the budget to cut and the most expensive. Nobody cuts it deliberately; they cut it quarterly.
Market Impact: Roughly doubles retention for about 6% of revenue

Stage Print Runs Against Observed Demand

Roughly 9 months separate a print commitment from shelves, so a publisher guesses volume and then lives with either scarcity that invites speculators or surplus that destroys secondary value. Staged printing with committed reprint windows reduces the error and signals to retailers that product will be available, which is what repairs the relationships the last surge damaged. Publishers using staged commitments report allocation disputes falling by around 60%. Retailers value predictability considerably more than they value scarcity. Scarcity flatters a launch quarter and costs the shelf space that carries the following three years.
Market Impact: Cuts retailer allocation disputes by around 60% overall

Negotiate Royalty Against Sustained Multi-Year Performance

Rates near 14% of wholesale plus minimum guarantees price the licence against the audience it brings rather than against the multi-year risk the publisher carries, which distorts every subsequent decision toward short term margin. Structures tying a portion of royalty to second and third year performance align the licensor with retention rather than with launch volume. Publishers securing such terms improve organised play funding by around 30%. Few licensors currently accept them, and the ones who do are dealing with publishers who explained why. A licensor aligned to retention behaves completely differently in year two.
Market Impact: Improves organised play funding by around 30% overall

Build the Digital Client Properly or Not at All

A physical card game needs another person in the same room, which is the largest obstacle to a first-time buyer continuing, and digital play removes it by teaching rules and providing opponents at any hour. It cannibalises almost nothing, since audiences overlap heavily rather than substituting. A poor client damages the game's reputation more than no client does, and publishers underestimate what building one properly costs by roughly 3 times. Half-finished digital products have harmed several launches badly. Teaching the rules without requiring another person present is the whole value proposition. Nothing else does it.
Market Impact: Underestimated by publishers by roughly 3 times overall

Who Controls the Margin Pool

Concentration sits near 68% across the top five on measured publisher revenue, among the highest in consumer products, and it reflects how few organisations hold both the design capability and the organised play infrastructure required. Licensed properties are widely available. The capability to build a game somebody plays for a decade, and the store network to support it, are held by a small number of publishers who spent years constructing both.
Competition runs on three dimensions. Organised play network depth is first and least visible, since it determines whether a licence buyer becomes a player at all. Second is design capability, which cannot be licensed and takes years to build. Third is print and allocation discipline, where retailer trust damaged during the last surge is still being repaired and predictability now matters more than scarcity.

Two pressures will move positions. Licensors are entering the category faster than the design and organised play capability to serve them is being created, which favours the few publishers who hold both and produces launches that fail on retention. Meanwhile collector weighting is rising with premium products, and publishers drifting that way are quietly trading the community that gives the cards their value.
ip-tcg-market-company-positioning-matrix-1788454998086

Competitive Moat and Risk Dimensions

THE POKEMON COMPANY

Moat: Organised play network depth

The company operates the deepest store level organised play network in the category, built over decades and covering markets where competitors have no presence at all. That network is what converts buyers into players and produces retention nothing else in this market matches. Owning the property outright also removes the royalty structure that constrains every licensed competitor's investment decisions.
THE POKEMON COMPANY

Risk: Collector weighting drift

Premium collector products grow at 14.7% and carry margin that is difficult for any publisher to decline, but a revenue mix tilting toward collectors erodes the player community that gives the cards value in the first place. Speculative purchasing already distorted availability once. Managing that balance requires refusing revenue, which is uncomfortable to explain internally in any organisation.
BANDAI NAMCO

Moat: Property portfolio and design

Bandai Namco holds several major properties internally alongside genuine card game design capability, which removes the royalty structure that constrains licensees and allows organised play investment that royalty-burdened competitors cannot fund. Its Japanese store network is dense and long established. Multiple games across different properties spread exposure across audiences that do not move together.
BANDAI NAMCO

Risk: Western organised play depth

Organised play density outside East Asia is considerably thinner, which shows in retention across Western markets where the same properties are popular and communities are less well supported. Building store networks takes years and cannot be accelerated with marketing spend. Competitors with established Western infrastructure convert the same property interest into players more reliably than the company currently manages.

Players Tracked

Prominent Players

The Pokemon Company
Bandai Namco
Konami
Ravensburger
Wizards of the Coast

Other Key Players

Bushiroad
Kayou
Upper Deck
Panini
Fanatics
Asmodee
Cryptozoic Entertainment
Professional Sports Authenticator
Beckett Collectibles
Certified Guaranty Company
TCGplayer
Cardmarket
Games Workshop
Hasbro
Sanrio

Recent Developments

FEBRUARY 2025

Licensed launches falter on retention despite strong opening quarters

Several card games built on major entertainment properties sold well at launch and lost most of their buyers within a year, having shipped with minimal organised play support. Publishers had funded marketing and premium product while treating tournament infrastructure as a later addition. Retention had not been forecast at all.
Signal: The licence delivers the first quarter and organised play delivers everything afterwards, which launches keep proving.
JUNE 2025

Publishers adopt staged printing to repair retailer relationships

Card game publishers moved to staged print commitments with published reprint windows, following a period in which allocation disputes and unpredictable availability damaged relationships with specialist retailers. Stores reported valuing predictable supply considerably above the scarcity that had inflated earlier sell-through. Scarcity had inflated earlier sell-through figures considerably.
Signal: Retailers want predictability, and the scarcity strategy that inflated sales also cost publishers the shelf space.
OCTOBER 2025

Premium product mix rises as royalty pressure squeezes margin

Publishers of licensed games increased premium and collector product share, seeking margin that royalty rates near 14% of wholesale remove from standard product lines. Player-facing product volumes grew more slowly across the same period at several of those publishers. Player-facing volumes fell while headline revenue held steady.
Signal: Royalty structures are pushing publishers toward collectors and away from the players who sustain a game.

What a Set Costs to Publish

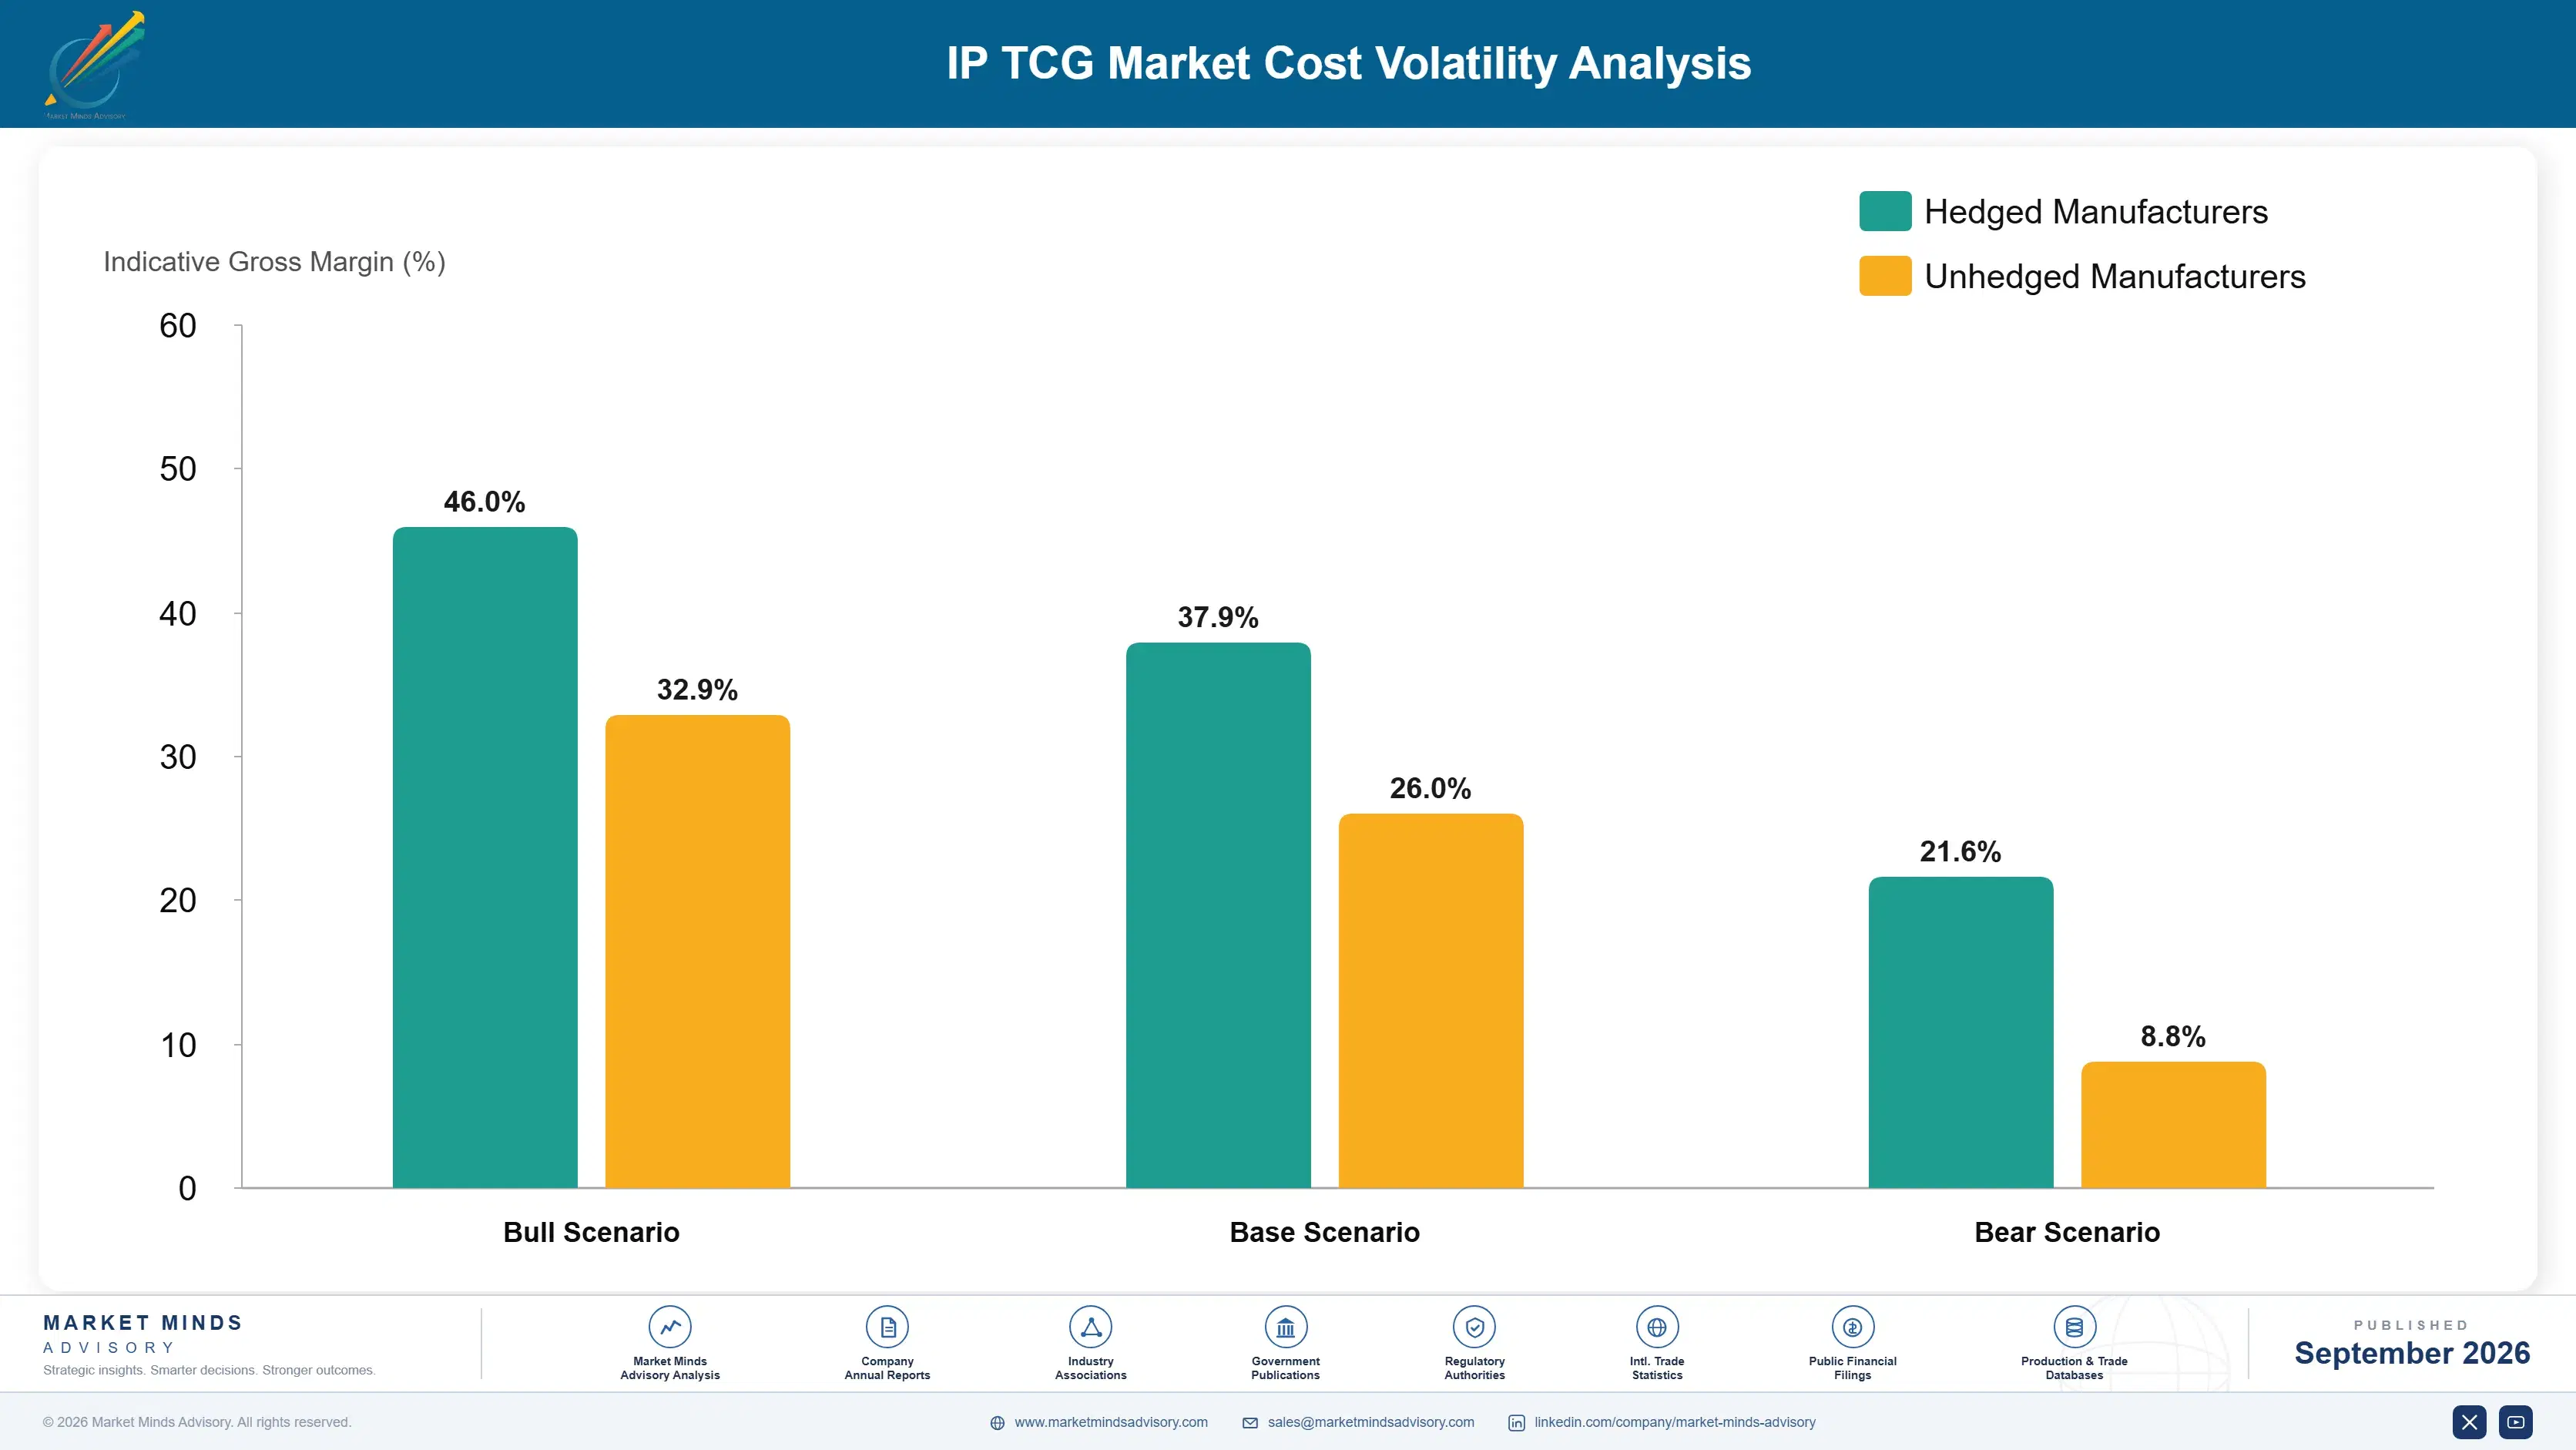
Cost structure is unusual because licensing sits ahead of everything else. Royalties near 14% of wholesale plus minimum guarantees are committed before any card is printed, and card stock, foiling, packaging and print run together account for roughly 31% of remaining cost. Design, development and playtesting form a further block, small in cash terms and enormous in consequence, since it determines whether anybody buys the next set.
Specialty card stock and foiling capacity has been the sharpest pressure. Card printing runs on scheduled capacity across few qualified plants, and premium finishes compete for the same lines, which tightened availability through 2024 and 2025 as premium mix rose. Hasbro and Ravensburger both referenced production and materials cost conditions in recent annual reporting. Publishers absorbed most of it, since retail price points are set well before printing.

Exposure varies by property ownership rather than by scale. Publishers owning their properties avoid royalty and minimum guarantee obligations entirely, which frees roughly a seventh of wholesale value for organised play and design investment. Licensees carry those obligations against volume they must reach before earning anything. That single difference explains most of the investment gap between owned and licensed games, and it compounds annually.
ip-tcg-market-cost-volatility-analysis-1788454998281

Book premium print capacity before the mix shifts

Premium finishes compete for the same scheduled plant capacity as standard product, and premium mix has risen across the whole category simultaneously, which tightens availability for everybody. Booking capacity ahead of a mix decision rather than after it protects both the launch date and the cost. Publishers reacting after committing to a calendar have paid premiums or delayed announced products.

Fund design and playtesting as a retention cost

Design and development are small in cash terms against royalties and printing, and they determine whether anybody purchases the second set, which makes them the highest return spending. Compressing playtesting under schedule pressure is how licensed games arrive with famous properties and poor mechanics. The cost of doing it properly is trivial against the revenue an abandoned game never earns.

Structure minimum guarantees against staged volumes

Guarantees committed against optimistic forecasts convert a soft launch into a loss regardless of later performance, which prices multi-year risk badly. Guarantees staged against achieved volume rather than projected volume share that risk with the licensor. Property owners resist, and the ones who agree are dealing with publishers who demonstrated what happened to the last three launches.

Portfolio Architecture for Margin Defence

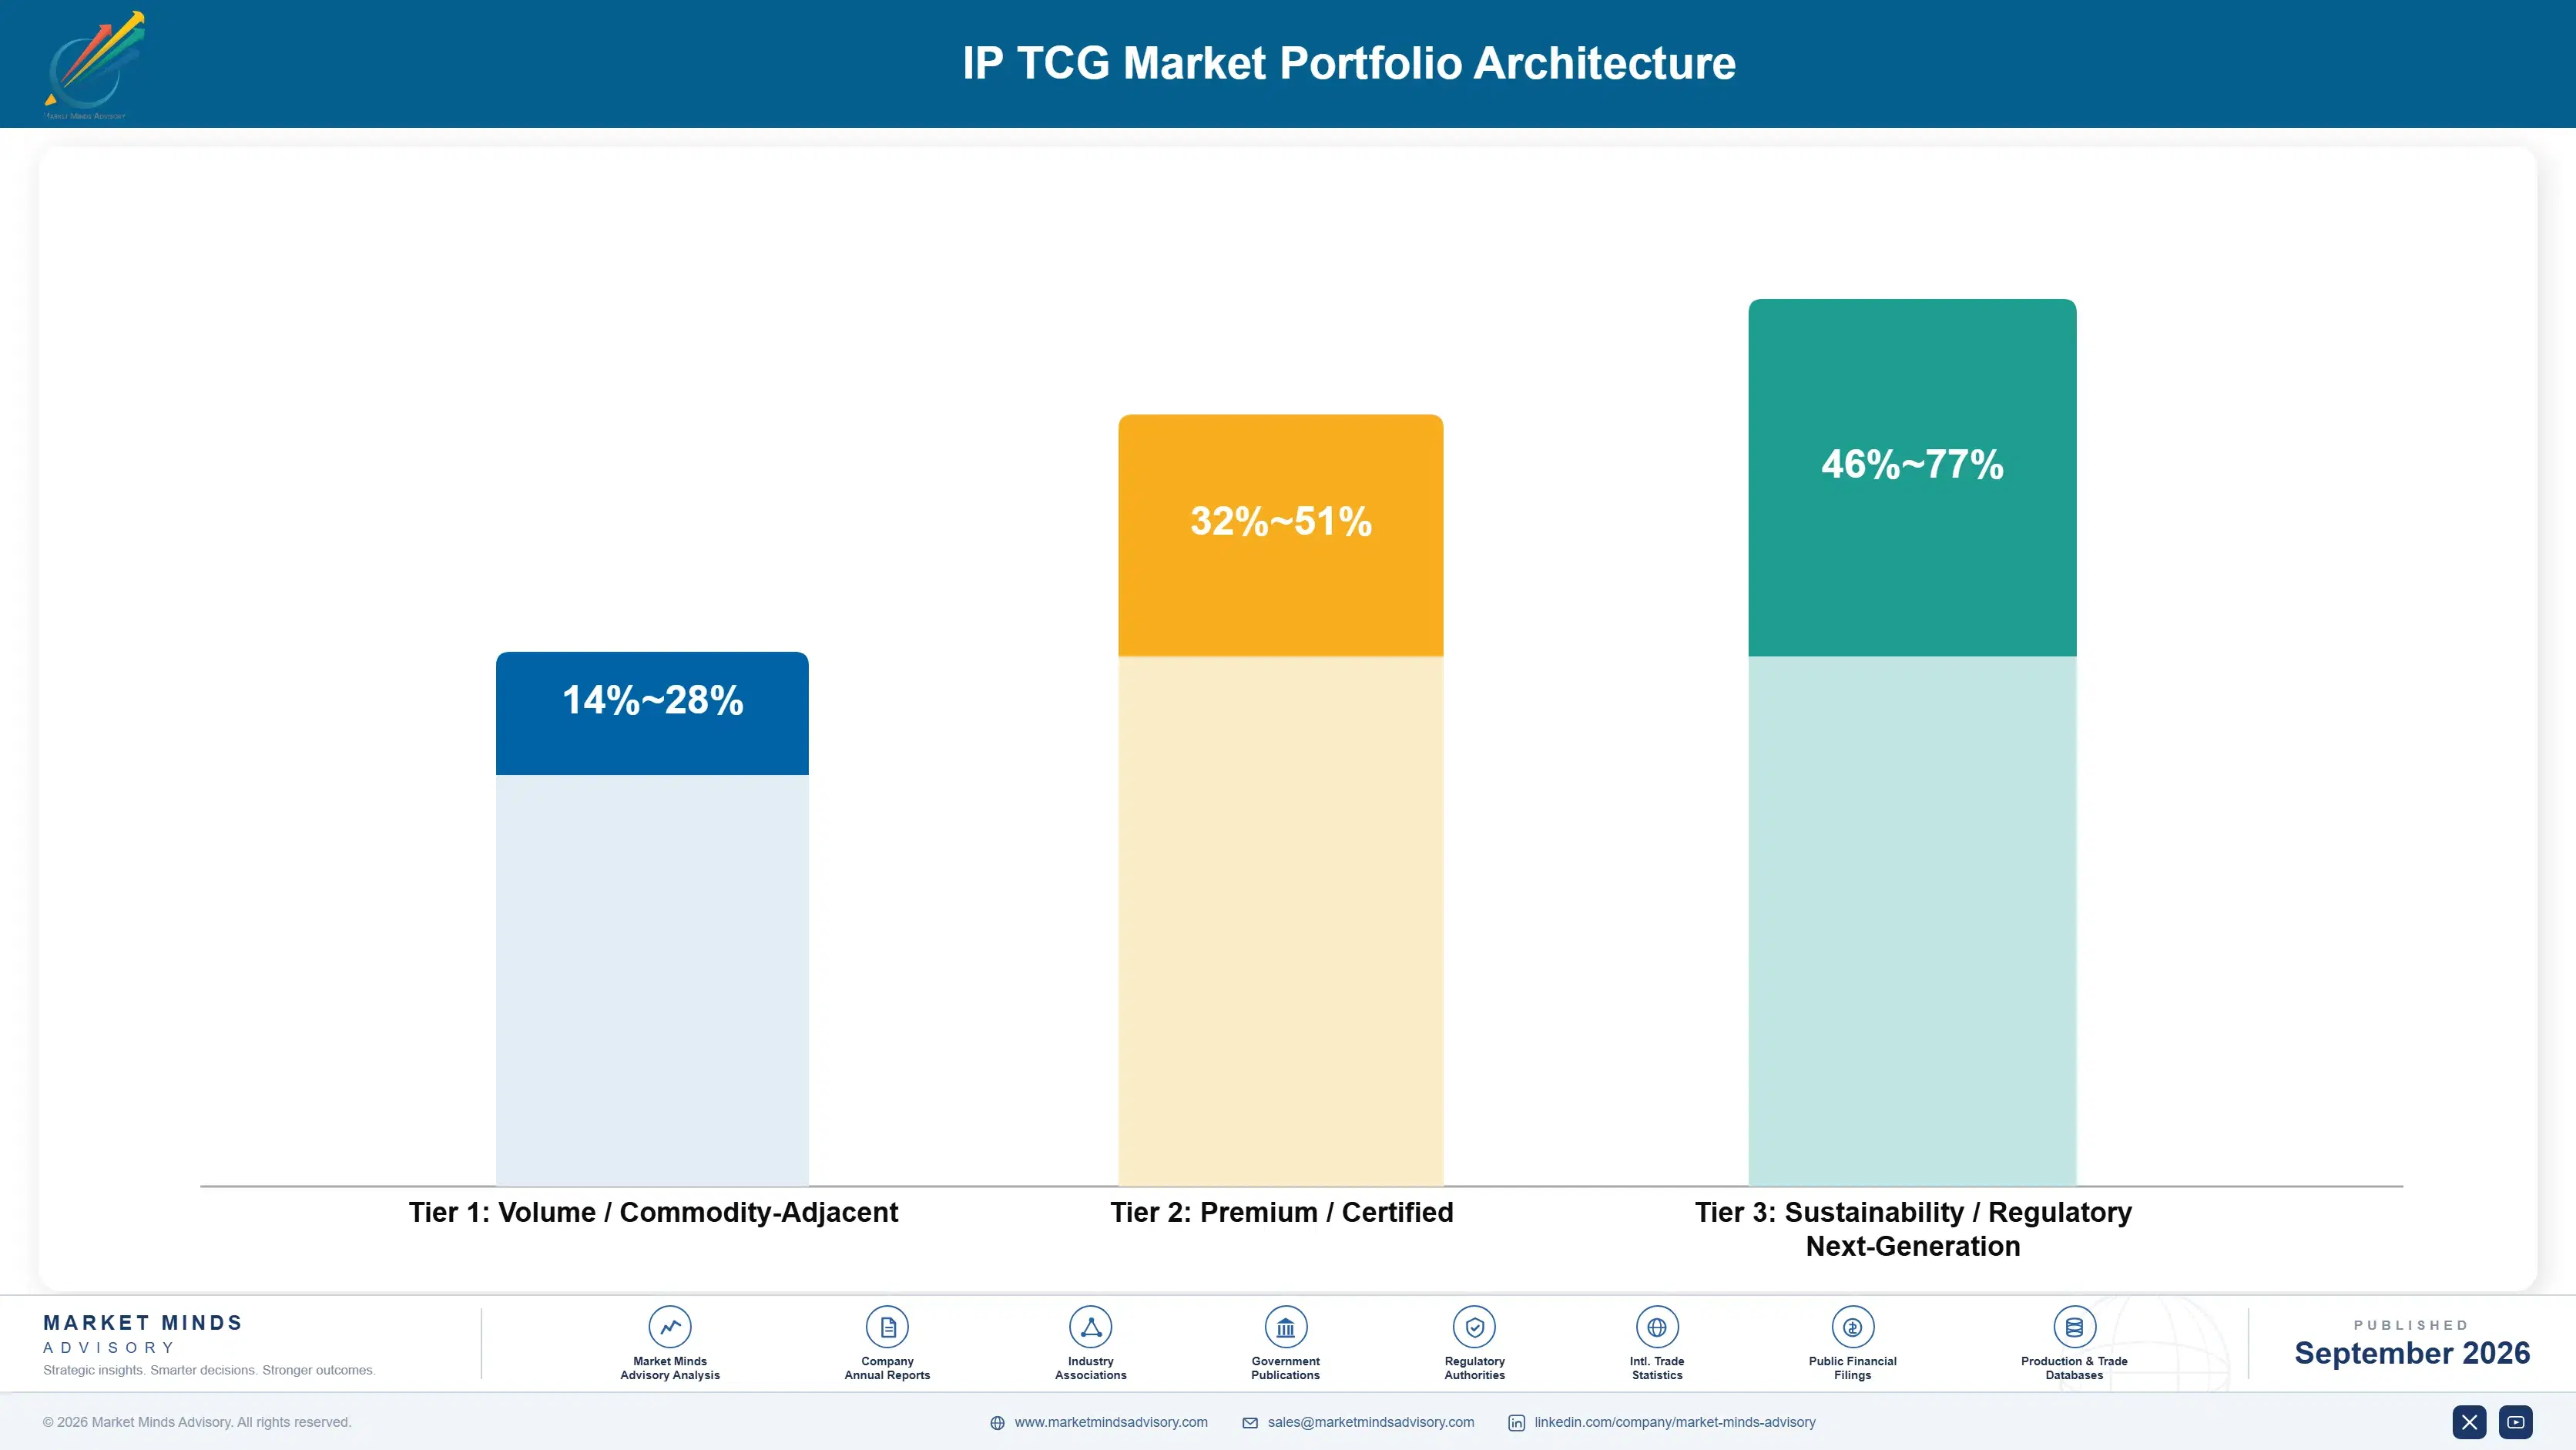
Margin architecture separates on whether the publisher owns the property. An owned property carries no royalty and no minimum guarantee, which frees roughly a seventh of wholesale value for design and organised play. A licensed game carries both before earning anything, which pushes it toward premium products and away from the community investment that produces durable revenue. The same physical product earns very differently depending on who owns the characters.
The tension runs between collectors and players and it is genuinely difficult. Premium products earn well immediately and serve buyers who may never play. Player-facing product earns modestly and produces the community that gives premium products their value. A publisher optimising for the first destroys the second slowly enough that nobody notices until retention figures arrive, by which point recovering the community takes years.

High-value revenue concentrates in premium collector products and in owned properties. Premium earns most per unit and is defended by nothing except the perception of secondary value. Owned properties earn most in aggregate because the royalty never leaves. Organised play is the negative-margin line that makes everything else work, which is why it keeps being cut by people reading a spreadsheet rather than a retention curve.

Volume / Commodity-Adjacent

Starter products, entry sets and standard booster lines carrying full royalty and minimum guarantee obligations. The range separates owned properties from licensed ones more than it separates publishers. Volume here builds the player base everything else depends upon.
Gross Margin: 14-28%

Premium / Certified

Premium collector products, alternate treatments and limited configurations priced to absorb licensing structures. Margin depends on secondary market perception rather than on production cost. Serves collectors who may never play the game at all.
Gross Margin: 32-51%

Sustainability / Regulatory / Next-Generation

Digital and hybrid play products and owned-property lines carrying no royalty obligation whatever. The widest range in the portfolio, reflecting property ownership and digital development recovery. Highest margin and the hardest position to establish.
Gross Margin: 46-77%
ip-tcg-market-portfolio-architecture-1788454998772

High-value Sub-segments and Strategic Watch-out

Owned Property Lines

High value with steady growth, carrying no royalty or minimum guarantee and therefore freeing roughly a seventh of wholesale value for design and organised play investment. The range reflects property strength and print efficiency. That freed investment compounds annually against licensed competitors who cannot match it.
Gross Margin: 52-77%

Premium Collector Products

High value with the fastest growth at 14.7%, priced to absorb royalty structures and defended by nothing beyond secondary market perception. The range reflects treatment complexity and print scarcity. Publishers drifting toward it are quietly trading the player community that gives these products their value.
Gross Margin: 34-53%

Core Player Product Lines

The volume base, carrying full royalty obligations and earning least while building the community every other line depends upon. The range separates owned from licensed properties. It is the part of the portfolio a spreadsheet argues against and a retention curve consistently defends. Both are right.
Gross Margin: 13-27%

Unsupported Licensed Launches

The strategic watch-out, where a strong property ships without organised play and loses most buyers within twelve months against a category retention figure near 31%. Minimum guarantees make the loss worse. Several launches with globally famous properties have followed this path in the past three years.
Gross Margin: 0-16%

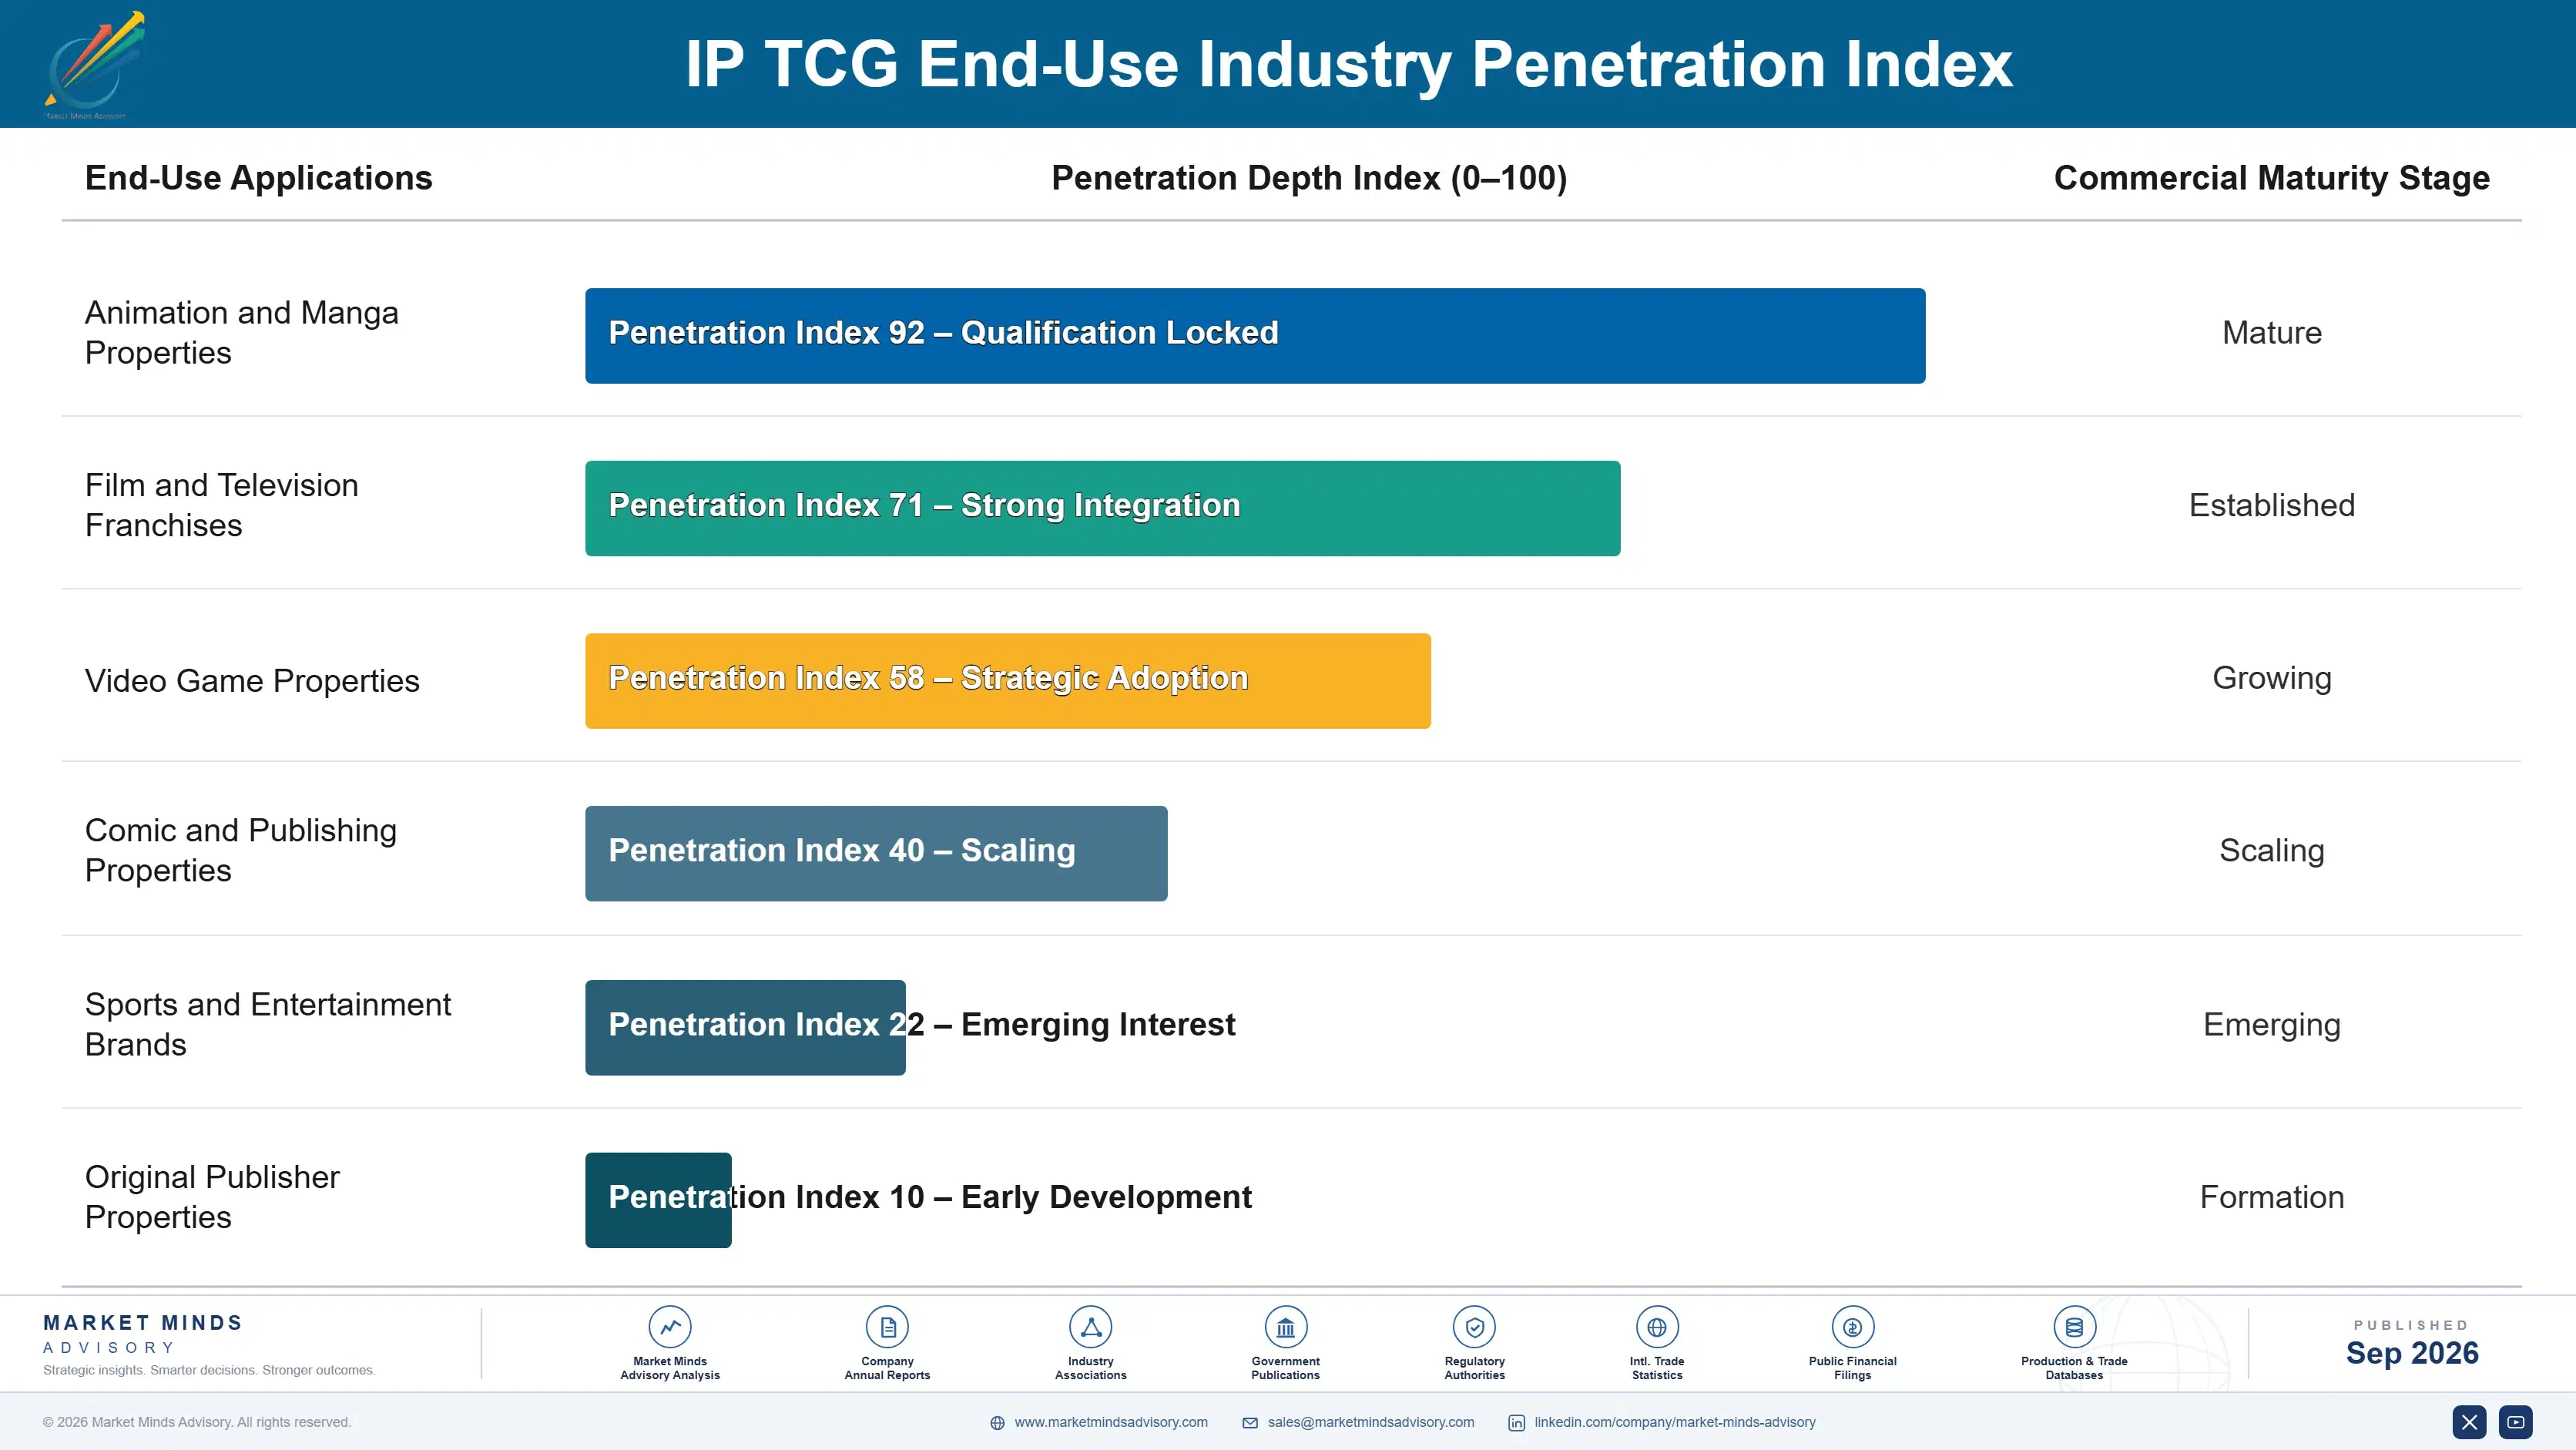
Why Players Keep Buying

Recurrence depends on whether somebody plays. A player buys every set because the game changes and their deck needs to change with it, which produces genuinely predictable repeat purchasing over years. A collector buys occasionally and unpredictably, driven by what the secondary market appears to be doing. A person who bought once because they love the property and never learned the rules buys nothing further, which describes most of those who do not return.
Adoption depth varies entirely with community access. A player with a store running weekly events within reach purchases continuously, teaches others and pulls new buyers in behind them. A player with no local community plays occasionally with friends and drifts away within a year. The strongest predictor of retention here is distance to organised play, which is a distribution question rather than a product one.

The buyer divides rather than shifts. Players buy for the game and respond to design, rotation and events. Collectors buy for perceived value and respond to scarcity and treatment quality. Parents buy for children and respond to price and availability. Publishers optimising for one of the three regularly damage another, and the collector drift underway has the longest delayed consequences.
ip-tcg-market-end-use-penetration-index-1788454999257

What Keeps a Game Alive

These are among the four positions where our research anticipates prominent divergence between winners and laggards over the coming forecast period. Each is grounded in the demand model, the regulatory perimeter, and the announced capacity pipeline.
01 / ORGANISED PLAY FUNDING

Fund the tournaments before protecting the margin

Store level tournament support costs around 6% of publisher revenue and is the only mechanism that converts somebody who bought a box because they love a property into a player purchasing for years afterwards. Publishers maintaining it show second year retention roughly twice the category figure near 31%, and those who cut it to protect margin watched their game become a collectible with no floor. It is the cheapest line in a budget to cut and reliably the most expensive one.
02 / PRINT STAGING DISCIPLINE

Stage the print run and stop chasing scarcity

Roughly 9 months separate a print commitment from product reaching shelves, so a publisher guesses volume and then lives with either scarcity that invites speculators or surplus that destroys secondary value entirely and permanently. Staged printing with published reprint windows reduces the error and signals availability to retailers, and publishers using it report allocation disputes falling by around 60% afterwards. Specialist stores value predictable supply considerably more than they value the scarcity that inflated sell-through during the last surge across the category.
03 / ROYALTY STRUCTURE NEGOTIATION

Tie the licence fee to retention, not to launch

Rates near 14% of wholesale plus minimum guarantees price a property against the audience it brings rather than the multi-year risk a publisher carries, which distorts every subsequent decision toward immediate margin over community investment every single time. Structures tying a portion of royalty to second and third year performance align the licensor with retention, and publishers securing them improve organised play funding by around 30%. Few licensors accept such terms, and those who do generally had the arithmetic explained to them properly.
04 / DIGITAL CLIENT COMMITMENT

Build the digital product properly or skip it

A physical card game requires another person in the same room, which is the single largest obstacle to a first-time buyer continuing past their initial purchase, and digital play removes it by teaching rules and supplying opponents at any hour. It cannibalises almost nothing, since the audiences overlap heavily rather than substituting for one another. Publishers underestimate what a good client costs by roughly 3 times, and a poor one damages a game's reputation more than having none at all.

Engagement Snapshot From the Field

A live engagement with an industry participant carrying material or product regulatory and market exposure ahead of a defining policy shift, showing how our research translates into a defensible multi-year portfolio strategy.
MARKET MINDS ADVISORY · CLIENT ENGAGEMENT SUMMARY
IP TCG Producer Strategic Portfolio Review and Transition Roadmap 2026·Investment Scenario on IP TCG Exposure Evaluation 2025-26
CLIENT PROFILE
An entertainment property owner licensing a globally recognised franchise to a card game publisher, with the game in its second year and shipping across four regions (client-reported, unverified by MMA). Launch quarter performance had been exceptional and quarterly royalties had since fallen by roughly 60% from that peak without any obvious cause either party could identify.
STRATEGIC CHALLENGE
The licensor had assumed the decline reflected publisher marketing effort and was preparing to renegotiate terms or seek an alternative partner (client-reported, unverified by MMA). Annual guaranteed minimums of approximately USD 12 million were becoming difficult for the publisher to meet. Nobody had examined whether anybody was actually playing the game.
MMA APPROACH
MMA measured player activity rather than sell-through, which both parties tracked closely and neither found informative. We surveyed 260 stores across the four regions, counted organised events actually running, interviewed 18 publisher and licensor staff, and compared the programme against retained games using the same distribution channels in each territory.
KEY FINDINGS
  1. Weekly organised events were running in roughly 9% of stores carrying the product, against about 40% for comparable retained games in the same territories.
  2. The publisher had budgeted organised play at under 2% of revenue, because minimum guarantee obligations had consumed the funding earmarked for it.
  3. Second year repeat purchasing measured around 18%, far below the category figure and consistent with buyers who never learned the rules and never came back.
  4. Premium collector product had grown as a revenue share while player-facing product volumes fell, which flattered royalties and concealed the underlying decline.
CLIENT PROFILE
An entertainment property owner licensing a globally recognised franchise to a card game publisher, with the game in its second year and shipping across four regions (client-reported, unverified by MMA). Launch quarter performance had been exceptional and quarterly royalties had since fallen by roughly 60% from that peak without any obvious cause either party could identify.
STRATEGIC CHALLENGE
The licensor had assumed the decline reflected publisher marketing effort and was preparing to renegotiate terms or seek an alternative partner (client-reported, unverified by MMA). Annual guaranteed minimums of approximately USD 12 million were becoming difficult for the publisher to meet. Nobody had examined whether anybody was actually playing the game.
MMA APPROACH
MMA measured player activity rather than sell-through, which both parties tracked closely and neither found informative. We surveyed 260 stores across the four regions, counted organised events actually running, interviewed 18 publisher and licensor staff, and compared the programme against retained games using the same distribution channels in each territory.
KEY FINDINGS
  1. Weekly organised events were running in roughly 9% of stores carrying the product, against about 40% for comparable retained games in the same territories.
  2. The publisher had budgeted organised play at under 2% of revenue, because minimum guarantee obligations had consumed the funding earmarked for it.
  3. Second year repeat purchasing measured around 18%, far below the category figure and consistent with buyers who never learned the rules and never came back.
  4. Premium collector product had grown as a revenue share while player-facing product volumes fell, which flattered royalties and concealed the underlying decline.
RECOMMENDED STRATEGY
Phase 1: Restructure minimum guarantees so the publisher can fund organised play, since the guarantee is currently consuming exactly what would sustain the game. Phase 2: Tie a portion of royalty to second year repeat purchasing, which aligns the licensor with retention rather than with launch volume alone. Phase 3: Measure store level event participation monthly, since sell-through concealed a decline that event counts would have shown a year earlier.
OUTCOME
Guarantees were restructured against staged volumes and organised play funding rose to roughly 5% of revenue (client-reported, unverified by MMA). Weekly events reached about 26% of stocking stores within a year, and second year repeat purchasing recovered to around 29% across all four regions covered by the engagement.

Frequently Asked Questions

Foundational context covering the market sizes, CAGR, scope, country, region and competition that inform every finding below. This section is provided to cover basics and most often pre-purchase conversations, answered from the MMA Primary Research Dataset.

What is the current size of the IP TCG Market?

The market was worth USD 8.4 billion in 2025 and reaches USD 9.22 billion in 2026. Licence royalties run near 14% of wholesale value plus minimum guarantees.

How large will the IP TCG Market be by 2036?

MMA forecasts USD 23.48 billion by 2036, an expansion of 2.55 times over the forecast period. That represents USD 14.26 billion of incremental annual revenue against 2026.

What is the CAGR for the IP TCG Market 2026 to 2036?

The base case is 9.8% compound annual growth, with a bull case at 11.0% and a bear case at 8.6%. Organised play investment separates the scenarios most clearly.

Which segment is growing fastest?

Premium collector products grow at 14.7%, half again the market rate of 9.8%. Publishers pursue margin that royalty rates near 14% of wholesale otherwise remove.

Who are the major companies in the IP TCG Market?

The Pokemon Company, Bandai Namco, Konami, Ravensburger and Wizards of the Coast lead on measured publisher revenue. Together they hold roughly 68%, among the highest concentration in consumer products.

Which country is growing fastest?

Indonesia grows fastest at 13.2%, on a young population and card game culture spreading through social media rather than through traditional retail or specialist hobby stores.

Report Segmentation Architecture

The full report scope spans multiple orthogonal segmentation dimensions, with cross-tabulated demand data provided for each dimension pair. Coverage extends further to regional breakdowns, trend trajectories, and the competitive detail needed to support segment-level decision-making.

By Primary Market Dimension

  • Premium Collector Products
  • Digital and Hybrid Play Products
  • Core Booster Product Lines
  • Starter and Entry Products
  • Organised Play and Event Programmes
  • Graded and Authenticated Secondary Support

By End-Use Industry

  • Animation and Manga Properties
  • Film and Television Franchises
  • Video Game Properties
  • Comic and Publishing Properties
  • Sports and Entertainment Brands
  • Original Publisher Properties

By Commercial Dimension

  • Specialist Hobby Retail
  • Mass Market and Grocery Retail
  • Direct to Consumer Sales
  • Organised Play Programmes
  • Digital Platform Distribution
  • Distributor and Export Channels

By Region

  • East Asia
  • North America
  • Western Europe
  • South Asia and Pacific
  • Latin America
  • Middle East and Africa
  • Eastern Europe

Scope, Methodology, and Coverage

Every figure in this report is reproducible from documented input assumptions. The scope below maps the historical period, the forecast horizon, the segmentation dimensions, and the countries covered, alongside the underlying primary and qualitative methodology.
Historical Period
2020 to 2025
Forecast Period
2026 to 2036
Base Year
2025 (USD billions; MMA Primary Research Dataset, September 2026)
Market Definition
This market covers trading card games built on licensed entertainment properties and their directly attached programmes, spanning premium collector products, digital and hybrid play products, core booster product lines, starter and entry products, organised play and event programmes, and graded and authenticated secondary support. Revenue is measured at publisher level including attributable organised play, digital play and licensing-related income. Original intellectual property card games without an external licence, collectible sports and entertainment cards lacking game mechanics, board and tabletop games, secondary market transaction value between collectors, grading service fees charged to consumers, and licensed merchandise outside card products are excluded from scope.
Quantitative Units
USD billions, publisher level revenue including attributable programme income
Segmentation Dimensions
Product type, property category, retail channel, region
Regions Covered
East Asia, North America, Western Europe, South Asia and Pacific, Latin America, Middle East and Africa, Eastern Europe
Countries Covered
Japan, China, South Korea, Taiwan, Hong Kong, Singapore, Indonesia, Philippines, Thailand, Malaysia, Australia, New Zealand, United States, Canada, Mexico, Brazil, Argentina, Chile, Germany, France, United Kingdom, Italy, Spain, Netherlands, Belgium, Poland, Czechia, Hungary, United Arab Emirates, Saudi Arabia, South Africa
Key Companies Profiled
The Pokemon Company, Bandai Namco, Konami, Ravensburger, Wizards of the Coast, Bushiroad, Kayou, Upper Deck, Panini, Fanatics, Asmodee, Cryptozoic Entertainment, Professional Sports Authenticator, Beckett Collectibles, Certified Guaranty Company, TCGplayer, Cardmarket, Games Workshop, Hasbro, Sanrio
Quantitative Methodology
Primary survey, n=3,800 respondents, Q4 2025, six countries; demand-side model with trade association cross-validation
Qualitative Methodology
47 expert interviews, Q4 2025; applied to validate demand model assumptions, identify emerging dynamics, and assess competitive positioning
Report Format
PDF and XLSX data workbook (Word format preview document)
Publisher
Market Minds Advisory
Report Code
MMA-2026-PAC-081
Published
September 2026
Contact
sales@marketmindsadvisory.com | www.marketmindsadvisory.com

Purchase the full IP TCG Market Report (2026 to 2036).

The full MMA report separates what a licensed property actually delivers from what publishers assume it delivers, and quantifies the organised play investment that decides whether a game survives its second year. It sizes the market to 2036 across six product types, seven regions and 31 countries, with segment growth rates and regional demand mechanisms detailed. Competitive analysis covers 20 publishers and participants assessed on measured publisher revenue, with moat and risk assessment for the two leaders. The report quantifies royalty and production cost structure, print staging economics and margin architecture across three portfolio tiers. It closes with four verdicts and an anonymised licensor engagement.
Six product types sized through 2036
Seven regions with demand mechanism analysis
Twenty participants on consistent revenue basis
Retention, royalty and print lead benchmarks
Margin architecture across three portfolio tiers
Anonymised entertainment licensor card programme engagement

Built For The People Who Decide

From boardroom strategy to bench-side execution, this report is read cover-to-cover by leaders shaping the next decade of their industry, turning demand scenarios, market dynamics and valuation benchmarks into decisions.
CXOs/ Presidents/ VPs/ Managers
M&A and Corporate Development
Strategy Teams and R&D Heads
Procurement and Product Directors
Regulatory and Compliance Leaders
Investor Relations and Equity Analysts