Market Minds Advisory
Inventory Tag Market

Inventory Tag Market: Inventory Tag Market. Retail Item-Level Accuracy Drives UHF RFID Adoption

Retail item-level inventory accuracy mandates and expanding supply chain visibility requirements are pushing large retailers toward UHF RFID tagging at the product level, replacing barcode workflows that cannot match RFID's bulk read speed.

Lead Analyst

Published

September 2026

Make Smarter Decisions with Customized Research Insights

Request a free sample report and evaluate market opportunities, growth trends, and competitive dynamics relevant to your business needs.

2025 MARKET VALUE$22.5BMarket Size 2025
2036 FORECAST VALUE$55.2BBase Case , 2026 to 2036
CAGR 2026 TO 20368.5 %Bull 9.7% / Bear 7.3%
INCREMENTAL OPPORTUNITY$30.8BNet 10- year value creation
EXPANSION MULTIPLE2.26x2036 value over 2026 base
Strategic Levers
M&A Pipeline
Regional Outlook
Country Rankings
Competitive Intelligence
Segmental Deep-dive
Call-Us : 91 93563 13602

Executive Snapshot and Market Trajectory.

Retailers are moving from case-level barcode tracking to item-level UHF RFID tagging, driven by inventory accuracy gaps that cost the industry billions of dollars in lost sales and markdowns every single year across major apparel and general merchandise product categories.
Apparel and general merchandise retailers lead RFID adoption, since item-level accuracy directly reduces out-of-stock losses and enables accurate omnichannel fulfillment promises that barcode-only inventory systems cannot reliably support at scale. UHF RFID tags represent the fastest-growing tag category as unit costs continue falling below the threshold that made retail-wide adoption previously uneconomical for lower-margin product categories, while manufacturing remains heavily concentrated across a handful of Asian inlay and label converting facilities.
Competition centers on a small group of RFID inlay and chip suppliers alongside a much larger group of label converters who print and encode tags to order for retail and logistics customers across the entire world's distribution channels. Passive UHF chip pricing keeps falling as volume scales, squeezing converter margins even as unit volumes grow steadily every year. Supply chain traceability regulations in food and pharmaceutical sectors are creating meaningful adjacent demand beyond retail apparel.
Market Definition
This market covers RFID and barcode tags, labels, and inlays used for inventory tracking across retail, logistics, and manufacturing supply chains, including passive UHF RFID tags, barcode labels, and associated encoding hardware sold as consumable tracking media. It excludes fixed RFID readers, handheld scanners, and inventory management software platforms sold separately from the tags themselves.
Base Year Value
$22.5B in 2025 (MMA Primary Research Dataset, September 2026)
Forecast Period
2026 to 2036, eleven discrete annual values
CAGR
8.5% base case. Bull 9.7%. Bear 7.3%.
Fastest Growth Segment
UHF RFID Inventory Tags: 13.5% CAGR
Fastest Growth Country
Vietnam: 14.5% CAGR
Fastest Growth Region
South Asia and Pacific: 10.5% CAGR
Largest Region
East Asia: 30% of 2025 global value
Market Leaders
Avery Dennison, Zebra Technologies, Impinj, Checkpoint Systems, SATO Holdings
Primary Survey
n=3,800 procurement and R&D decision-makers, Q4 2025, six countries
Methodology
Demand-side build-up, cross-validated against public data, 47 expert interviews

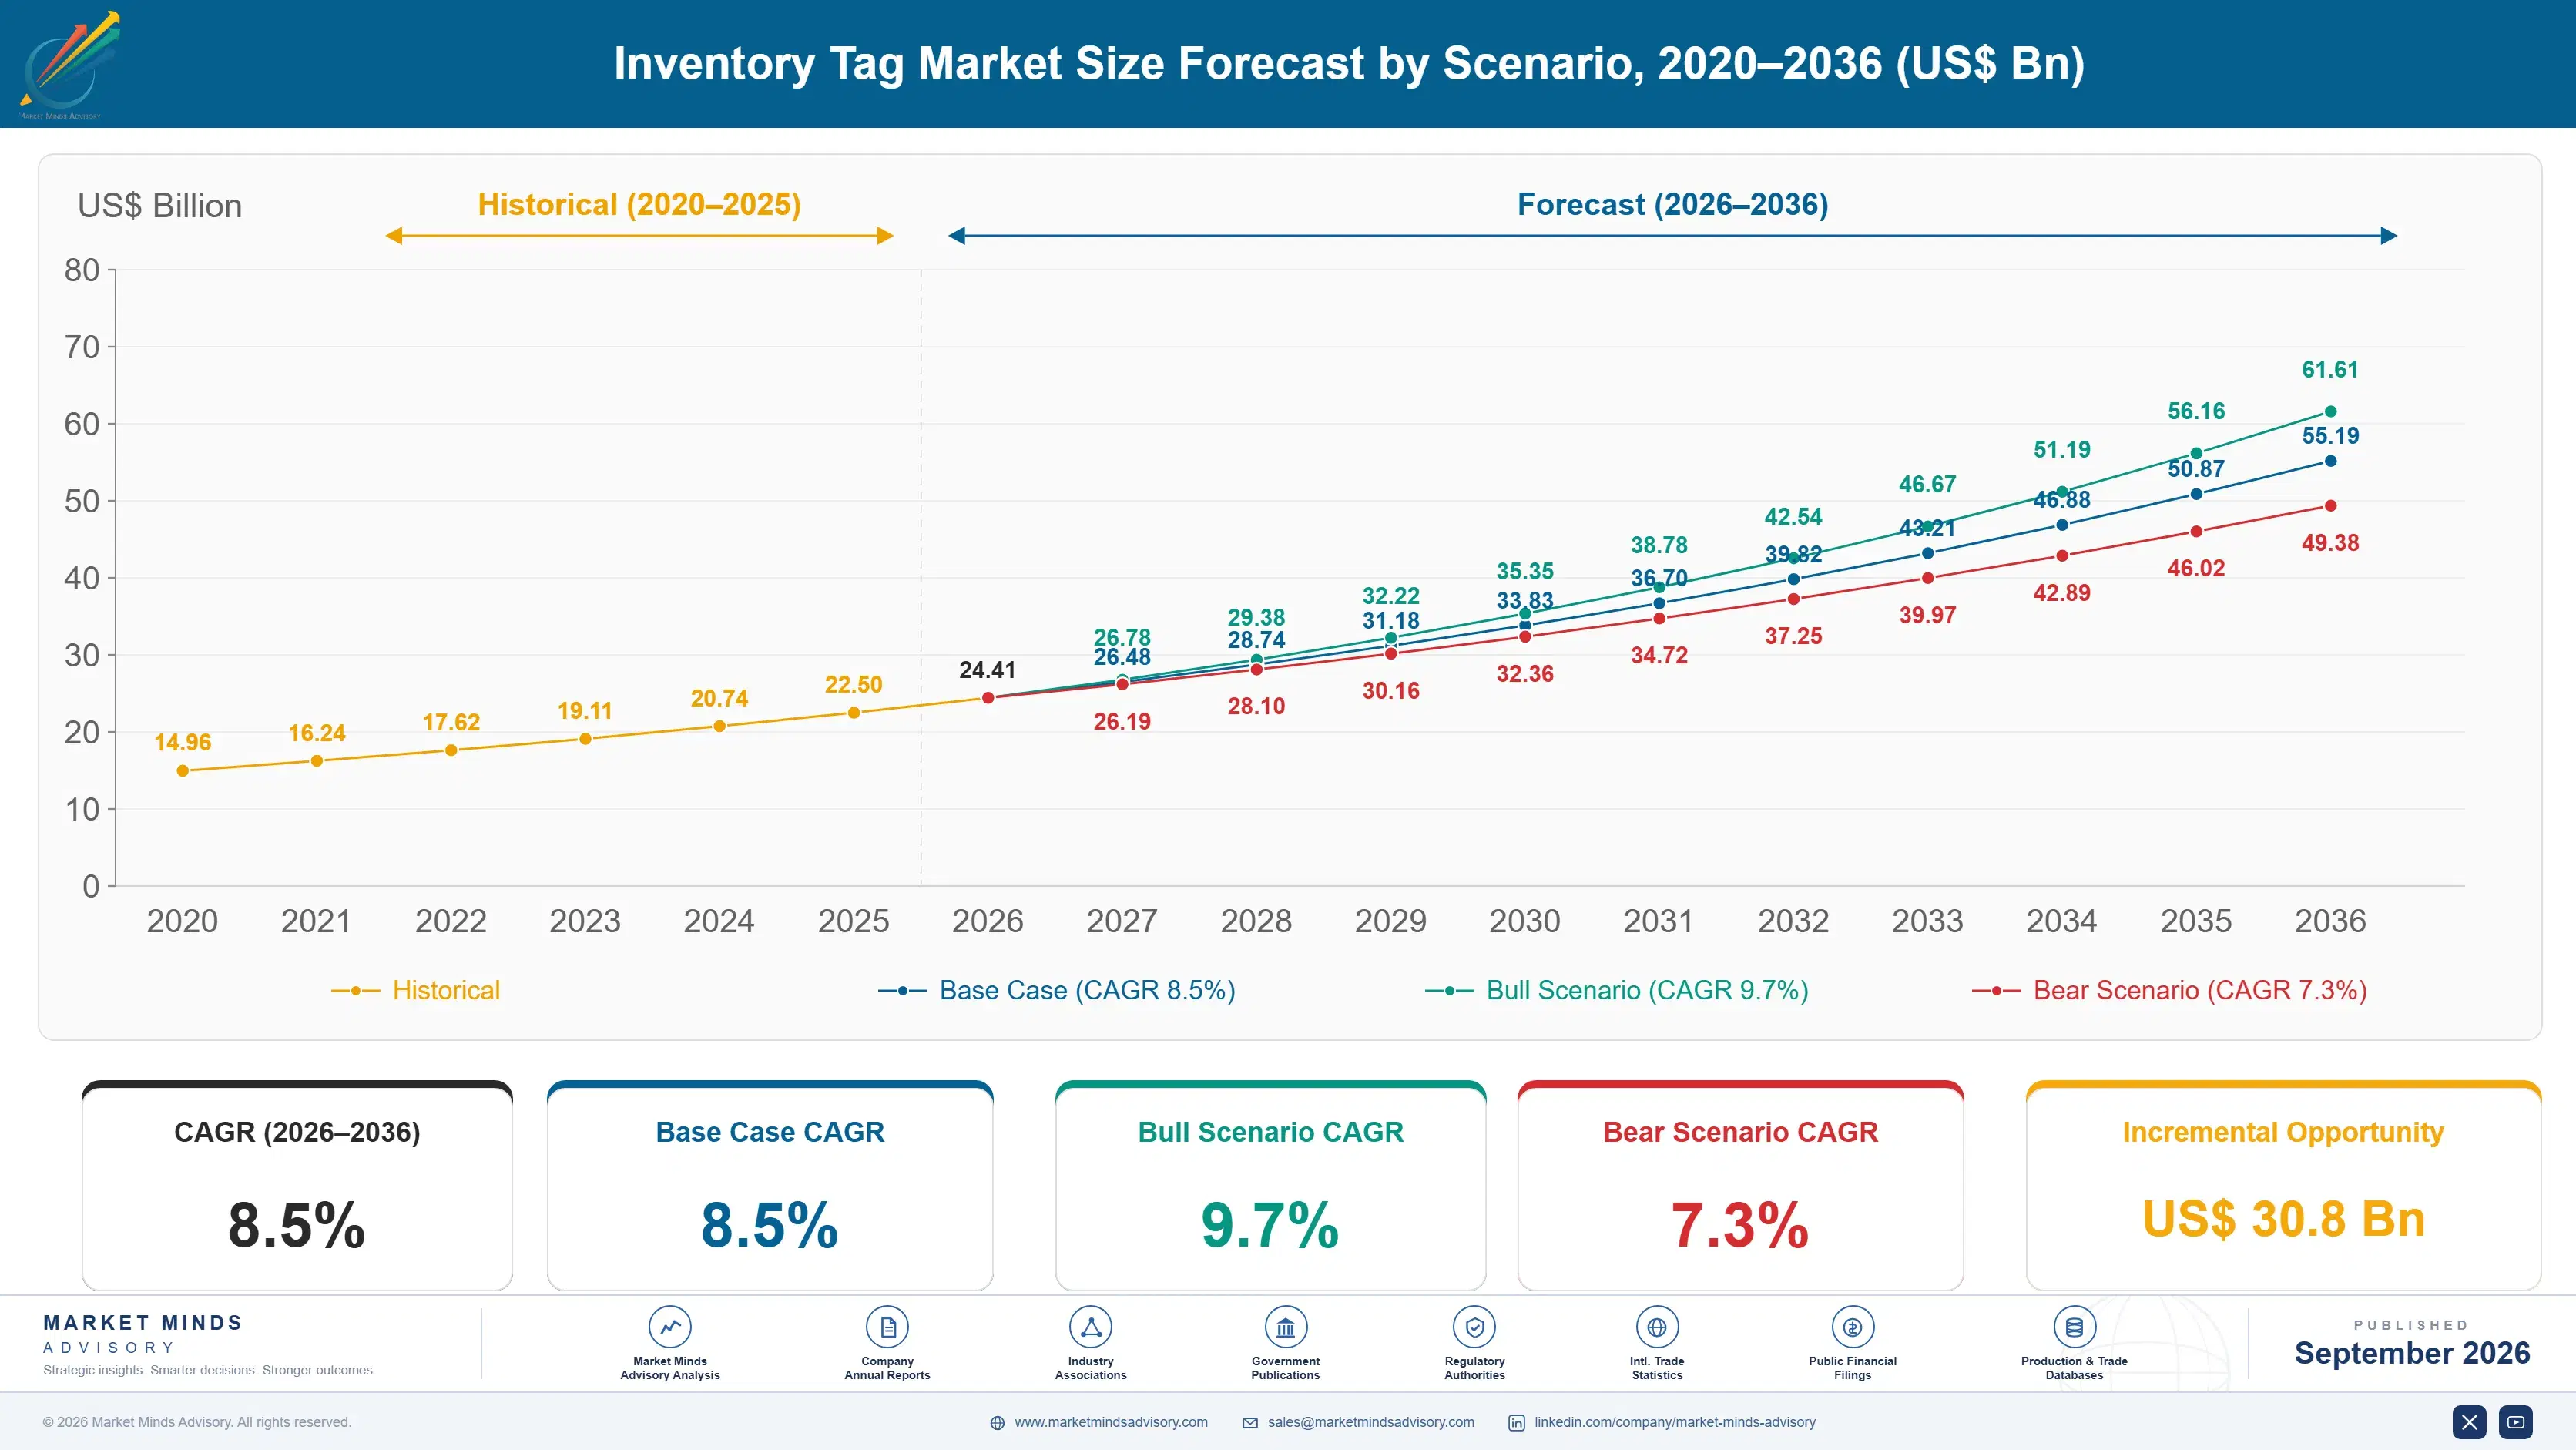
Inventory Tag Market Forecast Scenarios

inventory-tag-market-size-forecast-scenario-1788677544548
Inventory tag demand grew steadily from 2020 through 2025 as e-commerce fulfillment accuracy requirements intensified and early UHF RFID retail pilots proved measurable inventory accuracy gains, encouraging broader rollout across apparel categories specifically ahead of other retail segments still evaluating the technology's underlying economics and payback period carefully before committing full budget to a wider chain-wide rollout.
The base case assumes continued UHF chip cost declines, expanding retail category adoption beyond apparel into general merchandise and grocery, and growing logistics sector demand for shipment-level tracking as supply chain visibility requirements tighten across major retail supply chains worldwide. Barcode labels remain dominant in lower-value categories where per-unit RFID tag cost still exceeds the item's retail margin, but that boundary keeps shifting steadily as chip prices continue falling year over year.
A bull scenario assumes accelerating grocery and food traceability regulation forces RFID adoption well beyond current apparel-led categories into broader retail segments entirely; a bear scenario assumes persistent chip cost stagnation keeps RFID uneconomical for low-margin categories, confining growth mostly to apparel and pharmaceutical niches throughout the entire ten-year forecast period ahead, with grocery adoption delayed well past 2036.

Where Chip Economics Meet Retail Accuracy Demands

Inventory tags have shifted from a cost center retailers minimize to a data infrastructure investment that improves fulfillment accuracy and reduces markdown losses tied to inventory counting errors that accumulate silently across a fiscal year. The economics finally favor broader RFID adoption as chip costs fall below thresholds that once confined the technology to high-margin apparel categories exclusively rather than the broader retail assortment.
MARKET CONCENTRATION (CR5)45%Moderate concentration among leading inlay and label suppliers
AVERAGE UHF UNIT COST$0.05Per-unit chip and inlay cost continues declining steadily each year
TOP PRODUCING COUNTRY SHARE31%Vietnam and China together dominate global inlay manufacturing capacity
RETAIL ITEM-LEVEL ADOPTION RATE42%Share of major apparel retailers using item-level tagging today
AVERAGE READ ACCURACY RATE98.5%Typical inventory count accuracy achieved using UHF RFID systems
BARCODE TO RFID SHIFT6%/yearAnnual share shift from barcode toward RFID tagging systems
Retail item-level tagging is expanding fastest among apparel and footwear retailers, where individual product identification directly supports omnichannel fulfillment promises that barcode-only systems cannot reliably deliver at scale across a national store network. Manufacturing concentration in Southeast Asian inlay and label converting facilities keeps unit costs falling as production volume scales across the entire global supply chain each successive year.
Competitive dynamics increasingly favor vertically integrated suppliers who control both chip design and label converting, since this combination lets them capture more margin than converters purchasing chips from independent suppliers at market rates. Passive UHF chip pricing keeps compressing as volumes scale, squeezing pure-play converter margins even as overall unit demand keeps climbing steadily across nearly every major retail category tracked.
"Every apparel retailer that hasn't moved to item-level RFID yet is now the outlier, not the cautious one. The chip cost argument against adoption basically evaporated two years ago."
Practice Lead, Supply Chain Technology and Automation · MMA RFID and Barcode Inventory Tracking Tags and Labels Practice · September 2026

Market Trends

Chip Cost Declines Enable Broader Category Adoption

Passive UHF RFID chip pricing has fallen roughly 40 percent over the past five years as manufacturing volume scaled across a handful of dominant chip fabricators, crossing the cost threshold that previously confined RFID tagging to high-margin apparel and electronics categories exclusively. Retailers in general merchandise and even grocery are now running pilot programs that would have been economically unviable just three years ago. This cost trajectory shows no sign of reversing, and further declines could bring RFID tagging within reach of even lower-margin private label and value retail categories within the next several years.
Market Impact: Improves accuracy to 95 percent
Food and Pharmaceutical Traceability Rules Expand Demand

Expanding food safety traceability requirements, including the US FDA Food Safety Modernization Act rule covering high-risk foods, are pushing food distributors toward RFID and advanced barcode tagging for lot-level tracking that older barcode-only systems handle poorly at scale across large national distribution networks and their many warehousing partners. Pharmaceutical serialization requirements under existing track-and-trace regulations add further adjacent demand for unique item-level identification beyond traditional retail applications entirely. This regulatory-driven demand diversifies the addressable market meaningfully beyond apparel retail, which has driven most volume growth over the past decade of industry expansion.
Market Impact: Raises fulfillment success rates 20 percent

Market Opportunities and Growth Drivers

Retail Inventory Accuracy Gaps Cost Billions Annually

Barcode-based inventory systems typically achieve only 65 to 70 percent inventory accuracy at the store level, according to industry retail benchmarking studies, creating out-of-stock and overstock losses that cost the broader retail industry tens of billions of dollars annually in lost sales and unnecessary markdowns across nearly every product category. UHF RFID tagging improves inventory accuracy to 95 percent or higher in most deployments, directly addressing this persistent accuracy gap that barcode scanning alone has never fully solved despite decades of incremental process improvement across the retail sector and its many supply chain partners.
Market Impact: Adds 20 to 30 percent cost

Omnichannel Fulfillment Requires Real-Time Inventory Visibility

Retailers fulfilling online orders from physical store inventory need real-time, item-level accuracy that barcode-only systems cannot reliably provide, since a barcode scan only confirms a product existed somewhere in a shipment rather than confirming its exact current location on a shelf. RFID-enabled retailers report meaningfully higher successful ship-from-store fulfillment rates than barcode-only peers, directly supporting the omnichannel fulfillment promises that have become standard customer expectations across nearly every major retail category today. This capability gap is pushing even mid-tier retailers to accelerate RFID rollout timelines that were previously planned over many more years.
Market Impact: Adds 2 to 4 years

Market Restraints and Challenges

Per-Unit Tag Cost Still Excludes Low-Margin Categories

Even with falling chip prices, UHF RFID tags still cost meaningfully more per unit than simple barcode labels, a gap that remains economically prohibitive for low-margin categories like grocery staples and basic commodity goods where per-unit retail margin is thin. The root cause is that RFID tags require an embedded chip and antenna inlay that a printed barcode simply does not need, keeping a fixed cost floor beneath which RFID cannot easily compete on price alone. Some suppliers are exploring chipless RFID alternatives to address this gap, though these remain early-stage and unproven at commercial retail scale.
Market Impact: Chip prices fell 40 percent

Legacy Barcode Infrastructure Creates Switching Friction

Retailers with deep existing investment in barcode scanning infrastructure, including point-of-sale systems, warehouse management software, and staff training built around barcode workflows, face real switching costs when migrating to RFID that go well beyond the tag price itself. The root cause is that RFID migration typically requires new reader hardware, software integration work, and retrained staff processes across an entire retail chain simultaneously, not just a tag swap. Many retailers now run hybrid barcode and RFID systems during a multi-year transition period specifically to manage this switching cost gradually rather than all at once.
Market Impact: Adds demand across 2 sectors
3 additional market trends, 4 additional growth drivers, and 2 additional restraints and challenges are covered in the full report. Contact sales@marketmindsadvisory.com to access the complete intelligence.

Segment CAGR and Growth Architecture

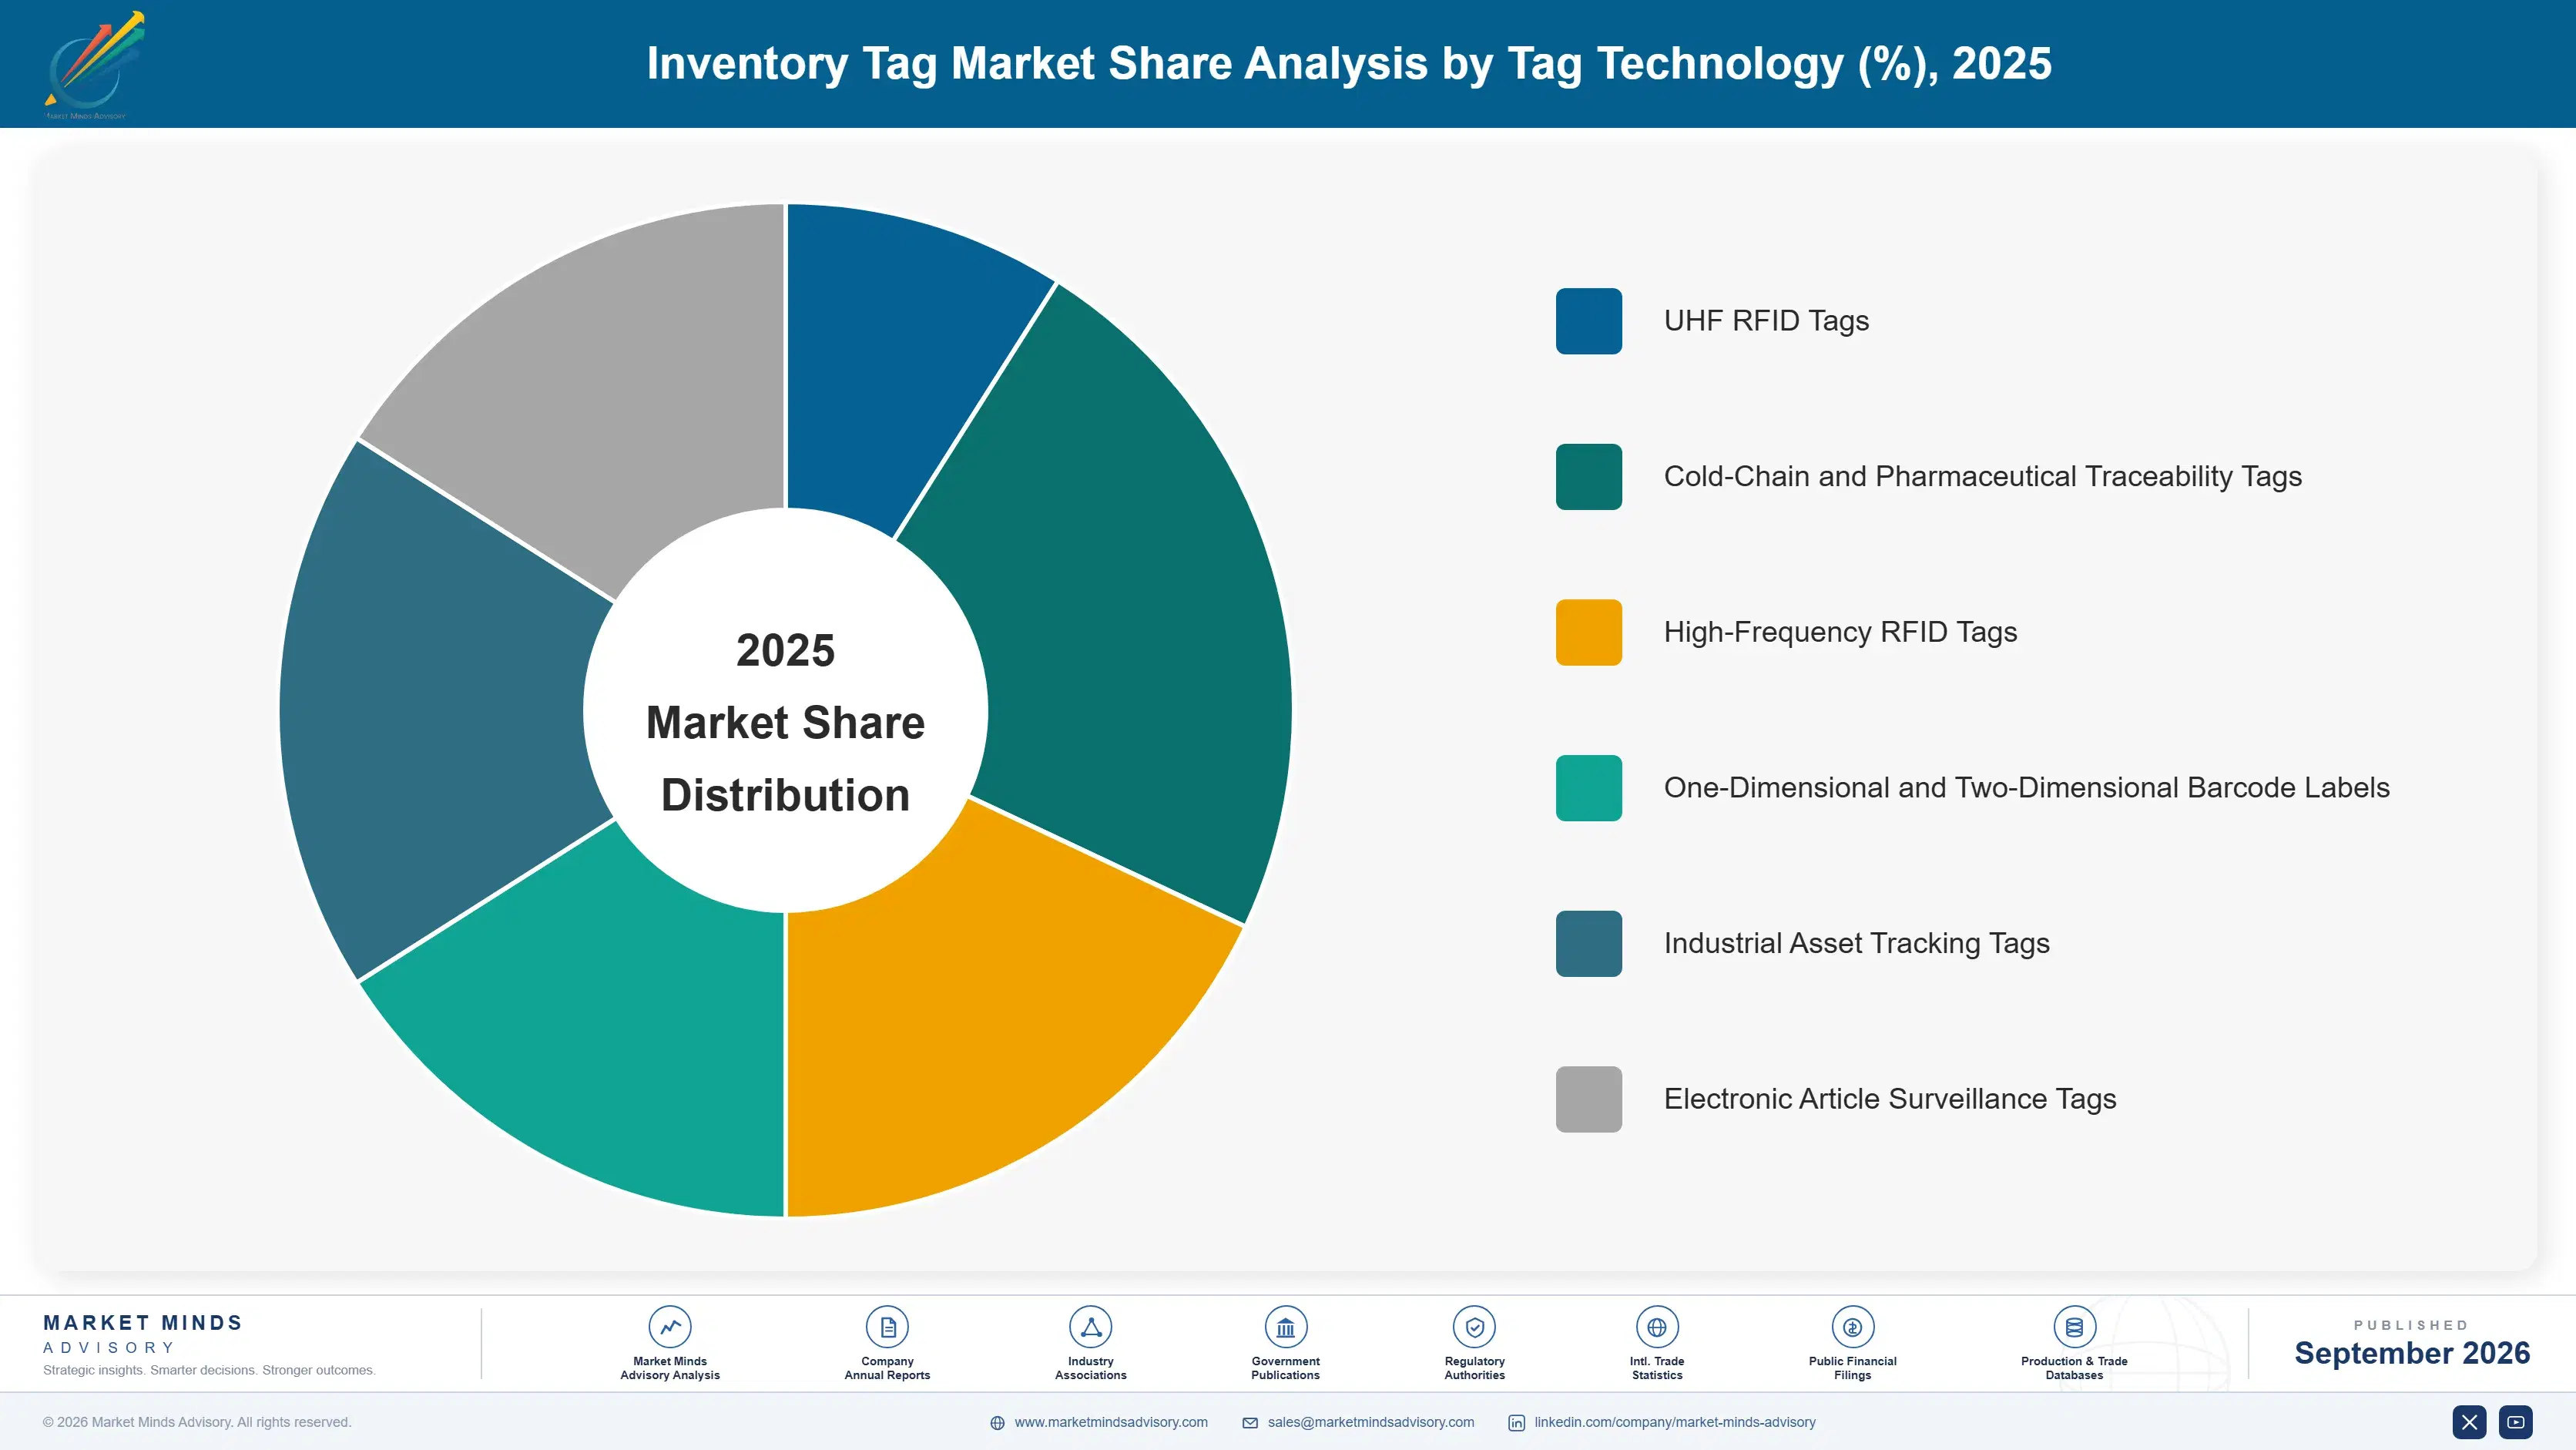
Inventory tags segment by core tracking technology and application, spanning UHF RFID tags, cold-chain and pharmaceutical traceability tags, high-frequency RFID tags, one-dimensional and two-dimensional barcode labels, industrial asset tracking tags, and electronic article surveillance tags, each addressing distinct accuracy, durability, and regulatory requirements across different retail, logistics, and healthcare supply chain use cases worldwide today.
inventory-tag-market-market-share-analysis-1788677545108

UHF RFID Inventory Tags

UHF RFID inventory tags combine an embedded chip and antenna inlay printed or laminated into a label, enabling bulk reads of dozens of items simultaneously from several meters away without direct line of sight, a capability barcode scanning fundamentally cannot replicate at any comparable speed or accuracy level. Growth reflects falling chip costs crossing the economic threshold for broader retail category adoption beyond apparel, alongside expanding food and pharmaceutical traceability regulation creating adjacent demand across new customer segments. Avery Dennison and SATO Holdings have both expanded UHF inlay converting capacity in Southeast Asia specifically to meet retail demand that has consistently outpaced supplier capacity additions over the past several years running steadily.
CAGR 13.5%

Cold-Chain and Pharmaceutical Traceability Tags

Cold-chain and pharmaceutical traceability tags combine temperature-monitoring sensors or serialization-ready chips with tamper-evident label construction, serving regulatory-driven demand distinct from ordinary retail inventory tracking applications entirely and commanding a genuinely different customer base with quite distinct purchasing criteria overall. Growth is accelerating as pharmaceutical track-and-trace serialization deadlines take effect and food safety regulators expand lot-level traceability requirements for high-risk perishable categories specifically across major export markets. Checkpoint Systems and Zebra Technologies have both introduced specialized cold-chain tag product lines combining RFID identification with embedded temperature logging capability, commanding meaningfully higher per-unit pricing than standard inventory tags given their added sensing and compliance documentation functionality built directly into the label itself.
CAGR 11.5%
Full segment breakdown across 6 segments available in the complete report.

Regional Architecture and Country Demand Map

East Asia leads given its concentration of RFID inlay and chip fabrication capacity, while North America drives the largest retail deployment volume through aggressive supplier mandates, and South Asia and Pacific posts the fastest regional growth as manufacturing investment shifts steadily toward the region each year.

North America

US apparel and general merchandise retailers lead global item-level RFID adoption, driven by intense competitive pressure to match omnichannel fulfillment accuracy standards set by leading e-commerce operators and their evolving customer delivery promises. Walmart, Target, and major apparel chains have all mandated RFID tagging from suppliers as a condition of doing business, creating enormous purchase volume even though most tag manufacturing happens offshore in East Asia rather than domestically. Canadian retailers largely follow US supplier mandates given deeply integrated North American retail supply chains and shared vendor relationships. US pharmaceutical serialization requirements under the Drug Supply Chain Security Act add meaningful adjacent demand for track-and-trace tagging beyond core retail applications.
Share: 26% | CAGR: 8.5% (2026 to 2036)

Western Europe

European retailers adopt RFID tagging more cautiously than US counterparts, reflecting a more fragmented retail landscape without the scale of single mandates that US chains impose directly on their suppliers nationwide across every region and category. German and UK apparel retailers lead regional adoption, often driven by supplier relationships with global apparel brands that already tag products for the US market and simply extend the practice to European distribution centers. European Union food traceability regulation adds steady adjacent demand for lot-level tracking labels across grocery and perishable goods categories throughout the entire bloc. Manufacturing remains minimal within Europe itself, with nearly all tags imported from Asian converting facilities at considerable scale.
Share: 20% | CAGR: 7.0% (2026 to 2036)
Regional intelligence for 5 additional markets available in the complete report: East Asia, South Asia and Pacific, Latin America, Middle East and Africa, Eastern Europe. Contact sales@marketmindsadvisory.com.
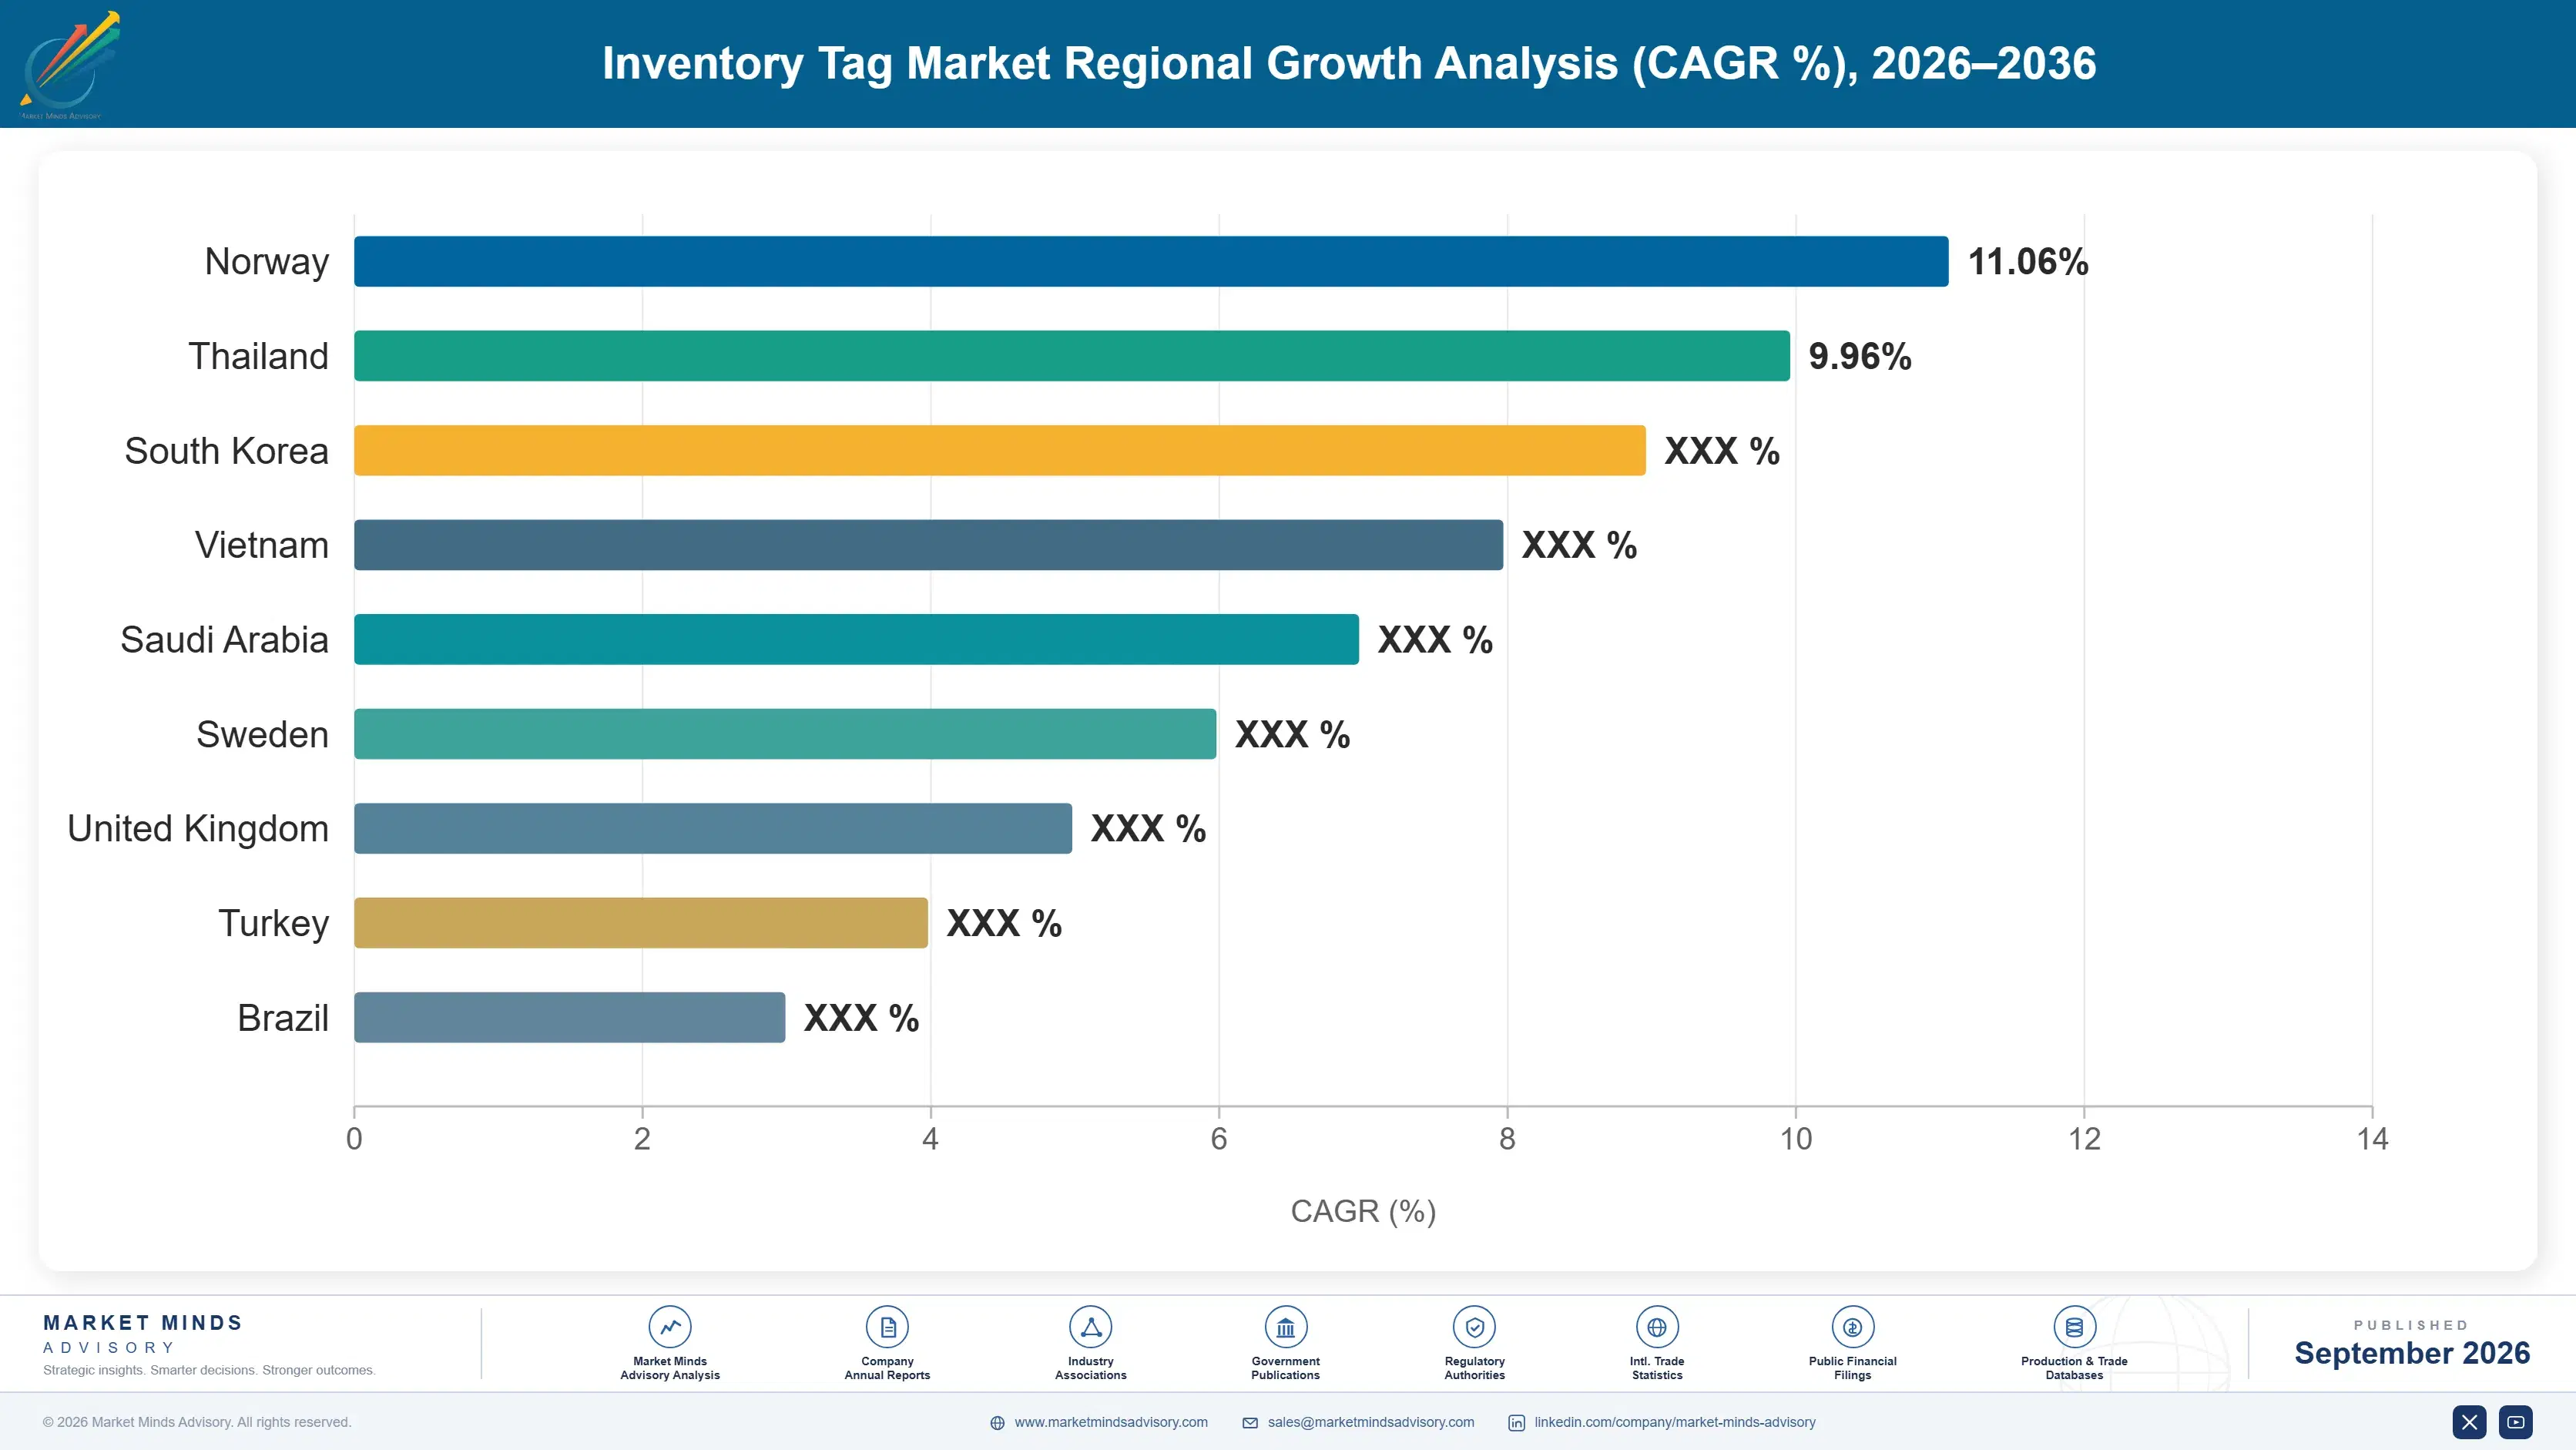
inventory-tag-market-country-cagr-analysis-1788677545622

Value-Added Tag Margin Expansion Paths

Inventory tag suppliers capture disproportionate margin not from raw chip or label sales but from encoding, integration, and compliance documentation services layered directly on top, since retailers increasingly demand pre-encoded, application-ready tags rather than raw components they must configure themselves internally at meaningful additional cost, delay, and operational complexity during every single order cycle.

Offering Pre-Encoded Application-Ready Tag Programming Services

Suppliers that pre-encode tags with retailer-specific data formats and quality assurance testing before shipment capture 12 to 18 percent higher per-unit pricing than raw unencoded tags, since retailers avoid the capital cost and labor of building in-house encoding infrastructure entirely on their own. This service requires deeper integration with retailer inventory systems than commodity tag suppliers typically maintain, creating a genuine differentiation opportunity that competitors struggle to replicate quickly. Avery Dennison and SATO Holdings have both expanded pre-encoding service capacity specifically to capture this growing higher-margin segment of enterprise retail demand.
Market Impact: Adds 12 to 18 percent to per-unit pricing

Bundling Compliance Documentation With Traceability Tags

Suppliers serving food and pharmaceutical customers increasingly bundle regulatory compliance documentation alongside the physical tag itself, adding 15 to 20 percent to contract value since customers avoid maintaining separate compliance software and documentation systems entirely on their own account and budget line. This bundling strategy deepens customer switching costs considerably, since replacing a supplier means replacing both the tag hardware and the compliance workflow simultaneously without a straightforward transition path available. Checkpoint Systems has expanded this bundled offering specifically to capture pharmaceutical serialization compliance budget beyond simple tag sales alone.
Market Impact: Adds 15 to 20 percent to contract value

Vertically Integrating Chip Design With Label Converting

Suppliers controlling both chip design and label converting capture significantly more margin than pure converters purchasing chips from independent suppliers at market rates, typically improving overall gross margin by 8 to 12 percentage points across the entire combined product line and customer base. This integration requires substantial upfront capital investment in chip design capability that smaller converters cannot easily replicate on their own without years of dedicated engineering investment. Impinj's vertically integrated model demonstrates this advantage clearly, commanding materially better unit economics than converters dependent entirely on third-party chip supply.
Market Impact: Improves gross margin 8 to 12 percentage points

Expanding Into Adjacent Asset Tracking Applications

Suppliers extending core inventory tagging capability into adjacent asset tracking applications, including reusable container tracking and industrial equipment identification, capture new recurring revenue streams beyond consumable retail tag sales alone, typically adding 20 to 30 percent to total account revenue once adjacent applications are fully established and scaled across the account base. These applications often use more durable, higher-priced tags than disposable retail inventory tags, improving blended margin considerably across the entire account relationship over time. Zebra Technologies has pursued this expansion aggressively across logistics and industrial customer segments beyond core retail accounts.
Market Impact: Adds 20 to 30 percent to account revenue

Who Controls the Margin Pool

Inventory tag manufacturing shows moderate concentration at a cr5 of 45 percent, split between a small group of vertically integrated chip and label leaders and a much larger tail of regional converters. Avery Dennison and Zebra Technologies lead on combined chip, inlay, and converting capability, while the gap to challengers like SATO Holdings has widened as vertical integration increasingly separates leaders from converters dependent on third-party chip supply alone.
Current competitive activity centers on capacity expansion in Southeast Asian converting facilities to meet surging retail demand, alongside vertical integration deals combining chip design with label converting operations. Several suppliers have introduced specialized cold-chain and pharmaceutical traceability tag lines to capture regulatory-driven demand beyond core retail apparel. Partnership activity between chip fabricators and converters continues, though fewer companies now attempt full vertical integration alone.

Emerging pressure comes from Chinese converters scaling domestic capacity with lower-cost production, threatening to compress Western and Japanese pricing power in commodity barcode and lower-value RFID tag categories. Smaller specialists focused narrowly on cold-chain or industrial asset tags could gain share in niche segments where incumbents underinvest. Rankings among the top five look durable through 2030, but the converter tier below faces genuine consolidation pressure.
inventory-tag-market-company-positioning-matrix-1788677546150

Competitive Moat and Risk Dimensions

AVERY DENNISON

Moat: Vertically Integrated Global Scale

Avery Dennison combines chip sourcing, inlay production, and label converting at a global scale that few competitors can match, giving it cost and reliability advantages that smaller regional converters purchasing components piecemeal from multiple suppliers cannot easily replicate across comparable volume and broad geographic manufacturing reach worldwide.
AVERY DENNISON

Risk: Commodity Pricing Pressure Rising

Avery Dennison's broad scale exposes it to intensifying commodity pricing pressure from lower-cost Chinese converters entering standard barcode and basic RFID tag categories, potentially compressing margin on high-volume, lower-differentiation product lines that make up a meaningful share of total company revenue and profitability going forward.
ZEBRA TECHNOLOGIES

Moat: Integrated Hardware and Tag Bundle

Zebra Technologies sells RFID readers, printers, and tags together as an integrated system, giving it a cross-selling advantage that pure tag suppliers lack entirely, since customers often prefer a single vendor relationship covering their complete inventory tracking hardware stack rather than juggling multiple disconnected supplier relationships simultaneously across categories.
ZEBRA TECHNOLOGIES

Risk: Tag Margins Trail Hardware Margins

Zebra Technologies' consumable tag business carries meaningfully thinner margins than its printer and reader hardware lines, creating an internal incentive structure that could underinvest in tag innovation relative to competitors for whom tags represent the entire core business rather than a supporting product line within a broader hardware portfolio.

Players Tracked

Prominent Players

Avery Dennison
Zebra Technologies
Impinj
Checkpoint Systems
SATO Holdings

Other Key Players

Honeywell
CCL Industries
Nedap
Invengo Technology
Xerafy
GAO RFID
Confidex
William Frick and Company
Alien Technology
NXP Semiconductors
Renesas Electronics
Sensormatic Solutions
Tageos
Identiv
Paragon ID

Recent Developments

APRIL 2026

Avery Dennison Expands Vietnam Inlay Converting Capacity

Avery Dennison announced expanded RFID inlay converting capacity at its Vietnam manufacturing facility, adding production lines to meet growing retail demand as apparel and general merchandise brands accelerate item-level tagging rollout plans across their global supplier networks ahead of upcoming peak retail seasons and holiday demand surges.
Signal: Signals continued manufacturing capacity migration toward Southeast Asia as demand consistently outpaces existing global supply today.
NOVEMBER 2025

Checkpoint Systems Launches Pharmaceutical Traceability Tag Line

Checkpoint Systems introduced a new pharmaceutical traceability tag line combining serialization-ready chips with tamper-evident label construction, extending its product portfolio beyond traditional retail loss prevention tags into a regulatory-driven adjacent market with distinct customer requirements and meaningfully higher per-unit pricing structures overall across the entire product line.
Signal: Signals incumbent diversification beyond core retail applications into regulatory-driven traceability market segments and adjacent industries overall.
JULY 2025

Impinj Signs Multi-Year Chip Supply Agreement With SATO

Impinj signed a multi-year chip supply agreement with SATO Holdings covering guaranteed volume commitments for UHF RFID chips used in SATO's label converting operations, locking in predictable component pricing for both companies ahead of anticipated demand growth across retail and logistics tagging applications globally over coming years.
Signal: Signals growing industry preference for multi-year chip supply agreements over spot-market purchasing arrangements today and going forward.

Silicon Chip and Antenna Costs

Silicon chips and aluminum or copper antenna materials together account for roughly 45 to 55 percent of UHF RFID tag cost of goods sold, sourced from a concentrated group of semiconductor fabricators and metal foil suppliers based primarily in Taiwan, Japan, and mainland China, with few qualified alternate sources readily available domestically at comparable scale.
Semiconductor supply constraints during 2021 and 2022 disrupted RFID chip availability significantly, as automotive and consumer electronics demand for foundry capacity crowded out lower-margin RFID chip orders at major contract fabricators, according to industry supply chain reporting from that period. Lead times for UHF RFID chips stretched from weeks to several months, forcing converters to ration allocation across customers and delaying some retail rollout timelines by two quarters or more.

Smaller converters lacking long-term chip supply agreements faced the sharpest allocation cuts during the shortage, while vertically integrated suppliers like Impinj, which design their own chips, maintained more predictable supply throughout the disruption period. This gives vertically integrated players a durable resilience advantage over pure converters during future semiconductor supply cycles, even though normal-time chip pricing differs little between the two supplier types across most product categories.
inventory-tag-market-cost-volatility-analysis-1788677546348

Securing Long-Term Chip Supply Agreements

Converters increasingly negotiate multi-year volume commitments with chip fabricators well ahead of anticipated demand growth, accepting less pricing flexibility today in exchange for guaranteed allocation priority during future periods of foundry capacity constraint affecting the broader semiconductor industry and its many competing high-value end markets simultaneously across every fabrication cycle each calendar year without exception.

Diversifying Chip Fabrication Sources Geographically

Suppliers increasingly qualify chip sources across multiple countries rather than relying entirely on a single fabrication hub, reducing exposure to any single region's capacity constraints, export restrictions, or geopolitical disruption that could otherwise halt production entirely without much advance warning across an entire converting operation and its broader customer base and global supply network.

Building In-House Chip Design Capability

Larger suppliers are investing in proprietary chip design capability to reduce dependence on third-party fabricators entirely, trading substantial upfront engineering investment for long-term supply resilience and improved margin capture across the complete tag manufacturing value chain from initial chip design through final converting and packaging stages each fiscal year going forward without any interruption.

Portfolio Architecture for Margin Defence

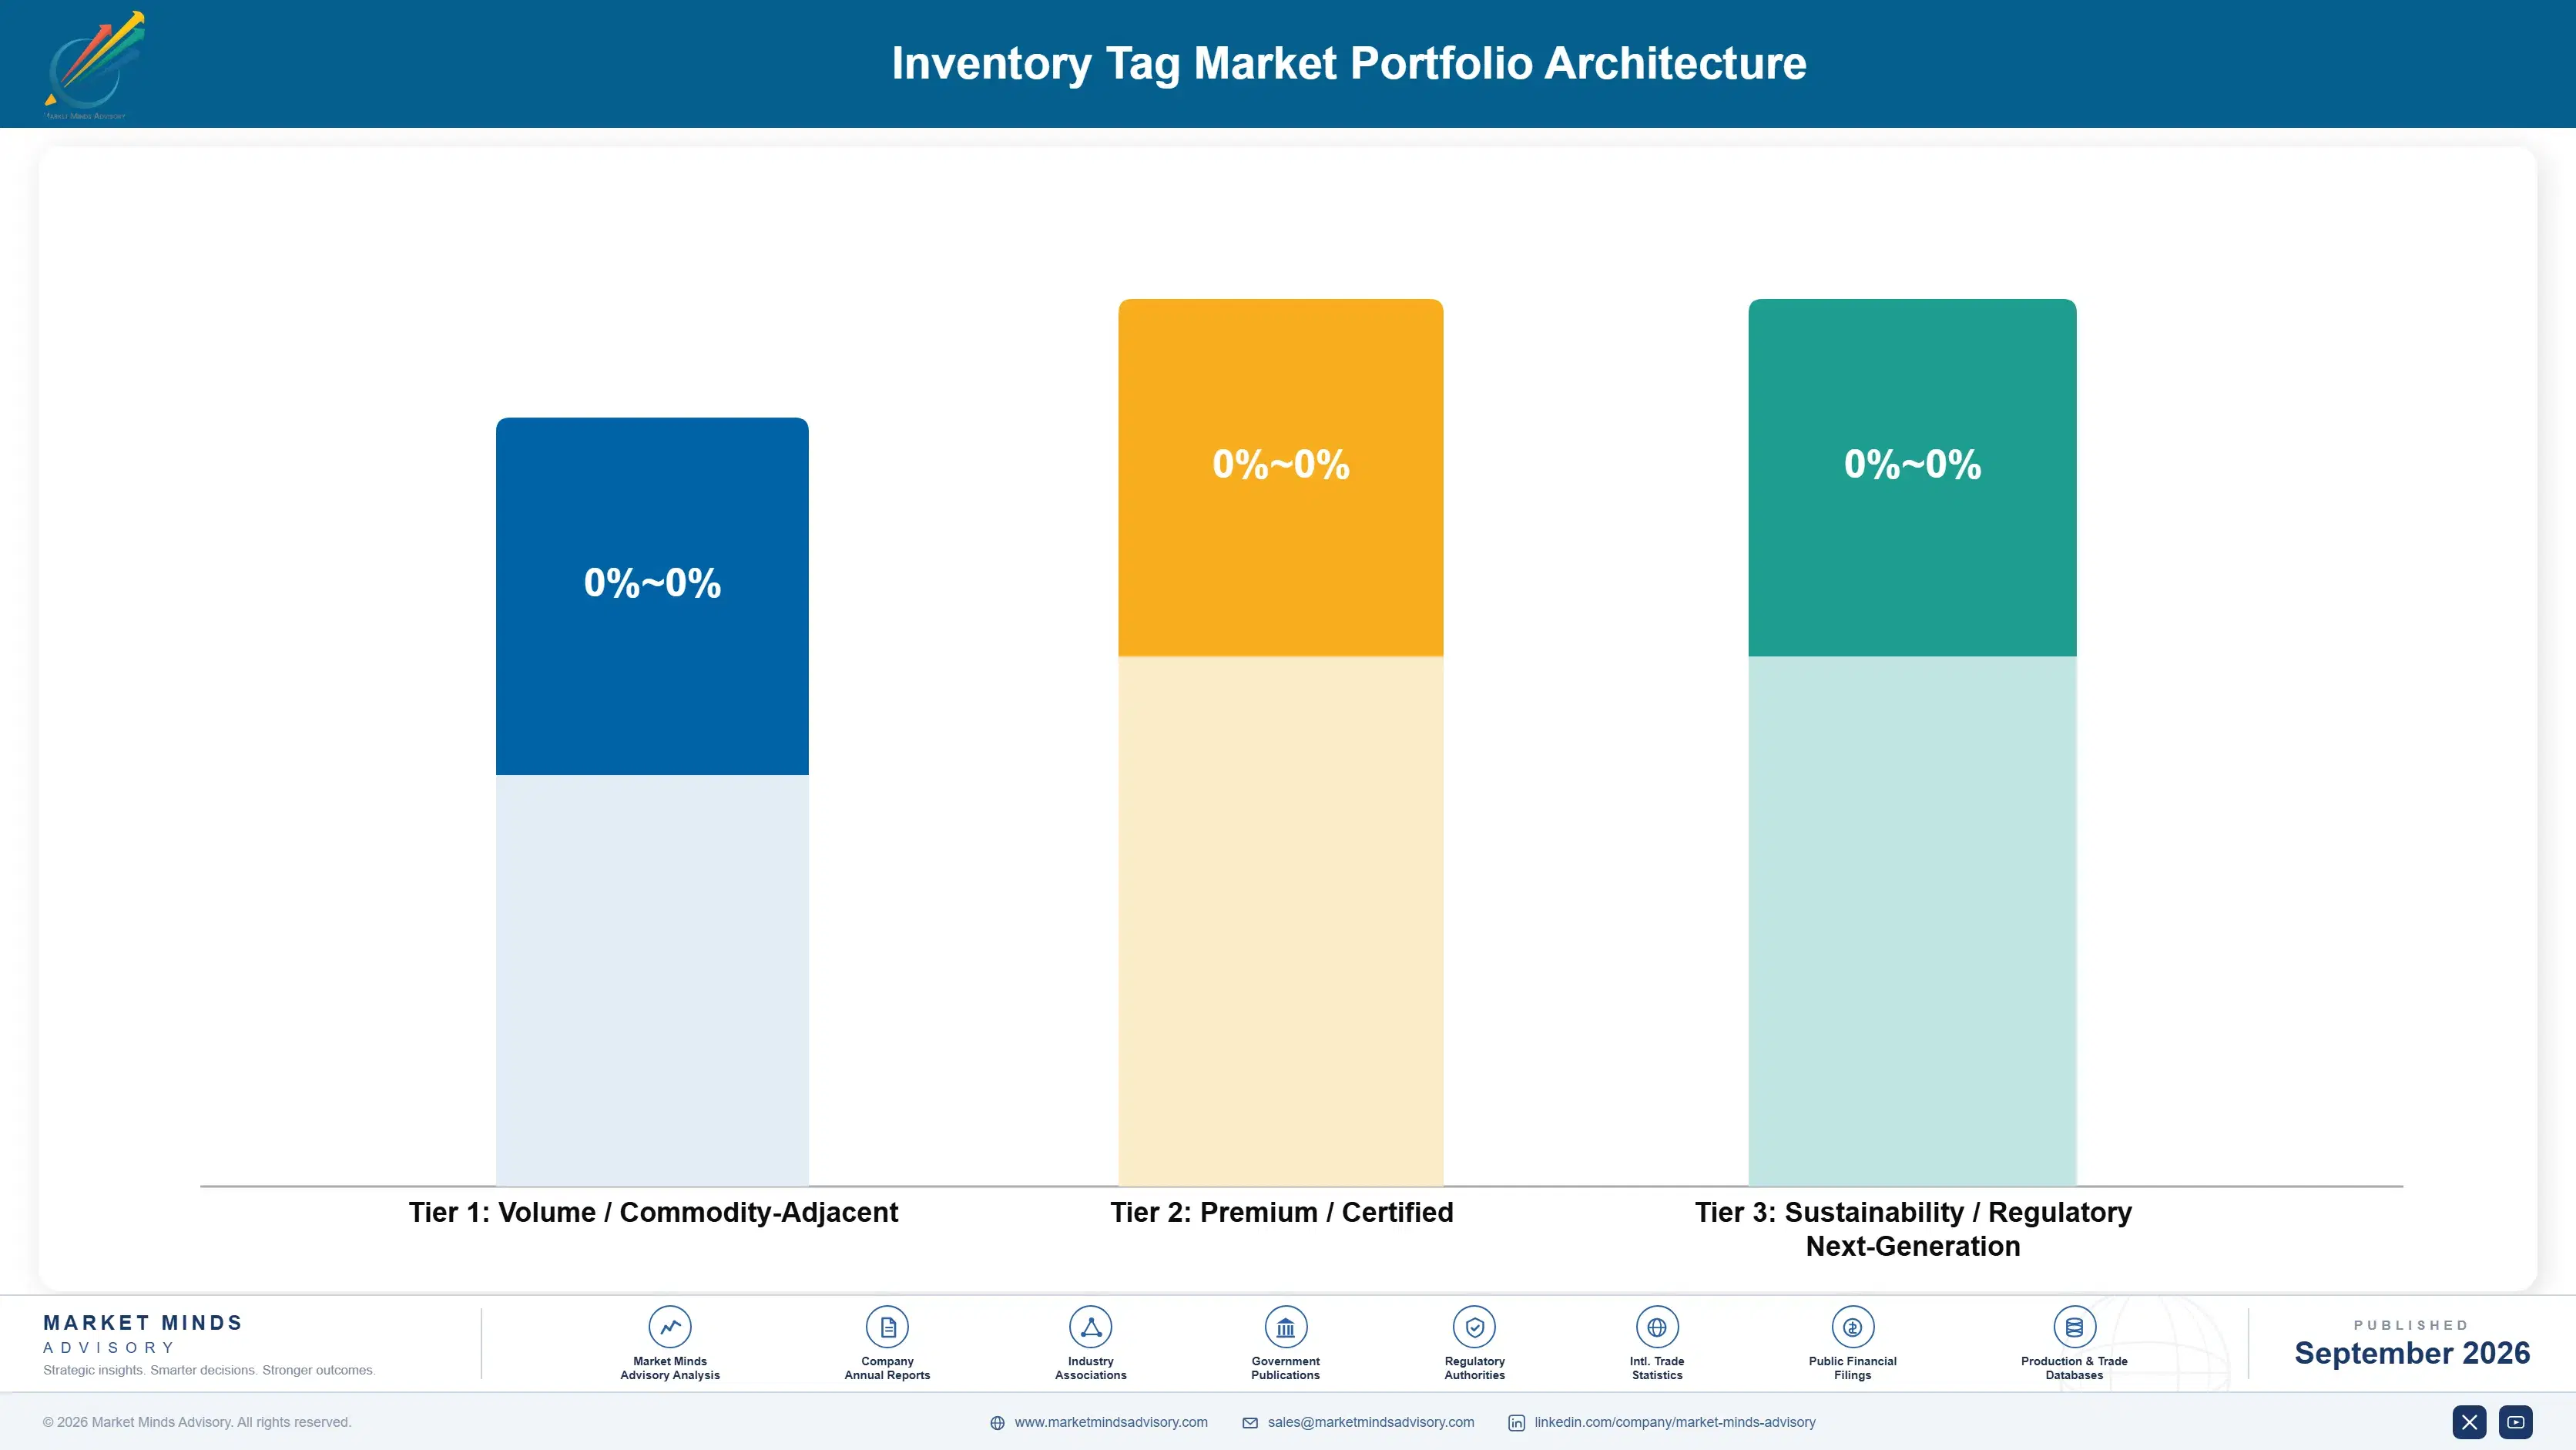
Inventory tag suppliers operate across three margin tiers, from commodity barcode labels sold at massive volume with thin per-unit margin to premium cold-chain and pharmaceutical traceability tags commanding substantially better economics. Tier separation reflects added functionality and regulatory compliance depth rather than raw material cost differences alone, since a basic barcode label and a temperature-sensing traceability tag share similar underlying printing and converting infrastructure.
Volume tension is sharpest in standard UHF retail tags, where large retail customers push relentlessly for lower per-unit pricing as order volumes scale into the billions of units annually. Specialty customers in pharmaceutical and cold-chain applications behave oppositely, valuing compliance documentation and sensing accuracy over unit price, which is why the highest-value revenue pools concentrate in traceability tags rather than standard retail apparel tagging.

Industrial asset tracking, particularly reusable container and equipment identification tags, sits between these extremes: growing steadily but priced closer to specialty tags than commodity retail tags, since durability requirements justify meaningfully higher unit cost than disposable retail tags ever command. Vendors positioned across all three tiers simultaneously capture the broadest addressable revenue base, though few manage the operational complexity of serving such differently motivated buyer segments well.

Volume / Commodity-Adjacent

Standard barcode labels and basic UHF retail tags sold at massive volume to large apparel and general merchandise retailers with minimal customization requirements or added sensing functionality built into the product.
Gross Margin: 18 to 26%

Premium / Certified

Cold-chain and pharmaceutical traceability tags requiring embedded sensors, serialization-ready chips, and extensive regulatory compliance documentation justifying substantially higher enterprise pricing than commodity retail alternatives ever command in the broader market.
Gross Margin: 40 to 50%

Sustainability / Regulatory / Next-Generation

Recyclable and chipless RFID alternatives serving sustainability-conscious retailers and emerging low-cost tagging applications, priced between commodity and premium tiers as adoption gradually scales across new customer categories and use cases.
Gross Margin: 32 to 42%
inventory-tag-market-portfolio-architecture-1788677546850

High-value Sub-segments and Strategic Watch-out

Cold-Chain and Pharmaceutical Traceability Tags

Cold-chain and pharmaceutical traceability tags combine high growth with premium regulatory-driven pricing, representing the clearest high-value high-growth opportunity as serialization deadlines and food safety mandates expand adjacent demand well beyond core retail apparel tagging applications currently dominating overall industry volume and total revenue mix considerably.
Gross Margin: high

Industrial Asset Tracking Tags

Industrial asset tracking tags combine strong margins with steady growth tied to reusable container and equipment identification programs, representing a high-value moderate-growth pool anchored by durability requirements that justify meaningfully higher pricing than disposable retail tags ever achieve at comparable production scale and total annual volume.
Gross Margin: high

Standard UHF Retail Tags

Standard UHF retail tags form the volume core of the market, generating steady revenue at compressed margins as large retailers negotiate aggressively on price given their massive annual order volumes across the entire supply chain and multiple global sourcing regions available to them each year.
Gross Margin: moderate

Chinese Low-Cost Converter Competition

Chinese converters scaling domestic low-cost production represent the clearest strategic watch-out, since rapidly expanding local manufacturing capacity threatens to compress Western and Japanese pricing power in commodity tag categories over the coming decade across nearly every major retail application and export geography worldwide today and tomorrow.
Gross Margin: uncertain

Consumable Tag Reorder Economics

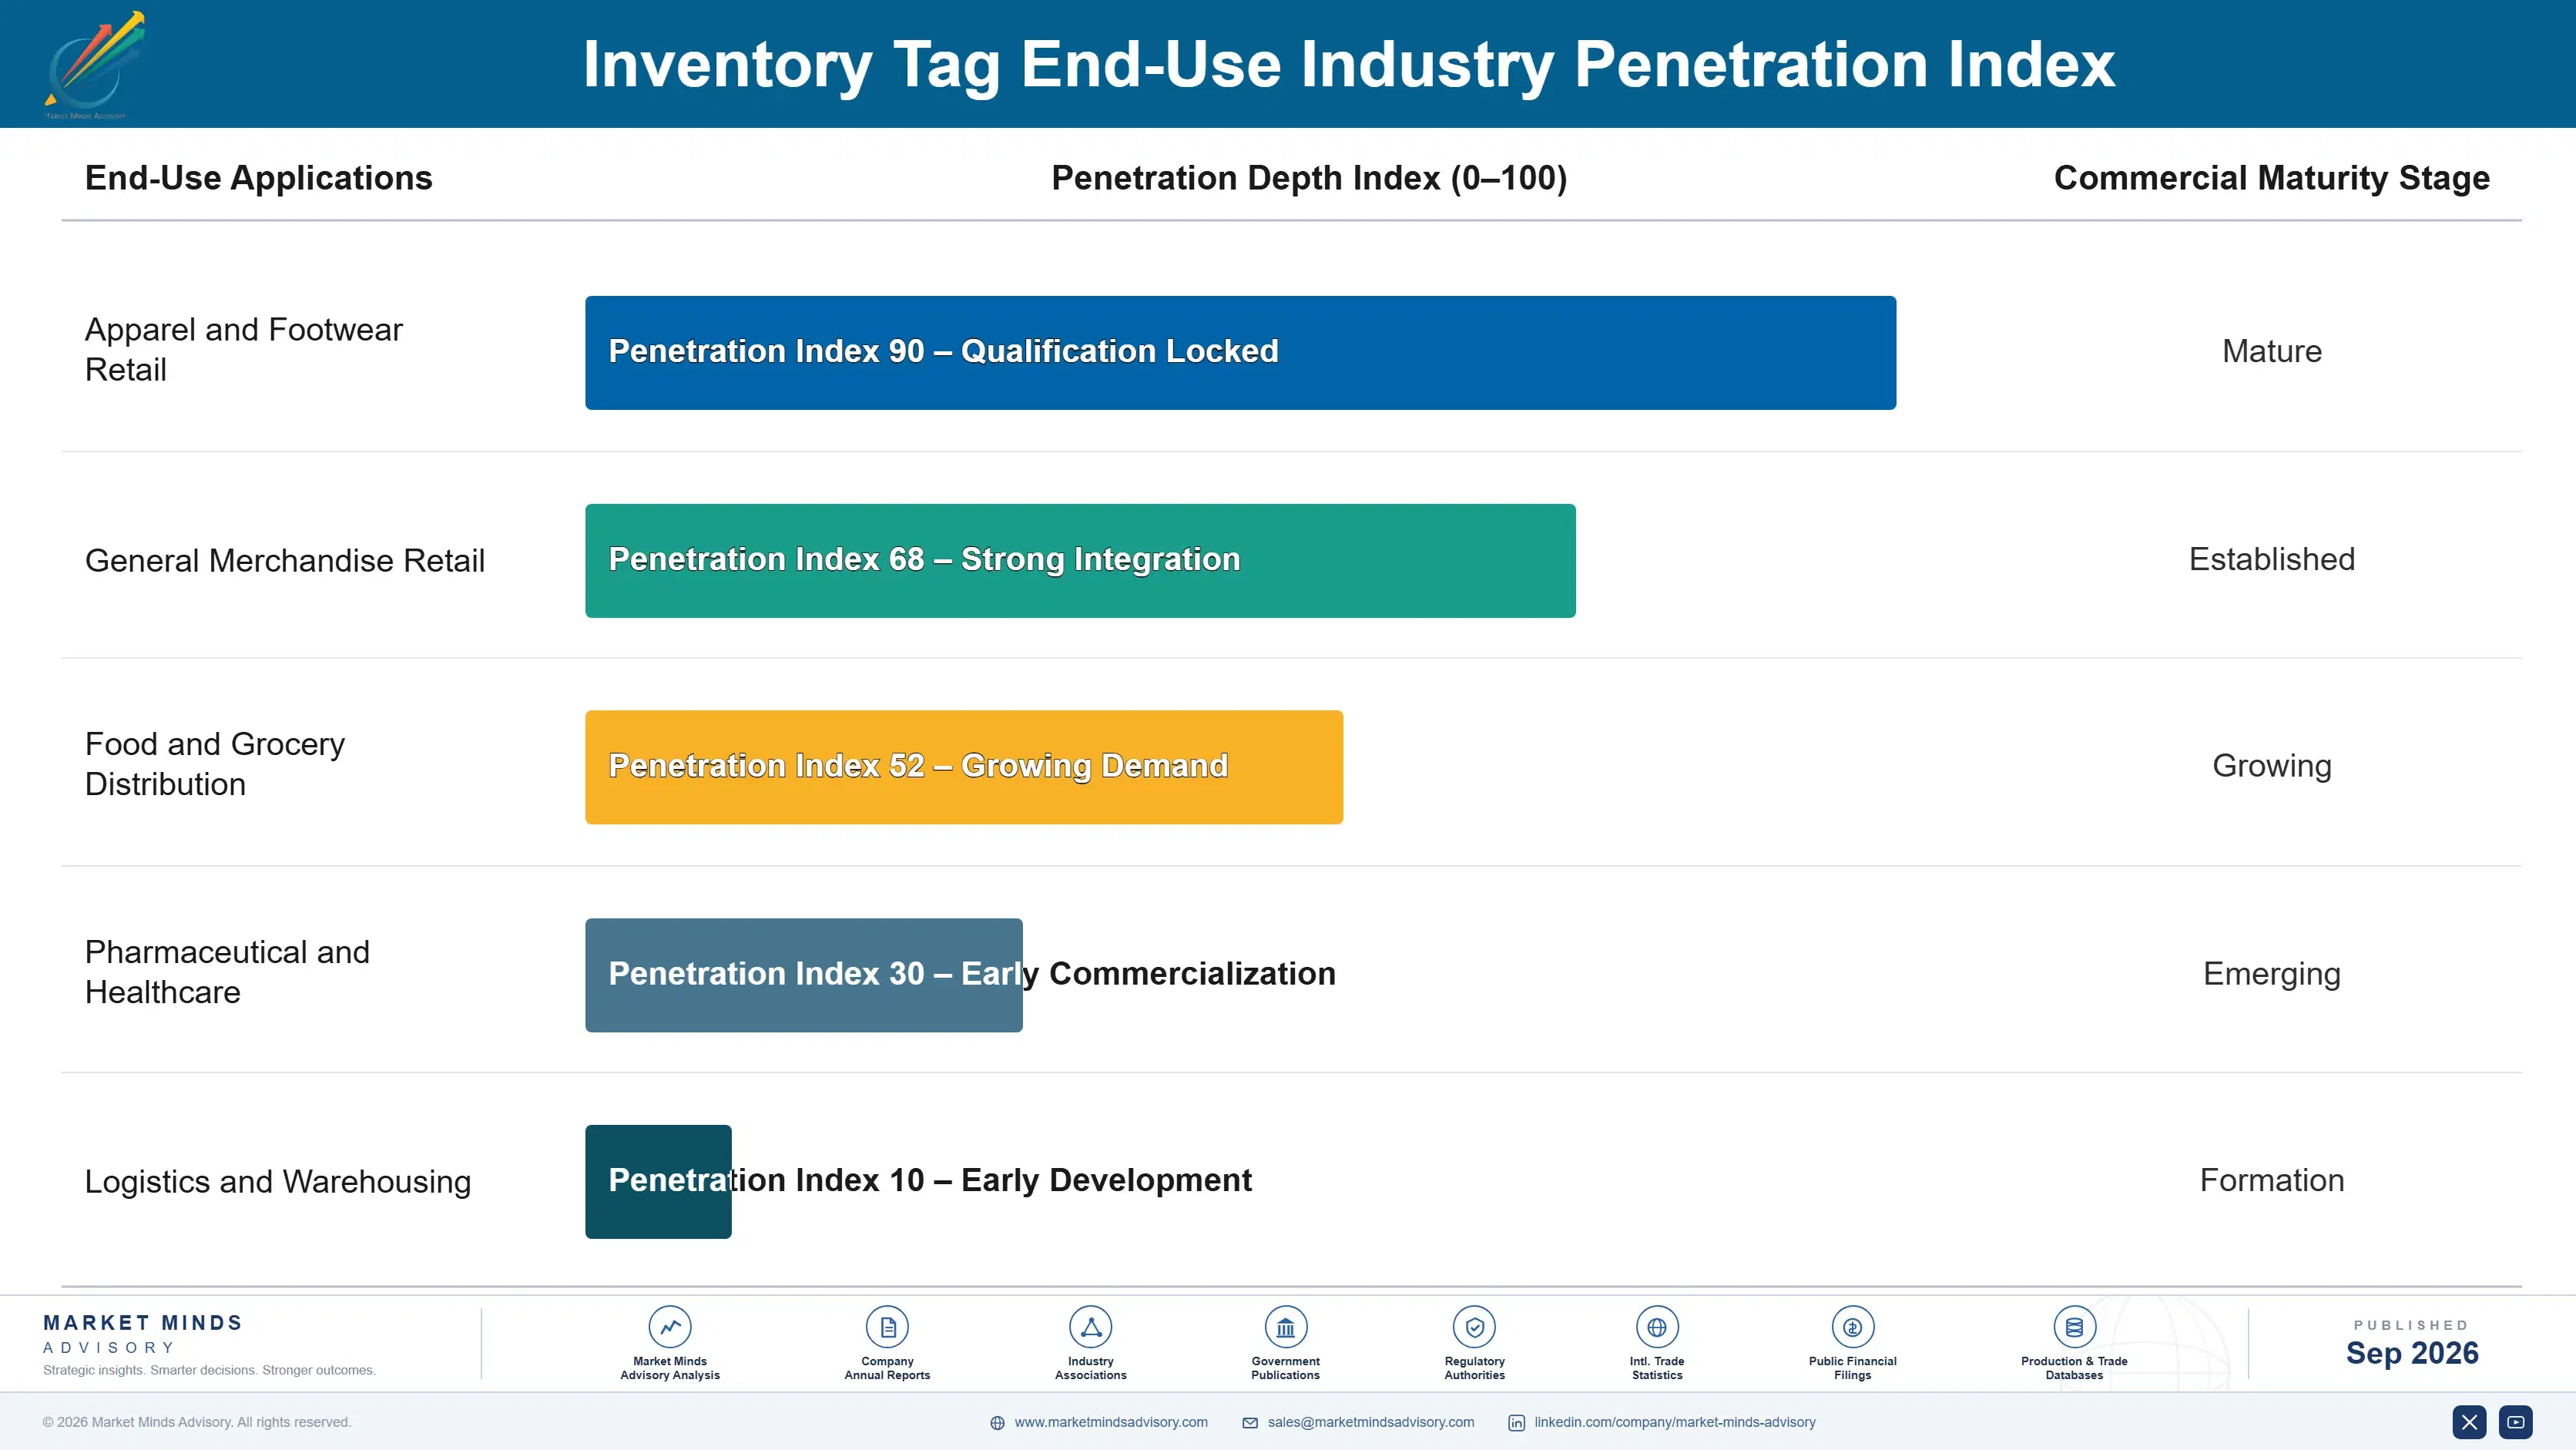
Inventory tags generate genuinely recurring consumable revenue rather than one-time equipment sales, since every tagged item requires a new tag at manufacture or retail packaging regardless of prior purchase volume. Suppliers with established retailer relationships capture predictable reorder revenue tied directly to a customer's ongoing product volume, creating an annuity-like demand pattern that persists as long as the underlying retail relationship continues uninterrupted.
Adoption stickiness varies by end-use vertical. Apparel retailers show the deepest lock-in, since tag specifications get embedded into supplier compliance mandates that flow through an entire vendor network and are costly to redesign once established. Grocery and food distributors show markedly less stickiness currently, since traceability tagging adoption remains early-stage and specifications have not yet standardized across the industry the way apparel tagging protocols have.

Buyer profiles are shifting generationally as supply chain technology leaders, rather than traditional loss-prevention or operations staff, increasingly drive RFID tagging decisions, prioritizing data integration and omnichannel fulfillment accuracy over the loss-prevention framing that dominated RFID's earliest retail adoption wave decades ago. This shift favors suppliers offering data integration services and analytics dashboards over vendors whose value proposition rests purely on tag hardware and unit pricing alone.
inventory-tag-market-end-use-penetration-index-1788677547346

Where MMA Sees the Opportunity

These are among the four positions where our research anticipates prominent divergence between winners and laggards over the coming forecast period. Each is grounded in the demand model, the regulatory perimeter, and the announced capacity pipeline.
01 / TRACEABILITY TAG EXPANSION

Build cold-chain and pharmaceutical traceability capability now

Cold-chain and pharmaceutical traceability tags are growing at 11.5 percent versus the market's 8.5 percent overall rate, yet the specialized sensing and serialization technology required differs meaningfully from standard retail apparel tagging that most converters currently produce. Suppliers with existing chip design or converting expertise hold a genuine head start extending capability into traceability tags rather than starting entirely from scratch against specialized competitors. Waiting until serialization deadlines fully take effect to enter risks ceding this expansion window to faster-moving rivals.
02 / VERTICAL INTEGRATION STRATEGY

Pursue chip design integration to build durable cost advantage

Suppliers controlling both chip design and label converting captured meaningfully better margin and supply resilience during the 2021 to 2022 semiconductor shortage than pure converters dependent entirely on third-party chip supply and market allocation. Building this capability requires substantial upfront engineering investment that smaller converters cannot easily justify without a clear multi-year growth outlook to support it financially and organizationally. Vendors that make this investment now, ahead of the next supply disruption, protect margin and reliability simultaneously for years to come.
03 / SOUTHEAST ASIA MANUFACTURING POSITIONING

Expand converting capacity in Vietnam ahead of demand growth

Vietnam is growing at 14.5 percent annually as manufacturing investment shifts there from China, yet converting capacity has not fully kept pace with the underlying demand growth driving that shift in the first place currently. Suppliers that expand converting facilities in Vietnam and similar Southeast Asian locations now secure capacity before competitors, avoiding the allocation constraints that plagued the industry during the last major supply disruption cycle years earlier. This capacity investment pays back quickly given sustained regional demand growth.
04 / CHINESE COMPETITIVE RESPONSE

Prepare for Chinese price competition in commodity barcode tags

Chinese converters are scaling domestic production capacity with substantially lower-cost manufacturing, and this pricing pressure will land hardest on standard barcode and basic UHF retail tags where technical differentiation between competing suppliers is thinnest today. Western and Japanese suppliers should shift commodity-tier production toward automation to defend margin, while concentrating genuine differentiation investment in traceability and industrial asset tiers where Chinese suppliers currently lack meaningful qualification history and track record. Waiting for pricing pressure to fully materialize will already be too late.

Engagement Snapshot From the Field

A live engagement with an industry participant carrying material or product regulatory and market exposure ahead of a defining policy shift, showing how our research translates into a defensible multi-year portfolio strategy.
MARKET MINDS ADVISORY · CLIENT ENGAGEMENT SUMMARY
Inventory Tag Producer Strategic Portfolio Review and Transition Roadmap 2026·Investment Scenario on Inventory Tag Exposure Evaluation 2025-26
CLIENT PROFILE
The client is a mid-sized US apparel retailer operating approximately 280 stores nationally, with annual revenue in the range of 900 million to 1.1 billion dollars (client-reported, unverified by MMA). The company had relied entirely on barcode-based inventory tracking and was evaluating a phased UHF RFID rollout following supplier pressure and internal concern over persistent inventory accuracy gaps affecting omnichannel fulfillment reliability.
STRATEGIC CHALLENGE
Leadership needed an independent assessment of RFID rollout sequencing and realistic cost implications before committing capital, given uncertainty about which store formats and product categories would deliver the strongest return on tagging investment. Internal estimates of accuracy improvement varied widely across departments, with no consensus on phasing priority or total multi-year budget requirements.
MMA APPROACH
MMA conducted a comparative assessment of RFID rollout sequencing across the client's store portfolio, evaluating inventory accuracy baseline data by category and modeling realistic accuracy improvement and payback timelines under three different rollout sequencing scenarios. The engagement combined interviews with two tag suppliers and a review of the client's existing inventory shrinkage data.
KEY FINDINGS
  1. Footwear and accessories categories showed the largest inventory accuracy gap under barcode tracking, making them the highest-return candidates for initial RFID rollout phases (client-reported, unverified by MMA).
  2. A phased three-year rollout across all 280 stores was projected to cost less overall than the client's original two-year accelerated timeline due to supplier volume discount thresholds.
  3. Store associates in pilot locations reported meaningfully faster cycle counts, freeing labor hours previously spent on manual barcode-based inventory reconciliation processes each week.
  4. Existing point-of-sale infrastructure required only moderate modification to support RFID-enabled checkout, considerably lower than the client's internal technology team had originally estimated for the project.
CLIENT PROFILE
The client is a mid-sized US apparel retailer operating approximately 280 stores nationally, with annual revenue in the range of 900 million to 1.1 billion dollars (client-reported, unverified by MMA). The company had relied entirely on barcode-based inventory tracking and was evaluating a phased UHF RFID rollout following supplier pressure and internal concern over persistent inventory accuracy gaps affecting omnichannel fulfillment reliability.
STRATEGIC CHALLENGE
Leadership needed an independent assessment of RFID rollout sequencing and realistic cost implications before committing capital, given uncertainty about which store formats and product categories would deliver the strongest return on tagging investment. Internal estimates of accuracy improvement varied widely across departments, with no consensus on phasing priority or total multi-year budget requirements.
MMA APPROACH
MMA conducted a comparative assessment of RFID rollout sequencing across the client's store portfolio, evaluating inventory accuracy baseline data by category and modeling realistic accuracy improvement and payback timelines under three different rollout sequencing scenarios. The engagement combined interviews with two tag suppliers and a review of the client's existing inventory shrinkage data.
KEY FINDINGS
  1. Footwear and accessories categories showed the largest inventory accuracy gap under barcode tracking, making them the highest-return candidates for initial RFID rollout phases (client-reported, unverified by MMA).
  2. A phased three-year rollout across all 280 stores was projected to cost less overall than the client's original two-year accelerated timeline due to supplier volume discount thresholds.
  3. Store associates in pilot locations reported meaningfully faster cycle counts, freeing labor hours previously spent on manual barcode-based inventory reconciliation processes each week.
  4. Existing point-of-sale infrastructure required only moderate modification to support RFID-enabled checkout, considerably lower than the client's internal technology team had originally estimated for the project.
RECOMMENDED STRATEGY
Phase 1: Phase one: roll out RFID tagging to footwear and accessories categories across 90 pilot stores within the first twelve months of implementation. Phase 2: Phase two: expand tagging to remaining apparel categories across the full store base over the following eighteen months in a methodical, staged rollout. Phase 3: Phase three: integrate RFID data into omnichannel fulfillment systems chain-wide once accuracy improvements are fully validated across all pilot store locations.
OUTCOME
The client approved the phased three-year rollout plan and began the initial footwear and accessories pilot within two months of the engagement's conclusion (client-reported, unverified by MMA). Early inventory accuracy results from the pilot stores were not yet available for independent verification at the time of publication.

Frequently Asked Questions

Foundational context covering the market sizes, CAGR, scope, country, region and competition that inform every finding below. This section is provided to cover basics and most often pre-purchase conversations, answered from the MMA Primary Research Dataset.

What is the current size of the Inventory Tag Market?

The global inventory tag market is valued at 22.5 billion dollars in 2025, the report's base year. This reflects spending on UHF RFID tags, barcode labels, and traceability tags combined across retail, logistics, and manufacturing.

How large will the Inventory Tag Market be by 2036?

MMA projects the market will reach 55.19 billion dollars by 2036, a 2.26 times expansion from 2026's forecast value. Growth is driven mainly by falling chip costs and expanding retail item-level adoption.

What is the CAGR for the Inventory Tag Market 2026 to 2036?

The market is forecast to grow at an 8.5 percent compound annual rate between 2026 and 2036. Bull and bear scenarios range from 9.7 percent to 7.3 percent depending on chip cost trajectories.

Which segment is growing fastest?

UHF RFID inventory tags lead at a 13.5 percent CAGR, roughly 1.59 times the overall market rate. Demand is driven by falling chip costs and expanding retail item-level tagging mandates.

Who are the major companies in the Inventory Tag Market?

Avery Dennison, Zebra Technologies, Impinj, Checkpoint Systems, and SATO Holdings lead the market on combined chip, inlay, and converting capability. Together they hold a combined cr5 of 45 percent.

Which country is growing fastest?

Vietnam leads at a 14.5 percent forecast CAGR, driven by expanding electronics and textile manufacturing investment shifting away from China. This outpaces the broader South Asia and Pacific regional average.

Report Segmentation Architecture

The full report scope spans multiple orthogonal segmentation dimensions, with cross-tabulated demand data provided for each dimension pair. Coverage extends further to regional breakdowns, trend trajectories, and the competitive detail needed to support segment-level decision-making.

By Tag Technology

  • UHF RFID Tags
  • Cold-Chain and Pharmaceutical Traceability Tags
  • High-Frequency RFID Tags
  • One-Dimensional and Two-Dimensional Barcode Labels
  • Industrial Asset Tracking Tags
  • Electronic Article Surveillance Tags

By End-Use Industry

  • Apparel and Footwear Retail
  • General Merchandise Retail
  • Food and Grocery Distribution
  • Pharmaceutical and Healthcare
  • Logistics and Warehousing

By Commercial Dimension

  • Direct Retailer Purchase
  • Supplier-Mandated Tagging Programs
  • System Integrator Channel
  • Distributor and Reseller Channel

By Region

  • North America
  • Western Europe
  • East Asia
  • South Asia and Pacific
  • Latin America
  • Middle East and Africa
  • Eastern Europe

Scope, Methodology, and Coverage

Every figure in this report is reproducible from documented input assumptions. The scope below maps the historical period, the forecast horizon, the segmentation dimensions, and the countries covered, alongside the underlying primary and qualitative methodology.
Historical Period
2020 to 2025
Forecast Period
2026 to 2036
Base Year
2025 (USD billions; MMA Primary Research Dataset, September 2026)
Market Definition
This market covers RFID and barcode tags, labels, and inlays used for inventory tracking across retail, logistics, and manufacturing supply chains, including passive UHF RFID tags, barcode labels, and associated encoding hardware sold as consumable tracking media. It excludes fixed RFID readers, handheld scanners, and inventory management software platforms sold separately from the tags themselves.
Quantitative Units
USD billions (current prices); unit shipment volumes where applicable
Segmentation Dimensions
By Tag Technology; By End-Use Industry; By Commercial Dimension; By Region
Regions Covered
North America, Western Europe, East Asia, South Asia and Pacific, Latin America, Middle East and Africa, Eastern Europe
Countries Covered
USA, China, Germany, France, UK, Japan, South Korea, India, Australia, Canada, Brazil, Mexico, Indonesia, Vietnam, Thailand, Malaysia, UAE, Saudi Arabia, South Africa, Nigeria, Turkey, Poland, Netherlands, Italy, Spain, Sweden, Switzerland, Argentina, Colombia, Singapore, and additional markets relevant to this sector
Key Companies Profiled
Avery Dennison, Zebra Technologies, Impinj, Checkpoint Systems, SATO Holdings, Honeywell, CCL Industries, Nedap, Invengo Technology, Xerafy, GAO RFID, Confidex, William Frick and Company, Alien Technology, NXP Semiconductors, Renesas Electronics, Sensormatic Solutions, Tageos, Identiv, Paragon ID
Quantitative Methodology
Primary survey, n=3,800 respondents, Q4 2025, six countries; demand-side model with trade association cross-validation
Qualitative Methodology
47 expert interviews, Q4 2025; applied to validate demand model assumptions, identify emerging dynamics, and assess competitive positioning
Report Format
PDF and XLSX data workbook (Word format preview document)
Publisher
Market Minds Advisory
Report Code
MMA-2026-TEC-170
Published
September 2026
Contact
sales@marketmindsadvisory.com | www.marketmindsadvisory.com

Purchase the full Inventory Tag Market Report (2026 to 2036).

The full report delivers a comprehensive assessment of the global inventory tag market across tag technology, end-use industry, and commercial channel dimensions through 2036. It includes detailed competitive profiles of twenty companies, seven regional demand analyses, and input cost risk modeling tied to semiconductor chip and antenna material supply chains. Analysts receive segment-level CAGR forecasts, portfolio margin benchmarking, and a strategic verdict section identifying where near-term investment should concentrate across the industry. The report also includes an anonymized client case study illustrating real-world RFID rollout sequencing decisions.
Seven-region demand and CAGR growth forecasts
Twenty-company competitive profiling and moat analysis
Six-dimension segmentation with detailed growth rates
Semiconductor chip input cost risk modeling
Portfolio margin tier benchmarking analysis framework
Anonymized client RFID rollout case study

Built For The People Who Decide

From boardroom strategy to bench-side execution, this report is read cover-to-cover by leaders shaping the next decade of their industry, turning demand scenarios, market dynamics and valuation benchmarks into decisions.
CXOs/ Presidents/ VPs/ Managers
M&A and Corporate Development
Strategy Teams and R&D Heads
Procurement and Product Directors
Regulatory and Compliance Leaders
Investor Relations and Equity Analysts